EVALUATING POLICE OPERATIONS (1): A PROCESS AND …
59
New South Wales Bureau of Crime Statistics and Research EVALUATING POLICE OPERATIONS (1): A PROCESS AND OUTCOME EVALUATION OF OPERATION VENDAS Craig Jones & Don Weatherburn
Transcript of EVALUATING POLICE OPERATIONS (1): A PROCESS AND …

i
Evaluating Police Operations (1): A Process and Outcome Evaluation of Operation Vendas
New South Wales Bureau of Crime Statistics and Research
EVALUATINGPOLICE OPERATIONS (1):
A PROCESS AND OUTCOMEEVALUATION OF
OPERATION VENDAS
Craig Jones & Don Weatherburn

ii
Evaluating Police Operations (1): A Process and Outcome Evaluation of Operation Vendas
2004
Published by the NSW Bureau of Crime Statistics and Research
Attorney General’s Department
Level 8
St James Centre
111 Elizabeth Street
Sydney
Phone: (02) 9231 9190
Fax: (02) 9231 9187
Email: [email protected]
Website: www.lawlink.nsw.gov.au/bocsar
ISBN 0 7313 2661 X

iii
Evaluating Police Operations (1): A Process and Outcome Evaluation of Operation Vendas
PREFACE
This is the first in a series of evaluations of police operations being undertaken by theNSW Bureau of Crime Statistics and Research, to assist the NSW Police in their efforts todevelop a more evidence-based approach to crime control. The present evaluation soughtto determine whether it was possible to reduce the incidence of break and enter and motorvehicle theft in three patrols by increasing the collection of forensic evidence at crimescenes and devoting more resources to criminal investigation based on this evidence. Inthis initial phase of the research, police were not successful in achieving their intendedoutcomes. It would be a mistake, however, to treat this result as anything but a provisionalfinding. As the report shows, the collection, analysis and use of forensic evidence is anextremely complex process. It is also one that has only recently (and only very rarely)attracted the attention of researchers. It can take years of evaluated trials and research todevelop effective remedies to illness and disease. There is no reason to expect the searchfor effective remedies to crime to be any different. The NSW Police are to be congratulatedfor their courage and determination in subjecting their crime control strategies to thescrutiny of independent research.
Dr Don Weatherburn
Director
March 2004

iv
Evaluating Police Operations (1): A Process and Outcome Evaluation of Operation Vendas
ACKNOWLEDGEMENTS
The following people deserve acknowledgement for their contribution to this research.First and foremost thanks are due to all of the officers from Brisbane Waters, Lake Illawarraand Miranda LACs who gave up their valuable time to take part in the interviews. Theirinsightful discussions provided the glue that held this evaluation together. Special thanksare also due to Karen Frizelle for her patient explanations of standard police proceduresand for her support throughout. The first author of this report would also like to thankKylie Murphy-Fisher for the tour of duty in the Bongo van, Sam Norman for a tour ofseveral crime scenes and instruction on how the SOCO process works, Maryann Dobsonfor explaining how the procedures in her LAC work, Paul Reason for a tour around thePAL premises and an explanation of how that service operates and Ian Waterson for atour of the forensic laboratory. Thanks to Craig Steele from the Forensic Services Groupand Veronica Kearney from the NSW Police Corporate Information Unit for supplying theforensic data, and Derek Goh from the Bureau for supplying the arrest and recorded crimedata. Thanks are also due to Jonathan Nichol for desktop publishing the report. Finally,thanks to those members of NSW Police, and the Forensic Services Group in particular,who provided valuable feedback on earlier drafts of this report.

v
Evaluating Police Operations (1): A Process and Outcome Evaluation of Operation Vendas
CONTENTS
PREFACE ................................................................................................................................................... iii
ACKNOWLEDGEMENTS ..................................................................................................................... iv
LIST OF FIGURES AND TABLES ....................................................................................................... vi
EXECUTIVE SUMMARY ...................................................................................................................... vii
1. INTRODUCTION .............................................................................................................................. 1
2. LACS INVOLVED IN THE OPERATION ..................................................................................... 4Brisbane Waters ............................................................................................................................ 4Lake Illawarra ............................................................................................................................... 4
Miranda .......................................................................................................................................... 5
3. EVALUATION METHODOLOGY ................................................................................................... 6
4. STANDARD OPERATING PROCEDURES BEFORE VENDAS .............................................. 8
Recording a crime ................................................................................................................................ 8
Attending a crime scene .................................................................................................................... 10
Sending forensic evidence for analysis .......................................................................................... 10
Dissemination of forensic identification and allocation of an investigating officer ................11
5. PROPOSED CHANGES TO STANDARD OPERATING PROCEDURES ........................... 12
SOCOs aimed to attend 100 per cent of BES and RSMV crime scenes ..................................... 12
Reducing turnaround times on fingerprint and DNA evidence ................................................ 12
Prioritising investigations, allocating work, and ensuring accountability ............................... 14
Other supporting initiatives ............................................................................................................. 14
Analysis of MO data ................................................................................................................... 14
Stolen Vehicle Leaflets ............................................................................................................... 15
Neigbourhood canvassing forms ............................................................................................ 15
6. RESULTS ............................................................................................................................................. 16
Did crime decrease? ........................................................................................................................... 16
Was there an increase in the number of people arrested and charged? .................................. 19
Why were there no increases in charge rates? ...................................................................... 21
What explains the low rate of identifications? ....................................................................... 24
What explains the lack of change in fingerprint collection rates? ...................................... 26
Was there a decrease in the time taken to arrest and charge suspects? ................................... 28
7. DISCUSSION .................................................................................................................................... 31
8. CONCLUSION .................................................................................................................................. 35
NOTES ...................................................................................................................................................... 36
REFERENCES ......................................................................................................................................... 38
GLOSSARY OF TERMS ....................................................................................................................... 40
APPENDICES .......................................................................................................................................... 42

vi
Evaluating Police Operations (1): A Process and Outcome Evaluation of Operation Vendas
LIST OF FIGURES AND TABLES
Figure 1: Forensic SOPs prior to Operation Vendas ...................................................................... 9
Figure 2: Forensic SOPs during Operation Vendas ...................................................................... 13
Figure 3: Possible Vendas effects on BES and MVT..................................................................... 16
Figure 4: Monthly trends in recorded BES incidents, by LAC,January 2001-January 2003 .............................................................................................. 17
Figure 5: Monthly trends in recorded MVT incidents, by LAC,January 2001-January 2003 .............................................................................................. 18
Figure 6: Monthly charge rates for BES offences, by LAC,December 2001-January 2003 ......................................................................................... 20
Figure 7: Monthly charge rates for MVT offences, by LAC,December 2001-January 2003 ......................................................................................... 20
Figure 8: Identifications made on fingerprints at BES crime scenes per monthas a proportion of all BES incidents recorded, by LAC,December 2001-January 2003 ......................................................................................... 22
Figure 9: Identifications made on fingerprints at RSMV crime scenes per monthas a proportion of all RSMV incidents recorded, by LAC,December 2001-January 2003 ......................................................................................... 23
Figure 10: Useable fingerprints collected from BES crime scenes per monthas a proportion of all BES incidents recorded, by LAC,December 2001-January 2003 ......................................................................................... 24
Figure 11: Useable fingerprints collected from RSMV crime scenes per monthas a proportion of all RSMV incidents recorded, by LAC,December 2001-January 2003 ......................................................................................... 25
Figure 12: Percentage of BES crime scenes attended by SOCOs per month, by LAC,December 2001-January 2003 ......................................................................................... 26
Figure 13: Percentage of RSMV crime scenes attended by SOCOs per month, by LAC,December 2001-January 2003 ......................................................................................... 27
Table 1: Mean number of BES incidents per month before and duringthe operation ..................................................................................................................... 17
Table 2: Estimated slope coefficient and 95% CI for trends in BES incidentsrecorded at the three trial LACs before and during the operation ......................... 18
Table 3: Mean number of MVT incidents per month before and duringthe operation ..................................................................................................................... 19
Table 4: Estimated slope coefficient and 95% CI for trends in MVT incidentsrecorded at the three trial LACs before and during the operation ......................... 19
Table 5: Mean, median, minimum and maximum days between turnaroundof fingerprint and DNA identifications for two of the three trial LACs,July 2002-January 2003 ..................................................................................................... 29

vii
Evaluating Police Operations (1): A Process and Outcome Evaluation of Operation Vendas
EXECUTIVE SUMMARY
From May through July of 1999, senior officers at one NSW Local Area Command (LAC)conducted a relatively small-scale operation whereby police focussed their efforts onforensic evidence in an attempt to increase the rate at which property offenders werearrested. Building on the reputed success of this operation, the NSW Police Service recentlyundertook to extend some of the initiatives carried out under that trial, assess them in abroader geographical area and have them independently evaluated by the NSW Bureauof Crime Statistics and Research.
The aim of the new operation, code-named Vendas, was to reduce the volume of Break,Enter and Steal (BES) and Motor Vehicle Theft (MVT) incidents in three NSW Local AreaCommands. The two mechanisms by which the operation sought to reduce crime were byincreasing the absolute risk of apprehension and by improving the swiftness with whichBES and MVT offenders were apprehended in the trial LACs. The operation employedthree primary strategies to increase the volume and speed of arrests:
1. Evidence gatherers aimed to attend 100 per cent of BES and Recovered StolenMotor Vehicle (RSMV) crime scenes. This was expected to increase the volume offorensic evidence collected from crime scenes, the volume of persons identified onforensic evidence, and the volume of persons arrested;
2. Police in each LAC aimed to reduce the time between the collection of fingerprintand DNA information and dissemination of a forensic identification back to theCommand. This strategy was designed to reduce the time taken to arrest recidivistoffenders; and
3. Police in each LAC also aimed to prioritise the investigation of suspects identifiedon fingerprint and DNA information. The prioritisation of forensic investigationswas designed to increase both the volume and speed of arrests at the trial LACs.
In addition to these primary initiatives, several other strategies were implemented whichmight be expected to increase the risk of apprehension. Police planned to rigorouslyanalyse modus operandi (MO) and pawnbroking data, and to distribute leaflets amongvictims of both BES and RSMV which were designed to improve crime scene preservationand to improve the quality of information collected from the victims of crime.
The present evaluation aimed to assess both the outcome of the operation on arrest andrecorded crime rates and the process of implementing the operation, including an analysisof factors that facilitated or hindered those outcomes. Data were drawn from a number ofsources, including: written materials prepared by NSW Police; field notes taken duringthe course of the operation; in-depth interviews with key informants; and quantitativedata from both the Forensic and Police databases.
Although analyses were hampered by the short intervention period of seven months,there was no indication that the volume of BES or MVT incidents decreased in any of theLACs as a consequence of Vendas. Nor did the analyses reveal any increase in the rate ofarrest for these types of crimes in any of the LACs. The lack of impact on the arrest ratesoccurred primarily because the operation did not increase identification rates by enoughto produce measurable changes in arrest rates. Only one LAC (Brisbane Waters) recordedany increase in identification rates from BES crime scenes and this gradual increase

viii
Evaluating Police Operations (1): A Process and Outcome Evaluation of Operation Vendas
began before Vendas started, indicating that it was either being caused by anticipationeffects, or something external to the initiatives carried out under Vendas. Only one LAC(Lake Illawarra) showed an increase in the offender identification rate at RSMV crimescenes.
The lack of substantial impact on identification rates was caused by the fact that therewere only modest increases in the collection of fingerprints from crime scenes at the trialLACs. Brisbane Waters recorded significant increases in the collection of fingerprintsfrom BES crime scenes and Lake Illawarra recorded an increase from RSMV crime scenes.This was despite the fact that there was a marked increase in attendance rates at RSMVcrime scenes in all three LACs. Similarly, an increase in attendance at BES crime scenesat Lake Illawarra LAC did not translate into increases in fingerprint identification rates.These findings may indicate that there is a point of diminishing return for crime sceneattendance, but only further research will elucidate this issue.
It was not possible to measure the speed at which suspects were arrested due to limitationsin the available data and it is therefore possible that there were reductions in the time toarrest as a result of the operation. All LACs appear to have prioritised the investigationof forensic cases and, while there was little reliable data bearing on the turnaround timefor forensic identifications, the extant data did suggest that there were improvements inthe turnaround times of fingerprint identifications in at least one LAC. Clearly though,if Operation Vendas did serve to increase the speed with which offenders were arrested,this effect was not great enough to reduce the volume of crime in the trial Commands.
These conclusions were reached on the basis of a comparison of what happened over afew months before the introduction of Vendas with what happened over a period ofseveral months after. The limited observation period and the fact that some of the keychanges required as part of Vendas had begun before its formal introduction made it hardto detect Vendas-related changes in operational procedures after the date on which Vendaswas formally implemented. From an experimental point of view, this made any evaluationof the potential value of increasing forensic activity very difficult to judge. The results arediscussed in terms of future improvements in managing and evaluating complex policeoperations such as Vendas, including the importance of: establishing appropriatemeasures to gauge the success or otherwise of an operation; appropriate selection of trialsites; early involvement of evaluators; and documenting a comprehensive project plan toensure that all aspects of the operation are implemented in a timely and efficient manner.

1
Evaluating Police Operations (1): A Process and Outcome Evaluation of Operation Vendas
1. INTRODUCTION
Break, enter and steal (BES) and motor vehicle theft (MVT) constitute two of the mostcommonly reported crimes in New South Wales (NSW). In 2002 these two offence categoriesaccounted for 20 per cent of all non-driving-related incidents recorded by police in NSW(Doak, Fitzgerald & Ramsay 2003). The volume of these incidents has had a correspondingeffect on community attitudes to neighbourhood crime. The most recent NSW Crimeand Safety Survey conducted by the Australian Bureau of Statistics suggested that in2000/2001 about one in three people considered housebreaking to be a problem in theirneighbourhood, while about one in four people considered car theft to be a problem intheir neighbourhood (Australian Bureau of Statistics 2001). Understandably, then, in theinterests of both crime reduction and community perceptions of safety, the identificationand arrest of recidivist BES and MVT offenders is considered to be a key priority for theNSW Police Service.
One of the primary tools used by police services around the world to identify propertytheft offenders is to analyse forensic information left at the crime scene and latentfingerprints have traditionally been the gold standard of forensic analysis. Modernfingerprinting has come a long way since Herschel, Faulds, Galton and Henry beganclassifying fingerprints in the late 19th and early 20th Centuries (e.g. Faulds 1880; Galton1888; 1892). Australia has had a National Automated Fingerprint Identification System(NAFIS) since 1986 which allows automatic matching of latent fingerprints against alarge database of stored fingerprint files. A new NAFIS (known as NAFIS2) wasimplemented in 2001 which contains more than 24 million individual fingerprints,4.8 million palm prints and 180,000 latent prints from unsolved crimes. NAFIS2 hasrecently been complemented by the introduction of ‘LiveScan’ terminals whichelectronically code fingerprints at the charging station using laser technology.This technology provides superior quality prints to the old technology and, because theterminals are linked with NAFIS2, they allow real-time matching of new fingerprintsagainst stored offender files and against latent fingerprints from unsolved crimes.
The effectiveness of the forensic sciences in the identification of criminal offenders(and the elimination of innocent suspects) has undoubtedly been advanced by the recentadvent of DNA profiling. DNA profiling has traditionally been carried out during theinvestigation of individual cases, where both a DNA sample from the crime scene and aDNA sample from a suspect are available for matching. The Commonwealth-fundedagency which manages NAFIS2, known as CrimTrac, now also holds a national DNAdatabase containing profiles of convicted offenders, suspects, and profiles linked tounsolved crime scenes. In NSW the Crimes (Forensic Procedures) Act 2000 allows for thecollection of DNA from volunteers and, under some conditions, involuntary collectionfrom convicted offenders and persons suspected of criminal conduct. While the nationalDNA database is still relatively small, its effectiveness is likely to increase as the numberof unique persons maintained on the database grows.
Forensic identification technology such as NAFIS2 and LiveScan, and forensic techniquessuch as DNA profiling are designed to increase the likelihood and speed with whichoffenders are identified and subsequently charged with an offence. Criminological theorysuggests that increasing the risk of apprehension will have an inverse effect on criminalactivity by deterring or incapacitating potential offenders. Deterrence occurs when

2
Evaluating Police Operations (1): A Process and Outcome Evaluation of Operation Vendas
individuals resist offending through fear of apprehension. There is general agreementamong criminologists that elevating the certainty of apprehension suppresses most typesof crime (e.g. Koper 1995; Logan 1975; Nagin 1998; Nagin & Pogarsky 2003; Paternoster1989; Sampson & Cohen 1988; Waldo & Chiricos 1972). There is also evidence thatincapacitation reduces crime, although its cost-effectiveness as a crime control tool isopen to doubt (e.g. Chan 1995).
One potential way of enhancing deterrent and incapacitation effects is to increase thecollection of fingerprint and DNA trace material from crime scenes. Theoretically at least,increasing the frequency with which forensic information is collected from crime scenesshould result in more people being identified on the basis of that forensic evidence.This increase in identifications should then translate into an increase in arrests andreductions in crime brought about by the incapacitation of current offenders and thedeterrence of potential offenders. Most early US and British research tended to suggestthat the relationship between the collection of physical evidence, identification of suspectsand arrest rates was poor or complicated at best (e.g. Greenwood, Chaiken & Petersilia1977; Horvath & Meesig 1996; Ramsay 1987). However automated databases such asNAFIS2 and sophisticated analysis techniques like DNA profiling, which have onlyrecently been constructed, might be expected to increase the efficiency of the forensicinvestigation process. The recent UK ‘Pathfinder’ project, while indicating that increasingattendance at crime scenes does not necessarily result in crime reduction, has providedmodest support for the notion that increasing attendance rates at crime scenes may increaseidentification rates (Burrows et al. 2002).
The Forensic Services Group of the NSW Police Service have recently increased theirefforts to maximise the collection of physical evidence from the scenes of high volumecrimes such as BES and MVT. Prior to October 2001 all physical evidence gatherers,known as Scene of Crime Officers or SOCOs, were sworn police officers. The ForensicServices Group has now begun training civilian SOCOs to attend the scenes of highvolume crimes such as BES, recovered stolen motor vehicles (RSMV), and steal from motorvehicle. There are currently 98 civilian positions across NSW.1 Because civilian SOCOsdo not have competing policing demands, this system should bring about an increase inforensic examinations at high-volume crime scenes, while also freeing up police time toconcentrate on other policing initiatives.
Significant incapacitation effects might also be gained if the time between attendance at acrime scene by forensic experts and notification of the identity of that offender can bereduced (Blakey 2000). Because there are limited human resources at the laboratorieswhere fingerprint and DNA information is processed, there are sometimes long delays inthe turnaround time for fingerprint and DNA identifications. Intuitively, more rapidturnaround of forensic notifications should result in more rapid apprehension of offendersand reductions in crime brought about by the removal of that offender from the crimeenvironment (Blakey 2000). In addition, classic deterrence theory suggests that increasingthe perceived celerity, or swiftness, of punishment should result in both the offender andother potential offenders being deterred from engaging in criminal acts, although it shouldbe noted that most research to date suggests that swifter punishment has little effect onactual or intended offending behaviour (see Nagin 1998 for a review).
Of course, increasing collection rates and reducing turnaround times for forensic evidencewill not actually reduce crime unless they result in higher rates of suspect identificationand arrest. The investigation of suspects identified on the basis of forensic evidence forcrimes such as BES or MVT has traditionally been limited by the fact that investigative
3
Evaluating Police Operations (1): A Process and Outcome Evaluation of Operation Vendas
resources in most Local Area Commands (LACs) are limited and other investigations areusually accorded a higher priority. Senior NSW Police have recently recognised thatmany LACs allocate their General Duties (GD) police to investigate suspects who havebeen identified on the basis of fingerprint or DNA evidence. Because these officers oftenlack both the time and investigative experience required to follow up these identifications,many cases have remained inactive until the perpetrator has been identified or arrestedon unrelated matters. Failure to proactively investigate forensic cases is likely to have anadverse effect on crime because recidivist offenders will continue to commit crime untilthey are caught by the police. The problem of unutilised forensic evidence is not uniqueto the NSW Police Service. A recent review of the forensic sciences undertaken by theHome Office in London acknowledged that fingerprint and DNA identifications oftendisappear into “a black hole and are not acted upon” (Blakey 2000, page 31).
Given the increased forensic capability offered by civilian SOCOs, and the potentialincapacitation and deterrent benefits offered by increasing the likelihood and speed ofarrest based on forensic identifications, the NSW Police concluded that a more focusedeffort on the collection, analysis and investigation of forensic evidence from volume crimescenes was required. From May through July of 1999, senior officers at the BankstownLAC conducted a relatively small-scale operation, code-named Newburgh, targeting BESand MVT offenders. By increasing crime scene examinations and prioritising theintelligence gathering and investigation of forensic identifications, Operation Newburghwas credited with having identified and charged a large number of recidivist theftoffenders. However because no formal process or outcome evaluation was conducted,the apparent successes of Operation Newburgh were not independently confirmed.
The NSW Police recently undertook to extend some of the initiatives carried out underOperation Newburgh, trial them in a broader geographical area, and have themindependently evaluated by the NSW Bureau of Crime Statistics and Research. ThreeNSW LACs were chosen to trial the operation: Brisbane Waters, Lake Illawarra andMiranda. A six month trial operation, code-named Operation Vendas, was officiallylaunched by the Deputy Commissioner of Police (Support) on July 1, 2002. This initialtrial period was later extended and the operation was officially brought to a close onJanuary 31, 2003. The main aim of the operation was stipulated in the Operation VendasUser Information Pack2, and was conveyed by the Mission statement:
“To aim for 100 per cent attendance to Break and Enter (attempted and actual)and Recovered Stolen Motor Vehicle crime scenes by SOCOs, this will leadto the identification, investigation, and arrest of the recidivist offenders inthe Miranda, Brisbane Waters and Lake Illawarra Commands.”
In other words, the NSW Police aimed to attend every BES and RSMV incident at the threetrial Commands, thereby increasing the collection of fingerprint and DNA evidence fromthese crime scenes. The implicit assumption was that there would be a correspondingincrease in persons identified on the basis of forensic evidence and in the number ofoffenders arrested and, consequently, a reduction in crime. In addition to increasing thevolume of arrests, however, the operation aimed to increase the speed of arrest byprioritising the rapid return of fingerprint and DNA identifications to the LAC who would,in turn, provide a prioritised investigative response to those identifications. Severalsupporting initiatives were introduced, including the systematic analysis of intelligenceinformation, the distribution of leaflets providing information on how to preserve thecrime scene and the distribution of ‘neighbourhood canvassing forms’. These initiativesare described in more detail later in this report.

4
Evaluating Police Operations (1): A Process and Outcome Evaluation of Operation Vendas
2. LACS INVOLVED IN THE OPERATION
As noted earlier, three LACs were invited by the Deputy Commissioner (Support) to takepart in the trial: Brisbane Waters, Lake Illawarra and Miranda. Brisbane Waters and LakeIllawarra were chosen because they have traditionally had high rates of BES and MVT,relative to the rest of NSW. Miranda has somewhat lower rates of these crimes, and oneinformant suggested that Miranda was chosen as a trial site because it provided a usefulmetropolitan comparison to the other two rural areas. The following descriptions of thethree trial LACs were obtained from the Analysis of the Crime Environment (ACE) reportsroutinely compiled by each LACs’ intelligence office.
Brisbane Waters
Brisbane Waters LAC is a rural Command located 80km north of Sydney on the CentralCoast of NSW. The LAC is very large, covering an area of more than 1000km2, and isbounded by the Hawkesbury River in the south, the Judge Dowling Ranges to the west,Ourimbah in the north and the Tasman Sea in the east. At the 2001 Census this LAC hadan estimated population of 154,587 people, most of whom live on the coastal area of theCommand. The population of the Brisbane Waters LAC largely consists of permanentCentral Coast residents who commute to Sydney for work, although a number of peoplewho reside in Sydney have holiday homes on the Central Coast. Retail, light industry,service and tourism drive the local economy.
The main city, Gosford, has a number of licensed premises, shopping centres, and majorbus and rail terminals which affect population flow to the area. A large number of propertycrimes are committed in Gosford and the other main towns in the LAC (Woy Woy andTerrigal), but the Peninsula area of the Command also has a high density of propertycrimes. According to the Brisbane Waters ACE report, this is because the Peninsula areahas a greater number of aged and low-income people in comparison to the rest of the LAC.
Brisbane Waters has reasonably high levels of both BES and MVT offences compared tothe rest of NSW. The Gosford Local Government Area (LGA), whose boundaries arealigned with those of the Brisbane Waters LAC, rated 38th of 154 LGAs in terms of BES(dwelling), 64th for BES (non-dwelling) and 37th for MVT in 2001 (NSW Bureau of CrimeStatistics and Research).3 The LAC is serviced by police stations in Gosford, Terrigal andWoy Woy. As at June 2002, there were 220 authorised police officers in the BrisbaneWaters LAC, one for every 703 people living in the LAC.
Lake Illawarra
Lake Illawarra is located approximately 100km south of Sydney on the south-east coastof NSW. It covers an area of approximately 770km2 and is bounded by the ShoalhavenLAC to the south, the Illawarra escarpment to the west, Wollongong LAC to the north andthe Tasman Sea to the east. Lake Illawarra includes three LGAs: Kiama, Shellharbourand part of Wollongong. At the 2001 Census the official population count was 144,160people, most of whom live in the main suburbs of Albion Park, Dapto, Kiama, Port Kembla,Unanderra/Berkeley, Warilla and Warrawong. The region has a high immigrantpopulation, initially attracted to the area by employment at the BHP Steelworks at PortKembla. The Port Kembla Steelworks have gradually cut back on staffing levels,contributing to unemployment in the area. The LAC has a high number of people livingin Department of Housing accommodation and a high level of youth unemployment.

5
Evaluating Police Operations (1): A Process and Outcome Evaluation of Operation Vendas
Motor vehicle theft has been a major crime problem in the Lake Illawarra LAC. In 2001 theWollongong and Shellharbour LGAs were ranked 4 th and 5 th highest in terms of MVT outof 154 LGAs in NSW. These two LGAs also have high rates of BES incidents, ranking 8 th
and 25th for BES – dwelling and 15th and 58th for BES – non-dwelling incidents of the154 LGAs (NSW Bureau of Crime Statistics and Research).4 Lake Illawarra is serviced bypolice stations in Albion Park, Berkeley, Dapto, Gerringong, Kiama, Port Kembla,Unanderra and Warilla. As at January 2003 there were 207 authorised police officers inthe Command, or one police officer for every 696 people living in the LAC.
Miranda
Miranda LAC is a metropolitan Command located approximately 30km south of Sydneyand is much smaller than the other two trial LACs, covering an area of less than 80km2.Miranda is bounded by the Port Hacking River to the south, the Princes Highway to thewest, Botany Bay to the north and the Tasman sea to the east. At the 2001 Census,this LAC had an estimated population of 77,870, almost half the population of each ofthe other two trial LACs. Miranda tends to have a more transient and seasonal populationas more people come to the area during summer months to visit Cronulla, which is theonly metropolitan beach suburb in Sydney with a train station within walking distanceof the beach.
Miranda LAC is made up of 13 suburbs, all falling under the umbrella of the SutherlandShire Council. It contains four railway stations, all on the Sydney Metropolitan electronicnetwork, and several main arterial roads, making access to and from the area very easy.The Miranda ACE report suggests that the mid- to high-income residents living in suburbssuch as Cronulla may entice criminal activity in the area.
Compared to the other LACs, Miranda has a moderate to low rate of BES and a moderaterate of MVT. In 2001 the entire Sutherland Shire LGA had a rate of BES (dwelling) thatranked 66th out of 154 LGAs in NSW, a BES (non-dwelling) rate that ranked 4th lowestand a MVT rate that ranked 42nd out of 154 LGAs. The LAC is serviced by police stationsin both Cronulla and Miranda. In 2002 there were 133 authorised police in the MirandaLAC, giving a police-to-resident ratio of one police officer for every 585 residents.

6
Evaluating Police Operations (1): A Process and Outcome Evaluation of Operation Vendas
3. EVALUATION METHODOLOGY
As noted earlier, the NSW Bureau of Crime Statistics and Research was invited toindependently evaluate the outcomes of Operation Vendas. The evaluation aimed toprovide both a process and an outcome evaluation of the operation, incorporating fourmain components:
(1) A description of the pre-Vendas procedures for collecting and analysing forensicinformation and the procedures for disseminating suspect identifications;
(2) A description of the changes proposed under Vendas;
(3) An analysis of whether those changes successfully increased the speed or volumeof arrests and/or reduced crime; and
(4) A discussion of the process factors that either contributed to, or hindered,the outcomes of the operation.
Because the information required to describe the pre-Vendas procedures (component (1)above) had not been formally documented, information was gleaned from informalpersonal communication with officers involved in the operation, from field-notes collectedthroughout the course of the operation, and from in-depth semi-structured interviews(and, in one case only, a focus group) carried out three months after the operation hadcommenced. One interviewer conducted all of these in-depth interviews and the CrimeManagers, Crime Coordinators, at least one intelligence analyst, at least one SOCO and atleast one person representing investigations were interviewed from each of the threeLACs. All Brisbane Waters interviews were conducted at Gosford Police Station, Mirandainterviews at Miranda Police Station and Lake Illawarra interviews at Dapto and WarillaPolice Stations. Interviews were conducted in a quiet room at the local police station andwere tape-recorded and transcribed at the completion of interviewing. Before each interviewbegan, the interviewer fully described the nature of the project, what would be discussed,the participants’ right to withdraw from the research at any stage and without anydisadvantage, that the interview would be used for research purposes only and thatrespondents would remain anonymous throughout. Respondents were sent a copy oftheir transcribed interview and were encouraged to provide feedback about the contentof that transcription, or any issues that may have arisen out of the interview process.No officers wished to make any amendments or withdraw their comments from theresearch.
The Vendas procedures were detailed in a written document prepared by NSW Policeand this was distributed to all groups involved in the operation on the day it was launched.This pack, entitled the Operation Vendas User Information Pack, also documented theresponsibilities of each member of the operation. This booklet was used to describe thechanges proposed under Vendas (component (2) above).
The outcome measures (component (3) above) were assessed by extracting and analysingtrends in recorded crime and arrest rates from the NSW Police COPS database.The means by which these data were analysed are described later in this report and willnot be described in any detail here.
Finally, the degree to which the procedural changes were implemented under Vendas(component (4) above) was assessed by drawing together a number of data sources,

7
Evaluating Police Operations (1): A Process and Outcome Evaluation of Operation Vendas
including: quantitative data from the forensic database bearing on the volume of crimescenes attended by SOCOs, the volume of physical evidence collected and the number ofsuspects identified on the basis of that evidence; data collated manually at each LACbearing on the time taken to disseminate forensic identifications; informal communicationwith officers involved; detailed field-notes; and the in-depth interviews with key personneldescribed above.

8
Evaluating Police Operations (1): A Process and Outcome Evaluation of Operation Vendas
4. STANDARD OPERATING PROCEDURESBEFORE VENDAS
Before detailing the changes made to the police standard operating procedures (SOPs),it is necessary to describe how and when forensic information is usually collected froma BES or RSMV crime scene, and how this information is dealt with once collected.Figure 1 shows this process diagrammatically and identifies the points (labelled A throughD, and marked with a ‘**’) at which Operation Vendas aimed to improve these procedures.Each of these points were identified by senior members of the NSW Police Service as areasfor improvement and the specific changes proposed under Vendas to address theseweaknesses are described in the ensuing section (Section 5).
Recording a crime
Police can receive a report of a BES or located stolen motor vehicle either through thePolice Assistance Line (PAL) or at the police station. PAL is a 24-hour toll-free call centrewhose role is to take reports of crimes where there are no traumatised victims and wherethe victim does not want or need the police to attend the crime scene. Most BES reports arereceived through PAL (about 65% in the first month of Operation Vendas) and mostlocated stolen motor vehicles are reported to the station (about 99% in the first month ofthe operation).
Whenever a report is taken an Event report is created on the Computerised OperationalPolicing System (COPS) database. This Event report holds all of the relevant informationabout the incident being reported. PAL operators and police are encouraged to record asmuch information as possible at the Event creation stage because this information can becrucial for the investigation of the crime being reported and for the investigation of othercrimes committed by the same offender. PAL and police officers are strongly encouragedto record modus operandi (MO) information. MO refers to the offender’s ‘method ofoperation’, including point of entry to the premises, types of goods stolen, and activitiesundertaken while inside the property. There is a mandatory field for MO information butit can also be recorded in the Event narrative (the text field for general comments) or inintelligence reports put on the COPS system by police, SOCOs and intelligence analyststhemselves. MO information can be used to link separate incidents that are likely to havebeen committed by the same offender. Historically, however, the way in which MOinformation is recorded and extracted from COPS has been a problem for the NSW PoliceService. Some police officers view the Event creation process as very laborious and oftenput in the minimum amount of information required to complete the Event, both in thespecial MO screen and in the Event narratives, making it very difficult for analysts toretrieve any meaningful information from the Events themselves.
The lack of MO information available from the COPS Events is an area of weakness thathas been identified by police. In fact, NSW Police have identified many points along thechain of standard police practice where better communication, recording and systemimprovements could enhance the collection of MO information, and these are all markedwith a ‘**’ in Figure 1.

9
Evaluating Police Operations (1): A Process and Outcome Evaluation of Operation Vendas
Figure 1: Forensic SOPs prior to Operation Vendas
** represents points where the collection of MO data could be improvedA, B, C, D represent other points at which the operation aimed to improve procedures
B
A
C
D
RSMV(police station)**
BES(PAL or police station)**
Police attend** Police do not attend**
Event appears onstation summary
Forensicevidence unlikely
SOCO requested No furtherforensic investigation
No further forensicinvestigation
SOCOdoesn’t attend**SOCO attends**
DNA Fingerprints No forensic evidence
Division of AnalyticalLaboratories
Westmead forensiclab for processing
No furtherforensic action
Matched againstCrimTrac database
Sent to fingerprintID section
Match sentback to LAC
Investigator nominated(usually GD whoattended scene)
Circulated as wanted
Arrested if comeupon by Police Not arrested
Case suspended -no further action
Offender may becharged later if arrested
on unrelated charge
Event appears onstation summary
Forensicevidence likely
No match
Print stays onfingerprint database
Print stays onDNA database Match Match
No match

10
Evaluating Police Operations (1): A Process and Outcome Evaluation of Operation Vendas
Attending a crime scene
When a victim reports a crime to either PAL or the police station, they jointly decide withthe PAL operator or police officer whether and when a police officer should attend thecrime scene. For insurance reasons, every time police receive a report of a located stolenmotor vehicle a police officer is dispatched to the scene to ‘recover’ that vehicle. Police donot have to attend the scene of a BES, and they often do not attend unless the victimspecifically requests them to or they feel that they are likely to find physical evidence suchas blood or fingerprints at the crime scene. It is apparent from Figure 1 that SOCOs do notusually attend the scene without police attending first. If SOCOs do not attend, then anypotential physical evidence is lost forever.
In terms of forensic procedures, the fact that police (and therefore SOCOs) do not attendall BES crime scenes has been identified by police as a weakness in their SOPs (labelled‘A’ in Figure 1). The decision about the availability of physical evidence is a joint onebetween the PAL operator/police officer and the victim. Neither party is forensicallyexperienced and therefore neither party is strongly qualified to make such a decision.Not only is physical evidence potentially lost from every crime scene not attended bypolice, but potential intelligence or MO information is also lost. While a lot of MOinformation can be recorded at the time of Event creation, a lot is not recorded, includinginformation that the victim might not recognise but which might have been noticed by apolice officer had one been present. In addition to the loss of MO data, the potential togather any information from the victim’s neighbours is also lost when police do notattend a crime scene.
If a police officer does attend the crime scene they make an assessment about whether thecrime scene is likely to yield forensic information. If they feel that there is not likely to beany forensic evidence, they do not request SOCO attendance and no further forensicinvestigation takes place.5 If GDs do feel that there is a high likelihood of findingfingerprints or DNA trace material at a crime scene they request SOCO attendance.SOCOs then attend, record MO data in their notebooks, and conduct a forensicexamination, most often by taking fingerprints and looking for objects that might containDNA material. If there are no signs of evidence, no further forensic analysis takes place.The fact that GD police officers make assessments about whether SOCOs should attend acrime is a second area of the SOPs that has been identified as a weakness (labelled ‘B’ inFigure 1). GD police officers are usually not forensically trained and forensic scientistsfeel that they should not be left to make assessments on their own about whether a crimescene is likely to yield forensic evidence (e.g. Tilley & Ford 1996).
Sending forensic evidence for analysis
If trace material that could contain a DNA profile is found at the crime scene it is forwardedto the Division of Analytical Laboratories (DAL) for analysis. If a fingerprint is found atthe crime scene it is photographed and the roll of film is sent to the Westmead ForensicLaboratory (based in Western Sydney) where all fingerprint photographs are developed.Once developed, the photographs are sent to the fingerprint identification section thatservices the LAC where the crime was committed. The photographs are then scannedinto a computer by fingerprint experts and matched against the images stored on NAFIS2.The time lag between collection of fingerprints and DNA at the crime scene, anddissemination of a positive identification back to the LAC is the third weakness identifiedin the SOPs (labelled ‘C’ in Figure 1). Although no objective data were available to estimate

11
Evaluating Police Operations (1): A Process and Outcome Evaluation of Operation Vendas
the time taken to disseminate DNA identifications prior to Vendas, front-line policesuggested that identifications resulting from high volume crimes like BES and MVT cantake months or, in some cases, years before they are sent back to the LAC. Officers alsosuggested that fingerprint identifications resulting from high volume crimes can takemany weeks or months before they are distributed to LACs.
Two factors contribute to the delay in DNA identifications. First, SOCOs sometimesstockpile their samples before sending them to DAL. Second, because DAL have finiteresources they have to prioritise their workload and sensibly accord serious crime amuch higher priority than high volume crimes like BES and MVT. There are three sourcesof delay in turnaround times for fingerprint analyses. First, SOCOs often wait until theyhave completed a number of rolls of film before sending them to the lab for processing.The second source of delay comes from the time it takes to courier the 35mm films toWestmead, have them developed and send them on to the fingerprint identification sectionto be matched against NAFIS2. The time taken to develop these films varies, but staff atWestmead maintain that films are usually processed and dispatched within 24 hours(Personal Communication, Paul Singh, Westmead Forensic Laboratory, 20/6/02).The third source of delay comes from the time taken to match the fingerprints againstNAFIS2 and disseminate that identification back to the LAC.
Dissemination of forensic identificationand allocation of an investigating officer
Once a suspect has been identified on the basis of DNA or fingerprint evidence,the information, including the suspect’s name, address and CNI number6 is sent back tothe LAC. Each LAC has its own procedures specifying how this notification is to bedisseminated to relevant staff. Most often, however, it is sent back to the Crime Manageror Crime Coordinator, who heads up the Crime Management Unit. This officer thenallocates an investigator to follow up on the notification. As mentioned earlier, becauseLACs have limited specialist investigators they cannot always afford to give these lessserious crimes a high priority and the allocated investigator is therefore often the GDofficer who attended the original crime scene. GDs usually do not have the time or theinvestigative experience to conduct these investigations as efficiently as a specialistinvestigator. As a result, it has become commonplace for these files to be neglected andnot followed up. The identified suspect is usually circulated as ‘wanted’ and no furtherinvestigative action is taken. If they are arrested and charged for an offence later, it is oftenbecause they come to the attention of the police on unrelated matters. If the suspect is notcaught committing other criminal acts, and does not come to the attention of police,the case is suspended and no further action is taken. The low priority given to forensiccases is the fourth weakness of the SOPs and is labelled ‘D’ in Figure 1.

12
Evaluating Police Operations (1): A Process and Outcome Evaluation of Operation Vendas
5. PROPOSED CHANGES TO STANDARDOPERATING PROCEDURES
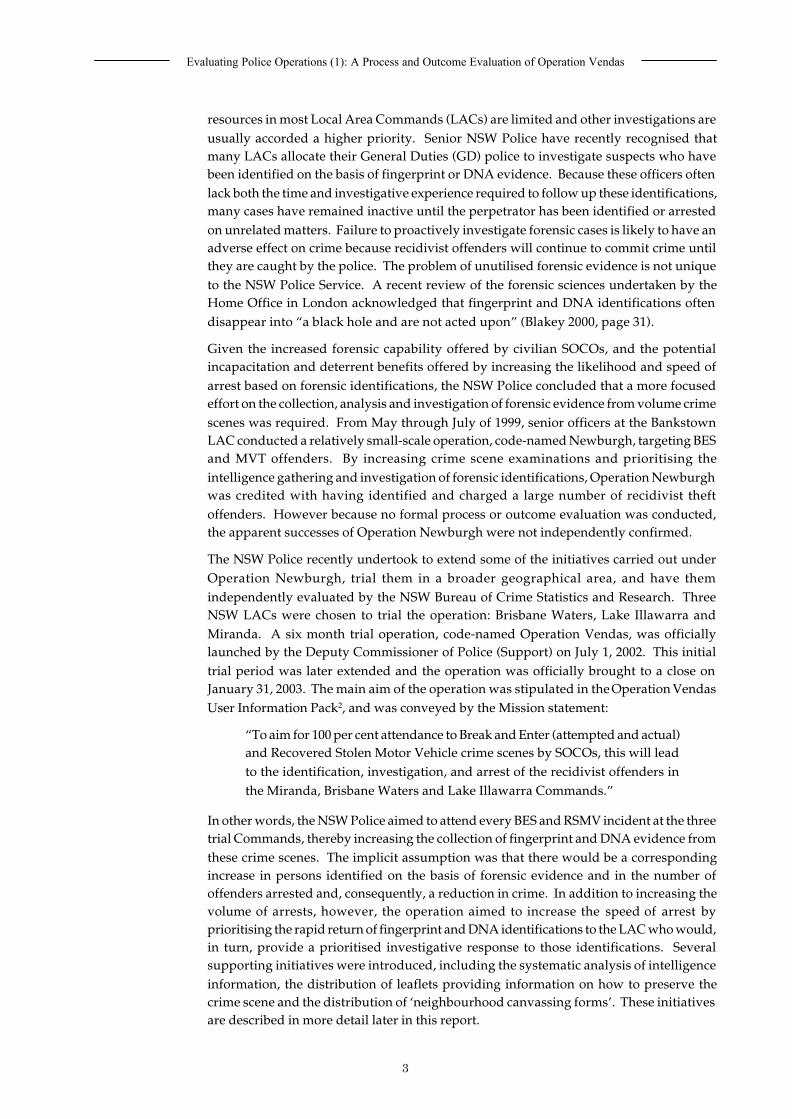
Over a series of monthly meetings, the Deputy Commissioner (Support), in collaborationwith all of the groups involved in the operation, identified several procedural changes toaddress the weaknesses outlined above. These procedural changes were detailed in theOperation Vendas User Information Pack, which was distributed to representatives of allgroups and to the evaluators at the launch of the operation. The complete SOPs for theoperation are presented diagrammatically in Figure 2.
SOCOs aimed to attend 100 per centof BES and RSMV crime scenes
Weaknesses ‘A’ and ‘B’ in Figure 1 were addressed by encouraging SOCOs to attend 100per cent of BES7 and RSMV crime scenes. This increase in attendance was intended toincrease the amount of forensic evidence collected, the number of suspects identified onthe basis of that evidence and the number of people arrested. Procedural changes weremade in both the LACs involved and in relation to PAL to help SOCOs achieve thisobjective. Under Vendas procedures, the COPS system was changed so that the PALoperator would see a unique series of pop-up screens giving them instructions aboutwhat to say to victims of BES crimes in the Operation Vendas LACs. The operators wereinstructed to record the Event on COPS as usual, but to inform the victim that a SOCOwould contact them to arrange a time to attend the crime scene. The operators were alsoinstructed to give the victim advice about how to preserve the scene to enhance the qualityof the scene assessment conducted by the SOCO. Changes were also made to theprocedures for disseminating forensic jobs to SOCOs in order to facilitate their ability toattend 100 per cent of BES and RSMV crime scenes. Irrespective of whether the victimwanted SOCOs to attend the scene, a job was automatically created requesting SOCOattendance every time a new Vendas Event was created on COPS. This job wasdisseminated to the SOCOs’ workstations so that they could see all of the new jobs thathad appeared overnight. Each morning SOCOs would contact these victims to organisea suitable time to attend. This method of job dissemination allowed SOCOs to beautomatically notified of all BES jobs in their LAC, effectively taking fingerprintassessments out of the hands of GD police officers.
Because PAL only receives one per cent of located stolen motor vehicle reports and becauseall located vehicles must be attended by police to be recovered, PAL operators wereprompted not to take these reports but to direct the caller to the LAC instead. Aboutone-third of BES incidents are also reported to the police station, so the COPS system hadto be altered to allow automatic dissemination of jobs to the SOCOs’ workstations whenthese incidents were reported to the LAC. Again, this was designed to help rectifyweaknesses ‘A’ and ‘B’ in Figure 1.
Reducing turnaround times on fingerprint and DNA evidence
All Fingerprint Identification Sections undertook to return the results of fingerprintexaminations to the LACs within 24-48 hours. The DNA laboratory (DAL) undertook toreturn DNA identifications within seven days. To reduce the time between collection offingerprint evidence and dissemination of a suspect identification (weakness ‘C’ in Figure1), the Forensic Services Group planned for SOCOs at the three trial LACs to use digital
13
Evaluating Police Operations (1): A Process and Outcome Evaluation of Operation Vendas
Figure 2: Forensic SOPs during Operation Vendas
Leave Stolen VehicleLeaflet if necessary
Automatic FSIMSdissemination to
SOCO workstation
SOCO rings victim
SOCO records MO
No furtherforensic investigation
Intell analyst looks atMO and pawnbroking No further
forensic investigation
FingerprintsDNA
Record MO &complete intelligence
reports on COPS
Victim doesn’t wantSOCO to attend
BES (reported to PAL orpolice stat ion) RSMV
(reported to police station)
No evidence
Digital photo/ lift taken(+35mm for 1st month)
Digital photo/lift matchedimmediately (24-48 hour
turnaround) +35mmdeveloped & matched
Notificationsent back to LA C
Intelligence package
Team LeaderInvestigations
Experiencedinvestigator nominated
Prioritised response &Team Leader ensuresaccountable for cases
Arrested Not arrested
Case suspended
Offender maybe charged la ter
Neigbourhood canvassingform for BES incidents
SOCO at tends
MO information enteredon COPS Event report
DAL (7 day turnaround)
No match
Print stays onfingerprint database
Match
Match
Police attend RSMV& BES(if needed)
& record MO
No match
Print stays onDNA database

14
Evaluating Police Operations (1): A Process and Outcome Evaluation of Operation Vendas
cameras to photograph fingerprints at crime scenes. SOCOs were to be equipped withlaptop computers so that digital images could be burned to compact disc immediatelyafter they were taken. The image on the compact disc could then be transferredelectronically and matched against NAFIS2, eliminating the time-consuming processesof sending films by courier and having them processed at the Westmead lab. Howeverthese plans were altered prior to the start of Vendas. Due mainly to the costs involvedwith implementing the digital technology (Personal Communication, Phil Flogel, FSG,19/12/02), SOCOs at Brisbane Waters LAC were instructed to use a ‘lifting’ medium8 tocollect fingerprints for the first three months of the operation, after which they were toconsider transferring to the digital technology. SOCOs from the other two LACs receivedthe digital cameras and were provided with a two-day training session at the beginningof the operation to give them a working understanding of the digital cameras.
Brisbane Waters and Lake Illawarra had access to their own fingerprint identificationsections so they were able to bring the compact disc or ‘lift’ back and have it matchedimmediately. Miranda were instructed to send their digital images to the fingerprintidentification section at Parramatta via the police electronic memo system. All SOCOswere still required to take the conventional 35mm photographs as back-up for the durationof the operation but were encouraged to send the film for processing at the end of each dayto expedite the process.
Prioritising investigations, allocating work,and ensuring accountability
In order to address weakness ‘D’ in police standard operating procedures, OperationVendas also aimed to increase the investigative priority given to forensic identificationsby LACs. To achieve this, each LAC was asked to allocate a core group of investigatorsto the investigation of fingerprint and DNA identifications. These investigatorswere encouraged by Crime Managers to arrest and charge suspects as soon as possibleand within 48 hours of receiving the suspect identification wherever practicable.The operational procedures also called for more effective coordination of cases by CrimeManagers and Team Leaders of Investigations and an effort by Team Leaders and CrimeManagers to ensure that nominated investigators took personal responsibility for thecases that had been allocated to them.
Other supporting initiatives
Analysis of MO dataIn order to improve the recording of MO information at the point when a BES or RSMVincident was reported to police, the Event creation process was streamlined to ease theburden on General Duties police and PAL operators. It was hoped that this would increasethe volume of MO data entered on the COPS system to allow more meaningful analysis byintelligence officers. SOCOs and general duties police were also encouraged to formallyand informally communicate MO information to intelligence analysts and investigators.In turn, intelligence analysts were directed to use all available MO information and tomonitor the pawnbroker database9 to search for possible links between suspects andcrime scenes and between separate crime scenes. They were required to provide a ‘timelyand useful’ intelligence package on identified suspects within 48 hours of receiving thesuspect identification which was to include relevant information on known associates,pawnbroking history and modus operandi history.

15
Evaluating Police Operations (1): A Process and Outcome Evaluation of Operation Vendas
Stolen Vehicle LeafletsIf, for any reason, a SOCO could not attend the scene of a RSMV immediately, GD policewere instructed to leave a ‘stolen vehicle leaflet’ with the vehicle advising the victim thata SOCO will examine the vehicle. The leaflet gave advice and precautions about how topreserve the crime scene (Appendix A).
Neighbourhood canvassing formsSOCOs were also instructed to provide victims with ‘neighbourhood canvassing forms’and prepaid envelopes when they attended a BES crime scene. These canvassing forms(Appendix B) were designed to capture any details of an offender that might becomeavailable subsequent to SOCOs attending the crime scene.

16
Evaluating Police Operations (1): A Process and Outcome Evaluation of Operation Vendas
6. RESULTS
Did crime decrease?
The ultimate aim of Operation Vendas was to reduce the number of BES and MVT incidentsin the three LACs involved in the trial. Operation Vendas could have had three possibleeffects on crime trends. It could have reduced the level of crime in the target patrols(Figure 3(a)), it could have altered the trend or slope of any pre-existing downward trend(Figure 3(b)) or it could have altered both the level and slope of the crime data (Figure 3(c)).The analysis of the impact on crime trends was complicated by two considerations.Firstly, rates of BES and MVT had been falling across the State (and in the target LACs)for 18 months prior to the introduction of Vendas (Doak, Fitzgerald & Ramsay 2003).Secondly, the follow-up period over which changes to BES and MVT could be assessedwas very short (i.e. seven months). The second of these considerations meant that it wasimpossible to apply interrupted time series analysis to the crime data to check whetherthere had been a change in the level, slope or both following the start of the operation(see Figure 3). The general strategy adopted, therefore, was to test for any change in thelevel of the series using a Mann-Whitney U test and, if the result suggested a significantchange, then to test for a change in the slope of the series using linear regression.This method of analysis would detect changes such as those depicted in Figures 3(b) and3(c). If the linear regression test failed to show evidence of a change in slope it wasconcluded that the drop in crime was simply part of the overall downward trend observedin the remainder of the State, except where visual inspection of the trend showed a cleardrop in level but no change in trend (as in Fig 3(a)).
Figure 3: Possible Vendas effects on BES and MVT
Number of BES / MVT incidents
Month
Intervention InterventionIntervention
(c)Change in level & slope
(b)Change in slope
(a)Change in level
Data were obtained from the COPS database bearing on the number of BES and MVTincidents recorded at the three Vendas LACs from January 1, 2001 to January 31, 2003.This provided 18 months of baseline data and seven months of post-intervention data.While 18 months of baseline data is presented in Figures 4 and 5, statistical analyses onlycompared the seven months immediately prior to the operation with the seven-monthintervention period. Nonparametric Mann-Whitney U tests were initially conducted to

17
Evaluating Police Operations (1): A Process and Outcome Evaluation of Operation Vendas
determine whether there was any decrease in the level of recorded criminal incidentsin the seven months following the start of the trial relative to the seven months beforeit began.
As already noted, to test whether there was any significant change in the slope of thecrime trends following the start of the operation, linear regression was used to calculatethe slope coefficients and associated 95 per cent confidence intervals (CI) for each LACbefore and after the operation. If the CI for the trend before the intervention overlaps withthe CI after the intervention, we cannot conclude that the slope of the series changedfollowing the start of the operation. Because there were only seven months ofpost-intervention data, the variability inherent in the time series was very large, as wasthe breadth of the 95 per cent CI. The analyses therefore lacked power to detect smalleffects. A longer pre-intervention time period of 18 months was also analysed but did notalter the interpretation of the analyses reported below.
Figure 4 displays the number of BES10 incidents recorded at the three trial LACs fromJanuary 2001 to January 2003 while Table 1 displays the mean number of BES incidentsrecorded per month at each LAC in the seven months before and the seven months duringthe operation. The Mann-Whitney U test indicated that the means displayed in Table 1were lower at Brisbane Waters (z=-3.0, p<0.01) and at Miranda (z=-2.7, p<0.01) duringthe operation relative to before. There was no significant change in the mean number of
Table 1: Mean number of BES incidents per monthbefore and during the operation
Mean number Mean numberof incidents of incidents
per month before per month during
Brisbane Waters BES 248 168
Lake Illawarra BES 283 270Miranda BES 106 86
Jan01
Figure 4: Monthly trends in recorded BES incidents,by LAC, January 2001 - January 2003
Number of incidents
Month
450Brisbane Waters Lake I llawarra
400
350
300
250
200
150
100
50
0Feb01
Apr01
Mar01
May01
Jun01
Jul01
Sep01
Aug01
Oct01
Nov01
Dec01
Jan02
Feb02
Apr02
Mar02
May02
Jun02
Jul02
Sep02
Aug02
Oct02
Nov02
Dec02
Jan03
Miranda

18
Evaluating Police Operations (1): A Process and Outcome Evaluation of Operation Vendas
incidents recorded at Lake Illawarra LAC following the start of the operation (z=-0.4,p=0.71). Although Table 1 shows lower rates of BES in Brisbane Waters and Mirandaafter the introduction of Vendas, a visual inspection of Figure 4 clearly indicates thatthere was no decrease in the level of BES immediately following the start of the operationat any of the three LACs nor any evidence of a change to the slope of the crime trendfollowing the start of the operation. Instead an overall downward trend in BES is evidentthroughout the observation period.
Table 2: Estimated slope coefficient and 95% CI for trends in BES incidentsrecorded at the three trial LACs before and during the operation
Slope coefficient Slope coefficientbefore (95% CI) during (95% CI)
Brisbane Waters BES -10.8 -2.9(-29.9 to 8.4) (-15.7 to 10.0)
Lake Illawarra BES 5.0 -17.0(-14.1 to 24.2) (-32.7 to -1.3)
Miranda BES -2.3 -1.7(-7.6 to 3.0) (-7.1 to 3.8)
Table 2 shows the estimated slope coefficients and associated CIs for the BES trendsbefore and after the operation started at each LAC. In each case the confidence intervalsfor the slope coefficient after the operation began overlap with the confidence intervalsfor the slope of the series before the operation began. There was no evidence, therefore,to indicate that the rate of BES fell more sharply after Vendas started.
Figure 5 displays the number of MVT incidents recorded at the three trial LACs fromJanuary 2001 to January 2003 and Table 3 shows the mean number of incidents recordedper month before the operation began and the mean number recorded during Vendas.The Mann-Whitney tests indicated that, of the means displayed in Table 3, only thedifference apparent at Brisbane Waters LAC was statistically significant (z=-2.2, p<0.05).
Jan01
Figure 5: Monthly trends in recorded MVT incidents,by LAC, January 2001 - January 2003
Number of incidents
Month
300
250
200
150
100
50
0Feb01
Apr01
Mar01
May01
Jun01
Jul01
Sep01
Aug01
Oct01
Nov01
Dec01
Jan02
Feb02
Apr02
Mar02
May02
Jun02
Jul02
Sep02
Aug02
Oct02
Nov02
Dec02
Jan03
Brisbane Waters
Lake I llawarra
Miranda

19
Evaluating Police Operations (1): A Process and Outcome Evaluation of Operation Vendas
There was no significant difference at Lake Illawarra (z=-0.8, p=0.46) or Miranda LACs(z=-1.3, p=0.21). Visual inspection of Figure 5 does not indicate that there was any decreasein the level of MVT immediately following the start of the operation at any of the threeLACs, nor does there appear to have been any change to the slope of the crime trendfollowing the start of the operation. As with BES, a downward trend in MVT is evidentacross the observation period.
Table 3: Mean number of MVT incidents per monthbefore and during the operation
Mean number Mean numberof incidents of incidents
per month before per month after
Brisbane Waters MVT 76 50
Lake Illawarra MVT 112 98
Miranda MVT 46 39
Table 4: Estimated slope coefficient and 95% CI for trends in MVT incidentsrecorded at the three trial LACs before and during the operation
Slope coefficient Slope coefficientbefore (95% CI) during (95% CI)
Brisbane Waters MVT -8.8 1.8(-16.0 to -1.6) (-2.9 to 6.4)
Lake Illawarra MVT -4.1 -3.8(-11.7 to 3.5) (-18.8 to 11.3)
Miranda MVT -3.7 -0.0(-7.4 to -0.1) (-2.1 to 2.0)
Table 4 shows the estimated slope coefficients and associated CIs for the MVT trendsbefore and during the operation at each LAC. The results confirm the impression foundfrom Figure 5. The confidence intervals for the slope coefficients overlap indicating thatthere was no evidence for a change in slope at any of the LACs after the operation started.
Neither BES nor MVT trends, then, provide any reason to believe that the introduction ofVendas reduced crime. Given this lack of effect it is pertinent to ask why there were nodecreases in recorded crime. The operation was designed to reduce crime in one (or both)of two ways: by increasing the number of people arrested for these types of crime or byreducing the time between committing the offence and arresting an offender. The analysisnow turns to the question of whether these goals were achieved.
Was there an increase in the numberof people arrested and charged?
Data were obtained from the COPS database bearing on the number of people proceededagainst for BES and MVT for the three Vendas LACs and for the rest of NSW. There are anumber of ways in which suspects can be proceeded against by police. They could becharged, given a Court Attendance Notice, Field Court Attendance Notice, a summons,
20
Evaluating Police Operations (1): A Process and Outcome Evaluation of Operation Vendas
a youth conference, cautioned under the Young Offenders Act (1997), warned, or given aninfringement notice. Only suspects who were charged are presented in this report althoughthe trends for all ‘other’ proceedings grouped together were similar to the trends forcharges.11 On the basis of the available data it is impossible to isolate charges that havebeen brought against someone entirely as a result of Operation Vendas. However, we canidentify whether there has been an increase in the overall level of BES and MVT chargeslaid following the start of the operation. Note, however, that if the number of chargesremained constant after Vendas began, but the level of crime decreased, the risk ofapprehension would be higher. Similarly, if the level of crime stayed constant but thenumber of charges increased, the likelihood of apprehension would be higher. We thereforeexamine the charge data for BES and MVT offences as a proportion of the number of theseoffences recorded in each LAC.12
Figure 6: Monthly charge rates for BES offences,by LAC, December 2001 - January 2003
Charge rates (%)
Month
12Brisbane Waters
Lake Illawarra10
8
6
2
0Dec01
Jan02
Feb02
Apr02
Mar02
May02
Jun02
Jul02
Sep02
Aug02
Oct02
Nov02
Dec02
Jan03
Miranda
4
Figure 7: Monthly charge rates for MVT offences,by LAC, December 2001 - January 2003
Charge rates (%)
Month
25Brisbane Waters
Lake Illawarra20
15
10
5
0Dec01
Jan02
Feb02
Apr02
Mar02
May02
Jun02
Jul02
Sep02
Aug02
Oct02
Nov02
Dec02
Jan03
Miranda

21
Evaluating Police Operations (1): A Process and Outcome Evaluation of Operation Vendas
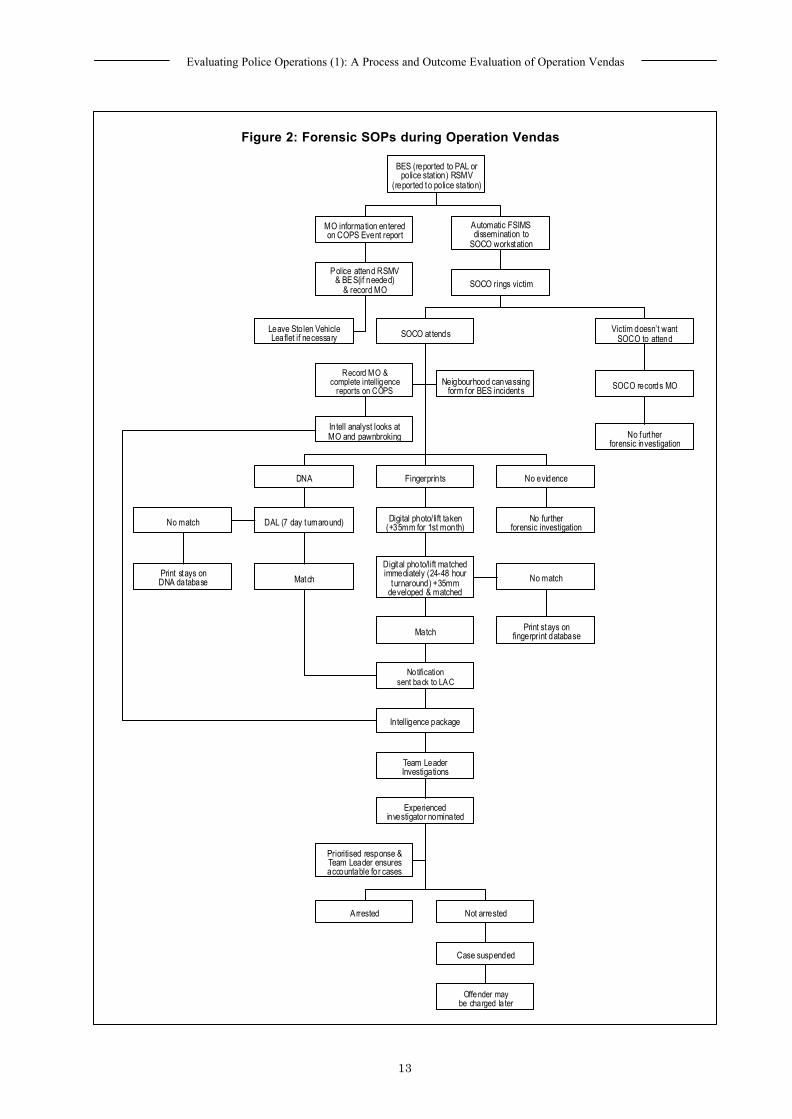
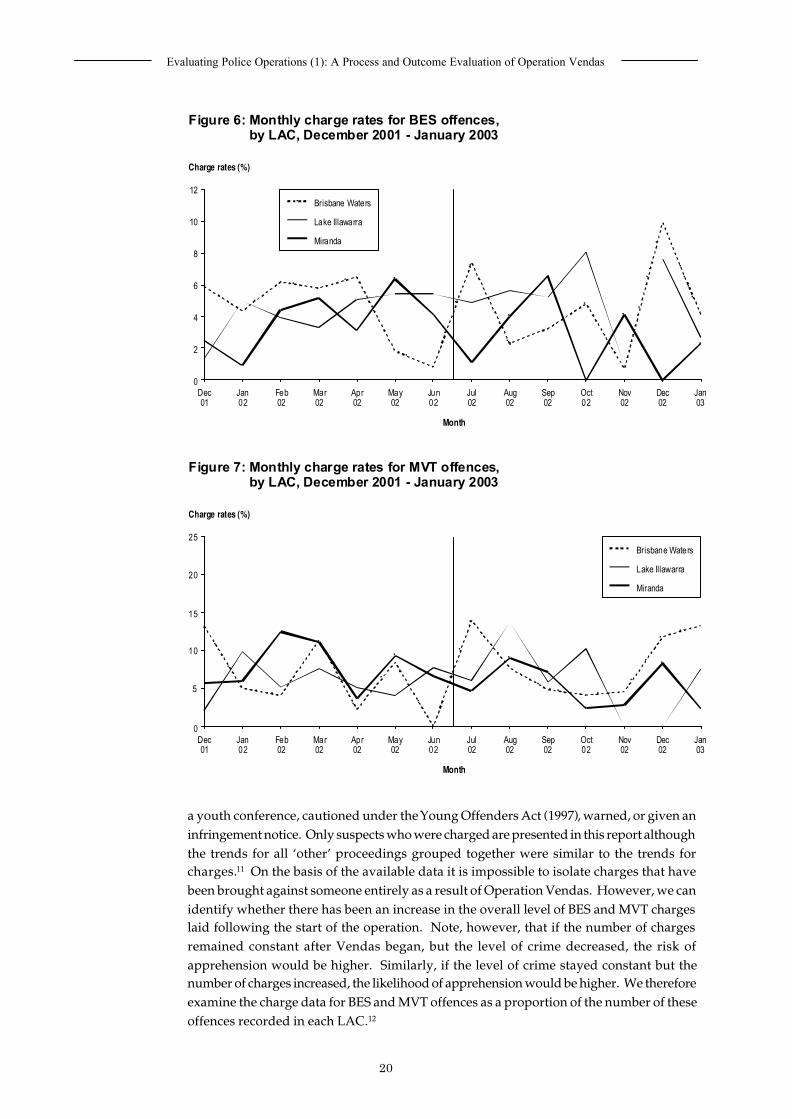
Figure 6 shows the charge rates for BES incidents at the three LACs from December 2001to January 2003 while Figure 7 shows the charge rates for MVT over this period.13
There does not appear to have been any increase in either the BES or MVT charge ratesfollowing the start of the operation. In fact, the proportions appear to be low and variableover the entire observation period. Mann-Whitney tests confirmed that there was noincrease in the rate of BES charges following the start of the operation at any of the threeLACs (Brisbane Waters z=-0.2, p=0.90; Lake Illawarra z=-0.7, p=0.54; Miranda z=-1.2,p=0.26). Mann-Whitney tests also confirmed that there was no increase in MVT chargerates at any of the LACs following the start of the operation (Brisbane Waters z=-1.1,p=0.32; Lake Illawarra z=-0.3, p=0.81; Miranda z=-1.5, p=0.17). Trends in the absolutenumber of charges were also analysed and the results are presented in Appendices C andD. As with the proportions presented above, there were no significant increases in theabsolute number of charges for either BES or MVT offences at any of the three LACs.14
Why were there no increases in charge rates?The absence of an increase in charge rates might have resulted from the failure to:
(1) Rigorously evaluate MO and pawnbroking data (and provide victims withstolen vehicle leaflets and neighbourhood canvassing forms)
(2) Prioritise the investigation of forensic identifications; or
(3) Increase the rate at which suspects were identified on forensic evidence.
The qualitative interviews shed considerable light on the degree to which features (1) and(2) were implemented. In relation to (1), some respondents commented that, while theywere more focused on MO during the first three months of the operation, systems forinputting MO data were not adequate to get any meaningful information out of the COPSdatabase. Most respondents suggested that GD police officers and PAL operators, despitethe streamlined Event creation screens, often failed to input sufficient information at thetime the Event was created to meaningfully analyse MO data:
“…the way the police put in the information…obviously because they don’thave the time to spend any more time and effort on it, they just do the closestmatch rather than going that extra step to put in a bit of extra information sothat we can use it.” (Intelligence)
“We want more information in our COPS narratives … but General Dutypeople, they just do what they’ve got to do and then move onto the next one,and they don’t look behind the scenes”. (Crime Management)
The means by which MO data was extracted were also thought to be very laborious andtime consuming. None of the respondents reported focusing much on the pawnbrokerdatabase, on the other hand, because they felt the utility of that data source was not asgood as it once was. Furthermore, there was no indication that stolen vehicle leaflets andneighbourhood canvassing forms were used regularly. Any or all of these problems mayhave made it harder to increase the rate of arrest for BES and MVT.
Prioritising the investigation of forensic identifications (feature (2) above) was implementedquite well in two of the three Commands. Both Miranda and Brisbane Waters LACsallocated the forensic files to qualified teams of investigating officers who specialised inthe investigation of theft matters and both LACs suggested that they had moved awayfrom the passive charging of suspects only when they came to police notice on other

22
Evaluating Police Operations (1): A Process and Outcome Evaluation of Operation Vendas
matters. Lake Illawarra LAC, however, allocated the Vendas files to their Target ActionGroup who, as a rule, had fairly limited investigative experience. Crime Managementinformants at Lake Illawarra said that they did not have the investigative resources toallocate more senior detectives to Vendas and this lack of more skilled human resourcesmay have made it harder to increase the arrest rate in that Command. In addition to this,Lake Illawarra investigators felt that they did not have enough time to prepare briefs ofevidence for court cases. According to some informants, half way through the interventionperiod Lake Illawarra investigators were forced to change their focus from rapid arrestand charging of suspects to preparing good quality briefs of evidence against arrestees inorder to improve the court outcome:
“… I’ve basically said ‘stop’ until we can get rid of what we’ve got on ourback. Back-capture, clear it up and then we can start again. Meanwhile thetime-lag is pushing out and, ah, so that it’s slipping exponentially…youcan only do so much.” (Investigations)
To assess the extent to which the LACs increased the identification of suspects (feature(3), above), data were extracted from the FSIMS database bearing on the volume of peopleidentified on the basis of fingerprint information.15 The forensic database used to capturethis information only commenced operation in October 2001, and data from that monthmay not be reliable due to the changeover from the old recording system to the new FSIMSsystem. To be consistent with analyses of recorded crime and charge rates, then,the starting date for the observational period was taken from December 2001 and endedat the close of the operation in January 2003. Given the nature of the data and the shortobservation period, identification rates were low and variable, which made it very difficultto interpret the trends over time. Any conclusions reached on the basis of these datashould therefore be regarded as tentative.
Figure 8 displays the identification16 rate (i.e. identifications as a proportion of recordedincidents) from BES incidents at the three trial LACs from December 2001 to January2003. Mann-Whitney tests indicate that the mean identification rate during the operation
Figure 8: Identifications made on fingerprints at BES crime scenesper month as a proportion of all BES incidents recorded,by LAC, December 2001 - January 2003
Percentage
Month
7Brisbane Waters
Lake Illawarra
0Dec01
Jan02
Feb02
Apr02
Mar02
May02
Jun02
Jul02
Sep02
Aug02
Oct02
Nov02
Dec02
Jan03
Miranda
6
5
4
3
2
1

23
Evaluating Police Operations (1): A Process and Outcome Evaluation of Operation Vendas
was higher than the mean before the operation for Brisbane Waters LAC (z=-2.5, p<0.05)but not for Lake Illawarra (z=-1.3, p=0.21) or Miranda (z=-0.3, p=0.81). Subsequentanalyses revealed that the increase in identification rate at Brisbane Waters was relatedmore to the fall in crime at this Command than to an increase in identifications(see Appendix E). The small increase from a mean of 3 to 4.6 identifications per month atthis Command was not statistically significant (z=-1.6, p=0.13). Figure 8, moreover,suggests that the increase in identification rate at Brisbane Waters appears to have begunfrom a low baseline around February 2002 and steadily increased over the observationperiod, before falling away after September 2002. The increase was relatively small andwould not have been substantial enough to bring about a large scale increase in arrests.The likelihood of identifying a suspect following the onset of Vendas only increased from1.2 persons per 100 incidents to 2.9 persons per 100 incidents at these types of crimes.
Figure 9 shows the identification rate from RSMV incidents at the three trial LACs fromDecember 2001 to January 2003.17 Mann-Whitney tests indicated that Lake Illawarrawas the only LAC to show any significant increase in identification rate during theoperation, from a mean of 1.4 identifications per 100 RSMV crime scenes to a mean of 6.3per cent (z=-3.1, p<0.01). The increase in identification rates at Lake Illawarra was causedboth by an increase in identifications (from a mean of 1.6 per month to 6.7 per month[z=-2.4, p<0.05]) and a small (and not statistically significant) fall in RSMV incidents atthat Command (Appendix F). Again, however, the relative increase in identification ratesat Lake Illawarra was probably not large enough to bring about any significant increasein arrests. It should be remembered, after all, that some people who have been identifiedon forensic evidence will not be able to be located and charged. Some forensicidentifications, moreover, will never proceed to the investigative stage because the evidenceis insufficient to warrant a charge. Given that approximately 100 RSMV incidents wererecorded at this LAC during each month of the operation and the increase in identificationswas only five for every 100 crime scenes, the increase in arrests could not have exceededfive per month.
Percentage
Month
25Brisbane Waters
Lake Illawarra20
15
10
5
0Dec01
Jan02
Feb02
Apr02
Mar02
May02
Jun02
Jul02
Sep02
Aug02
Oct02
Nov02
Dec02
Jan03
Miranda
Figure 9: Identifications made on fingerprints at RSMV crime scenesper month as a proportion of all RSMV incidents recorded,by LAC, December 2001 - January 2003

24
Evaluating Police Operations (1): A Process and Outcome Evaluation of Operation Vendas
In summary, then, while Brisbane Waters and Miranda LACs prioritised the investigationof forensic cases, the failure to implement the supporting measures and the lack of anysizable increase in identifications worked against the possibility of any major change inarrest and recorded crime rates. Although there was an increase in identifications atRSMV crime scenes for Lake Illawarra LAC, they appear to have lacked the investigativeresources required to focus on arresting and charging identified suspects. Howevereven if they had had the resources required to fully investigate forensic cases, thecorresponding increase in arrest rates was always likely to be small. The maximumincrease in charges could not have been larger than the extra five identifications theyrecorded each month.
What explains the low rate of identifications?To investigate this question, data were drawn from the FSIMS database bearing on thevolume of fingerprint evidence collected from crime scenes. If there were no large increasesin the collection of fingerprints from BES and RSMV crime scenes, then an increase inidentifications would not be expected. Again, rates are presented in the text and rawnumbers are presented in Appendices G and H. As with the earlier trends we examined,the short baseline and intervention periods render the data variable and difficult tointerpret.
Figure 10 shows the rate at which fingerprints were gathered from BES crime scenes.There was a significant increase in the mean fingerprint collection rate at BrisbaneWaters LAC (z=-3.1, p<0.01) but not at Lake Illawarra (z=-1.3, p=0.21) or at Miranda(z=-0.6, p=0.62). The rate of fingerprint collections increased from an average of nine per100 crime scenes before the operation to 20 per 100 crime scenes during the operation atBrisbane Waters LAC. Subsequent analyses revealed that the increase at Brisbane Waterswas a result of both an increase in the collection of fingerprints and a reduction of BESincidents in the LAC (Appendix G). Inspection of Figure 10 reveals that the increase atBrisbane Waters had begun prior to the start of the operation, indicating that something
Percentage
Month
25
20
15
10
5
0Dec01
Jan02
Feb02
Apr02
Mar02
May02
Jun02
Jul02
Sep02
Aug02
Oct02
Nov02
Dec02
Jan03
Figure 10: Useable fingerprints collected from BES crime scenesper month as a proportion of all BES incidents recorded,by LAC, December 2001 - January 2003
30Brisbane Waters Lake Illawarra Miranda
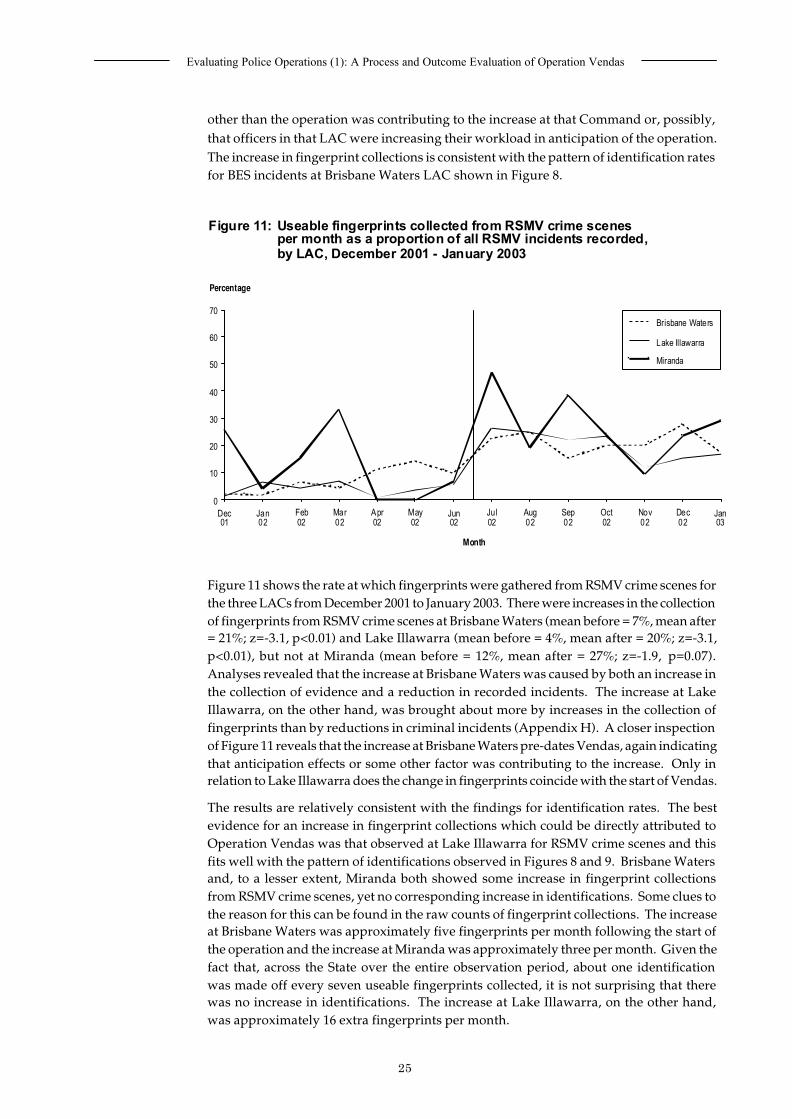
25
Evaluating Police Operations (1): A Process and Outcome Evaluation of Operation Vendas
other than the operation was contributing to the increase at that Command or, possibly,that officers in that LAC were increasing their workload in anticipation of the operation.The increase in fingerprint collections is consistent with the pattern of identification ratesfor BES incidents at Brisbane Waters LAC shown in Figure 8.
Figure 11 shows the rate at which fingerprints were gathered from RSMV crime scenes forthe three LACs from December 2001 to January 2003. There were increases in the collectionof fingerprints from RSMV crime scenes at Brisbane Waters (mean before = 7%, mean after= 21%; z=-3.1, p<0.01) and Lake Illawarra (mean before = 4%, mean after = 20%; z=-3.1,p<0.01), but not at Miranda (mean before = 12%, mean after = 27%; z=-1.9, p=0.07).Analyses revealed that the increase at Brisbane Waters was caused by both an increase inthe collection of evidence and a reduction in recorded incidents. The increase at LakeIllawarra, on the other hand, was brought about more by increases in the collection offingerprints than by reductions in criminal incidents (Appendix H). A closer inspectionof Figure 11 reveals that the increase at Brisbane Waters pre-dates Vendas, again indicatingthat anticipation effects or some other factor was contributing to the increase. Only inrelation to Lake Illawarra does the change in fingerprints coincide with the start of Vendas.
The results are relatively consistent with the findings for identification rates. The bestevidence for an increase in fingerprint collections which could be directly attributed toOperation Vendas was that observed at Lake Illawarra for RSMV crime scenes and thisfits well with the pattern of identifications observed in Figures 8 and 9. Brisbane Watersand, to a lesser extent, Miranda both showed some increase in fingerprint collectionsfrom RSMV crime scenes, yet no corresponding increase in identifications. Some clues tothe reason for this can be found in the raw counts of fingerprint collections. The increaseat Brisbane Waters was approximately five fingerprints per month following the start ofthe operation and the increase at Miranda was approximately three per month. Given thefact that, across the State over the entire observation period, about one identificationwas made off every seven useable fingerprints collected, it is not surprising that therewas no increase in identifications. The increase at Lake Illawarra, on the other hand,was approximately 16 extra fingerprints per month.
Percentage
Month
60
50
40
30
0Dec01
Jan02
Feb02
Apr02
Mar02
May02
Jun02
Jul02
Sep02
Aug02
Oct02
Nov02
Dec02
Jan03
Figure 11: Useable fingerprints collected from RSMV crime scenesper month as a proportion of all RSMV incidents recorded,by LAC, December 2001 - January 2003
70Brisbane Waters
Lake Illawarra
Miranda
20
10

26
Evaluating Police Operations (1): A Process and Outcome Evaluation of Operation Vendas
What explains the lack of change in fingerprint collection rates?Data bearing on the attendance rates of SOCOs were obtained from the FSIMS database toinvestigate this question. Mann-Whitney tests suggested that mean attendance rateswere higher during the seven months of the operation than the prior seven months at allLACs for both BES and RSMV crime scenes (all p-values <0.05). The increases at BrisbaneWaters were due both to an actual increase in the number of crime scenes attended and asignificant decrease in crime for both BES and RSMV incidents, while the increase at LakeIllawarra was due mainly to a large increase in attendance at crime scenes (see AppendicesI and J). The increase in attendance rates at BES crime scenes for Miranda LAC wasclearly a result of the lower level of BES incidents because attendances actually fell slightlyduring the operation. The small increase in attendance at RSMV crime scenes at MirandaLAC was due more to a small but not statistically significant increase in crime scenesattended.
Figure 12 displays the percentage of BES crime scenes attended18 by SOCOs in the threecommands from December 2001 to January 2003. The trend for BES shown in Figure 12suggests that there was a progressive increase in attendance rates over time at all threeLACs. The trend for Lake Illawarra suggests that the level of attendance jumpedsignificantly immediately after the operation began. The reasons for the general increasein attendance at BES crime scenes over time are not immediately apparent. Clearly,though, given that most of the increase across each LAC occurred before the operationbegan, they can not be attributed to the start of the operation itself.
Figure 13 displays the percentage of RSMV crime scenes attended by SOCOs over thistime period. It is quite clear from the large increase in the level of attendance at RSMVcrime scenes evident across all three trial LACs that the increase was a direct result of theoperation. Note that the increase in attendance at Miranda LAC after Vendas was smallerfor RSMV because the baseline rates were much higher in that Command. Note also thatthe lack of any increase in attendance at BES scenes is probably also because of the highbaseline rates of attendance rates at these scenes in that LAC. This is not surprising.The 2001 ACE report for Miranda LAC indicated that SOCOs were already consideringattending 100 per cent of high volume crime scenes.
Percentage
Month
80
70
40
30
0Dec01
Jan02
Feb02
Apr02
Mar02
May02
Jun02
Jul02
Sep02
Aug02
Oct02
Nov02
Dec02
Jan03
Figure 12: Percentage of BES crime scenes attended by SOCOs per month,by LAC, December 2001 - January 2003
100
90
60
50
20
10
Brisbane Waters
Lake Illawarra
Miranda

27
Evaluating Police Operations (1): A Process and Outcome Evaluation of Operation Vendas
The final point to note from Figures 12 and 13 is that none of the LACs achieved theirtarget of attendance at 100 per cent of BES and RSMV crime scenes . All three LACsattended between 60 and 80 per cent for BES crime scenes, and between 50 and 70 per centfor RSMV incidents. It is unclear whether reaching the target of 100 per cent attendancewould have resulted in more positive results in terms of fingerprint collection rates andidentification rates. Most respondents were of the opinion that 100 per cent attendancewas never a realistic expectation because victims often don’t want them to attend andbecause some crime scenes are unlikely to yield forensic evidence. Attending these scenes,they argued, would potentially detract from their ability to attend more ‘worthwhile’scenes. Some informants commented that SOCOs should be focusing on attending crimescenes based on the likely quality of the evidence, rather than increasing the quantity ofevidence gathered:
We consider every break and enter. That is, we read the Event and then wedecide whether we will attend that Event. If it’s an Event such as…‘theperson walked…through an unlocked back door, and took my wallet off thetable and exited’ we ring the victim and we do not attend because there is nochance that you are going to get fingerprints there…Under Vendas we stilldo not attend every break and enter.” (SOCO)
It is also important to point out that the attendance rates were limited, at least in part,by the fact that SOCOs were not being informed about every BES and RSMV during theoperation. It was quite clear that forensic jobs were not being generated for all BES andRSMV incidents reported to the station, particularly during the early months of theoperation:
“…probably the first six weeks, we received very few requests for stolenmotor vehicles because the General Duties officers weren’t aware that thiswas what the aim of the operation was…I think it was still at their discretionwhether we attended.” (SOCO)
“I went to the station summary the other day. There were three break andenters and only two jobs had been generated…something’s gone amiss andit coincides with a whole bunch of probationary constables who’ve started.”(SOCO)
Brisbane Waters
Lake Illawarra
Miranda
Percentage
Month
80
70
40
30
0Dec01
Jan02
Feb02
Apr02
Mar02
May02
Jun02
Jul02
Sep02
Aug02
Oct02
Nov02
Dec02
Jan03
Figure 13: Percentage of RSMV crime scenes per month attended by SOCOs,by LAC, December 2001 - January 2003
100
90
60
50
20
10

28
Evaluating Police Operations (1): A Process and Outcome Evaluation of Operation Vendas
Subsequent discussions revealed that a programming anomaly and the fact that someofficers were unaware of the operation aims contributed to the failure to achieve 100 percent SOCO attendance at crime scenes. It appears that an indeterminate number ofFSIMS jobs were not automatically created when BES and RSMV incidents were reportedto PAL or the station (Personal Communication, Colin Quirk, Business and TechnologyServices, 14/4/03). There was also some indication from informants that GDs may havebeen changing the status of FSIMS requests for SOCO attendance to ‘cancelled’ in situationswhere they felt the likelihood of retrieving physical evidence was low. In such instances,the job would not appear on SOCOs’ workstations and they would not attend that scene(Personal Communication, Colin Quirk, Business and Technology Services, 14/4/03).The actual extent to which this was occurring throughout the operation is unclear, but itdoes appear to have caused some problems. Some interviewees felt that the nature of theoperation had not been communicated very well to the GDs at the outset:
“The problem is the GDs not being well informed. I think if you’re going tohave an operation in a Local Area Command, the whole Local Area Commandneeds to be more aware of it because the GDs didn’t even know what Vendaswas coming into the second month of the operation and I had a few victimsget quite hostile because they actually requested fingerprint attendance andwere told ‘no’ we wouldn’t [attend].” (SOCO)
Several methods were incorporated to try and communicate information to GDs, includingelectronic memos and communication of the aims of the operation at shift briefings.According to many officers, however, this communication was insufficient to draw theattention of GDs until the operation had been running for some time. It should beemphasised that these concerns about a lack of communication were raised at the start ofthe operation. Most of them appear to have been allayed by the end of the third month ofthe trial period.
Was there a decrease in the timetaken to arrest and charge suspects?
Although one of the aims of Vendas was to reduce the time between arrest and charge forpersons suspected of having committed a BES or MVT offence, the Bureau did not haveaccess to data which could be used reliably to assess such a change. The Bureau doesmaintain a database on court appearances that provides information on the time betweenoffence and first court appearance. However, changes to the Bail Act (1978) which cameinto force on the day Vendas began, would have had the effect of reducing the time betweenoffence and first court appearance even if there had been no change in the time betweenoffence and arrest. Under the Bail Amendment (Repeat Offenders) Act 2002 thepresumption of bail was removed for repeat offenders in some circumstances. Wherepolice refuse bail to someone charged with an offence, they are obliged to bring the personbefore a court as soon as practicable. Thus any increase in bail refusal rates will tend toreduce the average time between arrest and first court appearance.
Although it proved impossible to establish whether the time between offence and arrestdeclined, it was possible, for two LACs19, to measure the mean, median, minimum andmaximum number of days between the date of an offence and the date of dissemination ofa forensic identification after the introduction of Vendas. The relevant data for two of thestudy LACs are presented in Table 520.

29
Evaluating Police Operations (1): A Process and Outcome Evaluation of Operation Vendas
Table 5: Mean, median, minimum and maximum days between turnaround of fingerprintand DNA identifications for two of the three trial LACs, July 2002 – January 2003
LAC and evidence type
Brisbane Waters Lake Illawarra + Miranda
FP DNA FP DNA FP DNA
Number of identifications 63 6 - - 20 5
Mean lag (days) 15.8 42.2 - - 9 39.6
Median lag (days) 12 34 - - 2 37
Minimum lag (days) <1 27 - - <1 24
Maximum lag (days) 88 64 - - 46 71
% within planned timeframe* 10 0 - - 55 0
* This was calculated by counting the number of occasions where an identification was disseminated within 2 or fewer days for fingerprintsand within seven days for DNA.
+ Data was not available for Lake Illawarra LAC.
Three conclusions can be drawn from Table 5. First, Miranda almost certainly achieveda quicker turnaround on fingerprint identifications during Operation Vendas than theyhad prior to the operation. We know this because more than half of Miranda’sidentifications were disseminated within the planned 48-hour timeframe. Because of thelags involved in having film developed, sent to the fingerprint identification section,matched and sent back to the LAC this would have been impossible had they been using35mm film rather than the digital technology. A 48-hour turnaround time would havebeen possible at Brisbane Waters prior to the start of the operation because SOCOs hadaccess to their own fingerprint identification section and were taking lifts prior to thestart of the operation. Whether, or how often, Brisbane Waters SOCOs were actuallyachieving this turnaround prior to the operation is not clear.
The second conclusion that can be drawn from Table 5 is that DNA identifications weretaking much longer than the 7-day turnaround guaranteed prior to the start of the operation.DNA links were still taking a median of 34 days to be returned to Brisbane Waters and37 days at Miranda. Those spoken to as part of this study were unanimously of the viewthat this was caused by a lack of resources at the DNA laboratory (DAL):
“I certainly don’t think [DAL have] got the resources to cope with this sort ofthing. I think that the individual…chemist or biologist that work atDAL…certainly aren’t in a position where they’re going to say ‘listen, I’lljust turf that murder job that I’ve been working on to see if this ten dollarbreak and enter comes off’” (Crime Management)
The third important conclusion is that Brisbane Waters’ identifications were clearlyreturned much more slowly than were those at Miranda. Notifications took a median of12 days to be sent back to Brisbane Waters; six times longer than the median for Miranda.SOCOs interviewed at the Brisbane Waters LAC claimed that they had reduced theturnaround time on fingerprint identifications but argued that their effectiveness in thisregard was constrained by lack of access to digital cameras:
“…if you’re talking about quick turnaround times you’ve got to go digital.There’s no question in my mind about that.” (SOCO)

30
Evaluating Police Operations (1): A Process and Outcome Evaluation of Operation Vendas
SOCOs at Brisbane Waters were supposed to receive digital cameras three months intothe operation if they proved to be successful in the other LACs. In the meantime, as theyhad done prior to the start of the operation, SOCOs performed ‘lifts’ of fingerprint imageswhere possible so that they could be matched against NAFIS2. Lifts cannot, however,be taken from every surface because they can smudge. One SOCO reported that onlyabout 20 per cent of lifts were suitable for scanning. As a result, SOCOs at BrisbaneWaters LAC often failed to take lifts:
“As far as the lifts are concerned, I’ll collect them if I feel that…I’m going toget a good lift, a decent lift. If it’s something like a timber surface, I know thatI’m going to get back here and just waste [the fingerprint experts’] time,because I know it’s not going to be suitable for scanning…” (SOCO)
Another source of delay for Brisbane Waters LAC stemmed from their failure to mark thecourier bags containing film to be processed with the word ‘Vendas’ before sending themto the laboratory for development. As a result, the lab failed to prioritise the processing ofthese films. For reasons that are not entirely clear, they were also only sending their filmstwo times each week after this.

31
Evaluating Police Operations (1): A Process and Outcome Evaluation of Operation Vendas
7. DISCUSSION
No evidence emerges from this study which would support the claim that Vendas produceda reduction in BES or MVT, above and beyond that which occurred in LACs in the rest ofthe State. It does not follow from this conclusion, however, that high volume offencescannot be reduced by increasing the quantity and quality of forensic evidence collectedat crime scenes by police, or that the NSW Police were unwise to try and reduce highvolume crime through improvements in the collection and analysis of forensic evidence.As the process evaluation component of this report reveals, many of the intermediateoutcomes required to achieve a reduction in crime either did not occur or were occurringbefore the advent of Vendas. This makes it hard to draw definite conclusions aboutthe value of further investment in forensic evidence collection and analysis in reducinghigh volume crime.
There were significant increases in attendance rates at RSMV crime scenes at each of theLACs following the start of Operation Vendas. However the only LAC that showed anyevidence of an increase in attendance rates at BES crime scenes as a result of Vendas wasLake Illawarra LAC. There was no significant increase in the collection rate of fingerprintevidence at any LAC, other than at Brisbane Waters (for BES and RSMV) and Lake Illawarra(for RSMV). However, the increase in collection rates for RSMV at Brisbane Waters beganbefore the introduction of Vendas. The only increases in identification rates that occurredwere at Brisbane Waters (for BES) and Lake Illawarra (for RSMV). And while the increasein identification rates at Lake Illawarra LAC was quite substantial (i.e. five additionalidentifications per month), this did not result in any increase in the rate at which offenderswere arrested and charged with BES or MVT offences. In fact none of the LACs thatparticipated in Vendas succeeded in increasing either the absolute number of arrests orthe ratio of arrests to crimes for BES and MVT. It is possible that there were increases inthe speed of arrest, particularly at the two LACs with digital cameras. If suspects werebeing arrested and incapacitated more quickly, however, the improvements were certainlyinsufficient to produce a reduction in crime.
These conclusions are based, as they must be, on a comparison of what happened over afew months prior to the introduction of Vendas, with what happened over a period ofseveral months after. The limited observation period and the fact that some of the keychanges required as part of Vendas had begun before its formal introduction made it hardto detect Vendas-related changes in operational procedures after the date on which Vendaswas formally implemented. There is no way of knowing whether the changes whichoccurred were anticipatory, or whether they reflected general improvements in thecollection and analysis of forensic evidence across the State. From an experimental pointof view, however, Vendas was not implemented in a way that would have maximised thechances of observing beneficial effects, had they occurred. This is not said in criticism ofthe officers involved in Vendas, all of whom were thoroughly committed to the project.Vendas was a complex set of initiatives involving more than 500 officers from three LocalArea Commands and a large number of civilian staff from Forensic Services and otherareas of the NSW Police. In any complex operation, it is inevitable that some part of theplan will either fail to be implemented or will end up being implemented in ways otherthan intended. Whenever this happens it will always be difficult to tell whether thefailure to achieve desired outcomes stemmed from a defect in the strategy or flaws in itsimplementation.

32
Evaluating Police Operations (1): A Process and Outcome Evaluation of Operation Vendas
Should strategies like Vendas continue to be pursued? There is no doubt that the chancesof evidence contamination are much lower when the crime is responded to rapidly bypolice (e.g. Greenwood, Chaiken & Petersilia 1977; Peterson, Mihajlovic & Gilliland 1984).On the other hand, some studies have found that higher rates of attendance at crimescenes, even where they lead on to higher fingerprint collection rates, do not necessarilylead to an increase in offender identification rates (Greenwood, Chaiken & Petersilia1977; Tilley & Ford 1996). More recently, the UK Pathfinder project found an 8.9 per centincrease in attendance at crime scenes, a 4.3 per cent decline in fingerprint collectionsand an increase in identifications of 2.3 per cent (Burrows et al. 2002). Results such asthese serve to underline the complex relationship between the evidence collection andanalysis process and offender identification and arrest.
Perhaps the most authoritative review of applied forensic science in recent years is thatconducted by the Home Office in London (Blakey 2000). This study found that, beyond acertain level of attendance, there was no relationship between the level of attendance atcrime scenes and the amount of DNA evidence collected, again suggesting that there maybe a point of diminishing return. The results of that investigation were less stark forfingerprints, although the positive relationship between attendance and collection ofevidence was not strong. The author of the report suggested that appropriate crime sceneattendance levels should be determined by the geography of a particular area, the level ofcrime in that area and the available resources if maximum benefits are to be achieved forthat area. This research is concordant with the views of some informants in the presentstudy who felt that systems should be established to ensure that SOCOs collect higherquality evidence, rather than a higher quantity of evidence.
These findings suggest a need for caution in judging the utility of forensic evidencecollection and analysis in the management of high volume crime. However it would be amistake to dismiss their potential out of hand. The potential value of forensic evidence incontrolling any particular form of crime depends upon a host of other factors; such as therelative contribution of repeat versus novice offenders to the crime rate, the speed withwhich forensic evidence can be processed, the ease and speed with which suspectedoffenders can be apprehended, the rate at which they are successfully prosecuted and thedeterrent or incapacitation value of any punishment imposed by the courts. Problems inany one of these areas can attenuate or even break the link between evidence collectionand crime control. Furthermore, even if the law of diminishing returns operates to limitthe effectiveness of increased investment in evidence collection, individual police forcescan still only discover by trial and error whether the benefits of increased investment inevidence collection in their particular case, happen to outweigh the costs.
Much has been learned from this study which should be of assistance to police in NSWand other States in managing and evaluating complex police operations such as Vendas.In closing we summarise the most important of these lessons.
Firstly, where it is intended through some strategy to reduce crime it is worth carefullythinking through the mechanisms or causal chain through which the strategy is expectedto produce its effects. This helps ensure that any impediments to success are removedbefore the strategy is implemented. Just as importantly, it helps identify the measures thatare required to measure success and diagnose and respond to problems of implementationif they start to occur. In the present case the strategy of attending all BES and RSMV crimescenes could probably only ever have worked if it (a) led to an increase in the volume ofevidence collected (b) led to an increase in identifications, (c) led to an increase in arrests

33
Evaluating Police Operations (1): A Process and Outcome Evaluation of Operation Vendas
and (d) led to an increase in successful prosecutions. This suggests the need to identifyand remove any pre-existing impediments to the achievement of (a) – (d). It also suggeststhe need to set up baseline measures so as to be able to monitor on a regular basis whether(a) – (d) were being achieved.
Secondly, where there is some doubt about the potential power of a policing strategy toreduce a particular category of crime (as there always is with any new strategy) it isalways wise to avoid evaluating the strategy in sites where that category of crime is notvery prevalent or where the strategy under evaluation is already being pursued, in howeverrudimentary a fashion. Even strategies that exert quite sizable effects may not succeed inreducing a particular form of crime in an area where that form of crime is alreadyuncommon. Strengthening a strategy already being pursued, on the other hand, is probablyless likely to produce a measurable effect on crime than implementing one in an areawhere it does not exist at all.
These observations have some salience in the present study because, compared to theother two LACs, Miranda had a low volume of crime and a pre-existing practice ofprioritising attendance at high volume crime scenes. This had been highlighted in their2001 ACE report and explains why their baseline crime scene attendance rates weremuch higher than the other two Commands. The effect of the intervention would havebeen more noticeable in an LAC with a high volume of crime and a low pre-existingattendance at crime scenes, as was the case at Lake Illawarra. It is not surprising, therefore,that Lake Illawarra LAC was able to significantly increase their attendance at RSMVcrime scenes or that this, in turn, raised their offender identification rate by approximatelyfive per cent.
The third key point is that, where a complex strategy or intervention is being considered,there is much to be gained through development of a detailed project plan. There aremany approaches to the development of such plans but the Project Evaluation andReview Technique (PERT) is perhaps the best known and most widely used approach.A good summary of this type of analysis can be found in Stoner and colleagues’ excellentbook Management (Stoner et al. 1994). Basically it involves systematically identifyingwhat needs to happen for a project to be fully and properly implemented, determiningwhich of these activities can be carried out concurrently and which ones need to be donein sequence, estimating the time required for each task and then developing a plan foraction based on this analysis. The adoption of such an approach to the implementationof Vendas would have been of assistance in avoiding problems such as the lack of digitalcameras in Brisbane Waters LAC, the lack of experienced investigators in the LakeIllawarra LAC or the inability to measure changes over time in the number of peopleidentified on the basis of DNA evidence.
While the use of PERT would help identify all steps required to successfully implementand manage a project it is worth emphasising the point that complex police operationsdepend critically on good information and training. This was well understood in thepresent case and yet a lack of effective training still occasionally led to problems. GDs, onoccasion, for example, failed to request SOCO attendance or failed to distribute stolenvehicle leaflets. Education days, which may have mitigated or eliminated these problems,had been planned but were not in the event delivered. It is impossible to say what partthese problems played in preventing the success of Vendas but lack of training and lackof feedback can easily undermine commitment to a project. The value of regular scheduledmeetings and staff feedback to discuss the aims, successes/failures and outcomes ofpolice operations has recently been highlighted by Jacobson, Maitland & Hough (2003).

34
Evaluating Police Operations (1): A Process and Outcome Evaluation of Operation Vendas
Finally, it cannot be overemphasised that effective evaluation cannot be tacked onto theend of an anti-crime initiative or policing strategy which has already been designed.The time and resources required to establish a suitable baseline and follow-up periodor identify suitable comparison sites, are very much affected by the nature of theintervention. To put the matter more directly, decisions about the scale, duration andlocation of an intervention or strategy can make all the difference as to whether a programcan be evaluated or not. In the present case, the evaluators were brought in very early inthe process but not early enough to influence the length of the baseline period,the establishment of baseline measures, the choice of Vendas sites or the length of thefollow-up period. This made it impossible to identify factors that compromised thecapacity of the evaluation to identify that success, such as the short follow-up period orthe progressive increase in attendance at crime scenes which had begun prior to theformal implementation of Vendas.
35
Evaluating Police Operations (1): A Process and Outcome Evaluation of Operation Vendas
8. CONCLUSION
While Operation Vendas did not produce a drop in MVT and BES it is, nonetheless,an important step on the road to developing evidence-based best practice in policing.Evaluation of criminal justice initiatives is critical if police and policy makers are toadvance knowledge of what works and what doesn’t work in policing and other criminaljustice domains. Police operations in Australia have only rarely been subjected to anyform of outcome evaluation, let alone an evaluation which allows police to diagnosefactors that influence their success or failure. The current operation may not have beensuccessful in achieving its goal, but by systematically working through the means bywhich the operation might have brought about these changes, we get a much clearerpicture of the reasons for failure and the areas for improvement in the future. The processmay sometimes be painful and disappointing. However the alternative – investing heavilyin new strategies without evaluating them – is hardly worth considering. After all, ifrigorous research is necessary in evaluating new drugs before making them publiclyavailable, similar research can hardly be said to be unnecessary when evaluating strategiesintended to enhance public safety at taxpayers’ expense.
Finally, while the evaluation served to highlight many areas of weakness in the operation,it would be unfair and incorrect to suggest that there were, or will be, no benefits as aresult of Vendas. Increasing victim satisfaction and reducing fear of crime in thecommunity are important goals in their own right. The fact that SOCOs did achieve anincrease in attendance rates, particularly at RSMV crime scenes, would have resulted inmore interaction with victims of crime and may have had a corresponding effect on theirsatisfaction and fear of re-victimisation (Hirschel, Lumb & Johnson 1998). Furthermore,while the modest increase in identifications at Lake Illawarra LAC did not produce anymeasurable effect on arrest or recorded crime, it may well have assisted in bringing moreoffenders to court. That is an outcome worth having from the vantage-point of justice,even if not from the vantage-point of crime control.

36
Evaluating Police Operations (1): A Process and Outcome Evaluation of Operation Vendas
NOTES
1 These numbers were current as at 21/3/03.
2 Prepared by the Projects and Change Management Client Services arm of Business and TechnologyServices.
3 These ratings were calculated as rates of BES and MVT per 100,000 population. Data were notavailable for rates of BES and MVT by LAC. Only populations greater than 3000 were selected forcomparison because LGA’s with populations less than 3000 give a biased estimate of recorded crimerates. Sydney LGA was also excluded due to inaccuracies associated with calculating rate per100,000 resident population for an area with a largely transient population. These data were accurateas at February 2003.
4 The other major LGA constituent of Lake Illawarra LAC, Kiama, ranked 33rd highest out of 154 LGA’sin terms of MVT, 56th highest in terms of BES – Dwelling, and 63rd highest for BES – Non-Dwelling in2001. These data were accurate as at February 2003.
5 Although the scope exists for SOCOs to make their own assessments of whether they should attendthe crime scene by checking the station summary and phoning victims themselves, it is not commonpractice (Personal Communication, Karen Frizelle, Operation Vendas Manager, 29/1/03). The stationsummary is a hub that houses all recent Events that have been recorded in the LAC.
6 A unique CNI, or Central Names Index, number is allocated to each person charged with a criminaloffence.
7 Both ‘attempted’ and ‘actual’ BES incidents were to be attended under Vendas orders. Attempted BESrefers to instances where tool marks have been found near points of entry to a business or property,and it appears that there was an intention to gain entry to the premises. Any damage to the premisesis recorded as Malicious Damage.
8 This technique ‘lifts’ the dusted print from the surface with tape. This image on the tape is thenscanned into the computer and matched immediately against the NAFIS2 database.
9 The pawnbroking database holds a record of all recent pawn transactions that have taken placeacross NSW, property pawned, and the details of the person completing the pawn transaction.
10 BES dwelling and non-dwelling offences have been combined for ease of presentation in thisand subsequent analyses. There was no noticeable difference in trends between dwelling andnon-dwelling incidents.
11 These data are available from the author on request.
12 The authors are grateful to reviewers from the NSW Police Service for pointing this out.
13 The months refer to the date of the incident rather than the date of arrest or charge. For example,someone arrested in February for an incident that occurred in January would appear as a chargeunder the month of January.
14 Data subsequently provided by FSG indicated that, while there were no increases in total charges,there were significant increases in the number of people charged as a result of being identified onfingerprint evidence at Lake Illawarra for both BES and MVT offences. There were no such increasesat the other two LACs. This data has not been included in the current report due to inconsistenciesbetween the new data and that originally provided by FSG, because the data were not available astime series, and because it was unclear what proportion of the arrests were effected during theVendas period and what proportion were made after Vendas had been brought to a close.
15 Unfortunately, time series data bearing on the number of suspects identified on DNA evidencewere not available, so this and all subsequent analyses were limited to fingerprint evidence only.While pre- and during-Vendas comparisons of DNA identifications indicate that Lake Illawarra mayhave had an increase in DNA links during Vendas, overall the numbers are quite small and there doesnot appear to have been any corresponding increase in arrest or reduction in recorded crime ratesas a result. In saying this, the DNA database is still relatively small and its effectiveness will likelyincrease as it grows in magnitude.

37
Evaluating Police Operations (1): A Process and Outcome Evaluation of Operation Vendas
16 Only crime scenes classified as ‘fully identified’ are presented in this report. This excludes crimescenes where more than one fingerprint was found but not all offenders were identified. A comparisonwith data measuring both fully and partially identified jobs did not alter the outcome of the analysesreported here.
17 Note that the denominator for these and all subsequent analyses of stolen motor vehicle data is thevolume of recovered vehicles rather than the volume of stolen vehicles.
18 Each ‘attendance’ is a count of a forensic job updated by SOCOs on the forensic database.Some scenes that were attended but not examined for fingerprints are not included in these counts.Overall, however, very few attendances will be excluded (personal communication, Craig Steel,Forensic Services Group, 2/5/03). It is also possible to have more than one job recorded against onecrime scene but, again, this is the exception rather than the rule. Monthly counts of BES andrecovered stolen motor vehicle used to calculate attendance rates were taken from the police EnterpriseData Warehouse, rather than the accepted and verified incidents recorded in the New South WalesRecorded Crime Statistics published by the Bureau. The discrepancy between data sources isusually between 1 and 2 percentage points for any one month.
19 Lake Illawarra LAC did not regularly return these data.
20 Note that it was not possible to differentiate between those identifications made from digital images,35mm images or lifts. The time lags are therefore averaged over the three types of fingerprintingmediums used in the operation. These data are quite limited and must be interpreted cautiously.Some of the longer time lags included in the data may result from offenders not being on the NAFIS2database at the time the prints were submitted, but who appeared on the system later in the studyperiod. Also, the turnaround times are recorded as the time between Event creation on COPS and theidentification being received at the LAC. The Event will not always be created on the day that theincident occurred or on the day that the SOCO attended. For example it is possible that someonereported a BES on Friday night, at which time the Event would have been created, but the SOCO maynot have attended the crime scene until Monday. The Event will almost always be created at the timethe incident is reported to PAL or to police.

38
Evaluating Police Operations (1): A Process and Outcome Evaluation of Operation Vendas
REFERENCES
Australian Bureau of Statistics 2001, Crime and Safety, New South Wales, AustralianBureau of Statistics, Canberra.
Blakey, D. 2000, Under the Microscope: Thematic Inspection Report on Scientific andTechnical Support, Home Office, Her Majesty’s Inspectorate of Constabulary, London.
Burrows, J., Tarling, R., Mackie, A., Poole, H. & Hodgson, B. 2002, The evaluation ofincreased forensic activity in GMP and Lancashire, Morgan Harris Burrows, London.
Chan, J. 1995, The Limits of Incapacitation as a Crime Control Strategy, Crime andJustice Bulletin no. 25, NSW Bureau of Crime Statistics and Research, Sydney.
Doak, P., Fitzgerald, J. & Ramsay, M. 2003, New South Wales Recorded Crime Statistics2002, NSW Bureau of Crime Statistics and Research, Sydney.
Faulds, H. 1880, ‘On the skin-furrows of the hand’, Nature, vol. 22, pp. 605.
Galton, F. 1888, ‘Personal identification and description’, Nature, vol. 38, pp. 201-202.
Galton, F. 1892, Finger Prints, McMillan & Co., London.
Greenwood, P. W., Chaiken, J. & Petersilia, J. 1977, The Criminal Investigation Process,D.C. Heath and Company, Lexington, Massachusetts.
Hirschel, D., Lumb, R. & Johnson, R. 1998, ‘Victim assessment of the police responseto burglary: The relative effects of incident, police action, outcome and demographicvariables on citizen satisfaction’, Police Quarterly, vol. 1, no. 4, pp. 1-20.
Horvath, F. & Meesig, R. 1996, ‘The criminal investigation process and the role of forensicevidence: A review of empirical findings’, Journal of Forensic Sciences, vol. 41, no. 6,pp. 963-969.
Jacobson, J., Maitland, L. & Hough, M. 2003, The Reducing Burglary Initiative:Investigating Burglary, Research Study no. 264, Home Office, London.
Koper, C. S. 1995, ‘Just enough police presence: Reducing crime and disorderly behaviourby optimizing patrol time in crime hot spots’, Justice Quarterly, vol. 12, no. 4, pp. 649-672.
Logan, C. H. 1975, ‘Arrest rates and deterrence’, Social Science Quarterly, vol. 56, no. 1,pp. 376-389.
Nagin, D. S. 1998, ‘Criminal deterrence research at the outset of the twenty-first century’,in Crime and Justice: A Review of Research, (Vol. 23), Ed. M. Tonry, University of ChicagoPress, Chicago, pp. 1-42.
Nagin, D. S. & Pogarsky, G. 2003, ‘An experimental investigation of deterrence: Cheating,self-serving bias, and impulsivity’, Criminology, vol. 41, no. 1, pp. 167-193.
Paternoster, R. 1989, ‘Decisions to participate in and desist from four types of commondelinquency: Deterrence and the rational choice perspective’, Law and Society Review,vol. 23, no. 1, pp. 7-40.
Peterson, J. L., Mihajlovic, S. & Gilliland, M. 1984, Forensic Evidence and the Police: TheEffects of Scientific Evidence on Criminal Investigations, National Institute of Justice,Washington DC.
Ramsay, M. 1987, The Effectiveness of the Forensic Science Service, Research Study no. 92,Home Office, London.

39
Evaluating Police Operations (1): A Process and Outcome Evaluation of Operation Vendas
Sampson, R. J. & Cohen, J. 1988, ‘Deterrent effects of the police on crime: A replicationand theoretical extension’, Law and Society Review, vol. 22, no. 1, pp. 163-189.
Stoner, J. A. F., Yetton, P. W., Craig, J. F. & Johnston, K. D. 1994, Management (2nd ed.),Prentice Hall, Sydney.
Tilley, N. & Ford, A. 1996, Forensic Science and Crime Investigation, Crime Detection andPrevention Series no. 73, Home Office, London.
Waldo, G. P. & Chiricos, T. G. 1972, ‘Perceived penal sanction and self-reported criminality:A neglected approach to deterrence research’, Social Problems, vol. 19, pp. 522-540.

40
Evaluating Police Operations (1): A Process and Outcome Evaluation of Operation Vendas
GLOSSARY OF TERMS
ACE reportsAnalysis of the Crime Environment reports are compiled annually by each LAC to describe thestatus of the crime environment within that LAC, and the procedures planned to address crimein the following 12 month period.
BESBreak, enter and steal.
CIConfidence Interval. Confidence intervals are used in statistics when estimating some unknownvalue, such as a population average or the slope of a trend line. In the present report we use themwhen estimating the slope of trends in crime. Instead of a single estimate for the slope, a confidenceinterval generates a lower and upper limit and the width of the interval gives an indication ofhow much uncertainty there is in our estimate of the true slope. The narrower the interval, themore precise is our estimate. If crime fluctuates a lot from month-to-month and we are onlylooking at a short period of time, the interval is likely to be quite wide suggesting that there is alot of uncertainty in our estimate. Likewise if crime is quite stable and we are looking at a longperiod of time, the interval is likely to be quite narrow and we can be very certain of ourestimate.
CMUCrime Management Unit. The CMU is responsible for coordinating all investigations within theLocal Area Command. The CMU is headed by the Crime Manager and includes, among others,the Crime Coordinator, Investigations Manager, Investigators, SOCOs, Intelligence Analysts,Field Intelligence Officers, Youth Liaison Officer, Crime Prevention Officer, Domestic ViolenceLiaison Officer, Volunteers In Policing and Licensing Officers.
COPSComputerised Operational Policing System. COPS is the database where all police crime data isrecorded and stored.
DALDivision of Analytical Laboratories. DAL is a division of the NSW Department of Health whichis responsible for the analysis of DNA trace material sent from the NSW Police LACs.
Event ReportThis report is held on COPS and contains a record of all of the relevant details of an incidentreported to the police.
FSIMSForensic Services Information Management System. FSIMS is the database where all forensicdata is stored. Information can be exchanged and updated by all parties involved in the forensicprocess. The types of information exchanged include requests for job attendance, evidencecollected from crime scenes, and results of fingerprint analyses.
GD officerGeneral Duties officer. GDs respond to a broad range of incidents in the LAC including roadaccidents, break and enters, located motor vehicles and domestic violence.
LACLocal Area Command. Geographically, NSW is divided into 5 ‘regions’, each consisting of anumber of LACs. There are 80 LACs in NSW, and each LAC contains one or more police stations.One LAC can cover several suburbs, postcodes or Local Government Areas.
Latent FingerprintsFingerprints left at a crime scene.

41
Evaluating Police Operations (1): A Process and Outcome Evaluation of Operation Vendas
LGALocal Government Area. The geographical area under the jurisdiction of a given LocalGovernment.
LiftThis fingerprinting technique involves dusting the print, sticking tape to that image and ‘lifting’the tape from the surface, taking the fingerprint image with it. This image is then scanned intothe computer and matched against the database of stored fingerprint files.
LiveScanThese terminals are used at some charging stations in NSW as a replacement for ink-and-rollerfingerprinting procedures. LiveScan electronically codes fingerprints using laser technology andprovides superior quality prints to the ink method. LiveScan is also linked to the nationalfingerprint database (NAFIS2) allowing real-time matching of fingerprints at the station.
MOModus Operandi. This term is used to describe the typical pattern of offender behaviour and,for BES offences, includes information such as point of entry to the premises, types of goodsstolen and activities conducted while inside the premises.
MVTMotor Vehicle Theft.
NAFIS(2)National Automated Fingerprint Identification System. This is a national database of storedoffender fingerprint files and latent prints from both solved and unsolved crime scenes.
NSWNew South Wales.
PALPolice Assistance Line. PAL is a call centre designed to take reports of non-serious crime wherepolice presence is not necessary.
Pawnbroker databaseThe pawnbroking database holds a record of all recent pawn transactions that have taken placeacross NSW, property pawned, and the details of the person completing the pawn transaction.
RegionsNSW is divided into 5 broad geographic regions: Northern, Southern, Western, Inner Metro,and Greater Metro. Brisbane Waters LAC is part of the Northern Region, Lake Illawarra LAC ispart of the Southern Region and Miranda is part of the Inner Metro Region.
RSMVRecovered Stolen Motor Vehicle. A stolen motor vehicle is considered to be ‘recovered’ when apolice officer attends the scene.
SOCOScene of Crime Officer. These officers are responsible for gathering physical evidence fromcrime scenes.
SOPSStandard Operating Procedures. These procedures define standard police practice and can beredefined to meet the requirements of special operations, such as Vendas.
Westmead Forensic LaboratoryThis lab is responsible for analysing forensic exhibits collected at crime scenes, and developingfingerprint films.

42
Evaluating Police Operations (1): A Process and Outcome Evaluation of Operation Vendas
APPENDIX A

43
Evaluating Police Operations (1): A Process and Outcome Evaluation of Operation Vendas
APPENDIX B

44
Evaluating Police Operations (1): A Process and Outcome Evaluation of Operation Vendas
APPENDIX C
Appendix C: Mean number of charges per month for BES andmean number of BES incidents recorded at thethree trial LACs before and during the operation
Brisbane Waters Lake Illawarra Miranda
Charges Incidents Charges Incidents Charges Incidents
Mean before 11.1 248 11.9 283 4.0 106Mean during 7.7 168 13.4 270 2.3 86p-value 0.21 <0.01 0.32 0.71 0.17 <0.01
Brisbane Waters
Lake Illawarra
Miranda
Appendix C: Number of charges per month for BES offences,by LAC, December 2001 - January 2003
Number
Month
35
30
Dec01
Jan02
Feb02
Apr02
Mar02
May02
Jun02
Jul02
Sep02
Aug02
Oct02
Nov02
Dec02
Jan03
25
20
15
10
5
0

45
Evaluating Police Operations (1): A Process and Outcome Evaluation of Operation Vendas
APPENDIX D
Appendix D: Mean number of charges per month for MVT andmean number of MVT incidents recorded at thethree trial LACs before and during the operation
Brisbane Waters Lake Illawarra Miranda
Charges Incidents Charges Incidents Charges Incidents
Mean before 5.4 76 6.6 112 3.6 46Mean during 4.3 50 7.1 98 2.0 39p-value 0.90 <0.05 0.81 0.46 0.10 0.21
Brisbane Waters
Lake Illawarra
Miranda
Appendix D: Number of charges per month for MVT offences,by LAC, December 2001 - January 2003
Number
Month
Dec01
Jan02
Feb02
Apr02
Mar02
May02
Jun02
Jul02
Sep02
Aug02
Oct02
Nov02
Dec02
Jan03
25
20
15
10
5
0

46
Evaluating Police Operations (1): A Process and Outcome Evaluation of Operation Vendas
APPENDIX E
Appendix E: Mean number of identifications per month from BES crime scenesand mean number of BES incidents recorded per month at thethree trial LACs before and during the operation
Brisbane Waters Lake Illawarra Miranda
IDs Incidents IDs Incidents IDs Incidents
Mean before 3.0 248 5.3 283 1.3 106Mean during 4.6 168 8.0 270 0.9 86p-value 0.13 <0.01 0.32 0.71 0.54 <0.01
Brisbane Waters
Lake Illawarra
Miranda
Appendix E: Number of identifications made on fingerprints at BES crime scenesper month, by LAC, December 2001 - January 2003
Number
Month
20
18
Dec01
Jan02
Feb02
Apr02
Mar02
May02
Jun02
Jul02
Sep02
Aug02
Oct02
Nov02
Dec02
Jan03
14
12
10
6
4
0
16
8
2

47
Evaluating Police Operations (1): A Process and Outcome Evaluation of Operation Vendas
APPENDIX F
Appendix F: Mean number of identifications per month from RSMV crimescenes and mean number of RSMV incidents recorded per monthat the three trial LACs before and during the operation
Brisbane Waters Lake Illawarra Miranda
IDs Incidents IDs Incidents IDs Incidents
Mean before 0.6 62 1.6 112 1.0 29Mean during 1.7 44 6.7 97 0.9 27p-value 0.07 <0.05 <0.05 0.46 0.71 0.81
Brisbane Waters
Lake Illawarra
Miranda
Appendix F: Number of identifications made on fingerprints at RSMV crime scenesper month, by LAC, December 2001 - January 2003
Number
Month
18
Dec01
Jan02
Feb02
Apr02
Mar02
May02
Jun02
Jul02
Sep02
Aug02
Oct02
Nov02
Dec02
Jan03
14
12
10
6
4
0
16
8
2

48
Evaluating Police Operations (1): A Process and Outcome Evaluation of Operation Vendas
APPENDIX G
Appendix G: Mean number of fingerprints collected per month at BES crimescenes and mean number of BES incidents recorded per monthat the three trial LACs before and during the operation
Brisbane Waters Lake Illawarra Miranda
FPs Incidents FPs Incidents FPs Incidents
Mean before 21.9 248 31.9 283 18.0 106Mean during 33.0 168 36.3 270 12.7 86p-value <0.05 <0.01 0.32 0.71 0.17 <0.01
Brisbane Waters
Lake Illawarra
Miranda
Appendix G: Number of useable fingerprints found at BES crime scenesper month, by LAC, December 2001 - January 2003
Number
Month
90
Dec01
Jan02
Feb02
Apr02
Mar02
May02
Jun02
Jul02
Sep02
Aug02
Oct02
Nov02
Dec02
Jan03
70
60
50
30
20
0
80
40
10

49
Evaluating Police Operations (1): A Process and Outcome Evaluation of Operation Vendas
APPENDIX H
Appendix H: Mean number of fingerprints collected per month at RSMV crimescenes and mean number of RSMV incidents recorded permonth at the three trial LACs before and during the operation
Brisbane Waters Lake Illawarra Miranda
FPs Incidents FPs Incidents FPs Incidents
Mean before 4 62 4.6 112 4.7 29
Mean during 9.4 44 20.9 97 7.6 27p-value <0.01 <0.05 <0.01 0.46 0.26 0.81
Brisbane Waters
Lake Illawarra
Miranda
Number
Month
40
Dec01
Jan02
Feb02
Apr02
Mar02
May02
Jun02
Jul02
Sep02
Aug02
Oct02
Nov02
Dec02
Jan03
30
25
20
10
0
35
15
5
Appendix H: Number of useable fingerprints found at RSMV crime scenesper month, by LAC, December 2001 - January 2003

50
Evaluating Police Operations (1): A Process and Outcome Evaluation of Operation Vendas
APPENDIX I
Appendix I: Mean number of BES crime scenes attended per monthand mean number of BES incidents recorded per monthat the three trial LACs before and during the operation
Brisbane Waters Lake Illawarra Miranda
Attended Incidents Attended Incidents Attended Incidents
Mean before 77 248 99 283 76 106Mean during 111 168 208 270 68 86p-value <0.05 <0.01 <0.01 0.71 0.13 <0.01
Brisbane Waters
Lake Illawarra
Miranda
Appendix I: Number of BES crime scenes attended by SOCOs per month,by LAC, December 2001 - January 2003
Number
Month
300
Dec01
Jan02
Feb02
Apr02
Mar02
May02
Jun02
Jul02
Sep02
Aug02
Oct02
Nov02
Dec02
Jan03
0
250
200
150
100
50
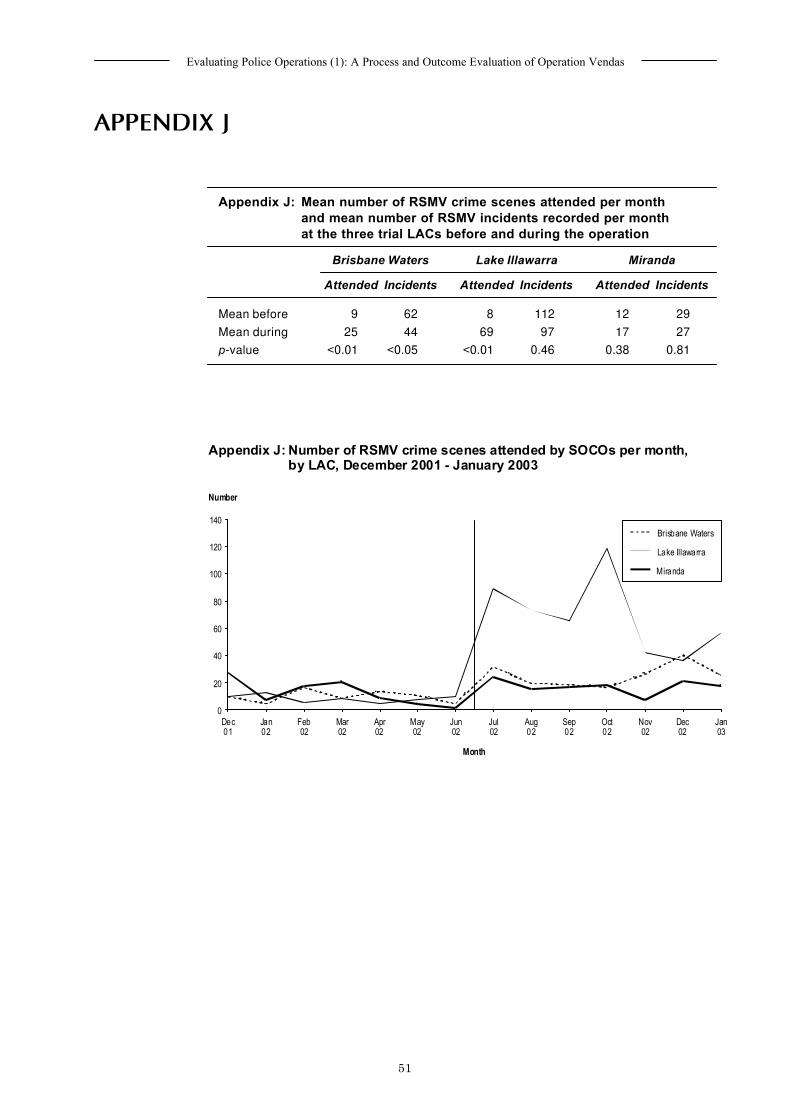
51
Evaluating Police Operations (1): A Process and Outcome Evaluation of Operation Vendas
APPENDIX J
Appendix J: Mean number of RSMV crime scenes attended per monthand mean number of RSMV incidents recorded per monthat the three trial LACs before and during the operation
Brisbane Waters Lake Illawarra Miranda
Attended Incidents Attended Incidents Attended Incidents
Mean before 9 62 8 112 12 29Mean during 25 44 69 97 17 27p-value <0.01 <0.05 <0.01 0.46 0.38 0.81
Brisbane Waters
Lake Illawarra
Miranda
Appendix J: Number of RSMV crime scenes attended by SOCOs per month,by LAC, December 2001 - January 2003
Number
Month
140
Dec01
Jan02
Feb02
Apr02
Mar02
May02
Jun02
Jul02
Sep02
Aug02
Oct02
Nov02
Dec02
Jan03
120
100
80
60
20
40
0