Evaluating Natural Attenuation Shu-Chi Chang, Ph.D., P.E., P.A. Assistant Professor 1 and Division...
43
Evaluating Natural Attenuation Shu-Chi Chang, Ph.D., P.E., P.A. Assistant Professor 1 and Division Chief 2 1 Department of Environmental Engineering 2 Division of Occupational Safety and Health, Center for Environmental Protection and Occupational Safety and Health National Chung Hsing University May 2, 2007
-
date post
21-Dec-2015 -
Category
Documents
-
view
213 -
download
0
Transcript of Evaluating Natural Attenuation Shu-Chi Chang, Ph.D., P.E., P.A. Assistant Professor 1 and Division...
Evaluating Natural Attenuation
Shu-Chi Chang, Ph.D., P.E., P.A.Assistant Professor1 and Division Chief2
1Department of Environmental Engineering2Division of Occupational Safety and Health,
Center for Environmental Protection and Occupational Safety and Health
National Chung Hsing University
May 2, 2007

Course plan
5/2: Midterm and Evaluating NA 5/9: Evaluating NA and Biobarrier (4
hours) 5/16: Air sparging case study, GW
and soil sampling demonstration (4 hours)
5/23: Modeling natural attenuation or guest speaker on NA (1 hour)
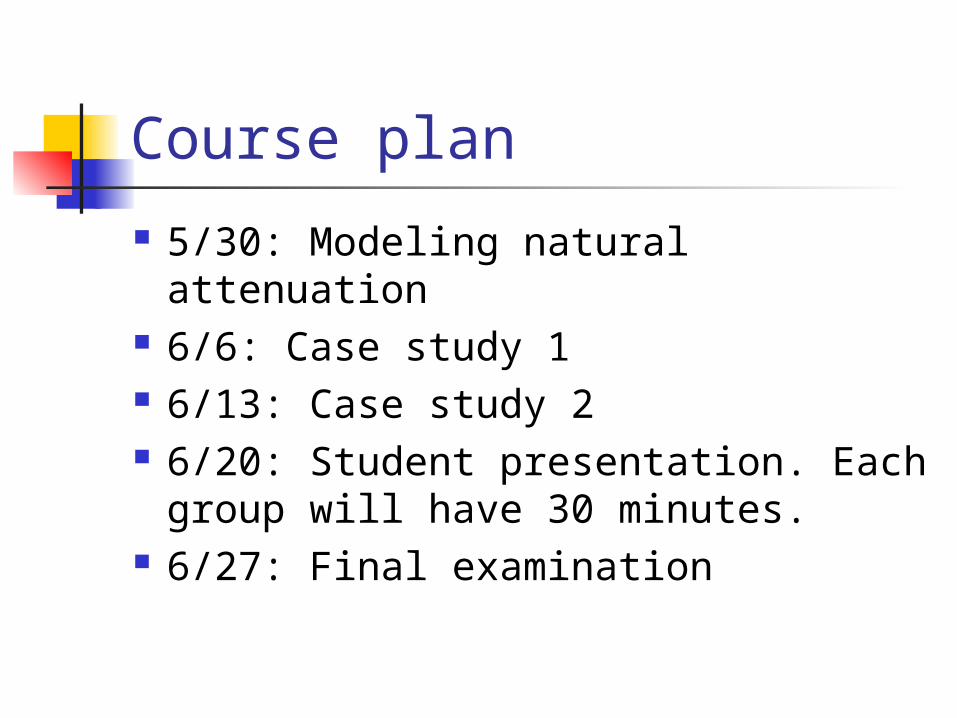
Course plan
5/30: Modeling natural attenuation 6/6: Case study 1 6/13: Case study 2 6/20: Student presentation. Each
group will have 30 minutes. 6/27: Final examination

Outline Chemical and geochemical data Lines of evidence Documented loss of contaminant mass of
plume stabilization Analytical data confirming intrinsic
bioremediation Microbiological data Estimating biodegradation rates Screening natural attenuation of PHCs Screening natural attenuation of chlorinated
solvents
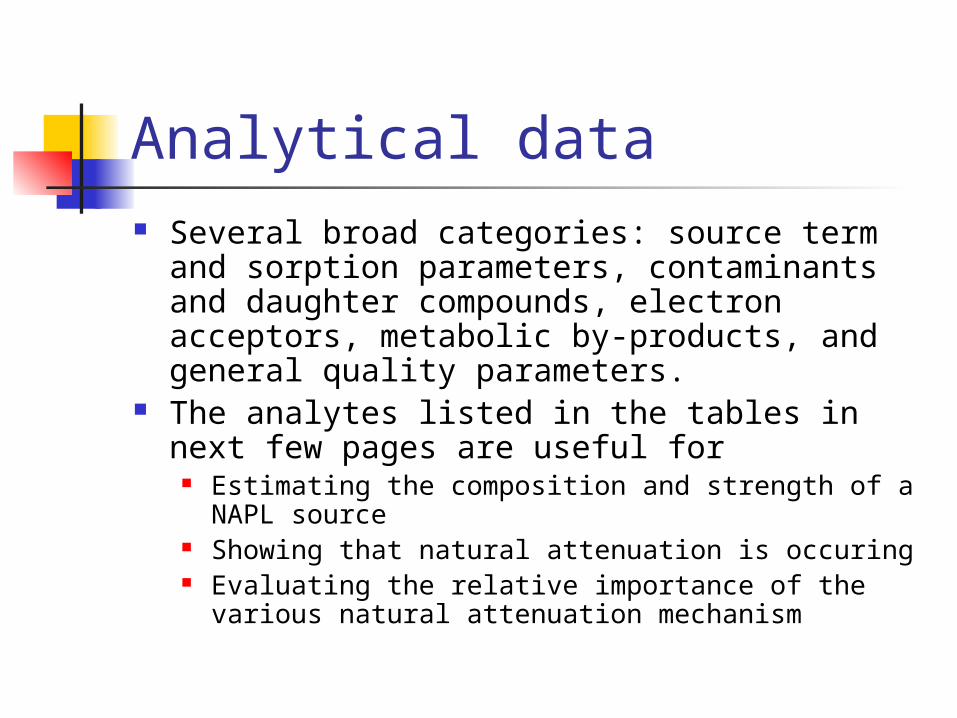
Analytical data Several broad categories: source term and
sorption parameters, contaminants and daughter compounds, electron acceptors, metabolic by-products, and general quality parameters.
The analytes listed in the tables in next few pages are useful for
Estimating the composition and strength of a NAPL source
Showing that natural attenuation is occuring Evaluating the relative importance of the various
natural attenuation mechanism

Soil-sediment analytical parameters
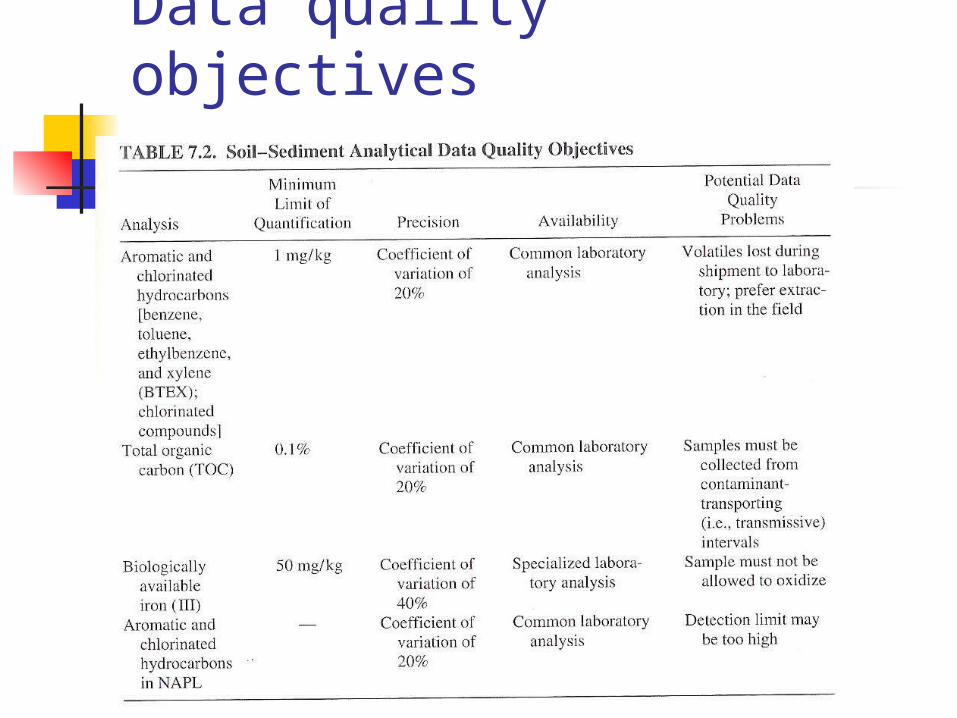
Data quality objectives

GW parameters useful for evaluating natural attenuation (I)

GW parameters useful for evaluating natural attenuation (II)

GW parameters useful for evaluating natural attenuation (III)


GW analytical data quality objectives (II)

GW analytical data quality objectives (III)

Source term and sorption parameters Continuing source: mobile or
residual NAPL, or contaminant sorbed to the aquifer matrix
Degree of weathering of the NAPL, and its composition and strength-> amount of aqueous phase NAPL
TOC content is important to judge the sorption and possible retardation

Contaminant and daughter compounds Method 8020 can be used if site
contamination is limited to petroleum hydrocarbons.
Method SW 8020a is used if only chlorinated solvents of PHCs mixed with solvent are found in the subsurface
The dissolved concentration of combined BTEX and trimethylbenzene should not exceed 30 mg/L for a JP-4 spill or about 135 mg/L for a gasoline spill.

Electron acceptors and metabolic by-products Again, dissolved oxygen (DO), nitrate,
Mn(IV), Fe (III), sulfate, and CO2 (for methanogenesis).
Again, observe from the reduced form: Fe(II), Mn(II)
Readily measurable by-products: Fe(II), CO2, H2S, CH4, C2H6, C2H4, alkalinity, lowered redox potential, chloride, and hydrogen.

General water quality parameters
pH Temperature: Q10 rule Conductivity Those values better to be
measured “fresh”

General groundwater sampling consideration
Type: Monitoring wells: most common
and versatile but may be biased Monitoring points
Geoprobe®
Drive by cone penetrometer, hydraulic percussion, manually powered equipment
Grab sampling locations Hydraulic punch, Geoprobe, cone
penetrometer, hand-driven

Geoprobe®

Cone penetrometer technology (CPT)

Groundwater sampling Generic classification
Grab: Bailer (most common) Advantages: can be used at any depth Disadvantages: aeration and agitation
Suction lift: peristaltic pump Advantages: no cross contamination, no turbulence
(better DO and redox potential measurement) Disadvantages: limited depth, offgassing
Positive displacement: submersible pump Advantages: Deep withdraw, high volume Disadvantages: size limitation, rigorous
decontamination
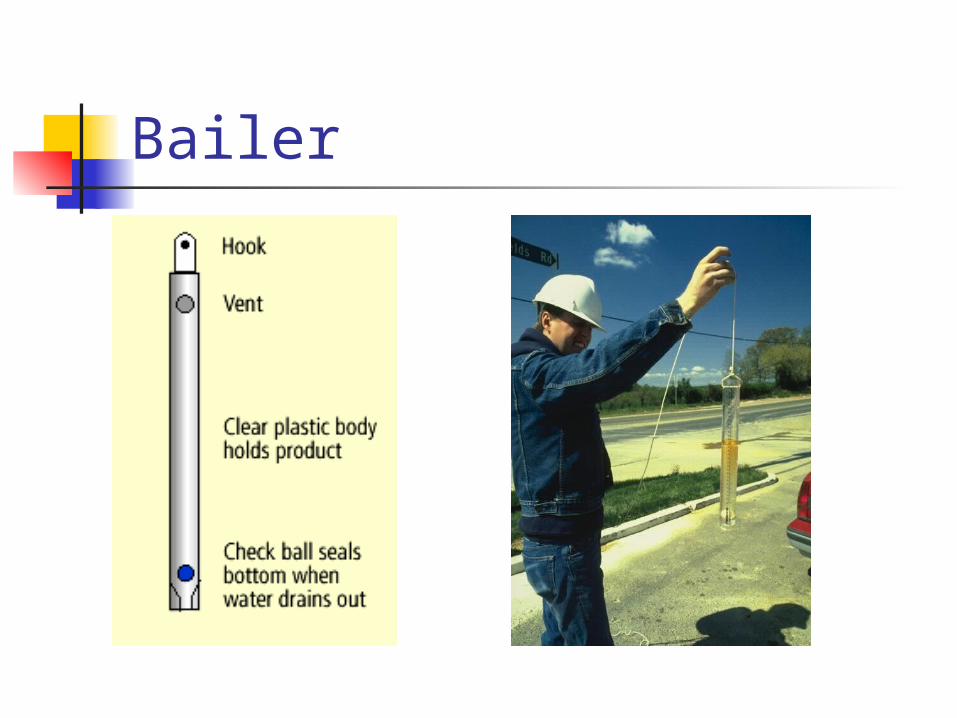
Bailer

Peristaltic pump
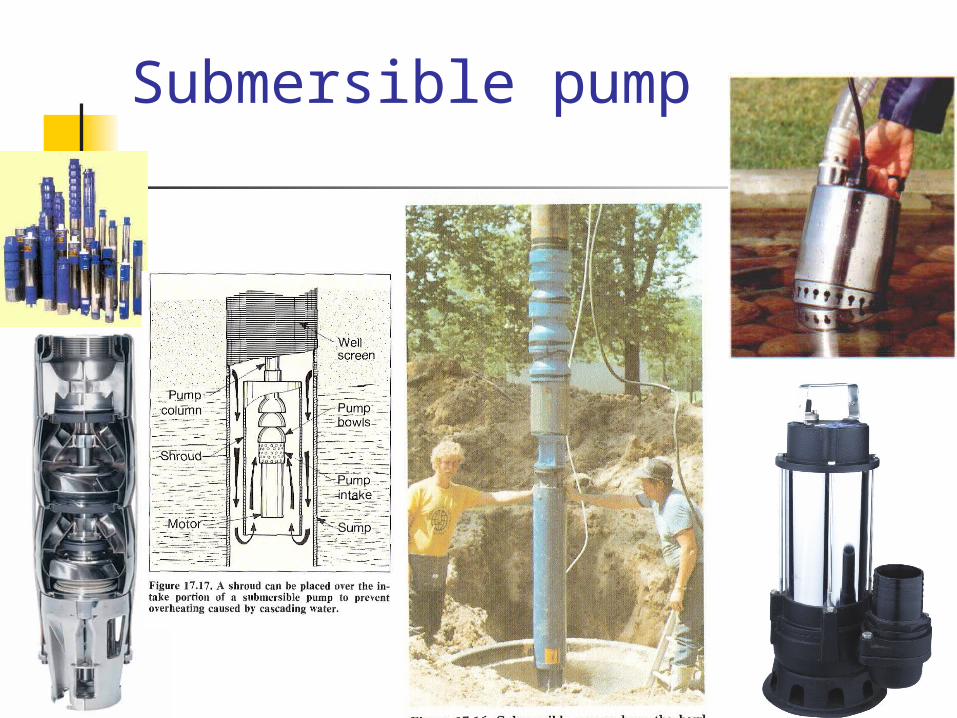
Submersible pump

Light drilling machine

Well-head measurement Flow-through cell
<5% Height If bubbles were observed,
slow down If still has bubbles, replace
the tubing Bailer
Slowly immersing into water
Downhole measurement Care for decon

A few tips
Sample should be collected directly from the pump
Avoid aeration No air in the container and sealed
well

Lines of evidence used to evaluate natural attenuation Historical trends in contaminant data
showing plume stabilization and/or loss of contaminant mass overtime
Analytical data showing Depletion of electron acceptors and donors Increasing metabolic by-product Decreasing parent compounds Increasing daughtor compounds
Microbiological data that support the occurrence of biodegradation.


Documented loss of contaminant mass or plume stabilization
Visual tests of plume stabilization Statistical tests of plume
stabilization Mann-Whitney U test Mann-Kendal test

Visual tests of plume stabilization
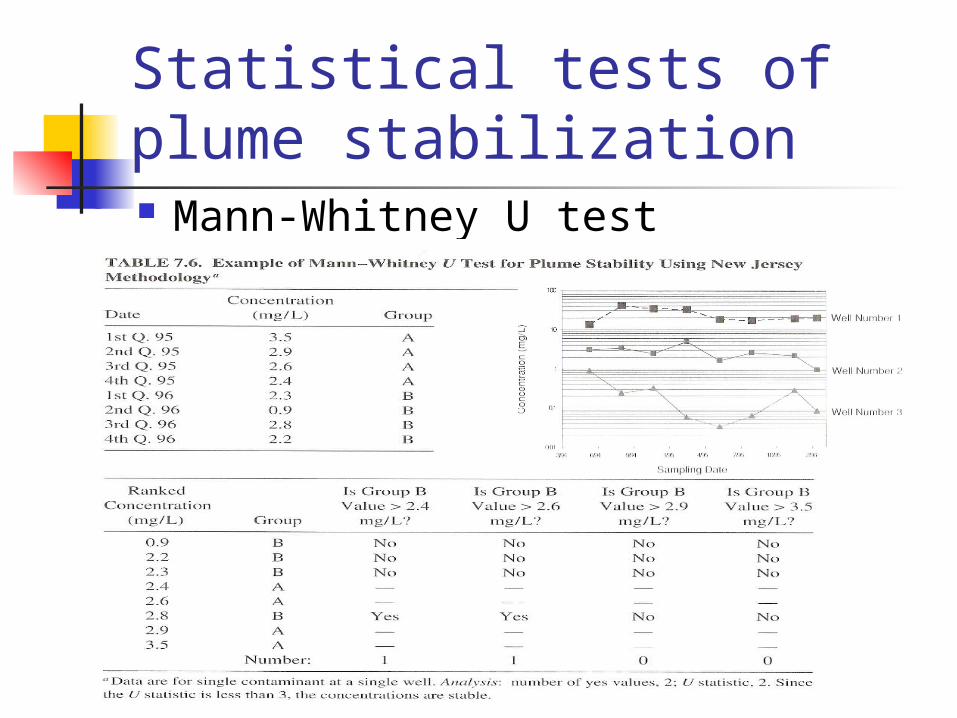
Statistical tests of plume stabilization Mann-Whitney U test
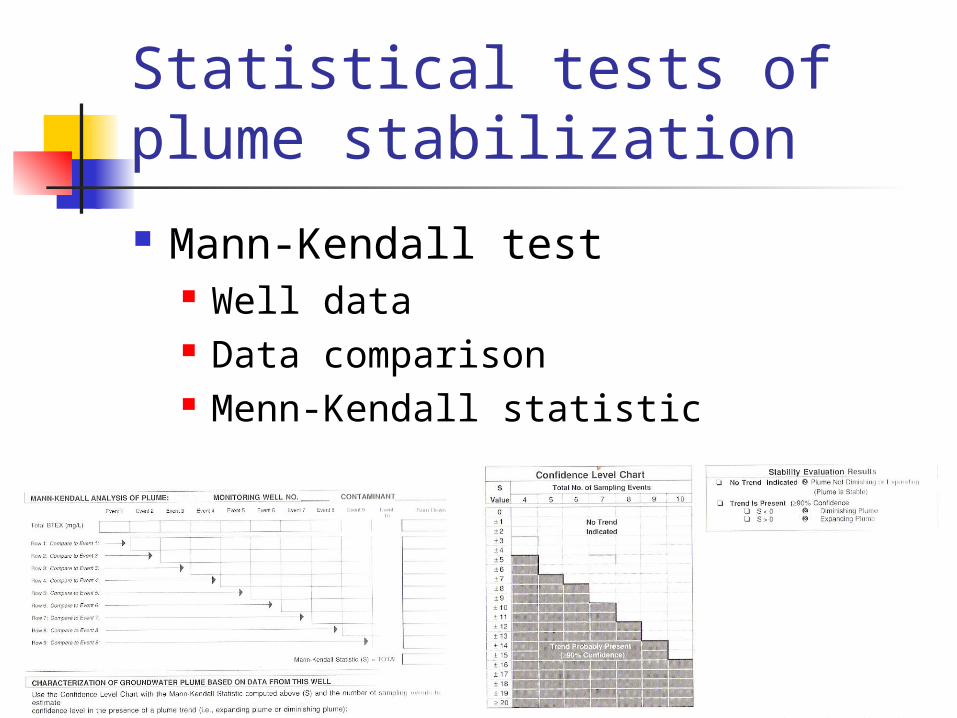
Statistical tests of plume stabilization
Mann-Kendall test Well data Data comparison Menn-Kendall statistic
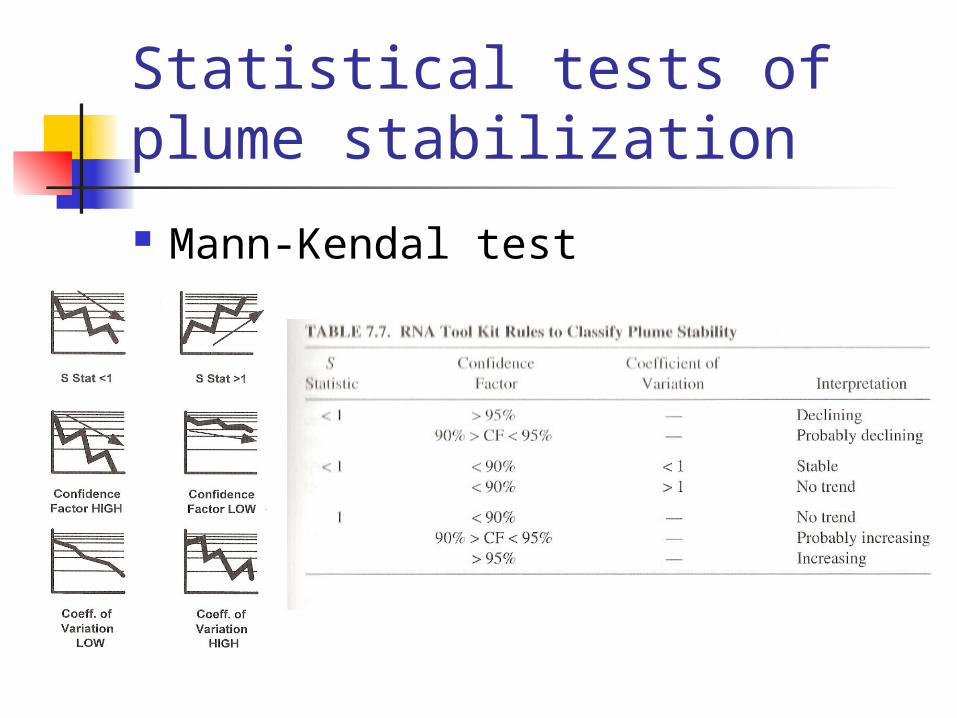
Statistical tests of plume stabilization
Mann-Kendal test

Analytical data confirming intrinsic bioremediation Electron acceptors Daughter compounds Metabolic by-products Spatial distribution of e donors, e
acceptors, metabolic by-products, and daughter compounds
Deducing the distribution of TEAPs in GW

Electron acceptors, by-products, and daughter compounds Electron acceptors
DO Nitrate Sulfate
By-products Fe(II) and Mn(II) H2S CH4 CO2 Alkalinity Redox potential Dissolved hydrogen Chloride
Daughter compounds

Spatial distribution of e donors, e acceptors, metabolic by-products, and daughter compounds
Microbiological data

Estimating biodegradation rates

Screening for NA of PHCs

Screening of NA of chlorinated solvents