Evaluating an Adaptive Clinical Trial with Quantitative Endpoints, Sample Size Re-estimation,...
26
Evaluating an Adaptive Clinical Trial with Quantitative Endpoints, Sample Size Re- estimation, Sequential Monitoring for Efficacy, and Monitoring for Futility By: Harrison Reeder Mentor: Dr. Kathryn Chaloner Iowa Summer Institute in Biostatistics
-
Upload
cristal-dew -
Category
Documents
-
view
218 -
download
1
Transcript of Evaluating an Adaptive Clinical Trial with Quantitative Endpoints, Sample Size Re-estimation,...

Evaluating an Adaptive Clinical Trial with Quantitative Endpoints, Sample Size Re-estimation, Sequential Monitoring for Efficacy, and Monitoring for Futility
By: Harrison ReederMentor: Dr. Kathryn ChalonerIowa Summer Institute in
Biostatistics
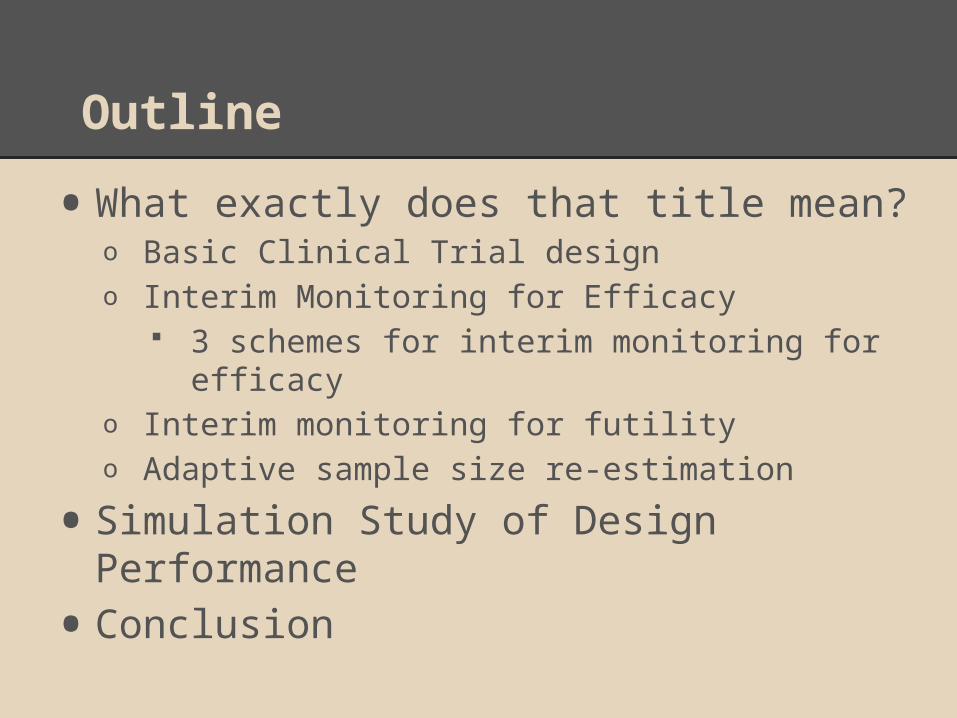
Outline
• What exactly does that title mean?o Basic Clinical Trial designo Interim Monitoring for Efficacy
3 schemes for interim monitoring for efficacyo Interim monitoring for futilityo Adaptive sample size re-estimation
• Simulation Study of Design Performance
• Conclusion

Clinical Trial Design: The Basic Case
• The most basic element of clinical trial design is determining an adequate sample size
• Calculating sample size requires specifying:
• approximate variance of outcomes
• the desired Type I error rate
• minimum clinically meaningful treatment effect
• desired power to detect that effect
Code in R: power.t.test()
Taken from Introduction to Randomized Controlled Clinical Trials by John Matthews

Motivating Clinical Trial Example
• Treatment of insomnia in children with autismo Phase II Clinical Trial
• Only previous study was small and on adult subjects
• In general, poor understanding of responses motivates need for adaptive trialo Better performance with incorrect estimates?

Interim Monitoring for Efficacy
• Why use interim monitoring?
• Complications of interim monitoring
Interim monitoring inflates Type I errorSolution: Change boundary of significance
Taken from Introduction to Randomized Controlled Clinical Trials by John Matthews

Schemes for Interim Efficacy Monitoring
• Pocock "constant" boundarieso sets constant p-value boundary to use at every
monitoring pointo Earlier rejection is easier, but final test is stringent
• O'Brien-Fleming boundarieso makes rejection harder at earlier points and easier as trial
progresses
• Fleming-Harrington-O'Brien boundarieso middle-ground between above strategies
Boundary First Interim Second Interim Third Interim Final point
Pocock 0.0182 0.0182 0.0182 0.0182
O-F 0.00005 0.0039 0.0184 0.0412
F-H-O 0.0067 0.0083 0.0103 0.0403

Interim Monitoring for Futility
• Why monitor for futility?
• Conditional powero Estimates probability of having significant
results given observed data and (design) assumptions
o If probability is lower than a specified threshold, then trial is stopped
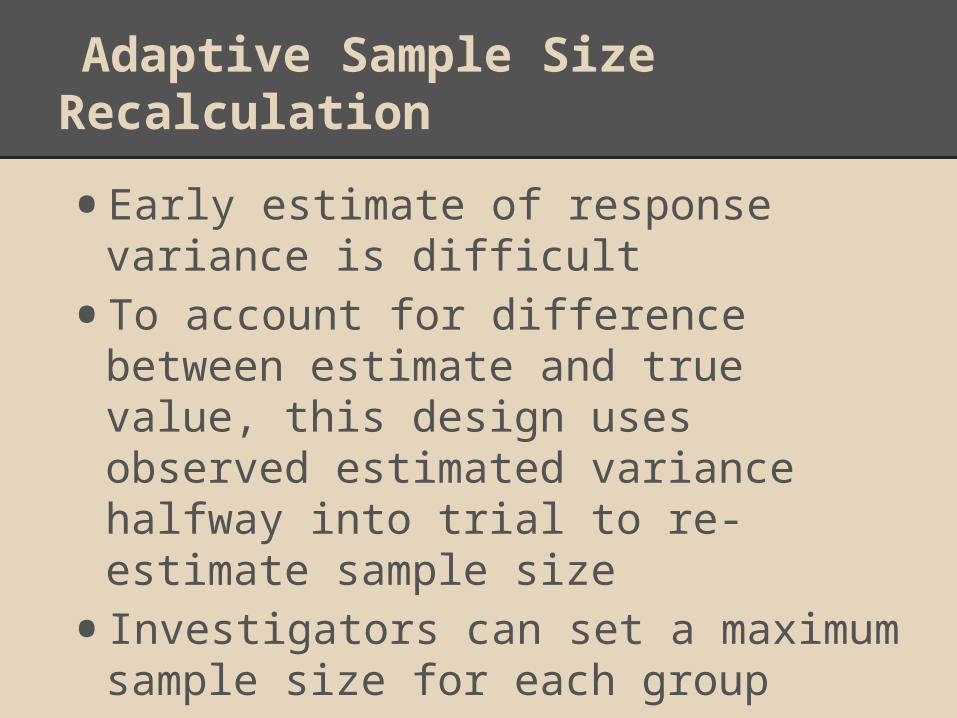
Adaptive Sample Size Recalculation
• Early estimate of response variance is difficult
• To account for difference between estimate and true value, this design uses observed estimated variance halfway into trial to re-estimate sample size
• Investigators can set a maximum sample size for each group

Research Question: How does our design perform?
• Using simulation, we compare the design to designs without the features describedo We also compare the merits of the three interim
monitoring schemes
• Values of interest:o Bias of final treatment effect estimateo True confidence of nominal 95% Confidence
Intervalo True Type I erroro True powero Distribution of stopping points

Designing the Simulation
Motivating Study: Effect of Sleeping Drug in Adolescents and Young Adults with Autism Spectrum Disorder
Design assumptions:• Mean treatment effect: 32• Response standard deviation: 36
Simulation seed: 42 Conditional power seed: 123
First Interim
• Sample Size is 9• Check for efficacy
Second Interim
• Sample Size is 18• Check for efficacy• Check for futility• Final sample size is recalculated
Third
Interim
• Sample size is if recalculated• Without sample size recalculation, size is 28• Check for efficacy
Final
Point
• Sample size is Final 50 if recalculated• Without sample size recalculation, size is 35• Check for efficacy

Comparison of Boundary Types
• Pococko Highest Type I erroro Highest biaso Lowest powero Smallest sample size (i.e., best chance of finding
efficacy early)
• O'Brien-Fleming and Fleming-Harrington-O'Brieno Similar results across measures and assumptions
O'Brien-Fleming boundary is more commonly used

Effect of Interim Monitoring for Efficacy (Without Sample Size Re-estimation or Futility Monitoring)
• Ending sample size < 35 per group because we can stop at earlier interim points when results are significant
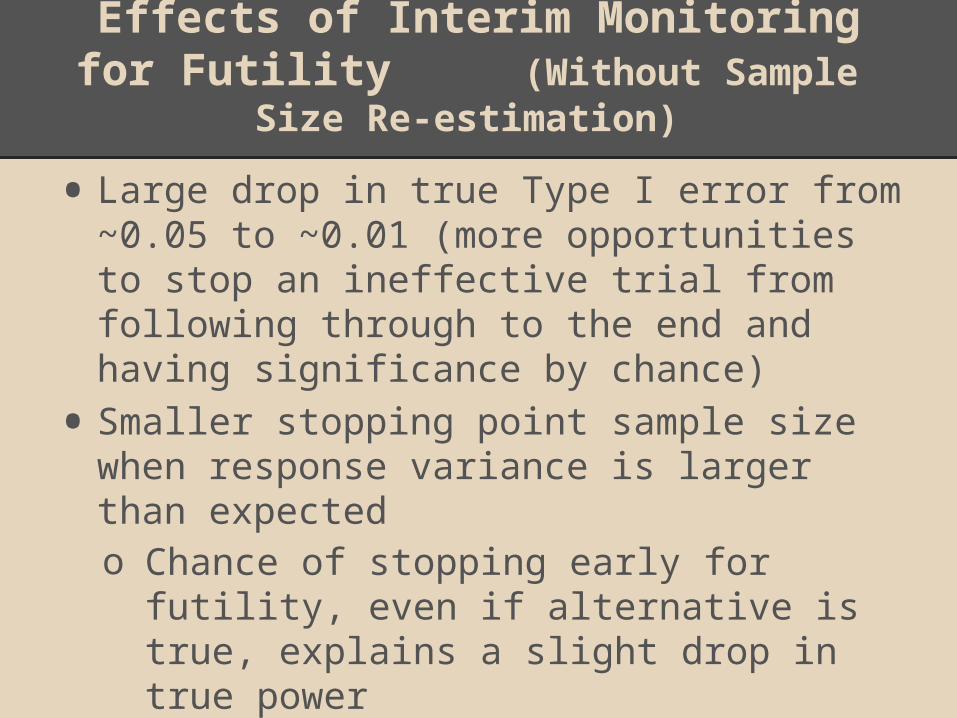
Effects of Interim Monitoring for Futility (Without Sample Size Re-
estimation)
• Large drop in true Type I error from ~0.05 to ~0.01 (more opportunities to stop an ineffective trial from following through to the end and having significance by chance)
• Smaller stopping point sample size when response variance is larger than expectedo Chance of stopping early for futility,
even if alternative is true, explains a slight drop in true power

Effects of Interim Monitoring for Futility (Without Sample Size Re-
estimation)


Effects of Sample Size Recalculation
• If initial estimate of treatment response variance was too high, recalculation tends to decrease the ending sample sizeo Likewise, underestimated variance
leads to a larger required sample size
• Recalculation also maintains power of trial better even when initial estimate of variance is too low

Effects of Sample Size Re-estimation (Without Futility
Monitoring)


Overall Evaluation of Our Design
These characteristics show the design's potential value in Phase II trials:
• Minimizes Type I error rate
• Maintains power when variance estimate is too low
• May decrease sample size required to reach a conclusion
Limitations:
• Sample size re-estimation potentially increases cost

How Does Our Design Compare toInterim Monitoring for Efficacy Alone?
• If assumptions are accurate, with our design: o Median ending sample size is smallero Power is slightly lower, but comparableo Type I error rate is lower (important for Phase 2
trials)
• If assumptions are inaccurate (overestimated effect size and underestimated variance):o Ending sample size tends to be larger (more
expensive)o Power is higher (though overall both are much
lower)o Type I error rate is lower
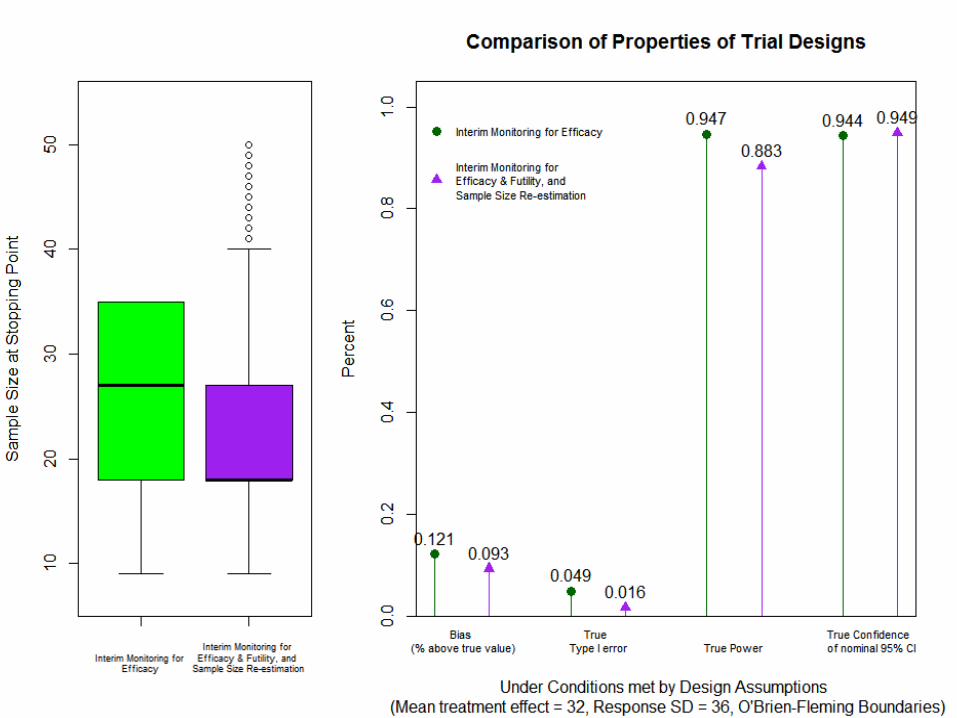

O'Brien-Fleming Graphs

Conclusion:"Is our design better for the motivating
study?"
Yes!
• Minimizing Type I errors is important in Phase II trials, which is achieved in our design
• Treatment effect and response variance are not easily estimated in the motivating studyo Our design's ability to maintain power and keep
error rates low even with inaccurate design assumptions is beneficial
Limitation:
• Potential for higher re-estimated sample size may increase cost of trial

Acknowledgements
• The Iowa Summer Institute for Biostatistics program
• Dr. Kathryn Chaloner and the entire University of Iowa Biostatistics department
• My research partner Kamrine Poels at the University of Arizona
• The Carleton Math Department