Evaluating a new Approach for Improving Care in an Accident and Emergency Department The NU-Care...
38
Evaluating a new Approach for Improving Care in an Accident and Emergency Department The NU-Care project The 2004 Healthcare Conference 25-27 April 2004, Scarman House, University of Warwick
-
Upload
matthew-hicks -
Category
Documents
-
view
216 -
download
1
Transcript of Evaluating a new Approach for Improving Care in an Accident and Emergency Department The NU-Care...

Evaluating a new Approach for Improving Care in an Accident and Emergency
Department The NU-Care project
The 2004 Healthcare Conference
25-27 April 2004, Scarman House, University of Warwick

NU-Care project
Significance of the NU-Care Project Method of approach Evaluation results Wider implications

Government Policy
Make the NHS better for everyone Improve in out-of- hours access to urgent care improve in A&E completion times
Overall verdict
Response times improved Patient satisfaction Staff endorsement partially met Cost neutrality Clinical assessment system

Basic structure of an A&E department
discharge discharge
admission
referral
death
arrival registration triage cliniciantests &treatments
elapsed time

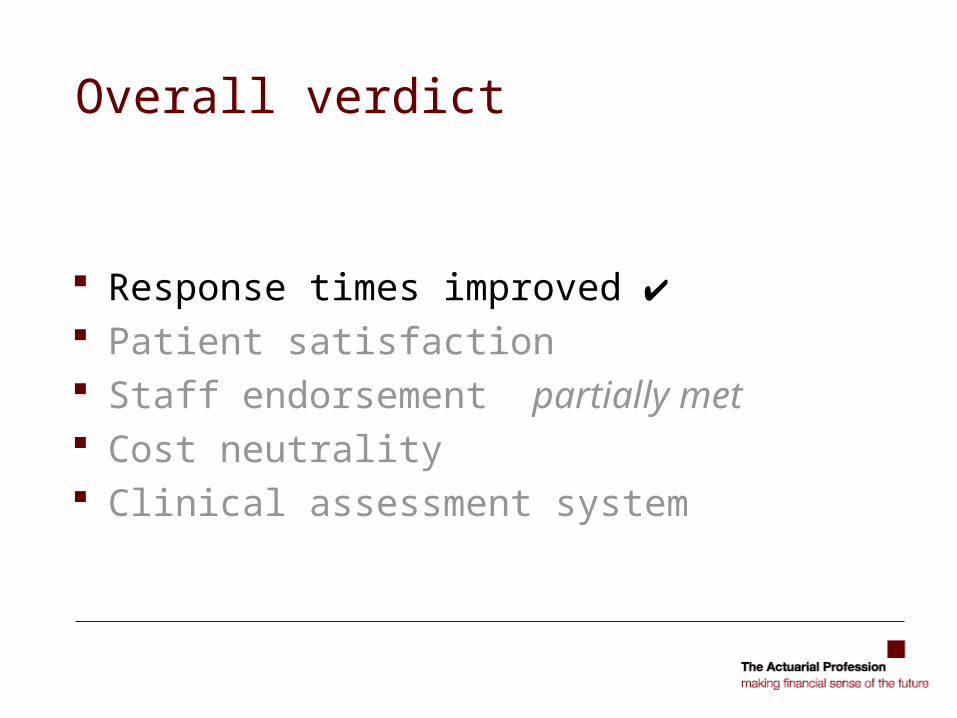
Overall verdict
Response times improved Patient satisfaction Staff endorsement partially met Cost neutrality
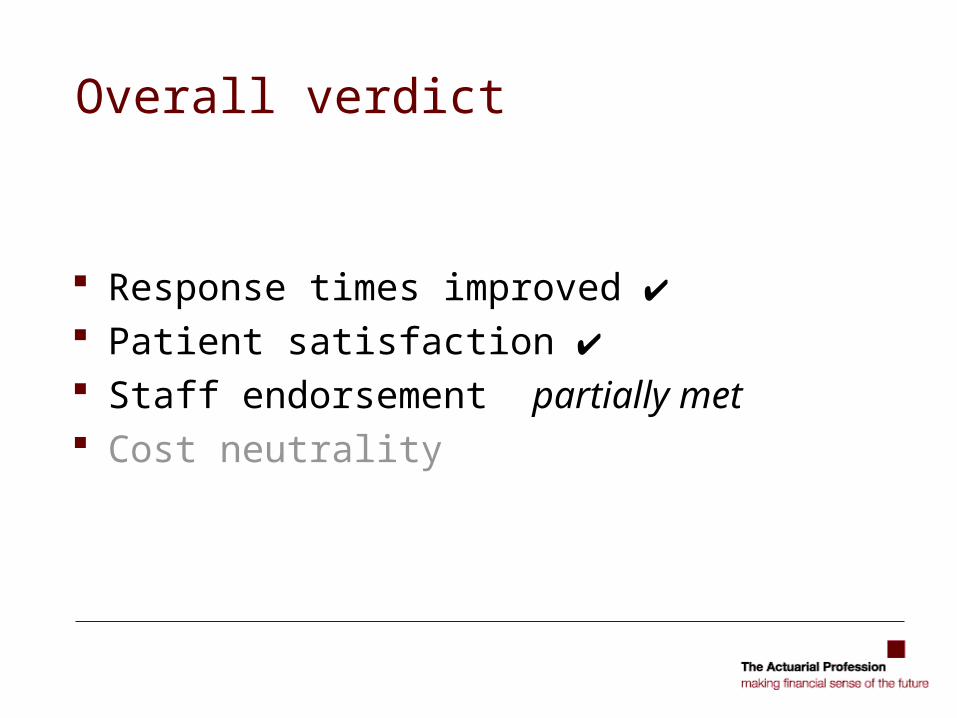
Overall verdict
Response times improved Patient satisfaction Staff endorsement partially met Cost neutrality

Overall verdict
Response times improved Patient satisfaction Staff endorsement partially met Cost neutrality

Key results
Response times Cut by half Higher throughput Fall in absconder rate Overcrowding eliminated
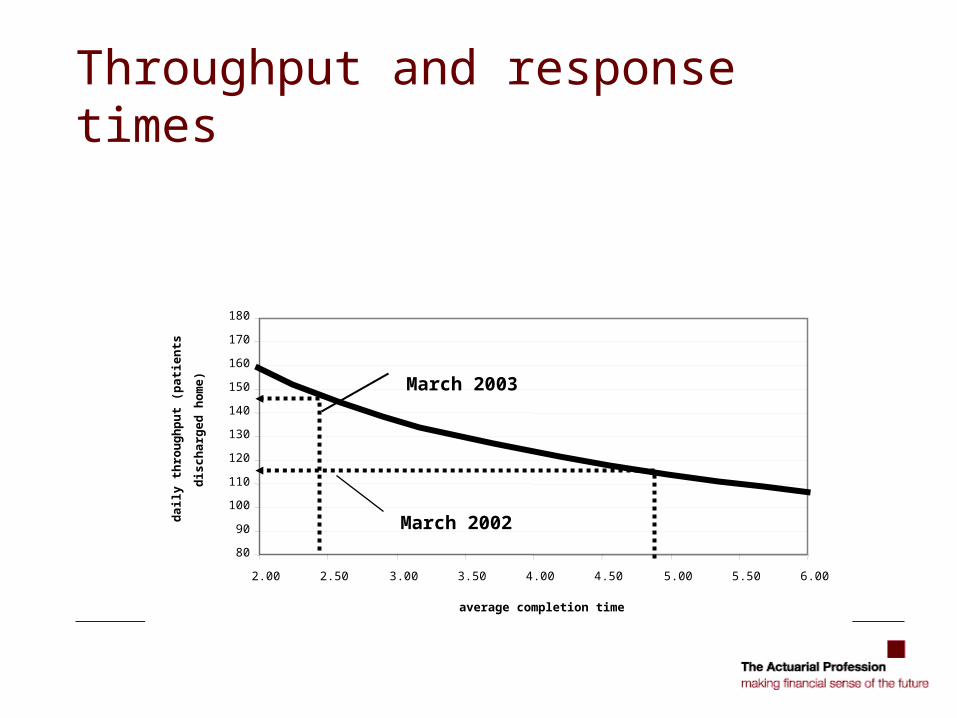
Throughput and response times
80
90
100
110
120
130
140
150
160
170
180
2.00 2.50 3.00 3.50 4.00 4.50 5.00 5.50 6.00
average completion time
da
ily t
hro
ug
hp
ut
(pa
tien
ts
dis
ch
arg
ed
ho
me
)
March 2002
March 2003

Absconders
80
90
100
110
120
130
140
150
160
170
180
2.00 2.50 3.00 3.50 4.00 4.50 5.00 5.50 6.00
average completion time
da
ily t
hro
ug
hp
ut
(pa
tien
ts
dis
ch
arg
ed
ho
me
) March 2002March 2003

Ready reckoner
02:00
02:30
03:00
03:30
04:00
04:30
05:00
05:30
06:00
00:00 01:00 02:00 03:00 04:00 05:00 06:00 07:00 08:00 09:00 10:00 11:00 12:00 13:00 14:00
time (hours:minutes)
aver
age
com
ple
tio
n t
ime
(ho
urs
:min
ute
s)
10% 50% 70% 75% 80% 85%90%
March 2003
March 2002
National target

Performance on matched days 2002/03
01:00
02:00
03:00
04:00
05:00
06:00
07:00
08:00
09:00
S S M T W T F S S M T W T F S S M T W T F S S M T W T F S S
day of the week
av
era
ge
co
mp
leti
on
tim
e (
ho
urs
:min
ute
s)
March 1st- March 30th 2003
March 2nd-March 31st 2002

Patients’ comments on waits (before)
Terrible. Three hours waiting with a baby of one year old is beyond belief.If you had more doctors we wouldn’t have to wait so long to be seen. First was 4 hours after arriving. Two hours later the medical team came…..We pay a lot of National Insurance.

Patients’ comments on waits (after)
Waiting times much better…… very nice doctorsService was very good and prompt. The ambulance was quick. All services were very good.I am happy to see a huge change in timing as I was seen sooner.

Bottlenecks
Key issues -1 Triage
“Very dissatisfied -14 month child with head injury. Waited 2 hours to see triage nurse”.
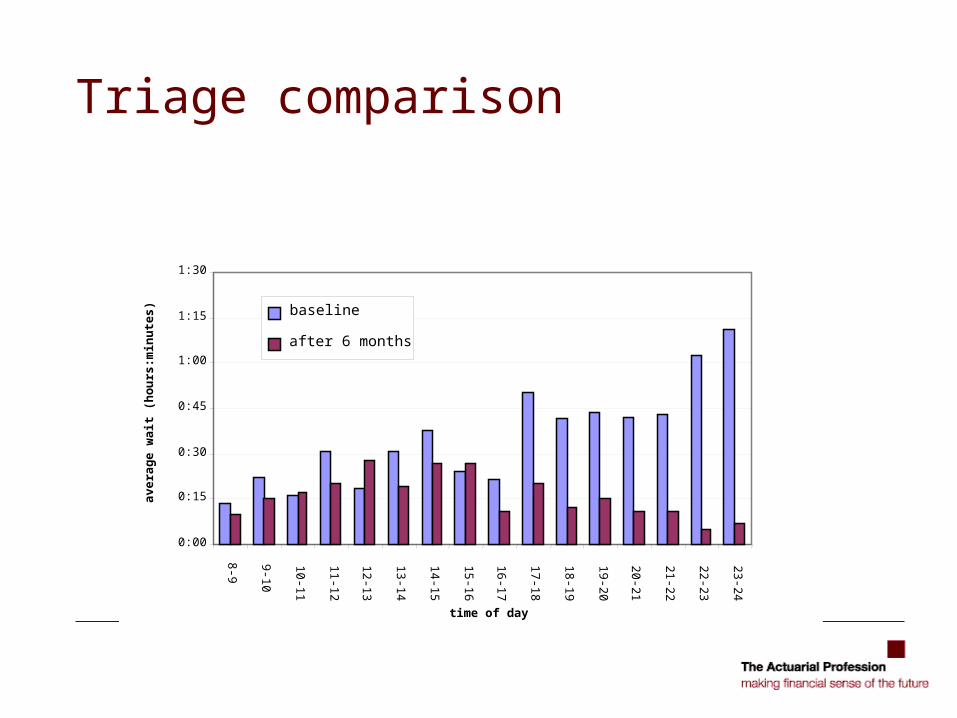
Triage comparison
0:00
0:15
0:30
0:45
1:00
1:15
1:30
8-9
9-10
10
-11
11
-12
12
-13
13
-14
14
-15
15
-16
16
-17
17
-18
18
-19
19
-20
20
-21
21
-22
22
-23
23
-24
time of day
av
era
ge
wa
it (
ho
urs
:min
ute
s)
baseline
after 6 months

Managing Triage
0
1
2
3
4
5
6
7
8
9
10
0 10 20 30 40 50 60 70 80 90 100 110 120
expected waiting time (minutes)
pat
ien
ts w
aiti
ng 1234

Bottlenecks
Key issues -1 Triage
“What’s the point of the triage nurse when after waiting an hour the sisters ask exactly the same questions then say exactly the same things. It seems like needless red tape”.

Streaming
Key issues -1 Triage
Average timefrom arrival to
triage (A)
Average timefrom triage toclinician (B)
Average timefrom arrival toclinician (A+B)
Total time indepartment
No NU-Care & no streamingA&E 00:39 01:21 02:00 03:32NU-Care n.a. n.a. n.a. n.a.
NU-Care with no streamingA&E 00:34 01:27 02:01 03:15NU-Care 00:44 00:43 01:27 01:44
NU-Care with initial streamingA&E 00:20 00:41 01:01 01:46NU-Care n.a. n.a. 00:22 00:44

Bottlenecks
Key issue -2 Waiting for a clinician
“If you had more doctors we wouldn’t have to wait so long to be seen. First was 4 hours after arriving. Two hours later the medical team came, and almost two hours later seen by ENT”.

Clinician waits
0:00
0:30
1:00
1:30
2:00
2:30
3:00
3:30
8-9
9-10
10-11
11-12
12-13
13-14
14-15
15-16
16-17
17-18
18-19
19-20
20-21
21-22
22-23
23-24
time of day
aver
age
wai
t (h
ou
rs:m
inu
tes)
baseline
after 6 months

Staff on duty
0
5
10
15
20
25
30
00:00
S
12:00
S
00:00
M
12:00
M
00:00
T
12:00
T
00:00
W
12:00
W
00:00
T
12:00
T
00:00
F
12:00
F
00:00
S
12:00
S
time of day
sta
ffin
g l
ev
el
six-month stage
baselineA AB

People in the system
0
10
20
30
40
50
60
70
80
90
100
00:00M
12:00M
00:00T
12:00T
00:00W
12:00W
00:00T
12:00T
00:00F
12:00F
00:00S
12:00S
00:00S
12:00S
00:00M
12:00M
00:00T
12:00T
time of day
nu
mb
er o
f p
atie
nts
in s
yste
m
weekendsmid-week

Bottlenecks
Key issues -3 Diagnostic tests
“Waited four hours for blood results!”

Test waits
00:00
00:15
00:30
00:45
01:00
01:15
01:30
01:45
02:00
8-9
9-10
10
-11
11
-12
12
-13
13
-14
14
-15
15
-16
16
-17
17
-18
18
-19
19
-20
20
-21
21
-22
22
-23
23
-24
time of day
ave
rag
e d
ura
tion
(ho
urs:
min
ute
s)
baseline
after 6 months

Admissions to wards
Key issue -4 Admissions to wards
“Whilst everyone who dealt with my mother was helpful and efficient it was the sheer time that upset. Arriving at 15:00 we are still waiting for a bed to be allocated at 22:00. We are thirsty and hungry”.
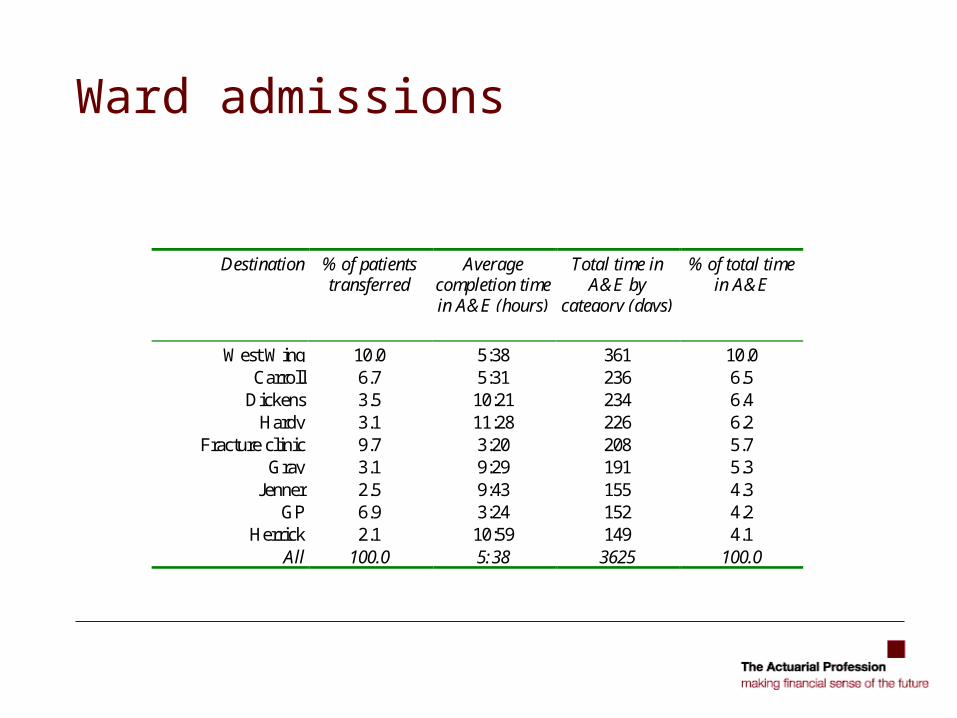
Ward admissions
Destination % of patientstransferred
Averagecompletion timein A&E (hours)
Total time inA&E by
category (days)
% of total timein A&E
West Wing 10.0 5:38 361 10.0Carroll 6.7 5:31 236 6.5
Dickens 3.5 10:21 234 6.4Hardy 3.1 11:28 226 6.2
Fracture clinic 9.7 3:20 208 5.7Gray 3.1 9:29 191 5.3
Jenner 2.5 9:43 155 4.3GP 6.9 3:24 152 4.2
Herrick 2.1 10:59 149 4.1All 100.0 5:38 3625 100.0
March to September 2002

Decision to admit
0
2
4
6
8
10
12
14
time of day
pe
rce
nta
ge
fre
qu
enc
y

Summary at 6 month stage - patients discharge home
discharge
discharge
home
arrival registration triage cliniciantests &treatments
elapsed time
54 mins
43 mins
5 mins
2 mins
33 mins
19 mins
1:56 hours
1:07 hours
baseline
6-monthstage
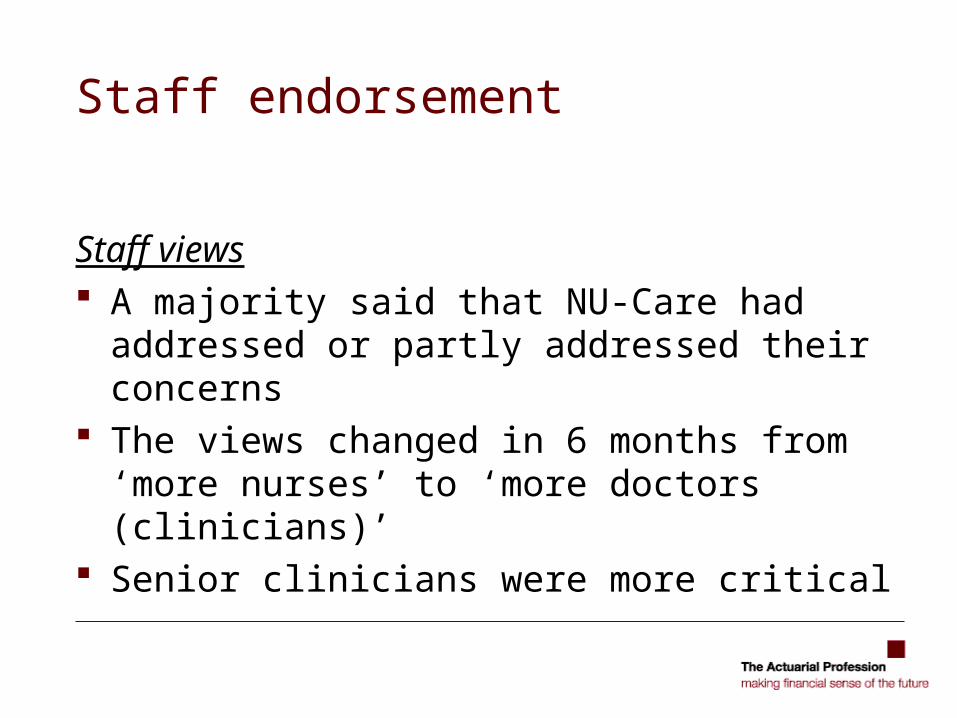
Staff endorsement
Staff views A majority said that NU-Care had addressed or
partly addressed their concerns The views changed in 6 months from ‘more
nurses’ to ‘more doctors (clinicians)’ Senior clinicians were more critical

Economic evaluation
Cost neutrality Ongoing costs of £650k a year Time savings to patients of £1.4m a year No attributable impact on the wider health economy of
NU-Care Productivity improvements No significant impact on pattern of repeat visits Reduced overcrowding

Overall satisfaction (before)
A nightmare experience of uncertainty.
Very, very, very dissatisfied.
It’s too much like a third world country.
In general service poor. I hope the NHS improves for everyone.

Overall satisfaction (after)
Patient’s son is very impressed with the whole service.…..No complaints whatsoever.
All staff very polite and efficient, I am pleased with the service, many thanks.
Patient’s husband very happy with service. They don’t bother with GP as GP is not very good!

Queuing model
0
0.1
0.2
0.3
0.4
0.5
0.6
0.7
0.8
0.9
1
0 1 2 3 4 5 6 7 8 9 10 11 12 13 14 15
time to completion (z hours)
p(z
)
1s
7s
0
1
2
3
4
5
6
7
8
9
10
0 1 2 3 4 5 6 7 8 9 10 11 12 13 14 15
time taken to clear given pecentage (hours)
aver
age
com
ple
tio
n t
ime
(ho
urs
)
10% 50%
90%
75%
0
0.05
0.1
0.15
0.2
0.25
0.3
0.35
0.4
0.45
0.5
0 2 4 6 8 10 12 14 16 18 20
arrivals per hour
pro
bab
ility
> X
pat
ien
ts in
th
e sy
stem
1 hour1.5 hours2 hours2.5 hours3 hours3.5 hours4 hours
A
B
C

Scientific legacy
How to measure activity in A&E departments Combining wide range of research techniques,
quantitative and qualitative Use of modelling techniques especially
queuing theory

Outstanding issues
Sustainability Further efficiencies Model of service Better use of information Computer decision support systems

Overall verdict
Response times improved Patient satisfaction Staff endorsement partially met Cost neutrality Clinical assessment system