EVA C. BUECHEL CLAUDIA TOWNSEND - Marketing Department · 2020-01-07 · EVA C. BUECHEL CLAUDIA...
73
1 Buying Beauty for the Long Run: (Mis)predicting Liking of Product Aesthetics EVA C. BUECHEL CLAUDIA TOWNSEND Accepted at Journal of Consumer Research
Transcript of EVA C. BUECHEL CLAUDIA TOWNSEND - Marketing Department · 2020-01-07 · EVA C. BUECHEL CLAUDIA...
1
Buying Beauty for the Long Run: (Mis)predicting Liking of Product Aesthetics
EVA C. BUECHEL
CLAUDIA TOWNSEND
Accepted at Journal of Consumer Research
2
Eva C. Buechel ([email protected]) is Assistant Professor of Marketing, Moore School
of Business, University of South Carolina, 1014 Greene Street, Columbia, SC 29208.
Claudia Townsend ([email protected]) is Associate Professor of Marketing, School of
Business Administration, University of Miami, 5250 University Drive, P.O. Box 248147, Coral
Gables, FL 33124. The authors thank Ben Borenstein, Vamsi Kanuri, and the behavioral labs at
the University of Miami and the Moore School of Business for their help with data collection.
They thank Chris Janiszewski, Anastasiya Pocheptsova Gosh, the editor, the associate editor, and
the three reviewers for their helpful comments on previous versions of the manuscript.
Supplementary materials are included in the web appendix accompanying the online version of
this article.
3
Abstract
How well can consumers predict future liking of different product designs? The present
research identifies a systematic error in consumers’ preferences and predicted liking for product
aesthetics. Consumers predict a faster decrease in liking for high (vs. low) arousal potential
product designs (i.e., intense colors or intense patterns) over repeat exposure because high
arousal potential designs are expected to become increasingly irritating. These predictions are
misguided, however, falsely leading consumers to avoid products with high arousal potential
designs when making decision for extended product use. Seven studies test this
conceptualization in the lab and in the field. The first five studies examine predicted liking for
product designs of varying arousal potential levels over repeat exposure and how these intuitions
influence product design preferences for long (vs. short) term use. The last two studies then
investigate the accuracy of these intuitions by directly comparing predicted versus experienced
liking for product designs of varying arousal potential levels over repeat exposure. The studies
reveal a systematic error in prediction whereby consumers overestimate satiation from high
arousal potential product designs. Managerial and theoretical applications are discussed.
Keywords: Affective Forecasting, Predicted and Experienced Utility, Aesthetics, Product
Design, Visual Satiation
4
The cars we drive, the toothbrushes in our medicine cabinets, and the couches in our
living rooms are all examples of products we purchase one day and then repeatedly see for
months or even years to come. Thus, for any durable good, consumers must not only identify
their current preferences, but also predict if and how these preferences may change over time.
After all, the quality of consumer decisions depends on the accuracy of these predictions
(Kahneman and Snell 1992).
One increasingly important product attribute that consumers are tasked to consider when
making these predictions is product aesthetics. Indeed, because it is increasingly difficult to
differentiate products solely on the basis of function, marketers are becoming ever more
cognizant of the impact of aesthetic design elements - such as color and pattern - on decision-
making (Hoegg and Alba 2008; Page and Herr 2002; Patrick and Peracchio 2010; Townsend and
Shu 2010; Yamamoto and Lambert 1994). An important question is therefore how well
consumers can predict future liking for different product designs.
We know from prior research that consumers have difficulty predicting hedonic value
(Wilson and Gilbert 2003, 2005) and that they have erroneous beliefs about how it changes over
time (Kahneman and Snell 1992; Snell, Gibbs, and Varey 1995; Wilson and Gilbert 2003, 2005).
Yet, most of this research has focused on the accuracy of forecasting affective reactions to non-
sensory stimuli, whereas research comparing predicted and experienced liking of sensory stimuli
is surprisingly inconsistent and sparse. For example, research in this area has not yet investigated
how characteristics of sensory stimuli (e.g., their intensity) might influence predicted and
experienced hedonic value. And despite the importance of aesthetics in marketing and consumer
decision-making, previous research has not systematically examined the accuracy of consumers’
predictions about the dynamics of hedonic value in the visual domain.
5
To fill these gaps, the present research examines how visual stimuli characteristics
influence predicted and experienced satiation to product aesthetics. Specifically, we focus on two
common and important product design elements: the intensity of color and the intensity of
pattern. We examine how a design’s potential to arouse (i.e., its intensity) differently influences
predicted versus experienced liking over repeat exposure and how these differences impact the
nature and quality of consumer decision-making. We show that consumers anticipate that high
(vs. low) arousal potential designs will lead to greater irritation and, as a result, faster decrease in
liking over repeat exposure. Consequently, consumers tend to choose simple (i.e., low arousal
potential) over intense (i.e., high arousal potential) designs when making decisions for products
with extended use. Further, we demonstrate these predictions and product preferences to be
misguided. Contrary to consumers’ intuitions, experienced liking decreases at a slower rate for
high (vs. low) arousal potential designs, leading to errors in predicted utility and suboptimal
decision-making.
In doing so, we make at least two significant contributions to the understanding of how
consumers predict and experience hedonic value. Substantially, we are the first to examine how
and how well consumers predict their hedonic responses to product design (and visual stimuli
more generally), a sensory stimulus that is important to consumers and marketers (Hoegg and
Alba 2008; Page and Herr 2002; Patrick and Peracchio 2010; Townsend and Shu 2010;
Yamamoto and Lambert 1994). Theoretically, we are the first to examine how tractable
differences in stimuli characteristics, in this case their arousal potential (i.e., intensity),
differently influence predicted and experienced hedonic value over time, thus shaping
forecasting errors. And while we focus our investigation on the visual domain, and more
specifically colors and patterns, our findings may potentially be extrapolated to other equally
6
poorly understood sensory stimuli and other sources of arousal potential. Next we provide an
overview of previous research on the dynamics of predicted and experienced hedonic value over
time. We then focus on the concept of arousal potential to understand how it may differently
influence hedonic value in prospect and experience.
DYNAMICS OF HEDONIC VALUE
Repeat exposure can change the subjective experience of a stimulus (Redden 2015).
Subjective hedonic intensity1 (i.e., the strength of the psychological response) of a stimulus can
decrease (adaptation, habituation, or desensitization) or increase (sensitization) as a function of
exposure (Frederick and Loewenstein 1999; Redden 2015). For most stimuli and circumstances,
hedonic adaptation is the norm (Nelson and Meyvis 2008; Redden 2015). People adapt to
numerous stimuli and circumstances, including smells, pains, wealth, incarceration, and even
paraplegia (for a review, see Frederick and Loewenstein 1999). Notably, there are also instances
where hedonic adaptation is absent or where the subjective intensity of a stimulus increases over
time (i.e., sensitization; Weinstein 1982). For example, individuals have been shown to have
difficulty adapting to traffic noise (Weinstein 1982) and exhibit sensitization to dormitory noises
(Weinstein 1978) and sexual stimuli (Heiman 1977; Laan, Everaerd, and Evers 1995).
Given that our decisions about which products to buy are based, in part, on our
predictions about how these products will make us feel over time, it is important for consumers
to be able to predict the direction of hedonic value (i.e., whether adaptation or sensitization
1While for sensory stimuli these changes over repeated exposure can also occur on a neural level (i.e., the firing of sensory neurons can change over time), we describe changes in the corresponding psychological response that determine the subjective hedonic experience of the stimulus.
7
occurs) and the rate with which hedonic value changes over time. Yet, while we know that
people are generally not very adept at predicting hedonic value (Wilson and Gilbert 2003, 2005),
many aspects of hedonic value in prospect and experience are still poorly understood.
Most existing work on predicted and experienced hedonic value has focused on stimuli in
the non-sensory domain. Specifically, research on affective forecasting suggests that in many
cases, people overestimate how much and for how long products, events, and circumstances will
impact their happiness and well-being (for overviews see Wilson and Gilbert 2003, 2005;
Buechel, Morewedge, and Zhang 2017). Research in this area has uncovered several sources for
this forecasting error. Most relevant to the present investigation is the finding that forecasters
underestimate hedonic adaptation to future events, either because they overlook their ability to
rationalize, make sense of, and cope with changes in their environment (i.e., immune neglect;
Gilbert et al. 1998) or because they neglect to incorporate beliefs about adaptation into
judgments and decisions (Wang, Novemsky, and Dhar 2009).
In contrast to the rich body of work on affective forecasting in the non-sensory domain,
there is little research comparing predicted and experienced liking for sensory stimuli over repeat
exposure2 – the specific topic of the present research. Perhaps the most comprehensive and
relevant investigation in the domain of sensory stimuli is that of Kahneman and Snell (1992),
who directly compared predicted and experienced liking of isolated gustatory and auditory
stimuli over time. In each of two experiments, participants first predicted and then reported their
liking for one auditory stimulus (music) and one gustatory stimulus (bland yoghurt or ice cream,
respectively), which were simultaneously experienced in a lab session over seven consecutive
2Note that in the context of liking of sensory stimuli, adaptation occurs when a liked stimulus is liked less over time (i.e., referred to as satiation) or when a disliked stimulus is liked more over time. Sensitization describes an increase in liking of a liked stimulus, and a decrease in liking of a disliked stimulus.
8
days. They found that participants correctly anticipated that they would adapt to the taste of ice
cream and the sound of music, such that liking of the stimuli would decrease over time, but
overestimated how much they would adapt to both of these stimuli. That is, they predicted liking
to decrease more than it actually did. This finding mirrors earlier research in the negative
domain, suggesting that people overestimate to what extent they will adapt to some noises
(Weinstein 1982). For the yoghurt, however, the pattern differed. Kahneman and Snell’s
participants anticipated the tastiness of the unpalatable yoghurt to grow increasingly unpleasant
(i.e., sensitization), while experience ratings revealed the taste to become increasingly pleasant
over time (i.e. adaptation). In other words, unlike errors found in the non-sensory domain, which
consistently finds underestimation of adaptation, errors in the sensory domain are less systematic
and more poorly understood: participants either overestimated adaptation (in the case of music
and ice cream) or failed to predict even the direction of how hedonic value would change over
time (in the case of yoghurt).
Work building on this initial and (relatively rudimentary) understanding of predicted and
experienced utility in the sensory domain has largely focused on how consumers mispredict to
what extent external and contextual factors influence enjoyment of sensory stimuli. For instance,
consumers fail to predict how other present and previously experienced stimuli influence
enjoyment of sensory stimuli (Morewedge et al. 2010; Novemsky and Ratner 2003; Ratner,
Kahn, and Kahneman 1999), and fail to intuit that inserting breaks into auditory and somatic
experiences will disrupt adaptation (Nelson and Meyvis 2008).
What has received little to no attention, however, is to what extent stimuli characteristics
(e.g., the intensity of the stimulus) influence predicted versus experienced liking over time.
9
Moreover, no research has compared predicted and experienced liking of visual stimuli over
time.
In the following, we will argue that the arousal potential of stimuli (i.e., their intensity)
differently influences liking of sensory stimuli in prospect and experience. We conduct our
investigation in the marketing relevant domain of visual stimuli, focusing on color and pattern as
the sources of intensity. Note, however, that our conceptualization may potentially generalize to
other sensory stimuli and others sources of intensity that are currently equally poorly understood,
as we further discuss in the General Discussion.
AROUSAL POTENTIAL IN VISUAL STIMULI
In the present research, we examine predicted and experienced liking (i.e., the hedonic
response) as a function of stimulus intensity. Specifically, we focus on “arousal potential”, a
property of a stimulus that describes the degree with which it can disturb, alert, and arouse an
organism (Berlyne 1971, page 70). Stimuli that are intense, loud, colorful, novel, complex, or
difficult to process, for example, have greater potential to arouse (Berlyne 1960).
In our investigation, we examine arousal potential in the domain of visual sensory
stimuli by focusing on two common product designs elements: color and pattern. We do this for
two reasons. First, color and pattern are of practical importance for consumer behavior because
both have a strong impact on overall beauty and aesthetics, an important but understudied
criterion by which consumers evaluate products (Alba and Williams 2013; Hagtvedt and Brasel
2017; Hoegg and Alba 2008; Page and Herr 2002; Patrick and Peracchio 2010; Postrel 2003;
Townsend and Shu 2010; Yamamoto and Lambert 1994). Second, color and pattern together
10
offer a broad theoretical examination of “arousal potential” within the context of visual
aesthetics (Berlyne, 1971; Hagtvedt and Brasel 2017). Colors vary in their arousal potential
primarily via saturation – the amount of pigment in a color – with highly saturated colors being
more vivid, pure, bright, and colorful (i.e., they have higher chroma3; Küller, Mikellides, and
Janssens 2009; Zielińki 2016), thus increasing their potential to alert and arouse an organism
(Hagtvedt and Brasel 2017; Labreque and Milne 2012; Valdez and Mehrabian 1994). Patterns
vary in their arousal potential via their complexity, amount of contrast, puzzlement, or visual
busyness (Cox and Cox 2002), again increasing the potential to alert and arouse (Berlyne 1971).
Indeed, higher levels of both types of design elements (i.e., brighter and more saturated colors;
more complex patterns) have repeatedly been shown to lead to greater measured physiological
arousal (Baker and Franken 1967; Berlyne 1970; Berlyne and McDonnel 1965; Holtzschue 2011;
Küller, Mikellides, and Janssens 2009; Nicki and Gale 1977; Zielińki 2016) and greater self-
reported arousal (i.e., they are rated as more arousing, exciting, attention-grabbing, anxiety-
producing, upsetting, and less calming; Hagtvedt and Brasel 2017; Janiszewski and Meyvis
2001; Labreque and Milne 2012; Weller and Livingston 1988; Wright and Rainwater 1962;
Zielińki 2016). It is important to emphasize that while stimuli properties differ in their arousal
potential, a stimulus’ ability to arouse is not absolute (i.e., a certain level of saturation or pattern
structure does not necessarily correspond to a particular level of arousal response). Instead, the
response to a given stimulus’s properties might differ from one situation to another and from one
individual to another (Berlyne 1971).
3 Two important dimensions of color are the hue (wavelength) and the chroma (saturation), whereby lower chroma is associated with less pure colors (i.e., pastels or dark colors). According to our conceptualization, arousal potential is mostly determined by chroma, whereby arousal potential is higher for highly saturated colors. Nevertheless, it is important to highlight that within hue – thus keeping saturations constant – there can be differences in arousal potential such that longer wavelengths (e.g. red) are associated with higher arousal compared to shorter wavelengths (e.g. blue; Walters, Apter, and Svebak 1982). These differences, however, are much subtler than the more extreme differences in saturation (Küller, Mikellides, and Janssens 2009; Zielińki 2016). Our investigation thus focuses on chroma.
11
Critically, an examination of previous research suggests that arousal potential might
influence predicted liking and experienced liking differently. Specifically, while little research
has directly compared predicted and experienced liking over time in the sensory domain,
research examining each separately points to important discrepancies in how they may be
influenced by arousal potential. We first review literature on predicted liking and then turn to the
literature on experienced liking.
Arousal Potential and Predicted Liking of Product Design Elements
Snell and colleagues (1995) investigated consumer intuitions about how hedonic value
changes over time for a variety of stimuli (e.g., pains, noises, tastes, and smells). A broad
consideration of all previously studied stimuli reveals that expectations of adaptation seem to
generally prevail (in line with Frederick and Loewenstein 1999; Nelson and Meyvis 2008;
Redden 2015): Consumers anticipate positive stimuli to become less pleasant and negative
stimuli to become less unpleasant over time. Importantly, though, if one limits the scope to
sensory stimuli that one might categorize as having high arousal potential, a different pattern
emerges; decision-makers seem to anticipate sensitization for this type of stimuli. For example,
while not noted by the authors, a post-hoc categorization of different types of noises included in
Snell and colleagues’ investigation reveals that participants seem to intuit adaptation for low
arousal noises (e.g., noise from a highway) but to intuit sensitization for high arousal noises (e.g.,
a loud stereo, high-pitched noise, or a pneumatic drill), such that these noises become more
unpleasant over time. Likewise, Nelson and Meyvis (2008) found that consumers expected an
annoying (i.e., high arousal potential) noise to become increasingly irritating over time.
12
Based on this suggestive (and admittedly limited) evidence in the domain of auditory
stimuli, we conjecture that a similar pattern may emerge for visual stimuli. We speculate that
consumers will anticipate greater sensitization for high arousal potential design elements than
low arousal potential design elements. Specifically, we expect that consumers anticipate high
arousal potential design elements (intense colors and patterns) to become increasingly arousing
(i.e., they intuit sensitization). That is, while the stimulus (i.e., the design) stays constant over
time, consumers anticipate that they will become increasingly sensitive to it such that the
design’s subjective ability to arouse will increase with exposure. Furthermore, we suggest that
consumers expect this increase in arousal over time to eventually become unpleasant, such that
these product designs grow to be increasingly aversive and irritating (Berlyne 1970; Bornstein
1989; Nelson and Meyvis 2008). We expect that this anticipated irritation, in turn, leads
consumers to anticipate faster decrease in liking (i.e., faster adaptation; more commonly referred
to as satiation in the context of sensory liking) from high (vs. low) arousal potential design
elements. We will use the term satiation to describe adaptation in our context of sensory liking
from here on out. More formally:
H1a: Consumers predict faster decrease in liking over repeat exposure (i.e., faster
satiation) for high arousal potential design elements (intense colors and patterns) than for
low arousal potential design elements.
H1b: Consumers predict greater increase in irritation over repeat exposure (i.e.,
sensitization) for high (vs. low) arousal potential design elements.
H1c: Predicted increase in irritation (i.e., sensitization) mediates predicted decrease in
liking (i.e., satiation) for high (but not for low) arousal potential design elements.
13
Moreover, we expect these predictions to influence pertinent consumer behaviors and
decisions. Specifically, consumers should be more likely to avoid products with high arousal
potential designs when purchasing products that are intended for extended use. We therefore
hypothesize the following:
H2a: Expected product exposure influences preferences for products, such that
preference for high (vs. low) arousal potential design elements decreases as exposure
increases.
H2b: Expectations of increased irritation (i.e., sensitization) and decreased liking (i.e.,
satiation) for high arousal potential design elements (see H1a-H1c) mediate this
preference.
These consumer intuitions, along with the resulting product preferences, we argue, may
be misguided. In contrast to the fairly sparse research on arousal potential and predicted liking
over time, there is a more extensive and reliable body of work suggesting that arousal potential
may curb experienced satiation over repeat exposure.
Arousal and Experienced Liking of Product Designs Elements
Past research on visual satiation shows that, as in other sensory consumption domains,
the intensity of liking of stimulus generally decreases as a function of exposure (i.e., satiation),
(Coombs and Avrunin 1977), be it photographs (Redden 2008) or geometric shapes (Cantor
1968). While this pattern of decreased liking is prevalent and considered the norm (Nelson and
Meyvis 2008), there is also evidence for the opposite pattern. Research on the mere exposure
effects shows that liking of visual stimuli can increase with repeat exposure (Zajonc 1968).
14
Reconciling both patterns, Berlyne and colleagues argue that the direction and the rate of
change in liking depend on the arousal potential of stimuli (Berlyne 1968, 1970; Berlyne and
Lawrence 1964; Berlyne and McDonnel 1965). Consumers experience greatest hedonic value
when arousal is at a moderate level (Wundt 1874), suggesting that optimal arousal occurs for
stimuli with medium arousal potential (Cox and Cox 2002). That is, stimuli should not be too
simple, making them boring and tedious, yet also not too complex, raising arousal to an
uncomfortable level (Berlyne 1970; Bornstein 1989). Importantly, repeat exposure to stimuli
generally decreases their subjective complexity and intensity and therefore their potential to
arouse (Cox and Cox 2002). For simple stimuli, repeat exposure quickly moves the stimuli away
from the optimal arousal potential, leading to boredom, tedium, and thus decreased liking
(Berlyne 1970). For equally liked intense and complex stimuli, repeat exposure moves the
stimuli toward optimal arousal potential, thus increasing liking. In line with this, mere exposure
effects have been shown to be strongest for unfamiliar and complex stimuli (Bornstein 1989).
For highly complex stimuli, a large number of exposures are necessary for subjective arousal
potential to decline enough to move past the optimal level, thus eventually decreasing liking
(Zajonc et al. 1972).
The stimuli and procedures used by Berlyne, Zajonc, and others to test this theory about
optimal arousal potential were relatively contrived and differed from the current investigation
(e.g., they used complexity rather than color and pattern). Thus, the inverted u-shape put forth by
Berlyne may be difficult to detect, especially considering the general pervasiveness of satiation
effects (Coombs and Avrunin 1977; Redden 2008). Still, the broad implication for product
aesthetics is that consumers may not satiate as quickly from high arousal design elements as they
15
expect. Moreover, consumers may satiate from high arousal designs similarly or even at a slower
rate than from low arousal designs. Specifically, we hypothesize the following:
H3: Consumers experience at least similar, if not slower, decrease in liking over repeated
exposure (i.e., slower satiation) from high arousal potential design elements than from
low arousal design elements.
Together with hypothesis 1a, positing that consumers intuit faster satiation for high
arousal design elements than for low arousal design elements, we therefore predict that:
H4a: Consumers overestimate decreases in liking over repeat exposure (i.e., satiation)
from high arousal potential design elements, leading to errors in predicted utility.
H4b: Overestimation of irritation over repeat exposure (i.e., sensitization) to high arousal
potential design elements mediates this effect.
Overview
Seven studies offer support for our hypotheses. The first three studies (pilot study, studies
1a and 1b) focus on product design preference as a function of anticipated product exposure. In
hypothetical (pilot study, study 1b) and real choice contexts (study 1a), they reveal that
consumers are more likely to avoid products with intense (i.e., high arousal potential) designs
when the product is intended for extended use (i.e., greater exposure; hypothesis 2a). The next
two studies more closely examine the process underlying this preference (hypotheses 1a-1c) by
showing that consumers anticipate greater irritation and faster satiation for products with high
(vs. low) arousal potential designs (study 2). Accordingly, they expect to use these products less
frequently and retain these products for a shorter period of time (study 3). Consistent with our
16
theory and proposed underlying process, we find that these latter two effects are particularly
pronounced among individuals who are more sensitive to and less comfortable with arousal
(study 3). The final two studies (studies 4 and 5) compare predicted and experienced liking of
high and low arousal potential design elements over repeat exposure to show that consumers
overestimate how much liking will decrease (i.e., satiation) for high arousal potential design
elements because they overestimate how much irritation will increase (i.e., sensitization) for
these designs, leading to errors in predicted utility (hypotheses 3 and 4).
We test our hypotheses using numerous design stimuli, with arousal potential stemming
from both color and pattern. Note that because perceived arousal potential is relative (vs.
absolute) and therefore might vary across contexts and individuals (Berlyne 1971), for each
study we used pretests to select stimuli such that they were equally liked but reliably differed in
arousal potential (high vs. low). Stimuli pretests, along with auxiliary information (ancillary
analyses, determination of sample sizes, preregistration reports, replications) can be found in the
Web Appendix.
PILOT STUDY: MULTI-CATEGORY EXPLORATION
In an initial pilot study, we examine product design preferences as a function of product
exposure across multiple product categories. We predicted that as expected exposure for a
product category increases (i.e., longer ownership; greater number of product exposures),
consumers would be less likely to select intense (i.e., high arousal potential) designs (hypothesis
2a). We test this prediction across 50 product categories, while at the same time controlling for
various alternative explanations that likely influence the choice of high arousal potential designs
17
in addition to our process. We expect the predicted relationship between expected exposure and
design choice to persist even in the presence of additional motives that may determine design
preference, which undoubtedly exist.
Methods
Participants consisted of 1818 U.S. Mturk workers (49.94% female, Mage = 35.18; SD =
10.95). Participants were randomly assigned to evaluate one of 50 product categories, which
were selected to represent a broad set of products that varied in usage length. (See Web
Appendix for complete list.) Participants were shown the product category and were asked to
imagine that they were “looking to get a new one” and to select one of 36 available designs for
the product. Product designs were selected based on pretests such that half of the designs were
considered to have high [vs. low] arousal potential, and such that the high and low arousal
potential designs did not differ on liking or attractiveness; see pretest in Web Appendix.
After making their choice, participants then responded to questions about the predicted
exposure, assuming they were to use the product in a typical manner. First, they rated expected
ownership length on a 12-point scale (1 = Less than 1 day [24 hours], 12 = More than 10 years).
Using a sliding scale (0 to 1,000), they then estimated the number of times they would see the
product before getting rid of it. Participants then completed an attention check (Oppenheimer,
Meyvis, and Davidenko 2009).
Subsequently, participants rated the extent to which the product category is consumed in
public (vs. private), should match the consumption environment (per Patrick and Hagtvedt
2011), is influenced by design trends, and whether there are norms dictating the product’s design
18
(1= No, not at all, 9 = Yes, very much; for each question participants were given a brief
description). These four questions served as control variables. Lastly, in this and all other studies
(except for study 1a), participants indicated their age and gender.
Results
We report the results for estimated view times (VT) and estimated product ownership
length (OL). For the OL measure we converted the 12-point scale into days using the midpoint of
the range associated with each scale point (e.g., 3 months - 6 months = 135 days). Given that all
high and low arousal designs are theoretically equivalent, in this and all further studies we
collapse across designs with the same arousal potential unless otherwise specified.
Choice. Individual binary logistic regressions revealed that estimated ownership length
(WaldOL = 78.34, p < .001, R2=.06) and number of view times (WaldVT = 64.04, p < .001,
R2=.04) both predicted a decreased preference for high arousal potential designs; see figure 1.
(For full category descriptions and category-level results, see Web Appendix). The result held
when both variables, along with their interactions, were included in the model (WaldOL = 9.61, p
< .001, and WaldVT = 4.40, p = .04, respectively; interaction Wald < 1; R2= .05).
---------------------------------
Insert figure 1 about here
--------------------------------
Importantly, both predictor variables, ownership length (WaldOL = 66.67, p < .001; R2 =
.08), and view times (WaldVT = 51.93, p < .001; R2 = .07) remained significant when the four
control variables were included in the respective models (public consumption [Wald = 1.82, p =
19
.18; Wald = 7.37, p = .01, respectively], environment matching [Wald = 57.42, p < .001, Wald =
55.38, p < .001, respectively], trends [Wald = 7.78, p = .005; Wald = 8.60, p = .003,
respectively], and norms [Wald = 6.96, p = .008; Wald = 7.23, p = .007], respectively).
Discussion
The results show that preference for high (vs. low) arousal potential designs decreases as
expected exposure to a product category increases, supporting hypothesis 2a. This is true when
expected exposure is operationalized as expected ownership length and when it is
operationalized as expected number of times the product is viewed. Moreover, both
operationalizations of product usage were significant predictors even when controlling for other
factors that likely also influence product design preference, such as considerations about public
consumption, matching the environment, trends, and norms. Thus, while certainly not the sole
driver of product design preference, expected exposure seems to be one driver of preference for
high versus low arousal product designs. Furthermore, while various alternative explanations
might explain the results for one or a few product categories, and while the pattern might not
hold for all product categories, the overall hypothesized trend exists across 50 product
categories.
STUDIES 1A AND 1B:
DESIGN PREFERENCES AS A FUNCTION OF CONSUMPTION DURATION
In study 1a and study 1b, we more directly examine how expected consumption duration
influences consumer preferences for product designs, namely whether consumers choose less
20
intense product designs (i.e., lower arousal potential) when making decisions for products with
higher expected exposure (hypothesis 2a). Unlike the pilot study, in studies 1a and 1b we keep
product category constant, directly manipulate product exposure, and examine its influence on
choice.
Study 1a: Field Study
Study 1a examines product design choice as a function of exposure in a consequential field
setting.
Methods
Participants were 186 undergraduates (41.40% female) enrolled in six sections of a
semester-long introductory business course at a large US university. Participants were in one of
two conditions (usage length: short, extended) in a between-subjects design.
Participants entered their classroom and were asked to select one of four nameplates to
write their name on, two of which featured a low arousal potential design (plain white or pale
green) and two of which featured a high arousal potential design (abstract pattern or strong
green); see Appendix for stimuli and see Study 1B, Study 5, and a conceptual replication of
Study 5 reported in Web Appendix for results repeatedly confirming that the stimuli differed in
arousal potential but not in initial liking.
In the short-usage condition, this choice occurred on a day on which students were to
make presentations. A note next to the nameplates said, “Pick a nameplate to use in today’s
21
class.” Students in this condition were told that the nameplates would be used during this one
class to aid students in calling on their classmates during the presentation and discussion. In the
extended-usage condition this occurred on the second day of a semester-long class. A note next
to the nameplates said, “Pick a nameplate to use in class this semester”. Students in this
condition were told that the nameplates would be used throughout the semester to aid the
professor and other students in calling on the students during lectures and class discussion. At the
end of each class, the professor collected the selected nameplates; in the extended-usage
condition, the nameplates were redistributed at the beginning of each subsequent class.
Results
Supporting hypothesis 2a, participants were less likely to select a high arousal potential
design when choosing a nameplate to use for the entire semester (30.85%) than when choosing
one to use for only one class (58.70%, χ2(1) = 14.59, p < .001).
Study 1b: Laboratory Study
Study 1b examines a product design choice similar to that in study 1a. However, study 1b
occurred in a lab setting, thus allowing for a deeper analysis of the drivers of the design choice in
three ways: First, study 1b teases apart whether the results observed in study 1a were due to
considerations about the usage time frame (1 day versus 3 months) or product exposure (1 class
vs. 26 classes). While often correlated in everyday life (longer usage period is generally
associated with greater exposure), we disentangle the two in this study by orthogonally
22
manipulating expected usage time frame and expected overall exposure. If, as we suggest, the
choice pattern we observed in study 1a was the result of greater anticipated satiation for high
arousal potential designs, then choice should be driven by expected exposure and not by
expected usage time frame. Second, study 1b provides process evidence by directly measuring
anticipated liking and anticipated irritation (hypothesis 2b). Third, we further test our process
against a variety of alternative explanations.
Methods
Participants were 295 undergraduates (52.1% female, Mage = 20.52; SD = 1.55), randomly
assigned to one of four conditions in a 2 (exposure: low, high) x 2 (time frame: short-term, long-
term) between-subjects design. Depending on condition, participants were asked to imagine they
had signed up for a course that either met for 5 hours over 4 days (i.e., one 1 hour and 15 minute
class a day for 4 days; low exposure, short-term condition), 5 hours over 12 weeks (one 1 hour
and 15 minute class every 4 weeks; low exposure, long-term condition), 30 hours over 4 days
(six 1 hour and 15 minute classes a day for 4 days; high exposure, short-term condition), or 30
hours over 12 weeks (two 1 hour and 15 minute classes a week for 12 weeks; high exposure,
long-term condition). To probe whether they had read the scenario instructions, participants were
asked to indicate which course descriptors matched the course described in the instructions: 5
hours, 30 hours, 12 weeks, 1 month (distractor), 4 days.
Participants were told that they would be using a nameplate, which would sit on the desk
in front of them throughout the duration of the course. They were then presented with a choice of
two nameplates, a randomly selected one of the two low arousal potential designs from study 1a
23
and a randomly selected one of the two high arousal potential designs from study 1a
(presentation order randomized).
After making their choice, participants rated their anticipated liking and anticipated
irritation for the high arousal potential item (target item) and then for the low arousal potential
item. Specifically, they indicated how much they would like the nameplate at the end of the
consumption period (i.e., the last class; 1 = Dislike very much, 9 = Like very much), and how the
nameplate would make them feel at the end of the consumption period (1 = Calm, 7 = Irritated;
see Nelson and Meyvis 2008; Zielińki 2016). In addition to this main irritation measure, to test
for generalizability of our irritation construct, we also asked participants to what extent the
design would be obnoxious, annoying, and irking at the end of the consumption period (1 = Not
at all, 7 = Very much; High arousal potential (HAP): α(4) = .91, Low arousal Potential (LAP):
α(4) = .93).
We then tested our process against a variety of alternative explanations by asking
participants to rate how much the following considerations influenced their choice (1 = Not at
all, 7 = Very): the extent to which the nameplate would become irritating (our process:
irritation), their confidence regarding the liking of the nameplate (confidence), opportunity to use
the nameplate (versatility), the extent to which the nameplate matches the environment
(matching), whether others would like the nameplate (others), and lastly, considerations about
standing out (stand out).
As a manipulation check, participants then rated the arousal potential of each nameplate
(order counterbalanced), namely whether the nameplate was intense, novel, colorful, complex,
and difficult to process (1= Not at all, 7 = Very much; adapted from Berlyne 1960; HAP: α(5) =
24
.65; LAP: α(5) = .83). Finally, participants estimated how much they would be exposed to the
nameplate (1= Very little, 7 = A great deal).
Results
Manipulation checks. A within-subject ANOVA revealed that the arousal potential index
was greater for the high arousal potential nameplates (M = 3.51, SD = 1.28) than for the low
arousal potential nameplates (M = 2.19, SD = 1.30; F(1, 289) = 155.78, p < .001, ηp2 = .35).
A between-subject ANOVA with the factors exposure and time frame on estimated
exposure revealed only a main effect of exposure such that the perceived exposure was greater in
the high exposure condition (M = 4.27, SD = 1.86) than in the low exposure condition (M = 3.71,
SD = 1.76; F(1, 289) = 7.04, p = .01, ηp2 = .02). There was no main effect of time frame (F < 1)
or exposure x time frame interaction (F(1, 289) < 2.70, p >.10).
Choice. Consistent with hypothesis 2a, participants in the two high exposure conditions
were less likely to choose the high arousal potential nameplate designs (30.4%) than participants
in the two low exposure conditions (46.9%; χ2 (N=295) = 8.50, p = .004). Choice shares did not
differ as a function of time frame (χ2 (N=295) = 1.12, p = .29). Note that choice shares for the
two low exposure conditions (i.e., the short-term/low exposure condition [41.3%] and long-
term/low exposure condition [52.8%]) and the two high exposure conditions (i.e., the short-
term/high exposure [29.6%] and the long-term/high exposure condition [31.2%]) did not differ
(χ2s (N=295) < 2.00, ps > .16).
25
Predicted liking. As predicted (hypothesis 1a), a between-subject MANOVA with
exposure as a factor revealed that participants anticipated liking the high arousal potential
nameplates less at the end of the course in the high exposure conditions (M = 3.68; SD = 1.99)
than in the low exposure conditions (M = 4.50, SD = 1.93); F(1, 290) = 12.87, p < .001, ηp2 =
.04). For the low arousal potential nameplates, there was no effect of exposure (MHigh Exposure =
5.51, SD = 1.69; MLow Exposure = 5.32, SD = 2.01; F < 1). The same analysis using time frame as a
factor did not yield any significant main effects (Fs < 1).
Predicted irritation. As predicted (hypothesis 1b), a between-subject MANOVA with
exposure as a factor revealed that participants anticipated being more irritated by the high arousal
nameplates at the end of the course in the high exposure conditions (M = 4.93; SD = 1.49) than in
the low exposure conditions (M = 4.44, SD = 1.48); F(1, 290) = 8.00, p = .005, ηp2 = .03). For the
low arousal nameplates, there was no effect of exposure (MHigh Exposure = 3.31, SD = 1.32; MLow
Exposure = 3.36, SD = 1.48; F < 1). The same analysis using time frame as a factor did not yield
any significant main effects (Fs < 1). The analyses held for all alternative measures of irritation,
as well as when all measures were combined to from an index.
Mediation. To examine whether choice was driven by anticipated irritation with the high
arousal potential nameplates and the resulting predicted decrease in liking (hypothesis 2b), we
tested for sequential mediation (model 6 of the PROCESS macro; Hayes 2013). Exposure was
used as the predictor variable, anticipated liking and anticipated irritation for the high arousal
potential nameplate (target item) as mediators, and choice as the dependent variable. The model
tested the indirect effect for three causal chains for the high arousal nameplates: exposure to
26
predicted irritation to choice (1; indirect effect, B = -.14, SE = .07; 95% CI = -.33 to -.03),
exposure to predicted liking to choice (2; indirect effect, B = -.09, SE = .05; 95% CI = -.23 to -
.02), and exposure to predicted irritation to predicted liking to choice (3; indirect effect, B = -.09,
SE = .06; 95% CI = -.23 to -.01), which supported sequential mediation (Zhao, Lynch, and Chen
2010). Evidence for sequential mediation held for the alternative measures of annoying and
obnoxious and held up marginally (90% CI) for irking and the overall index measure. The
indirect effects for the same three causal chains for the low arousal designs were not significant
(all CI included zero, thus not supporting mediation; Zhao, Lynch, and Chen 2010).
Alternative explanations. Model 4 of the PROCESS macro (Hayes 2013) allows the
simultaneous assessment of the indirect effects of multiple mediators. Using exposure as the
predictor variable and choice as the dependent variable, we directly pitted our proposed process
(irritation) against a variety of alternative explanations (confidence, versatility, matching, others,
standout). Anticipated irritation with high arousal potential design was a significant mediator of
choice (B = -.25, SE = .14; 95% CI = -.55 to -.04), whereas confidence (95% CI = -.08 to .14),
versatility (95% CI = -.05 to .15), matching (95% CI = -.20 to .02), others (95% CI = -.04 to .07),
and standing out (95% CI = -.40 to .22) were not. The same ratings for low arousal designs did
not yield any significant mediators.
Discussion
When making choices for high (vs. low) exposure use, consumers were less inclined to
select high (vs. low) arousal potential designs, supporting hypothesis 2a. This pattern was

27
observed in a consequential choice context (study 1a) as well as a hypothetical one (study 1b).
Choice shares were driven by greater anticipated increase in irritation and greater anticipated
decrease in liking for high arousal designs over repeat exposure, supporting hypotheses 1a, 1b,
and 2b. The results of study 1b further show that the pattern results from considerations over
repeat exposure, rather than the decision time frame, and simultaneous mediation analyses ruled
out a host of alternative explanations: Choice in this context was not driven by confidence in
liking, considerations of versatility, matching, liking by others, nor standing out. Thus, while
these factors may certainly influence preferences for product design in some domains, as
observed in the pilot study, anticipated liking and irritation seem to better account for product
design preferences in this more controlled setting.
STUDY 2: PREDICTED PRODUCT LIKING OVER TIME
The pilot study, studies 1a, and 1b all reveal that as anticipated product usage increases,
preference for high arousal potential product design decreases. Study 1b also offers initial
evidence that this preference is driven by expectations of increased irritation with high (vs. low)
arousal potential designs, leading to predictions of faster decreases in liking (hypotheses 1a-1c).
In study 2, we directly test hypotheses 1a -1c by manipulating the arousal potential of product
designs for two product categories viewed on a daily basis (beds and plates) and examine the
effect on predicted liking and predicted irritation over time. We manipulate arousal potential
from color and pattern orthogonally to ensure that our proposed effects hold across both design
elements. We expected that, across both product categories, participants would predict faster
decrease in liking and faster increase in irritation for high arousal potentials designs than for low
28
arousal designs. We also expected predicted irritation to mediate predicted decrease in liking for
high arousal designs, but not for low arousal potential designs.
Methods
Participants consisted of 300 U.S. Mturk workers (46.9% female, Mage = 35.48; SD =
12.12) who were randomly assigned to two of 10 conditions in a 5 (product design: low arousal
potential [plain white], high arousal potential pattern [striped white or abstract white], high
arousal potential color [strong green or strong orange]) x 2 (within factor product category:
bedding and plates) nested mixed-subjects design. Only the high versus low arousal
manipulations were of theoretical interest; product and design variations were included to ensure
generalizability.
Participants were instructed to imagine they had recently moved into a furnished
apartment for the foreseeable future. They were then shown a product that they would be using
for the time they lived in the apartment. In the bedding conditions, participants were shown an
image of a bed with bedding. In the plate conditions, participants were shown an image of a plate
that was said to be part of a larger set. The products were presented in one of the five condition-
consistent product designs (plain white, striped white, abstract white, strong green, or strong
orange); see Appendix. Note that participants saw one bed and one plate (in randomized order),
and that the design was randomly determined for each product (i.e., there was about a 20%
chance participants saw the same design for the two different products).
For each product, participants were asked to indicate how much they liked the displayed
product at that very moment (t1; 0 = Dislike extremely, 100 = Like extremely). Next,
29
participants were asked to imagine using the product for the foreseeable future and to indicate
their liking relative to t1 at six points in the future (in one week (t2), one month (t3), six months
(t4), one year (t5), two years (t6), four years (t7; -50 = much less, +50 much more).
The procedure was then repeated for the mediator measure of irritation. Participants were
asked to indicate to what extent the displayed product made them feel irritated at that very
moment (t1; 0 = Not at all irritated (Calm), 100 = Very irritated). Next, participants were asked
to imagine using the product for the foreseeable future and to indicate their expected irritation
relative to t1 at the same six points in the future (-50 = Much less, +50 = Much more).
Results
Because participants likely evaluated different product designs for the bedding and the
plate, responses for the bedding and plate were treated as individual observations (i.e., the
responses for each were stacked such that each participant was represented twice in the data set,
once for their bedding response, once for their plate response). This led to 600 observations with
variables indicating participant number, the product category, and the presentation order.
Participants’ current liking/irritation (t1) represented absolute liking/irritation at T1.
Absolute liking/irritation ratings for T2-T7 were calculated by adding the indicated relative
change in liking/irritation to T1 (T1+t2 = T2, T1+t3 = T3, etc.); see table 1 for all absolute liking
and irritation measures. As our main dependent measure and mediator measure, for each
observation, we then calculated the linear regression coefficient for liking and irritation over time
(Pfister et al. 2013), both using T1-T7 (1, 2, 3, 4, 5, 6, 7), and the corresponding days (1, 7, 30,
30
180, 360, 720, 1140) as predictor variables. That is, we calculated a slope for liking and irritation
over time for each observation.
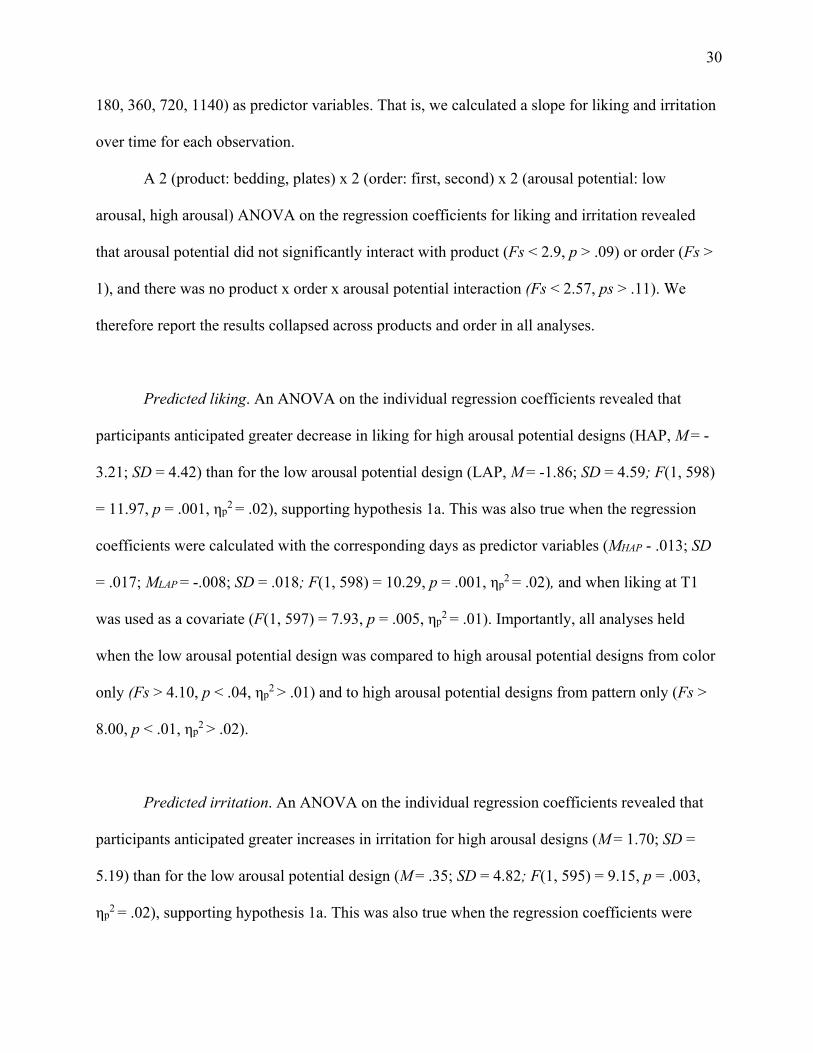
A 2 (product: bedding, plates) x 2 (order: first, second) x 2 (arousal potential: low
arousal, high arousal) ANOVA on the regression coefficients for liking and irritation revealed
that arousal potential did not significantly interact with product (Fs < 2.9, p > .09) or order (Fs >
1), and there was no product x order x arousal potential interaction (Fs < 2.57, ps > .11). We
therefore report the results collapsed across products and order in all analyses.
Predicted liking. An ANOVA on the individual regression coefficients revealed that
participants anticipated greater decrease in liking for high arousal potential designs (HAP, M = -
3.21; SD = 4.42) than for the low arousal potential design (LAP, M = -1.86; SD = 4.59; F(1, 598)
= 11.97, p = .001, ηp2 = .02), supporting hypothesis 1a. This was also true when the regression
coefficients were calculated with the corresponding days as predictor variables (MHAP - .013; SD
= .017; MLAP = -.008; SD = .018; F(1, 598) = 10.29, p = .001, ηp2 = .02), and when liking at T1
was used as a covariate (F(1, 597) = 7.93, p = .005, ηp2 = .01). Importantly, all analyses held
when the low arousal potential design was compared to high arousal potential designs from color
only (Fs > 4.10, p < .04, ηp2 > .01) and to high arousal potential designs from pattern only (Fs >
8.00, p < .01, ηp2 > .02).
Predicted irritation. An ANOVA on the individual regression coefficients revealed that
participants anticipated greater increases in irritation for high arousal designs (M = 1.70; SD =
5.19) than for the low arousal potential design (M = .35; SD = 4.82; F(1, 595) = 9.15, p = .003,
ηp2 = .02), supporting hypothesis 1a. This was also true when the regression coefficients were
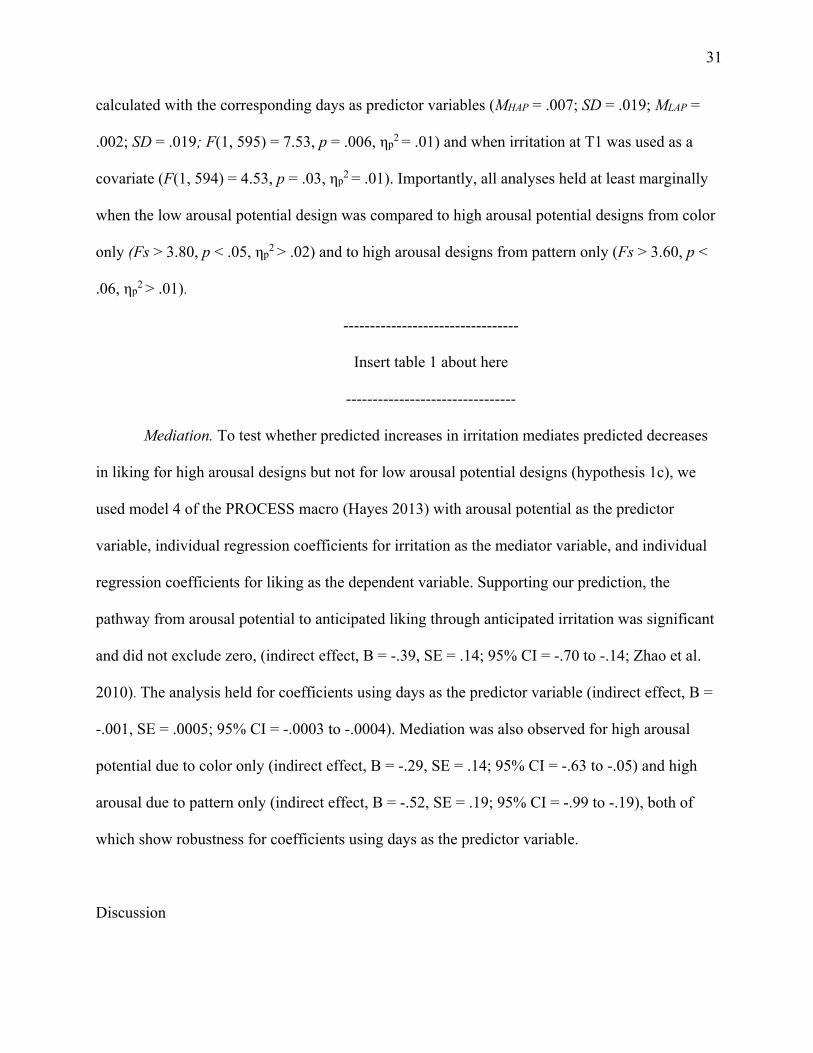
31
calculated with the corresponding days as predictor variables (MHAP = .007; SD = .019; MLAP =
.002; SD = .019; F(1, 595) = 7.53, p = .006, ηp2 = .01) and when irritation at T1 was used as a
covariate (F(1, 594) = 4.53, p = .03, ηp2 = .01). Importantly, all analyses held at least marginally
when the low arousal potential design was compared to high arousal potential designs from color
only (Fs > 3.80, p < .05, ηp2 > .02) and to high arousal designs from pattern only (Fs > 3.60, p <
.06, ηp2 > .01).
---------------------------------
Insert table 1 about here
--------------------------------
Mediation. To test whether predicted increases in irritation mediates predicted decreases
in liking for high arousal designs but not for low arousal potential designs (hypothesis 1c), we
used model 4 of the PROCESS macro (Hayes 2013) with arousal potential as the predictor
variable, individual regression coefficients for irritation as the mediator variable, and individual
regression coefficients for liking as the dependent variable. Supporting our prediction, the
pathway from arousal potential to anticipated liking through anticipated irritation was significant
and did not exclude zero, (indirect effect, B = -.39, SE = .14; 95% CI = -.70 to -.14; Zhao et al.
2010). The analysis held for coefficients using days as the predictor variable (indirect effect, B =
-.001, SE = .0005; 95% CI = -.0003 to -.0004). Mediation was also observed for high arousal
potential due to color only (indirect effect, B = -.29, SE = .14; 95% CI = -.63 to -.05) and high
arousal due to pattern only (indirect effect, B = -.52, SE = .19; 95% CI = -.99 to -.19), both of
which show robustness for coefficients using days as the predictor variable.
Discussion
32
Participants expected liking to decrease at a faster rate for high (vs. low) arousal potential
product designs because they anticipated growing increasingly irritated with high arousal
potential designs over time, thus providing direct evidence for hypotheses 1a-1c. Importantly, we
separately and systematically varied color and pattern in this study to ensure that our effect holds
independent of whether the arousal potential stems from color or pattern.
A caveat of this study is that despite having been pretested to be liked equally, the initial
liking of the patterned designs was lower than the white and colored designs (ts >|2.8|, ps < .04),
potentially raising the concern that consumers simply predict faster decrease in liking for less
liked designs. Mitigating this concern, the effect was observed when controlling for initial liking,
and the effect was also observed for high arousal from color only, for which initial liking did not
differ from the low arousal design (t = 1.47, p = .14). Furthermore, a conceptual replication
reported in the Web Appendix provides evidence for the effect even when initial liking did not
differ as a function of arousal potential. Studies 4 and 5 will rule out this alternative account
further.
Having established that consumers anticipate faster decrease in liking for high arousal
potential designs, we next explore several expected product usage measures to examine whether
the results extend to more behavioral, and thus marketing relevant, dependent variables. We also
examine a theoretically relevant individual difference as a moderator.
STUDY 3: PREDICTED PRODUCT USAGE OVER TIME
33
Study 3 examines whether the arousal potential of a product design influences predicted
product usage over time. If participants think that their liking will decrease at a faster rate for
product with a high (vs. low) arousal potential design, they should a) anticipate using it less
frequently in the future, b) anticipate using it a fewer number of times (i.e., cease use after fewer
uses), and c) be less likely to predict using it at a distant (vs. a proximate) point in the future than
a product with low arousal potential design.
If our theory is correct that this is due to participants anticipating to grow increasingly
irritated from high arousal potential designs over time, leading to faster predicted decrease in
liking, then the effect should be moderated by individuals’ comfort with arousal. On average, we
predict less anticipated usage for products with high (vs. low) arousal designs, in line with
previous studies. However, this should be particularly pronounced for individuals who are less
likely to enjoy arousal (e.g., people who score low on the Arousal Seeking Tendency Scale;
Mehrabian, and Russell 1973). These individuals should anticipate arousal to become aversive
and irritating more quickly than individuals who enjoy arousal. Therefore, we predict that,
compared to those who are high arousal seeking, low arousal seeking individuals will be more
likely to anticipate lower usage for products with high arousal potential designs.
Thus, in this study, we manipulate arousal potential of a product (exercise clothing) and
measure anticipated product use as well as individuals’ Arousal Seeking Tendency (AST;
Mehrabian and Russell 1973). We expected that, on average, participants would anticipate lower
usage of high (vs. low) arousal potential product designs (consistent with the choice results in
study 1a and 1b), but that the effect of arousal potential on predicted usage would be stronger for
individuals who score low on the AST scale (Mehrabian and Russell 1973).
34
Methods
Participants were 225 undergraduate students (74.1% female, Mage = 20.70, SD = 1.96)
who were randomly assigned to a condition in a 2 (arousal potential: low [black, gray, gray dots,
dark green, navy], high [strong green, green pattern, purple orange pattern, red, neon ombre])
nested between-subject design, with Arousal Seeking Tendency as a measured variable.
Participants were asked to imagine that they had just received the workout shirt displayed
on their computer screen. Depending on condition, they were shown one of five shirts with a
high arousal potential design or one of five shirts with a low arousal potential design; see
Appendix for stimuli. These stimuli were selected based on a pretest such that they differed on
arousal potential while being equally liked; see Web Appendix. Note that participants who
indicated being male (female) at the beginning of the survey saw a men’s (more fitted women’s)
shirt.
Participants were then asked about their anticipated use of the workout shirt as follows:
“Thinking about this workout shirt in the context of all of the workout shirts you own, how often
would you use this shirt in the future?” (1 = Never, 9 = All the time) and “After how many wears
do you think you'll stop wearing it or get rid of it?” (0 - 500 wears). In addition, as a proxy for
current liking they were asked “How likely are you to wear the workout shirt to your next
workout?” (t1), and as a proxy for anticipated satiation over time they were asked “How likely
are you to wear the workout shirt to a workout one year from now?” (t2; 1 = Very unlikely, 7 =
Very likely). Participants also rated how much they liked the shirt (1 = Dislike very much, 7 =
Like very much). In line with the pretest, liking did not differ as a function of arousal potential,
AST, or their interactions (ps > .1). Lastly, participants filled out an abbreviated version of the
35
Arousal Seeking Tendency scale (original scale: Mehrabian and Russell 1973). The items
measured the extent to which individuals seek out visually stimulating environments using items
such as “I like to look at pictures that are puzzling in some way” and “My ideal home would be
peaceful and quiet” (reverse scored).
Results
Predicted frequency of usage. Regression analysis revealed that main effects of arousal
potential (AP; B = -3.98, SE = 1.53, t(221) = -2.59, p = .01; 95% CI = -7.01 to -.95) and AST (B
= -.87, SE = .43, t(221) = - 2.04, p = .04, 95% CI = -1.71 to -.03) were qualified by a significant
AP x AST interaction (B = .59, SE = .27, t(221) = 2.14, p = .03, 95% CI = .04 to 1.14); see
figure 2a. Further examining this interaction, slope analysis (Aiken and West 1991; Fitzsimons
2008) revealed that arousal potential influenced low AST individuals’ (-1SD) usage frequency
estimates such that low AST individuals predicted less frequent usage for high (vs. low) arousal
potential designs (B = -1.35, SE = .39, t(221) = -3.39, p < .001, 95% CI = -2.13 to -.56). In
contrast, it did not influence usage frequency estimates for high AST individuals (+1SD; t <1).
This pattern persisted when current liking was used as a covariate in the analyses, revealing that
the results are not driven by differences in liking for the product designs. Instead, they are
consistent with the results being driven by low (vs. high) AST individuals anticipating greater
increases in irritation and greater decrease in liking for high arousal potential designs.
Predicted wears until discarded. Again, regression analysis revealed that main effects of
arousal potential (AP; B = -271.64, SE = 106.07, t(207) = -2.56, p = .01, 95% CI = - 480.78 to -
36
62.50) and AST (B = -68.75, SE = 28.85, t(207) = -2.38, p = .02, 95% CI = -125.63 to -11.86)
were qualified by a significant AP x AST interaction (B = 40.02, SE = 19.21, t(207) = 2.08, p =
.04, 95% CI = 2.13 to 77.91); see figure 2b. Further examining this interaction, slope analysis
revealed that arousal potential influenced low AST individuals’ (-1SD) predicted number of total
wears such that low AST individuals predicted lower numbers of wears for high (vs. low) arousal
potential designs (B = -94.02, SE = 27.04, t(221) = -3.47, p < .001, 95% CI = -147.34 to -40.71).
In contrast, arousal potential did not influence predicted number of wears for high AST
individuals (+1SD; t <1). Again, this pattern persisted when current liking was used as a
covariate in the analyses.
Likelihood of wearing in one year. For likelihood of wearing in one year (t2), a main
effect of AP (B = -3.54, SE = 1.48, t(221) = -2.38, p = .02, 95% CI = -6.47 to -.62) and a
marginal main effect of AST (B = -.79, SE = .41, t(221) = -1.93, p = .054, 95% CI = - 1.60 to
.01) were qualified by a AP x AST interaction (B = .56, SE = .26, t(221) = 2.11, p = .04, 95% CI
= .04 to 1.09); see figure 2c . Slope analysis revealed that while arousal potential influenced low
AST individuals’ (-1SD) predicted likelihood of wearing the shirt in one year such that they
predicted lower likelihood of wearing the high (vs. low) arousal potential designs (B =-1.04, SE
= .38, t(221) = -2.71, p = .01, 95% CI = -1.80 to -.28), it did not influence likelihood estimates
for high AST individuals (+1SD; t <1).
------------------------------------
Insert figure 2a-c about here
------------------------------------
37
Likelihood of wearing to next workout. Importantly, for the likelihood of wearing the
shirt to the next workout (t1), there was no main effect of arousal potential, no main effect of
AST, and no arousal potential x AST interaction (|ts| < 1.50, ps > .13). The fact that AST only
influenced likelihood of wearing the shirt in the distant future (t2) suggests that the different
pattern observed for high and low AST individuals likely resulted from low (vs. high) AST
individuals anticipating greater increases in irritation and, as a result, greater decreases in liking
for high arousal designs over time, and not simply from differential propensities to use high
versus low arousal potential product designs more generally.
Discussion
On average, participants anticipated lower usage of workout shirts (lower frequency,
fewer total number of wears) for high (vs. low) arousal potential designs despite the designs
being liked equally in a pretest (see Web Appendix). Furthermore, participants anticipated lower
likelihood of wearing the high arousal shirts at a time in the distant future, while there was no
difference in predicted usage for a time in the near future (when considerations about decreased
liking over time was less relevant). These results support our theory that liking for high arousal
potential designs are, on average, anticipated to decrease at a faster rate than low arousal
potential designs.
Importantly, this study also reveals a theoretically relevant moderator. Arousal potential
had greater influence on anticipated product usage for people who scored low on the Arousal
Seeking Tendency scale (i.e., who do not seek out arousal), even when controlling for liking.
Furthermore, arousal potential and AST had greater influence on usage estimates in the distant
38
(vs. near) future, suggesting that individual differences in sensitivity to arousal potential are
driving predicted product usage over time. The difference in anticipated product usage between
low and high AST individuals seems to be driven by low AST individuals anticipating a greater
decline in usage for high arousal potential designs over time.
STUDIES 4 AND 5: COMPARING PREDICTED AND EXPERIENCED LIKING
Thus far, our investigation has focused on predicted decreases in liking for high and low
arousal potential product designs and how these predictions influence product choice and
anticipated product usage (hypotheses 1 and 2). The remaining two studies examine the
soundness of these predictions and decisions by directly comparing these predictions to
experienced liking of high and low arousal potential designs..
Contrary to consumers’ intuition, we have theorized that consumer liking for high arousal
potential designs might decrease at a similar or even at a slower rate than for low arousal
potential designs (hypothesis 3). As a result, we hypothesized that forecasters overestimate the
extent to which liking decreases as a function of exposure for high arousal potential design
elements (hypothesis 4), leading to errors in predicted utility. To test this, the next studies
directly compare predicted and experienced liking of high and low arousal potential product
designs over repeat exposure in both a lab (study 4) and a field setting (study 5).
Study 4: Comparing Predicted and Experienced Liking
39
Study 4 directly compares predicted and experienced liking and irritation of a product (a
screen background) with either a high or low arousal potential designs over repeat exposure in a
controlled laboratory setting.
Replicating previous studies, we expected forecasters to predict greater increases in
irritation and greater decreases in liking for high (vs. low) arousal potential product designs. In
contrast, we expected experiencers to report similar or lower decreases in liking for high (vs.
low) arousal potential designs. The discrepancy, we predicted, would lead to forecasting errors
whereby forecasters overestimate the extent to which liking would decrease and overestimate the
extent to which irritation would increase for high arousal potential designs. Furthermore, the
latter was expected to mediate the former.
Methods
Participants were 407 undergraduates (50% female, Mage = 20.64, SD = 5.71) randomly
assigned to one of four conditions in a 2 (mode: forecaster, experiencer) x 2 (arousal potential:
low [light gray minimal pattern, light green minimal pattern], high [black and white pattern,
colored pattern]) nested between-subject design.
All participants were instructed to imagine they were considering a new screen
background for their computer. They were then told that in this study, they would see the screen
background 15 times for five seconds each time to simulate usage over time. Then all
participants saw a randomly assigned screen background, either one of two high arousal potential
designs or one of two low arousal potential designs (see Appendix) for five seconds and rated
their liking of the screen background on an analog scale (T1; 0 = Not at all, 100 = Like
40
extremely), followed by their experienced irritation with the screen background (T1; 0 = Not at
all, 100 = Extremely irritated). After these initial ratings, participants were again told that they
would see the same screen background 14 more times for 5 seconds each time. Forecasters were
asked to predict their liking and irritation with the screen background on their last exposure
relative to their initial liking/irritation on an analog scale (T15; -100 = A lot less than now, 100 =
A lot more than now; anchored at 0), and then they saw the screen background 14 times for five
seconds each time. Experiencers, by contrast, saw the screen background 14 times for five
seconds each time. On their last exposure (T15), they rated their liking and irritation of the
screen background using the same scales as forecasters. We only asked participants about their
liking and irritation at the beginning and at the end of product exposure (as opposed to repeatedly
assessing liking as in study 2) to minimize possible demand effects. To ensure that experiencers
viewed each exposure (i.e., did not leave the survey or look elsewhere), they were asked to press
an “I am still looking” button displayed below the product image for four of the 14 exposures.
Results
Ratings at T1. A 2 (mode: forecaster, experiencer) x 2 (arousal potential: low, high)
between-subjects ANOVA on initial liking scores (liking at T1) revealed no significant main
effects (Fs < 1) or interactions (Fs(1, 403) = 1.52, p = .22), indicating that the high and low
arousal potential designs were equally liked at T1. The same ANOVA on initial irritation scores
(irritation at T1) revealed a significant main effect of arousal potential such that high arousal
potential designs (M = 47.77; SD = 35.25) were perceived as more irritating than low arousal
41
potential designs (M = 29.58; SD = 32.63; F(1, 403) = 28.86, p < .001, ηp2 = .07). There were no
other significant effects (Fs < 1).
Predicted and experienced liking. The relative liking measure at T15 (as compared to T1)
served as the main dependent measure of decreased liking as a function of exposure. A 2 (mode:
forecaster, experiencer) x 2 (arousal potential: low, high) between-subjects ANOVA on relative
liking at T15 revealed only a significant interaction (F(1, 403) =11.27, p = .001, η2 = .03); see
figure 3a. Forecasters anticipated a greater decrease in liking for high arousal potential designs
(M = - 32.29; SD = 44.59) than for the low arousal potential design (M = -19.45; SD = 40.54; F(1,
403) = 4.57, p = .03, ηp2 = .01). Experiencers, however, showed a different pattern. Experiencers
reported a lower decrease in liking for high arousal potential designs (M = -12.69; SD = 44.04)
than for the low arousal potential design (M = -28.76; SD = 44.51; F(1, 403) = 6.78, p = .01, ηp2
= .02).
Examining the accuracy of consumer predictions (hypothesis 4a), we then compared
forecasts and experiencers at each level of arousal potential. As predicted, forecasters
overestimated to what extent liking would decrease for high arousal potential designs when
compared to experiencers (F(1, 403) = 10.91, p = .001, ηp2 = .03). For low arousal potential
designs, forecasts did not differ from experiences (F(1, 403) = 1.42, p = .23). All results hold if
liking at T1 is used as a covariate.
Predicted and experienced irritation. A 2 (mode: forecaster, experiencer) x 2 (arousal
potential: low, high) between-subjects ANOVA on relative irritation at T15 (as compared to T1)
revealed only a significant interaction (F(1, 403) = 15.50, p < .001, η2 = .04); see figure 3b. As
42
predicted, forecasters anticipated a greater increase in irritation for high arousal potential designs
(M = 32.64; SD = 47.62) than for the low arousal potential design (M = 8.79; SD = 47.90; F(1,
403) = 14.56, p < .001, ηp2 = .04). We did not make specific predictions for experiencers, but we
found that experiencers reported marginally lower increases in irritation for high arousal
potential designs (M = 15.23; SD = 42.62) than for low arousal potential designs (M = 26.65; SD
= 41.47; F(1, 403) = 3.17, p = .08).
Examining the accuracy of consumer predictions (hypothesis 4b), we then compared
forecasts and experiencers at each level of arousal potential. As predicted, forecasters
overestimated to what extent irritation would increase for high arousal potential designs
compared to experiencers (F(1, 403) = 7.50, p = .005, ηp2 = .02). We did not make specific
predictions for low arousal potential designs, but we found that forecasters underestimated to
what extent irritation would increase for these designs (F(1, 403) = 8.00, p = .006, ηp2 = .02).
--------------------------------------------------
Insert figure 3a and figure 3b about here
-------------------------------------------------
Mediation. To test whether arousal potential moderated the influence of mode (the
predictor variable) on liking at T15 (the dependent variable) by way of irritation (the mediator),
we tested and found support for moderated mediation (model 8 of the PROCESS macro; Hayes
2013; index for moderated mediation, B = 11.39, SE = 3.61; 95% CI = 5.41 to 19.39).
As predicted, for high arousal potential designs, the pathway from mode to relative liking
through relative irritation was significant and did not include zero (indirect effect, B = -5.62, SE
= 2.40; 95% CI = 1.60 to -3.25), thus supporting mediation (Zhao et al. 2010) and hypothesis 4b.
While we did not make predictions for low arousal designs, the analysis revealed that mode to
43
relative liking through relative irritation was significant in the opposite direction (indirect effect,
B = - 5.77, SE = 2.23; 95% CI = -10.70 to -1.95).
Discussion
Replicating the findings of study 2 and supporting hypothesis 1a and 1b, forecasters
expected greater decrease in liking and greater increase in irritation for high arousal potential
designs than for low arousal potential designs. Importantly, ratings from experiencers revealed
forecasters’ intuitions to be misguided. In contrast to forecasters’ predictions, experiencers
reported greater decrease in liking for low arousal potential designs than for high arousal
potential designs, supporting hypothesis 3. As a result, and supporting hypothesis 4a and 4b,
participants overestimated how much liking would decrease for high arousal potential designs
because they overestimated how much irritation would increase for these designs.
Aside from showing errors in prediction, this study also serves to rule out potential
alternative explanations in previous studies. Unlike the stimuli used in study 2, liking scores for
low and high arousal potential designs were identical at time 1 (F < 1), further ruling out the
potential alternative explanation that people simply predict faster decreases in liking from less
appealing designs. And because stimuli exposures occurred in isolation and over a short period
of time, these results also further rule out that differences in predicted decreases in liking for
high and low arousal potential designs are driven by considerations about versatility, matching,
or preferences of others.
Finally, by including low arousal potential designs involving (albeit minimal) color and
pattern, this study generalizes the findings of study 2 to other low arousal potential designs and
44
supports our conceptualization in that it is about the arousal potential of color and pattern and not
simply the presence or absence of color and pattern.
Study 5: Comparing Predicted to Experienced Liking and Irritation in the Field
Study 4 compared predicted and experienced liking in a relatively contrived experimental
setting, whereby exposures occurred in a fairly abbreviated timeframe. Study 5 extends study 4
by testing hypotheses 3 and 4 in a real consumption domain over a longer period of usage time.
In study 5, participants either predicted or reported experienced liking of a product (a nameplate)
with a high or low arousal potential design over one semester. Again, we expected forecasters to
predict greater decrease in liking for products with high (vs. low) arousal potential designs
(hypothesis 1a). In contrast, we expected experiencers to report similar or lower decreases in
liking for high (vs. low) arousal potential designs, (hypothesis 3), leading to errors in predicted
liking whereby forecasters overestimate the extent to which liking would decrease for high
arousal designs (hypothesis 4a).
Methods
Participants were 306 undergraduates (49.4% Female; Mage = 19.90, SD = 1.53) enrolled
in ten sections of an introductory business course at a large US university. Participants were
assigned to one of four conditions in a 2 (mode: forecaster, experiencer) x 2 (arousal potential:
low [plain white or pale green], high [abstract pattern or strong green) nested mixed-subject
design; see Appendix for stimuli images.
45
Experiencers (N = 122) were students in four sections of a course that met twice a week
for 75 minutes over the course of 13 weeks. On the first day of class, participants were randomly
assigned one of four nameplates (used in study 1a and 1b) to use during class throughout the
semester. All sections featured all four designs, thus students were exposed to all four. The
nameplates with their name on it were distributed at the beginning of every following class and
sat on the students’ desk for the entire class. Experiencers were given a brief questionnaire at
three points in the semester: during the first week (T1), during the sixth week (i.e., before spring
break; T2) and during the last week (i.e., before finals, T3). Among other questions related to the
course, participants rated how much they currently liked their nameplates (1= Not at all, 9 =
Very much). They also provided a code to match their responses over the three measurement
times. Participants whose code could not be matched were excluded from the analyses.
Forecasters (N= 184) were students in six other sections of the same course who
participated in a survey during the first week of the semester. They were exposed to all four
nameplate used by experiencers, but they were only asked to evaluate a randomly assigned one.
They were asked to imagine having been given the nameplate on the first day of class to use
during class throughout the semester. Using the same scale as experiencers, they were then asked
to rate how much they liked their nameplate (T1). They were then asked to imagine it being
shortly before spring break (T2) and predict how much they would like the nameplate, having
used it in every class. They repeated this exercise for the time before finals (T3).
Results
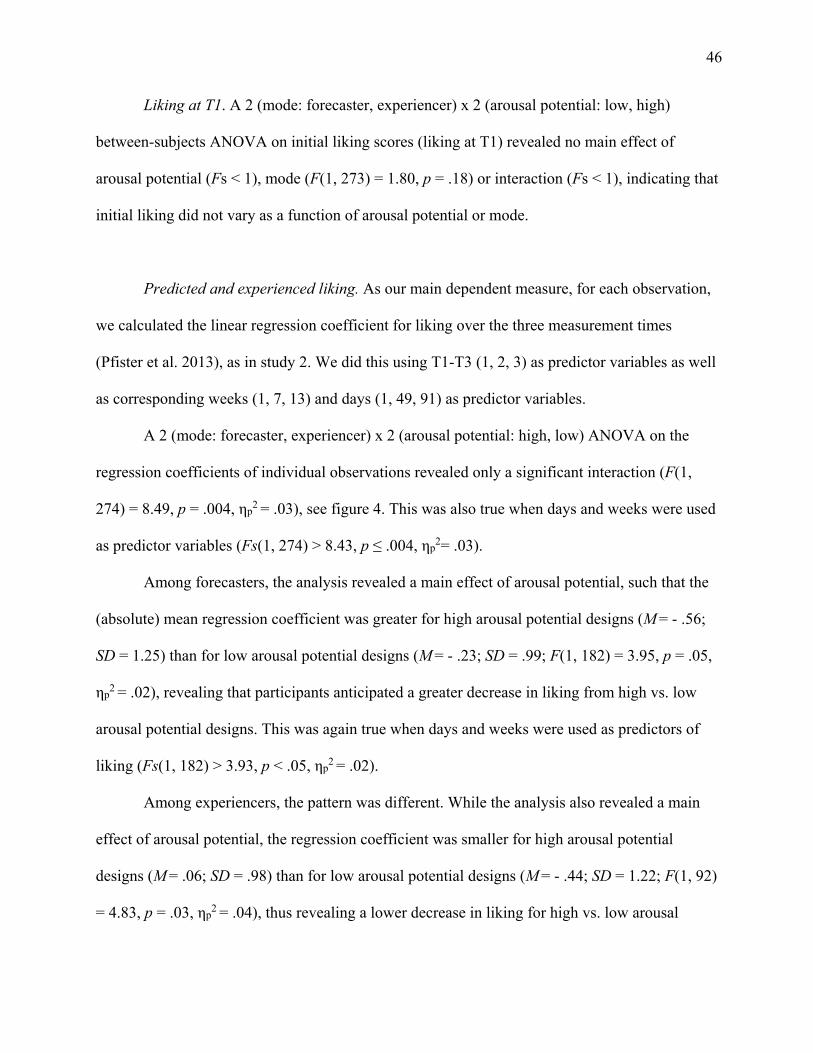
46
Liking at T1. A 2 (mode: forecaster, experiencer) x 2 (arousal potential: low, high)
between-subjects ANOVA on initial liking scores (liking at T1) revealed no main effect of
arousal potential (Fs < 1), mode (F(1, 273) = 1.80, p = .18) or interaction (Fs < 1), indicating that
initial liking did not vary as a function of arousal potential or mode.
Predicted and experienced liking. As our main dependent measure, for each observation,
we calculated the linear regression coefficient for liking over the three measurement times
(Pfister et al. 2013), as in study 2. We did this using T1-T3 (1, 2, 3) as predictor variables as well
as corresponding weeks (1, 7, 13) and days (1, 49, 91) as predictor variables.
A 2 (mode: forecaster, experiencer) x 2 (arousal potential: high, low) ANOVA on the
regression coefficients of individual observations revealed only a significant interaction (F(1,
274) = 8.49, p = .004, ηp2 = .03), see figure 4. This was also true when days and weeks were used
as predictor variables (Fs(1, 274) > 8.43, p ≤ .004, ηp2= .03).
Among forecasters, the analysis revealed a main effect of arousal potential, such that the
(absolute) mean regression coefficient was greater for high arousal potential designs (M = - .56;
SD = 1.25) than for low arousal potential designs (M = - .23; SD = .99; F(1, 182) = 3.95, p = .05,
ηp2 = .02), revealing that participants anticipated a greater decrease in liking from high vs. low
arousal potential designs. This was again true when days and weeks were used as predictors of
liking (Fs(1, 182) > 3.93, p < .05, ηp2 = .02).
Among experiencers, the pattern was different. While the analysis also revealed a main
effect of arousal potential, the regression coefficient was smaller for high arousal potential
designs (M = .06; SD = .98) than for low arousal potential designs (M = - .44; SD = 1.22; F(1, 92)
= 4.83, p = .03, ηp2 = .04), thus revealing a lower decrease in liking for high vs. low arousal
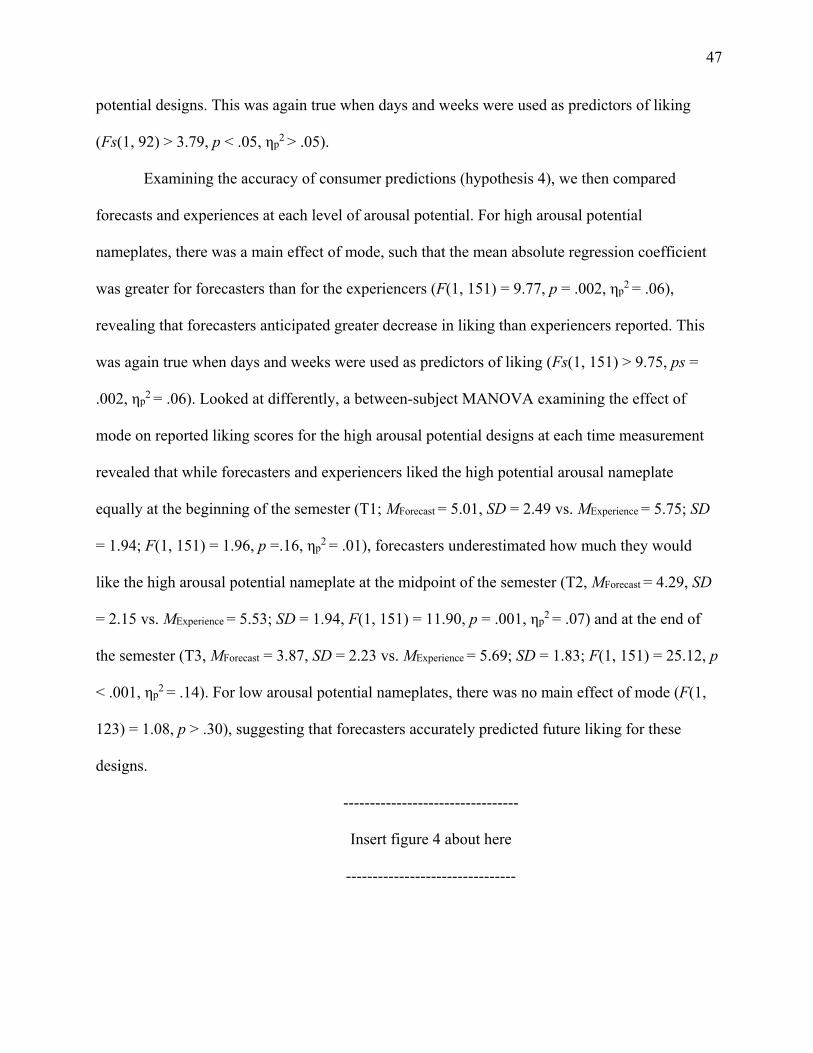
47
potential designs. This was again true when days and weeks were used as predictors of liking
(Fs(1, 92) > 3.79, p < .05, ηp2 > .05).
Examining the accuracy of consumer predictions (hypothesis 4), we then compared
forecasts and experiences at each level of arousal potential. For high arousal potential
nameplates, there was a main effect of mode, such that the mean absolute regression coefficient
was greater for forecasters than for the experiencers (F(1, 151) = 9.77, p = .002, ηp2 = .06),
revealing that forecasters anticipated greater decrease in liking than experiencers reported. This
was again true when days and weeks were used as predictors of liking (Fs(1, 151) > 9.75, ps =
.002, ηp2 = .06). Looked at differently, a between-subject MANOVA examining the effect of
mode on reported liking scores for the high arousal potential designs at each time measurement
revealed that while forecasters and experiencers liked the high potential arousal nameplate
equally at the beginning of the semester (T1; MForecast = 5.01, SD = 2.49 vs. MExperience = 5.75; SD
= 1.94; F(1, 151) = 1.96, p =.16, ηp2 = .01), forecasters underestimated how much they would
like the high arousal potential nameplate at the midpoint of the semester (T2, MForecast = 4.29, SD
= 2.15 vs. MExperience = 5.53; SD = 1.94, F(1, 151) = 11.90, p = .001, ηp2 = .07) and at the end of
the semester (T3, MForecast = 3.87, SD = 2.23 vs. MExperience = 5.69; SD = 1.83; F(1, 151) = 25.12, p
< .001, ηp2 = .14). For low arousal potential nameplates, there was no main effect of mode (F(1,
123) = 1.08, p > .30), suggesting that forecasters accurately predicted future liking for these
designs.
---------------------------------
Insert figure 4 about here
--------------------------------
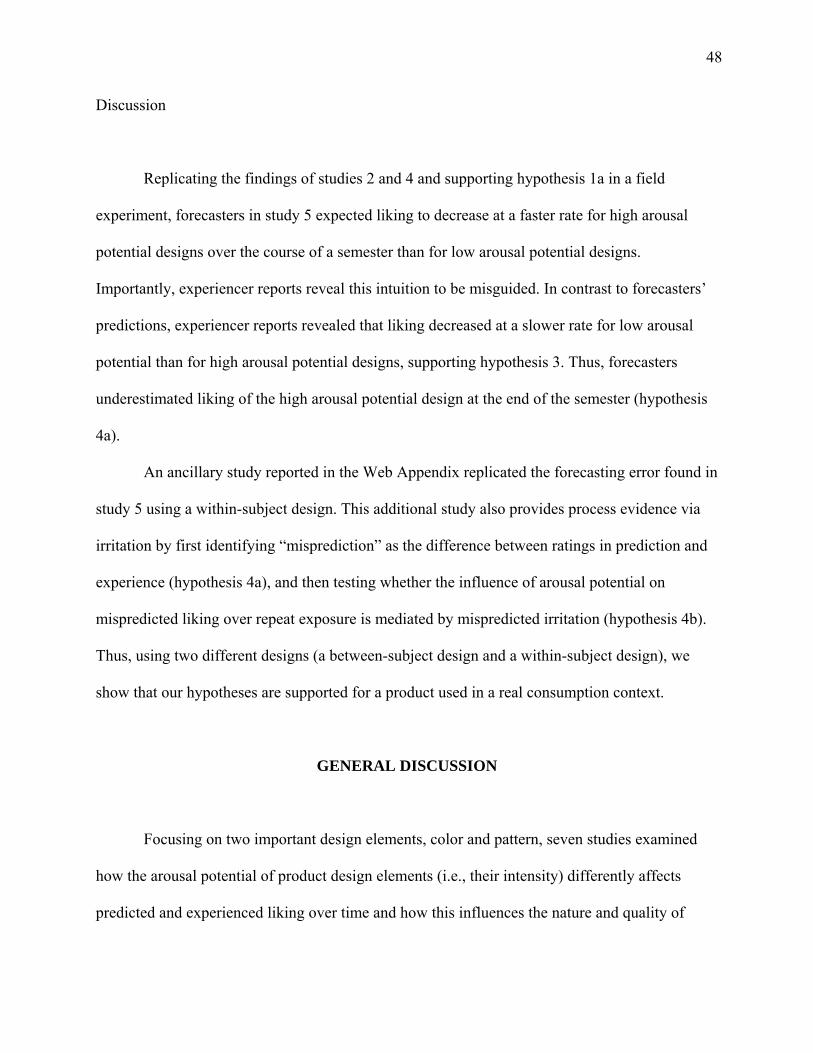
48
Discussion
Replicating the findings of studies 2 and 4 and supporting hypothesis 1a in a field
experiment, forecasters in study 5 expected liking to decrease at a faster rate for high arousal
potential designs over the course of a semester than for low arousal potential designs.
Importantly, experiencer reports reveal this intuition to be misguided. In contrast to forecasters’
predictions, experiencer reports revealed that liking decreased at a slower rate for low arousal
potential than for high arousal potential designs, supporting hypothesis 3. Thus, forecasters
underestimated liking of the high arousal potential design at the end of the semester (hypothesis
4a).
An ancillary study reported in the Web Appendix replicated the forecasting error found in
study 5 using a within-subject design. This additional study also provides process evidence via
irritation by first identifying “misprediction” as the difference between ratings in prediction and
experience (hypothesis 4a), and then testing whether the influence of arousal potential on
mispredicted liking over repeat exposure is mediated by mispredicted irritation (hypothesis 4b).
Thus, using two different designs (a between-subject design and a within-subject design), we
show that our hypotheses are supported for a product used in a real consumption context.
GENERAL DISCUSSION
Focusing on two important design elements, color and pattern, seven studies examined
how the arousal potential of product design elements (i.e., their intensity) differently affects
predicted and experienced liking over time and how this influences the nature and quality of
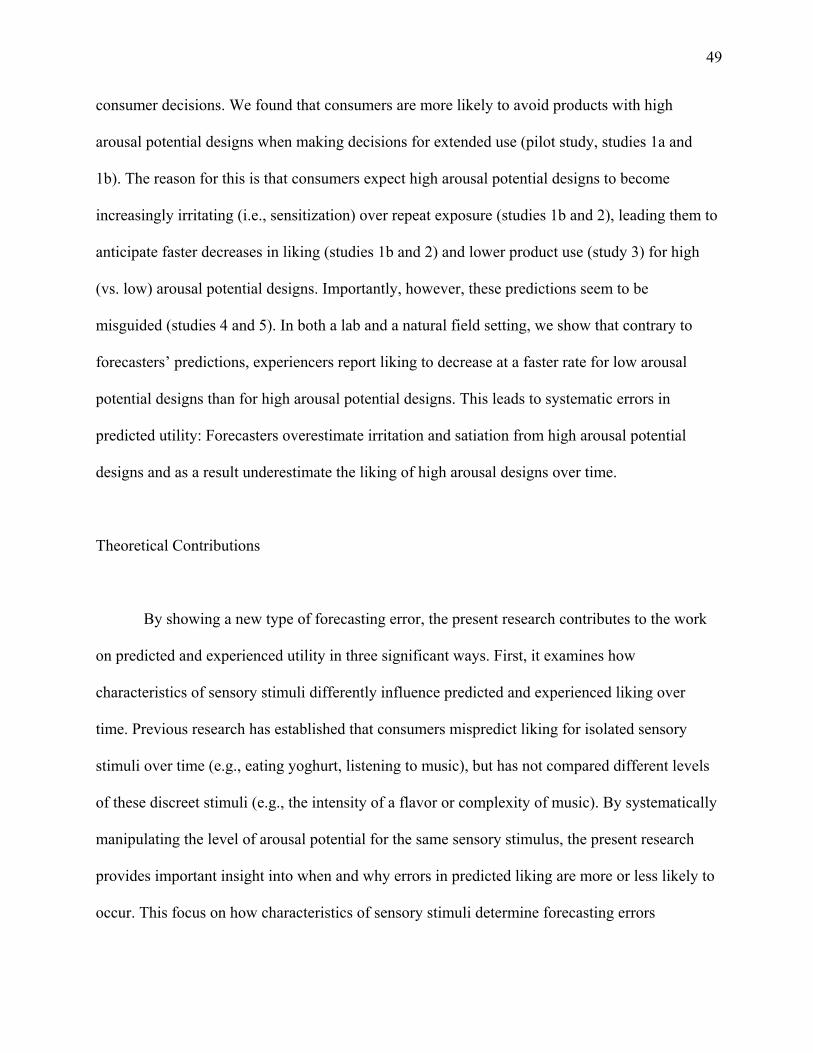
49
consumer decisions. We found that consumers are more likely to avoid products with high
arousal potential designs when making decisions for extended use (pilot study, studies 1a and
1b). The reason for this is that consumers expect high arousal potential designs to become
increasingly irritating (i.e., sensitization) over repeat exposure (studies 1b and 2), leading them to
anticipate faster decreases in liking (studies 1b and 2) and lower product use (study 3) for high
(vs. low) arousal potential designs. Importantly, however, these predictions seem to be
misguided (studies 4 and 5). In both a lab and a natural field setting, we show that contrary to
forecasters’ predictions, experiencers report liking to decrease at a faster rate for low arousal
potential designs than for high arousal potential designs. This leads to systematic errors in
predicted utility: Forecasters overestimate irritation and satiation from high arousal potential
designs and as a result underestimate the liking of high arousal designs over time.
Theoretical Contributions
By showing a new type of forecasting error, the present research contributes to the work
on predicted and experienced utility in three significant ways. First, it examines how
characteristics of sensory stimuli differently influence predicted and experienced liking over
time. Previous research has established that consumers mispredict liking for isolated sensory
stimuli over time (e.g., eating yoghurt, listening to music), but has not compared different levels
of these discreet stimuli (e.g., the intensity of a flavor or complexity of music). By systematically
manipulating the level of arousal potential for the same sensory stimulus, the present research
provides important insight into when and why errors in predicted liking are more or less likely to
occur. This focus on how characteristics of sensory stimuli determine forecasting errors
50
complements and extends related efforts in the affective forecasting literature in the non-sensory
domain, which has examined how characteristics of events (e.g., their probability or
psychological distance) differently influence their emotional impact in prospect and experience
(e.g., Buechel et al. 2014; Buechel, Morewedge, and Zhang 2017; Ebert and Meyvis 2014).
Second, the current research provides insight into the underlying mechanism that leads to
misprediction of adaptation in the sensory domain and how it differs from misprediction of
adaptation in the non-sensory domain. The present research shows that people overestimate to
what extent they will sensitize to high arousal potential sensory stimuli, leading to
overestimation of adaptation/satiation for such stimuli. Importantly, this forecasting error differs
from misprediction of hedonic responses in the non-sensory domain in its manifestation and
underlying mechanism: Research on misprediction of (non-sensory) affect and product
enjoyment has established that people underestimate adaptation because they a) underestimate
their ability to cope and make sense of events (Gilbert et al. 1998) and/or b) do not always
incorporate existing beliefs about adaptation to products in their decision-making process (Wang,
Novemsky, and Dhar 2009). Neither of these explanations are consistent with the findings in the
sensory domain that consumers do seem to incorporate adaptation into their decision-making
process and overestimate it. Furthermore, adaptation to sensory stimuli does not involve the
same psychological coping strategies (e.g., sense-making, reframing) that give rise to the
underestimation of adaptation in the non-sensory domain. Thus, the present research offers an
important theoretical distinction between the sources of forecasting errors, which can also help
reconcile the discrepancies in the type of forecasting errors that have been found in the sensory
and non-sensory domains.
51
Third, this research identifies differences in predicted and experienced utility in a new
and marketing relevant consumption domain: visual processing of aesthetics. Past research on
predicted and experienced utility has examined a variety of hedonic experiences and sensations,
ranging from more general measures of happiness to more specific sensory measures such as
auditory and gustatory liking. The present research is, to the best of our knowledge, the first to
compare predicted and experienced utility from visual stimuli (save for unrelated clinical work
on phobias; Rachman 1994; Rachman, Lopatka, and Levitt 1988). In doing so, the current
research also makes important contributions to the literature on aesthetics in consumer behavior.
Some of the most basic work on aesthetics considers how perceptual processes influence
evaluation and liking (e.g., how fluency determines ease of processing and liking; Winkielman et
al. 2003). We show how two distinctive design elements – color and pattern – exhibit similarities
in how they shape preferences and hedonic value because they similarly influence the arousal
potential of the stimulus. It follows that the findings of this research may be extrapolated to other
manipulations of visual arousal potential such as the magnitude of contrast or movement in
visual stimuli. Furthermore, while literature on design and mere exposure has identified factors
that influence experienced adaptation and satiation to visual stimuli, this past literature has not
systematically examined predicted liking. This is notable, given that most consumption and
purchase decisions are based on predicted hedonic value. By showing that forecasted liking does
not match the dynamics of experienced liking, the present work fills an important gap that allows
us to better understand how arousal potential influences judgments and decisions made for future
consumption.
On a broader level, the current research might provide an important step to a better
understanding of sensory/hedonic adaptation and sensitization. By showing how sensitization on
52
one measure (e.g., increase in irritation) can lead to adaptation on a different measure (e.g.,
decrease in liking or general hedonic response), we show how the two can be interrelated and
inform each other. This highlights the importance of clarity and specificity in terminology when
talking about dynamics of sensory and hedonic adaptation. Further, while the current
investigation is limited to visual stimuli, the findings might point to a more general overarching
theory that can help predict the dynamics of anticipated (vs. experienced) hedonic value over
time. Past research has identified isolated instances of sensitization and adaptation, but
consumers and researchers seem to have a relatively poor understanding of the boundary
conditions that determine when and to what extent each occurs (see Snell et al. 1995; Snell and
Gibbs 1995). Our research suggests that arousal potential of a stimulus might be an important
determinant of predicted and experienced hedonic value over time. If so, then our results might
generalize to other modalities (e.g., gustatory, auditory). Supporting this notion, many of the
more psychological processes that account for adaptation have been shown to share similarities
across modalities (Redden 2015). Thus, consumers might expect to grow more irritated and
satiate more quickly from intense sounds (e.g., a new type of techno) or flavors (e.g., an intense
curry), when in reality, these might bring continued pleasure. We discuss the importance of
further research in this area in “Limitations and Future Research”.
Implications for Consumers and Marketers
Apart from being of theoretical interest, the present research has important implications
for how consumers make decisions about aesthetic elements. When decorating homes and
buying clothes, consumers often choose pale colors and simple designs (i.e., low arousal
53
potential design items), presumably at least in part because they believe that this will increase
long-term satisfaction with the product aesthetics. Contrary to people’s intuition, however, our
studies suggest that consumers satiate equally, if not more quickly, from low arousal potential
designs than from high arousal designs. The implication for consumers is that when making
long-term decisions, consumers can be bolder in their design choices (i.e., they should go for the
intense colors and intense patterns they like) without jeopardizing hedonic value over time. Of
course, consumers may want to shift their strategy when making choices on behalf of others.
When preparing to sell a house, for example, sellers should recognize that a potential buyer
unfamiliar with this research might falsely shy away from bold patterns, decreasing the resale
value. Indeed, real estate and color consultants advise homeowners to “start with earth tones”
and to “get rid of anything that’s kind of obnoxious” (Moore 2010; realestate.aol.com).
The current research has equally significant implications for marketers. When designing
logos, stores, websites, or any other design aspect associated with a product, marketers should
again embrace bold product designs. Not only will they capture attention, but they are likely free
of the feared downsides such as satiation and irritation. On the other hand, sales departments
could profit from the sale of low arousal potential designs. Not only might the associated
satiation decrease time until consumers return for replacement purchase, but consumers may be
more likely to return to purchase modifying products (e.g., new decorative pillows for their sofa)
to increase liking of their current product.
Limitations and Future Research
54
We observed our hypothesized effects over a variety of product category and designs.
Nevertheless, it is important to keep in mind the possible boundary conditions of our effects.
First, as with most findings and psychological theories, the predictive validity of our
findings is relative rather than absolute in nature. Our findings allow us to forecast for what types
of visual stimuli consumers may be more or less likely to mispredict liking over time, but it does
not specifically address whether someone will mispredict liking for a precise level of aesthetic
design or what level of arousal potential is necessary for overestimation of satiation to occur
(e.g., whether a pattern should have one, two or three lines, etc.). One reason for this is that the
level of subjective arousal from arousal potentialities might differ depending on context or across
individuals. To mitigate this issue, we intentionally used stimuli that were extreme enough to
elicit differential arousal across our participant population and across context, thus increasing the
likelihood of observing the effect. For less extreme stimuli (e.g., designs with medium arousal
potential), perceptions of arousal may be more context and individual dependent, leading to
weaker and less consistent effects.
Second, as our pilot data indicates, the importance and nature of aesthetic considerations
likely vary across product categories, thus providing important boundary conditions for the
preferences for high (vs. low) arousal potential designs. Safety considerations might motivate
consumers to choose bright colors independent of satiation concerns, for example. A decorative
feature meant to attract attention might similarly motivate the choice of a high arousal design.
For other products, consumers likely find additional motivation in selecting low arousal potential
designs, be it because it makes matching different designs easier (e.g., clothes), because these
designs are less likely to go out of style over time (e.g., furniture), or because the designs are
more versatile over time (e.g., household items). To mitigate the influence of these alternative
55
explanations, we controlled for them statistically and we selected products for which matching,
trends, and versatility were not highly relevant (e.g., nameplates). And while each of these
alternative explanations might influence product design preferences, they are less likely to
influence anticipated satiation over time, a key dependent measure in studies 1b –5. Still, it is
important to recognize that our effects might be weaker in some product categories than others,
thus highlighting the potential for future research identifying systematic moderators.
Third, to reiterate, the current investigation is limited to the visual sensory domain.
Future research is necessary to examine whether our results generalize to other sensory domains,
and if so, which ones. In line with the current theorizing around arousal potential, this type of
research could manipulate the loudness and complexity of auditory stimulus, the intensity and
complexity of taste, as well as the intensity and pattern of touch or pain, for example. Of course,
any testing of the generalizability of our results should consider similarities and differences
across sensory modalities (e.g., physical properties/limitations, evolutionary function, etc.),
which could inform potential boundaries for the generalizability of our effects.
Finally, future research might also delve more deeply into the mechanism behind the
forecasting error. While our studies consistently showed that consumers’ misprediction of
satiation for high arousal potential designs was due to expectations of increased irritation, we did
not identify the origins of these expectations. Might it be that there is adaptive value in this
forecasting error and/or that consumers overly rely on atypical past experiences when making
predictions about high arousal designs? We leave such questions for future research.
Overall, the results consistently show (misguided) expectations of satiation as a primary
driver of the decreased preference for high arousal potential designs when making decisions for
durable products. Importantly, as a high level of functional quality becomes standard across

56
numerous product categories (Page and Herr 2002), more brands are looking to aesthetics as a
point of differentiation. Therefore, this research is relevant to an increasingly diverse range of
product purchases and usage experiences.
57
DATA COLLECTION INFORMATION
The data were collected using paper and pencil or Qualtrics software at the University of Miami,
the University of South Carolina, and using Mturk between Fall 2012 and Spring 2017. The data
were either collected by one of the authors or by a research assistant supervised by at least one of
the authors. The first, second, or both authors analyzed the data and the data for all studies were
discussed on multiple occasions by both authors. Ancillary information/analyses and links to
preregistration reports can be found in the web appendix accompanying the online version of this
article. Additional analyses and datasets may be requested at any time.
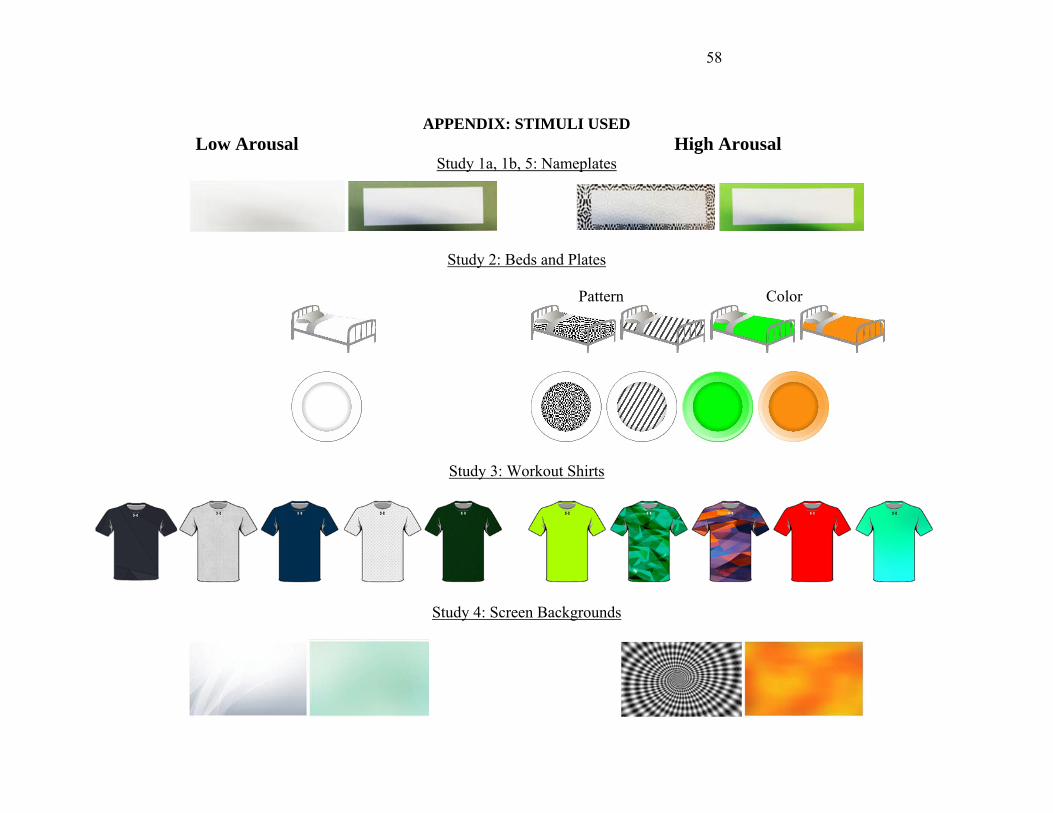
58
APPENDIX: STIMULI USED
Low Arousal High Arousal Study 1a, 1b, 5: Nameplates
Study 2: Beds and Plates
Pattern Color
Study 3: Workout Shirts
Study 4: Screen Backgrounds
59
REFERENCES
Alba, Joseph and Elanor F. Williams (2013), “Pleasure Principles: Current Research on Hedonic
Consumption,” Journal of Consumer Psychology, 23 (1), 2-18.
Aiken, Leona and Stephen G. West (1991), Multiple Regression: Testing and Interpreting
Interactions, Newbury Park, CA: Sage.
Baker, Garry and Robert Franken (1967), “Effects of Stimulus Size, Brightness and Complexity
upon EEG Desynchronization,” Psychonomic Science, 7 (9), 289-90.
Berlyne, Daniel E. (1960),“Conflict, Arousal, and Curiosity, New York, NY: McGraw-Hill.
_______ (1968), “The Motivational Significance of Collative Variables,” in Theories of
Cognitive Consistency: A Sourcebook, Ed. Robert Abelson, Chicago, IL: Rand McNally,
275-88.
_______ (1970), “Novelty, Complexity, and Hedonic Value,” Perception & Psychophysics, 8
(5), 279-86.
_______ (1971), Aesthetics and Psychobiology, New York, NY: Appleton-Century-Crofts.
Berlyne, Daniel E. and P. McDonnell (1965), “Effects of Stimulus Complexity and Incongruity
on Duration of EEG Desynchronization,” Electroencephalography and Clinical
Neurophysiology, 18 (2), 156-61.
Berlyne, Daniel E. and George H. Lawrence (1964), “Effects of Complexity and Incongruity
Variables on GSR, Investigatory Behavior and Verbally Expressed Preference,” Journal
of General Psychology, 71 (1), 21-45.
Bornstein, Robert F. (1989), “Exposure and Affect: Overview and Meta-Analysis of Research,
1968–1987,” Psychological Bulletin, 106 (2), 265 - 89.
60
Buechel, Eva C., Jiao Zhang, Carey K. Morewedge (2017), “Impact bias or underestimation?
Outcome specifications predict the direction of affective forecasting errors,” Journal of
Experiment Psychology: General, 146 (5), 746-61.
Buechel, Eva C., Jiao Zhang, Carey K. Morewedge, and Joachim Vosgerau (2014), “More
Intense Experiences, Less Intense Forecasts: Why People Overweight Probability
Specifications in Affective Forecasts,” Journal of Personality and Social Psychology,
106 (1), 20-36.
Cantor, Gordon N. (1968), “Children's ‘Like-Dislike’ Ratings of Familiarized and Non-
familiarized Visual Stimuli,” Journal of Experimental Child Psychology, 6 (4), 651-57.
Coombs, Clyde H. and George S. Avrunin (1977), “Single-Peaked Functions and the Theory of
Preference,” Psychological Review, 84 (2), 216 - 30.
Cox, Dena and Anthony D. Cox (2002), “Beyond First Impressions: The Effects of Repeated
Exposure on Consumer Liking of Visually Complex and Simple Product Designs,”
Journal of the Academy of Marketing Science, 30 (2), 119-30.
Ebert, Jane E.J and Tom Meyvis (2014), "Reading Fictional Stories and Winning Delayed
Prizes: The Surprising Emotional Impact of Distant Events," Journal of Consumer
Research, 41 (3), 794 – 809.
Fitzsimons, Gavan J. (2008), “Death to Dichotomizing,” Journal of Consumer Research, 35 (1),
5-8.
Frederick, Shane and George Loewenstein (1999), ‘‘Hedonic Adaptation,’’ in Well-being: The
foundations of Hedonic Psychology, Ed. Daniel Kahneman, Ed Diener, and Norbert
Schwarz, New York, NY: Sage, 302-29.
61
Gilbert, Daniel T., Elizabeth C. Pinel, Timothy D. Wilson, Stephen J. Blumberg, and Thalia P.
Wheatley (1998), “Immune Neglect: A Source of Durability Bias in Affective
Forecasting,” Journal of Personality and Social Psychology, 75 (3), 617-38.
Hagtvedt, Henrik and S. Adam Brasel (2017), “Color Saturation Increases Perceived Product
Size,” Journal of Consumer Research, forthcoming.
Hayes, Andrew F. (2013), Introduction to Mediation, Moderation, and Conditional Process
Analysis: A Regression-based Approach, New York, NY: Guilford Press.
Heiman, Julia R. (1977), “A Psychophysiological Exploration of Sexual Arousal Patterns in
Females and Males,” Psychophysiology, 14 (3), 266-74.
Hoegg, JoAndrea and Joseph. W. Alba (2008), “A Role for Aesthetics in Consumer
Psychology,” in Handbook of Consumer Psychology, Ed. Frank Kardes, Curtis Haugtvedt
and Paul Herr, New York, NY: Psychology Press, 733-54.
Holtzschue, Linda (2011), Understand Color: An Introduction For Designers, 4th Edition,
Hoboken, NJ: John Wiley & Sons, Inc.
Janiszewski, Chris and Tom Meyvis (2001), “Effects of Brand Logo Complexity, Repetition, and
Spacing on Processing Fluency and Judgment,” Journal of Consumer Research, 28 (1),
18-32.
Kahneman, Daniel and Jackie Snell (1992), “Predicting a Changing Taste: Do People Know
What They Will Like?” Journal of Behavioral Decision Making, 5 (3), 187-200.
Küller, Rikard, Byron Mikellides, and Jan Janssens (2009), “Color, Arousal, and Performance –
A Comparison of Three Experiments,” Color Research & Application, 34 (2), 141-52.
Laan, Ellen, Walter Everaerd, and Andrea Evers (1995), “Assessment of Female Sexual Arousal:
Response Specificity and Construct Validity,” Psychophysiology, 32 (5), 476-85.
62
Labrecque, Lauren I. and George R. Milne (2012), “Exciting Red and Competent Blue: The
Importance of Color in Marketing,” Journal of the Academy of Marketing Science, 40,
711-27.
Mehrabian, Albert and James A. Russell (1973), “A Measure of Arousal Seeking Tendency,”
Environment and Behavior, 5 (3), 315-33.
Moore, Christopher (2010), “Painting to Sell: What Color Homes Sell Best?”
http://realestate.aol.com/blog/2010/07/16/painting-to-sell-what-color-homes-sell-best/.
Morewedge, Carey K., Daniel T. Gilbert, Kristian R., Myrseth, Karim S. Kassam, and Timothy
D. Wilson (2010), “Consuming Experiences: Why Affective Forecasters Overestimate
Comparative Value,” Journal of Experimental Social Psychology, 46 (6), 986-92.
Nelson, Leif D. and Tom Meyvis (2008), “Interrupted Consumption: Disrupting Adaptation to
Hedonic Experiences,” Journal of Marketing Research, 45 (6), 654-64.
Nicki, Richard M. and Anthony Gale (1977), “EEG, Measures of Complexity, and Preference for
Nonrepresentational Works of Art,” Perception, 6, 281-86.
Novemsky, Nathan and Rebecca K. Ratner (2003), “The Time Course and Impact of Consumers’
Erroneous Beliefs about Hedonic Contrast Effects,” Journal of Consumer Research, 29
(4), 507–16.
Oppenheimer, Daniel M., Tom Meyvis, and Nicolas Davidenko (2009), “Instructional
manipulation checks: Detecting satisficing to increase statistical power,” Journal of
Experimental Social Psychology, 45, 867-72.
Page, Christine and Paul M. Herr (2002), “An Investigation of the Processes by which Product
Design and Brand Strength Interact to Determine Initial Affect and Quality Judgments,”
Journal of Consumer Psychology, 12 (2), 133-47.
63
Patrick, Vanessa A. and Henrik Hagtvedt (2011), “Aesthetic Incongruity Resolution,” Journal of
Marketing Research, 48 (2), 393-402.
Patrick, Vanessa A. and Laura A. Peracchio (2010), “Curating the JCP Special Issue on
Aesthetics in Consumer Psychology: An Introduction to the Aesthetics Issues,” Journal
of Consumer Psychology, 20 (4), 393-97.
Pfister, Roland, Katharina Schwarz, Robyn Carson, and Markus Jancyzk (2013), “Easy Methods
for Extracting Individual Regression Slopes: Comparing SPSS, R, and Excel,: Tutorials
in Quantitative Methods for Psychology, 9 (2), 72-8.
Postrel, Virginia (2003), The substance of style. New York, NY: Harper Collins.
Rachman, Stanley (1994), “The Overprediction of Fear: A Review,” Behaviour Research and
Therapy, 32 (September), 683-90.
Rachman, Stanley, Cindy Lopatka, and Kay Levitt (1988), “Experimental Analyses of Panic—II.
Panic Patients,” Behaviour Research and Therapy, 26 (1), 33-40.
Ratner, Rebecca K., Barbara E. Kahn, and Daniel Kahneman (1999), “Choosing Less Preferred
Experiences for the Sake of Variety,” Journal of Consumer Research, 26 (1), 1-15.
Redden, Joseph P. (2008), “Reducing Satiation: The Role of Categorization Level,” Journal of
Consumer Research, 34 (5), 624-34.
_______ (2015), “Desire over Time: The Multi-Faceted Nature of Satiation,” in The Psychology
of Desire, Ed. Wilhelm Hofmann and Loran Nordgren, New York, NY: Guilford Press,
82-103.
Snell, Jackie and Brian J. Gibbs (1995), “Do Consumers Know What They Will Like?”
Advances in Consumer Research, 22, 277-79.
64
Snell, Jackie, Brian J. Gibbs, and Carol Varey (1995), “Intuitive Hedonics: Consumer Beliefs
about the Dynamics of Liking,” Journal of Consumer Psychology, 4 (1), 33-60.
Townsend, Claudia and Suzanne B. Shu (2010), “When and How Aesthetics Influences
Financial Decisions,” Journal of Consumer Psychology, 20 (4), 452-58.
Valdez, Patricia and Albert Mehrabian (1994), “Effects of Color on Emotions” Journal of
Experimental Psychology, 4, 394-409.
Wang, Jing, Nathan Novemsky, and Ravi Dhar (2009), “Anticipating adaptation to products,”
Journal of Consumer Research, 36 (2), 149-59.
Weinstein, Neil D. (1978), “Individual Differences in Reactions to Noise: A Longitudinal Study
in a College Dormitory,” Journal of Applied Psychology, 63 (4), 458 -66.
_______ (1982), “Community Noise Problems: Evidence against Adaptation,” Journal of
Environmental Psychology, 2 (2), 87-97.
Weller, Leonard and Randy Livingston (1988), “Effects of Color of Questionnaire on Emotional
Responses,” Journal of General Psychology, 115 (4), 433-40.
Wilson, Timothy D. and Daniel T. Gilbert (2003), “Affective Forecasting,” Advances in
Experimental Social Psychology, 35 (December), 345-411.
Wilson, Timothy D. and Daniel T. Gilbert (2005), “Affective Forecasting: Knowing What to
Want,” Current Directions in Psychological Science, 14 (3), 131-34.
Wright, Benjamin and Lee Rainwater (1962), “The Meanings of Color,” Journal of General
Psychology, 67 (1), 89-99.
Wundt, Wilhelm M. (1874), “Grundzüge der Physiologischen Psychologie [Translation:
Principles of Physiological Psychology],” Leipzig: Engelmann.
65
Yamamoto, Mel and David R. Lambert (1994), “The Impact of Product Aesthetics on the
Evaluation of Industrial Products,” Journal of Product Innovation Management, 11 (4),
309-24.
Zajonc, Robert B. (1968), “Attitudinal Effects of Mere Exposure,” Journal of Personality and
Social Psychology, 9 (2), 1-27.
Zajonc, Robert B., Philip Shaver, Carol Tavris, and David Van Kreveld (1972), “Exposure,
Satiation, and Stimulus Discriminability,” Journal of Personality and Social Psychology,
21 (3), 270-80.
Zielińki, Piotr (2016), “An Arousal Effect of Colors Saturation: A Study of Self-Reported and
Electrodermal Responses,” Journal of Psychophysiology, 30 (1), 9-16.
Zhao, Xinshu, John G. Lynch, and Qimei Chen (2010), “Reconsidering Baron and Kenny: Myths
and Truths about Mediation Analysis,” Journal of Consumer Research, 37 (2), 197-206.
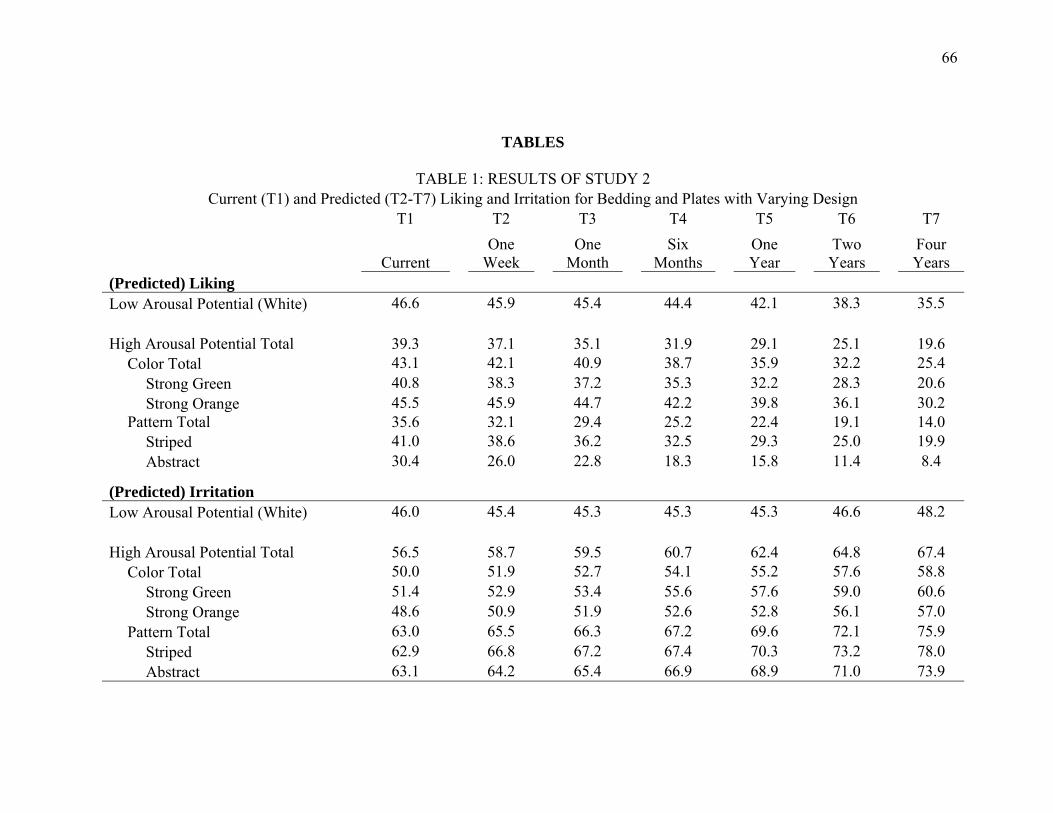
66
TABLES
TABLE 1: RESULTS OF STUDY 2 Current (T1) and Predicted (T2-T7) Liking and Irritation for Bedding and Plates with Varying Design
T1 T2 T3 T4 T5 T6 T7
Current One
Week One
Month Six
Months One Year
Two Years
Four Years
(Predicted) Liking Low Arousal Potential (White) 46.6 45.9 45.4 44.4 42.1 38.3 35.5
High Arousal Potential Total 39.3 37.1 35.1 31.9 29.1 25.1 19.6
Color Total 43.1 42.1 40.9 38.7 35.9 32.2 25.4
Strong Green 40.8 38.3 37.2 35.3 32.2 28.3 20.6
Strong Orange 45.5 45.9 44.7 42.2 39.8 36.1 30.2
Pattern Total 35.6 32.1 29.4 25.2 22.4 19.1 14.0
Striped 41.0 38.6 36.2 32.5 29.3 25.0 19.9
Abstract 30.4 26.0 22.8 18.3 15.8 11.4 8.4
(Predicted) Irritation Low Arousal Potential (White) 46.0 45.4 45.3 45.3 45.3 46.6 48.2
High Arousal Potential Total 56.5 58.7 59.5 60.7 62.4 64.8 67.4
Color Total 50.0 51.9 52.7 54.1 55.2 57.6 58.8
Strong Green 51.4 52.9 53.4 55.6 57.6 59.0 60.6
Strong Orange 48.6 50.9 51.9 52.6 52.8 56.1 57.0
Pattern Total 63.0 65.5 66.3 67.2 69.6 72.1 75.9
Striped 62.9 66.8 67.2 67.4 70.3 73.2 78.0 Abstract 63.1 64.2 65.4 66.9 68.9 71.0 73.9
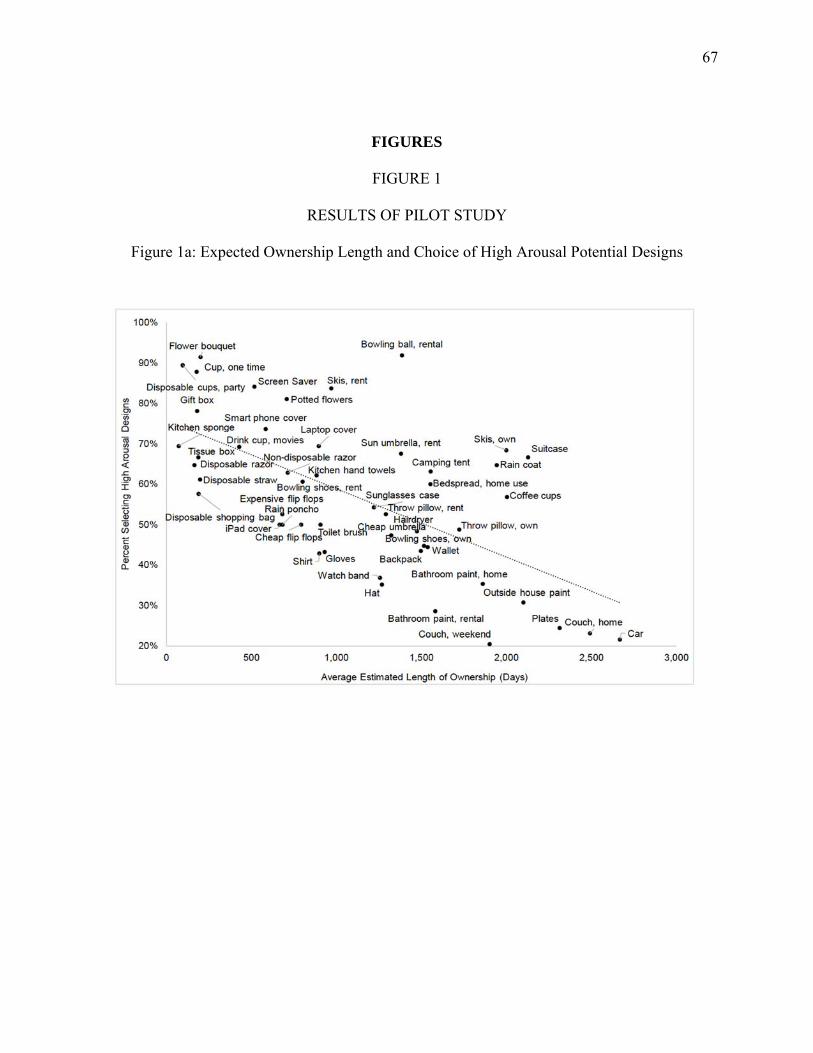
67
FIGURES
FIGURE 1
RESULTS OF PILOT STUDY
Figure 1a: Expected Ownership Length and Choice of High Arousal Potential Designs
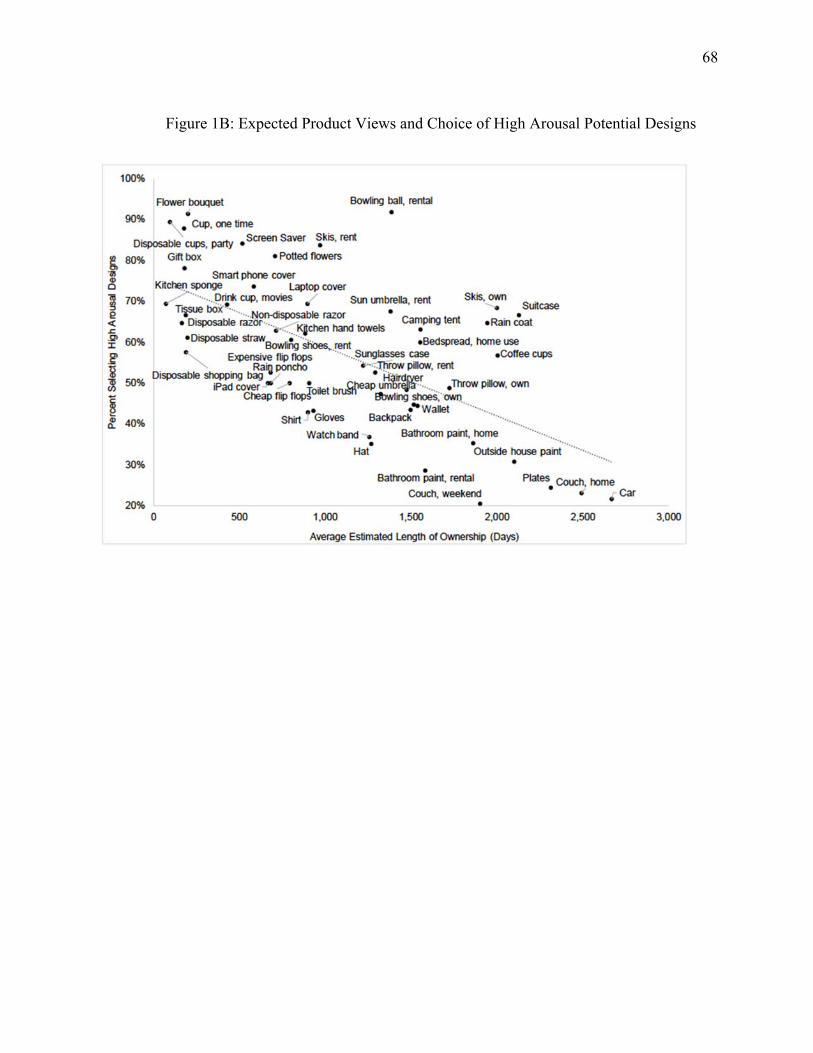
68
Figure 1B: Expected Product Views and Choice of High Arousal Potential Designs
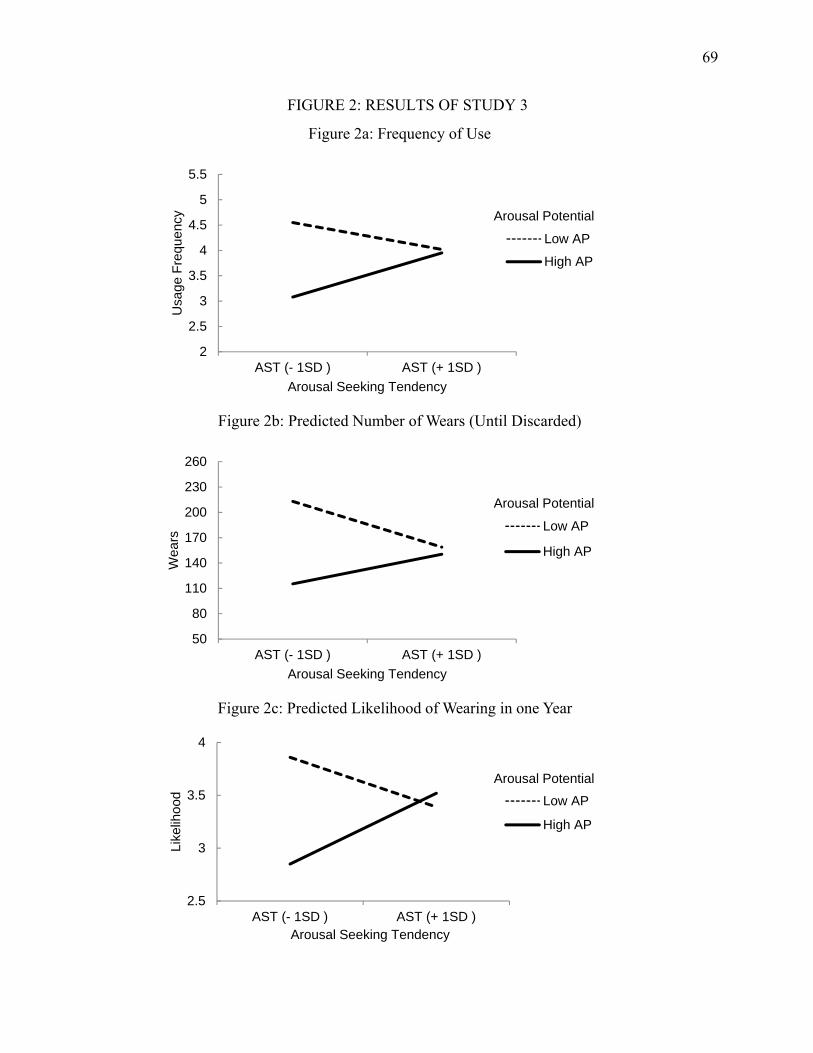
69
FIGURE 2: RESULTS OF STUDY 3
2
2.5
3
3.5
4
4.5
5
5.5
AST (- 1SD ) AST (+ 1SD )
Usa
ge F
requ
ency
Arousal Seeking Tendency
Figure 2a: Frequency of Use
Low AP
High AP
Arousal Potential
50
80
110
140
170
200
230
260
AST (- 1SD ) AST (+ 1SD )
Wea
rs
Arousal Seeking Tendency
Figure 2b: Predicted Number of Wears (Until Discarded)
Low AP
High AP
Arousal Potential
2.5
3
3.5
4
AST (- 1SD ) AST (+ 1SD )
Like
lihoo
d
Arousal Seeking Tendency
Figure 2c: Predicted Likelihood of Wearing in one Year
Low AP
High AP
Arousal Potential
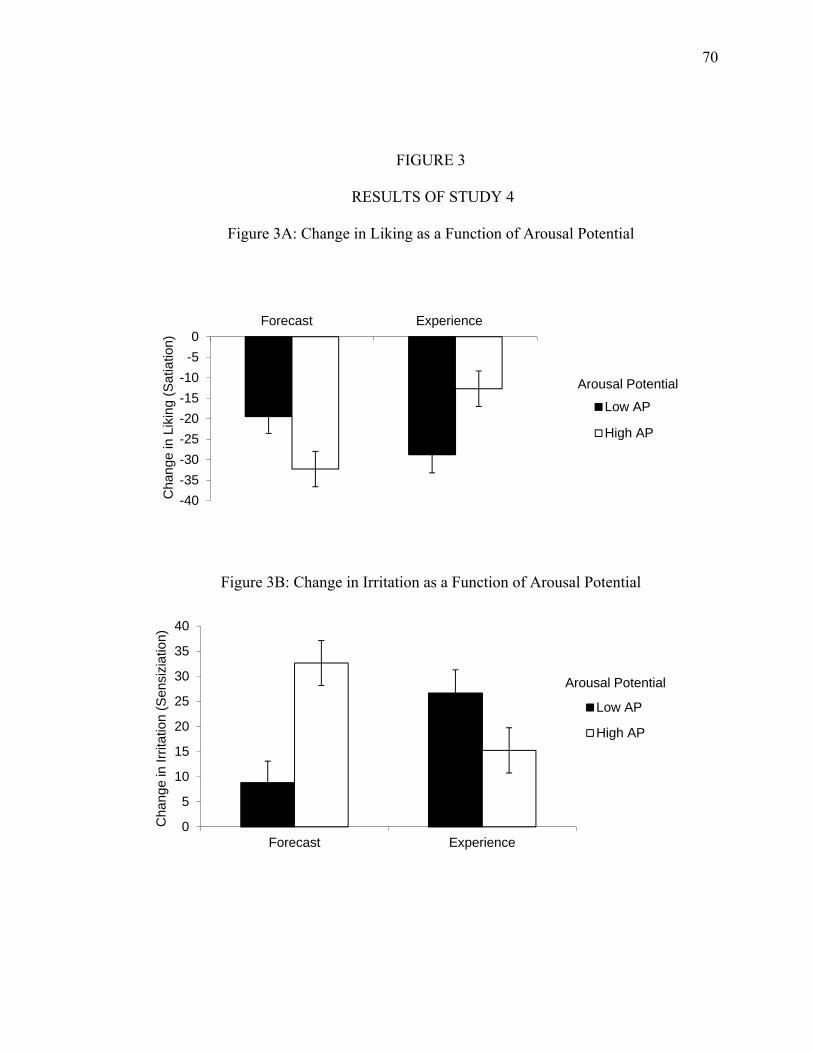
70
FIGURE 3
RESULTS OF STUDY 4
Figure 3A: Change in Liking as a Function of Arousal Potential
Figure 3B: Change in Irritation as a Function of Arousal Potential
0
5
10
15
20
25
30
35
40
Forecast Experience
Cha
nge
in Ir
ritat
ion
(Sen
sizi
atio
n)
Low AP
High AP
Arousal Potential
-40
-35
-30
-25
-20
-15
-10
-5
0
Cha
nge
in L
ikin
g (S
atia
tion)
Forecast Experience
Low AP
High AP
Arousal Potential
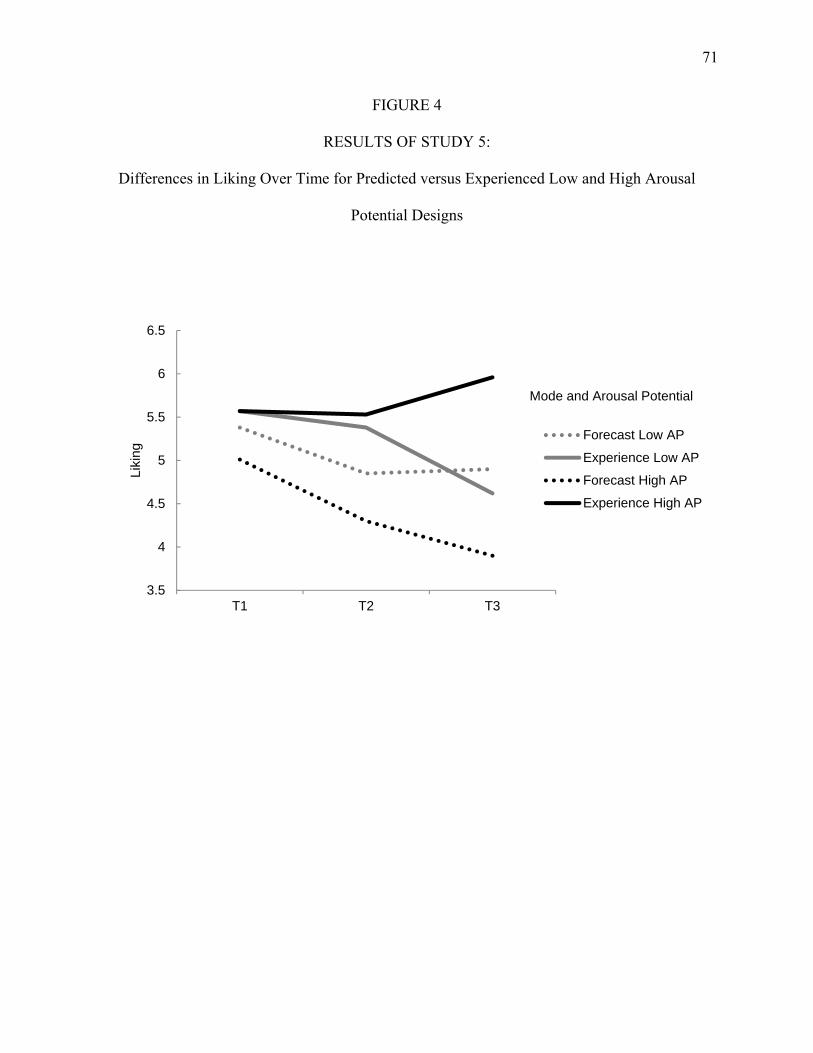
71
FIGURE 4
RESULTS OF STUDY 5:
Differences in Liking Over Time for Predicted versus Experienced Low and High Arousal
Potential Designs
3.5
4
4.5
5
5.5
6
6.5
T1 T2 T3
Liki
ng
Forecast Low AP
Experience Low AP
Forecast High AP
Experience High AP
Mode and Arousal Potential
72
HEADING LIST
1) DYNAMICS OF HEDONIC VALUE 1) AROUSAL POTENTIAL IN VISUAL STIMULI 2) Arousal Potential and Predicted Liking of Product Design Elements 2) Arousal and Experienced Liking of Product Designs Elements 2) Overview 1) PILOT STUDY: MULTI-CATEGORY EXPLORATION 2) Methods 2) Results 3) Choice. 2) Discussion 1) STUDIES 1A AND 1B: DESIGN PREFERENCES AS A FUNCTION OF CONSUMPTION DURATION 2) Study 1a: Field Study 2) Methods 2) Results 2) Study 1b: Laboratory Study 2) Methods 2) Results 3) Manipulation checks. 3) Choice. 3) Predicted liking. 3) Predicted irritation. 3) Mediation. 3) Alternative explanations. 2) Discussion 1) STUDY 2: PREDICTED PRODUCT LIKING OVER TIME 2) Methods 2) Results 3) Predicted liking. 3) Predicted irritation. 3) Mediation. 2) Discussion 1) STUDY 3: PREDICTED PRODUCT USAGE OVER TIME Methods 2) Results 3) Predicted frequency of usage. 3) Predicted wears until discarded. 3) Likelihood of wearing in one year. 3) Likelihood of wearing to next workout. 2) Discussion 1) STUDIES 4 AND 5: COMPARING PREDICTED AND EXPERIENCED LIKING 2) Study 4: Comparing Predicted and Experienced Liking 2) Methods 2) Results
73
3) Ratings at T1. 3) Predicted and experienced liking. 3) Predicted and experienced irritation. 3) Mediation. 2) Discussion 2) Study 5: Comparing Predicted to Experienced Liking and Irritation in the Field 2) Methods 2) Results 3) Liking at T1. 3) Predicted and experienced liking. 2) Discussion 1) GENERAL DISCUSSION 2) Theoretical Contributions 2) Implications for Consumers and Marketers 2) Limitations and Future Research


![Thomas Achilles Townsend [6A14] - UW Madison …townsend/tree/scrapbooks/6A14.pdf · 2012-01-08 · Thomas Achilles Townshend [6A14] Eva Carmichael (R), ... the visit of the Prince](https://static.fdocuments.net/doc/165x107/5b1ce9827f8b9af05b8b64c8/thomas-achilles-townsend-6a14-uw-madison-townsendtreescrapbooks6a14pdf.jpg)