
EUV sources: progress towards industrialization
27
Alberto Pirati, Sjoerd Lok, Rudy Peeters, Eric Verhoeven, Christophe Smeets, Daniel Smith , Arthur Minnaert, Martijn van Noordenburg, Joerg Mallmann, Judon Stoeldraijer, Christian Wagner, David Brandt, Daniel Brown, Herman Boom, Hans Meiling, Roderik van Es EUVL, October 2015. Maastricht EUV sources: progress towards industrialization Public
Transcript of EUV sources: progress towards industrialization
Alberto Pirati, Sjoerd Lok, Rudy Peeters, Eric Verhoeven, Christophe Smeets, Daniel Smith , Arthur Minnaert, Martijn
van Noordenburg, Joerg Mallmann, Judon Stoeldraijer, Christian Wagner, David Brandt, Daniel Brown, Herman
Boom, Hans Meiling, Roderik van Es
EUVL, October 2015. Maastricht
EUV sources: progress towards industrialization
Public
October 2015
Slide 2
Public
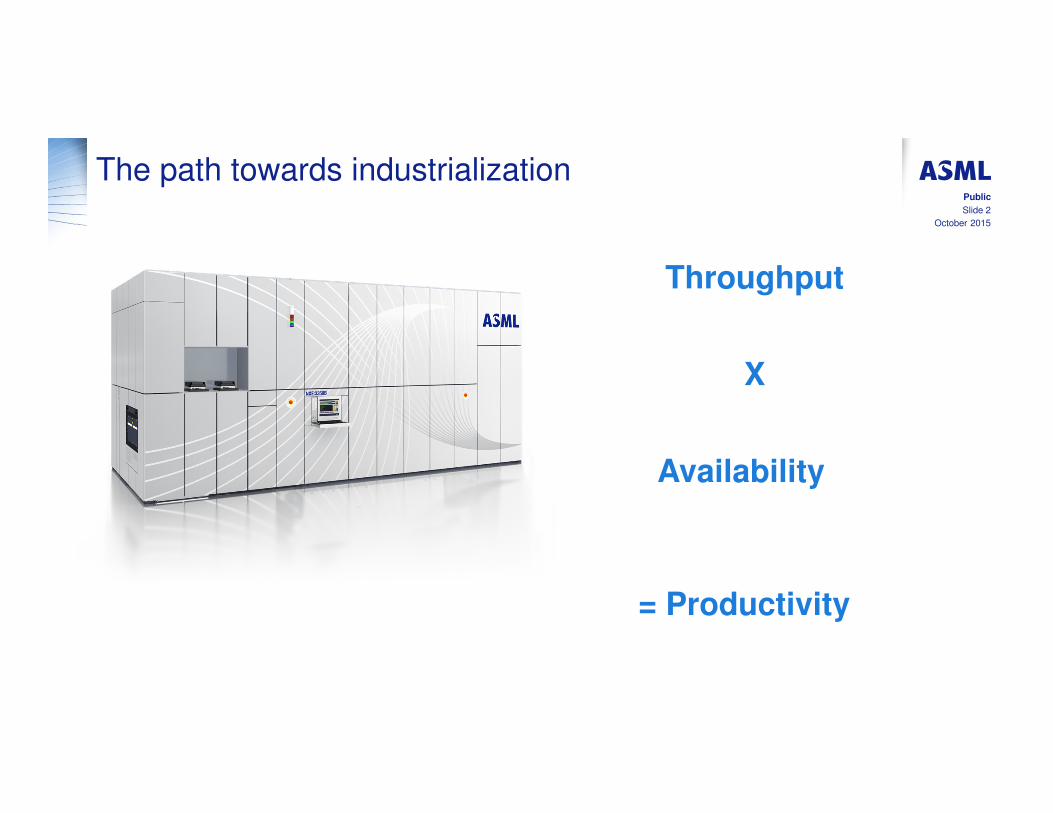
The path towards industrialization
Throughput
Availability
= Productivity
X
October 2015
Slide 3
Public
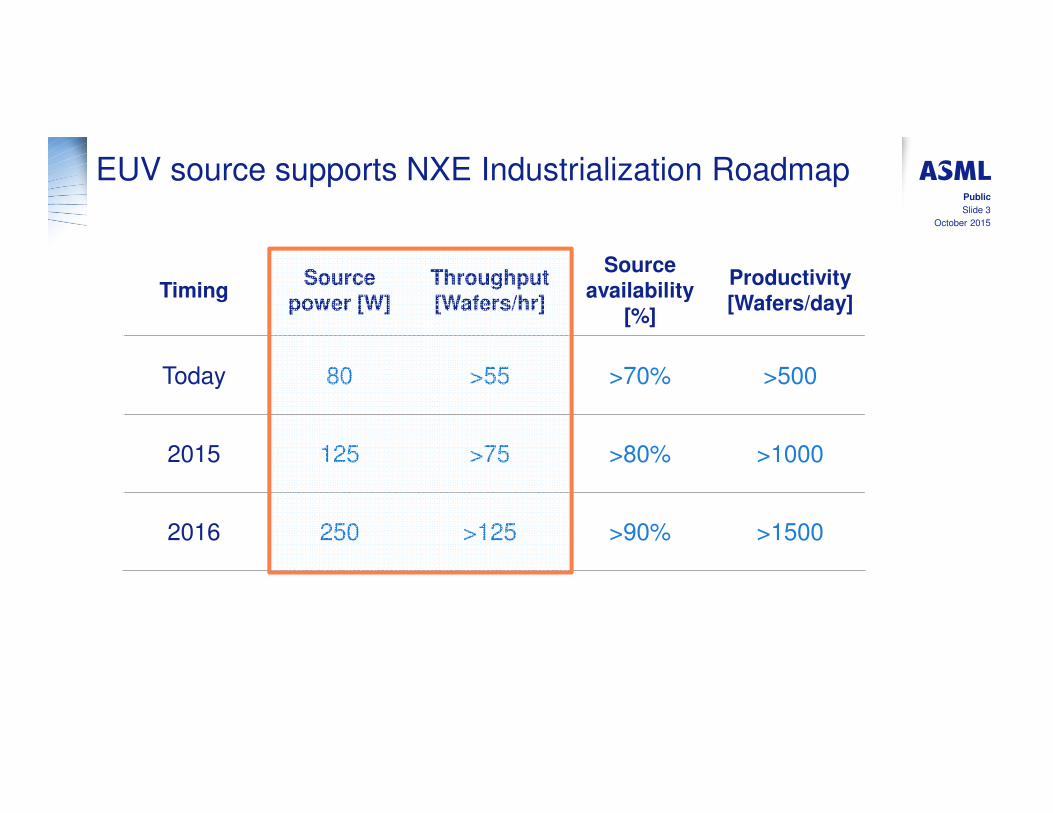
EUV source supports NXE Industrialization Roadmap
TimingSource
power [W]
Throughput
[Wafers/hr]
Source
availability
[%]
Productivity
[Wafers/day]
Today 80 >55 >70% >500
2015 125 >75 >80% >1000
2016 250 >125 >90% >1500
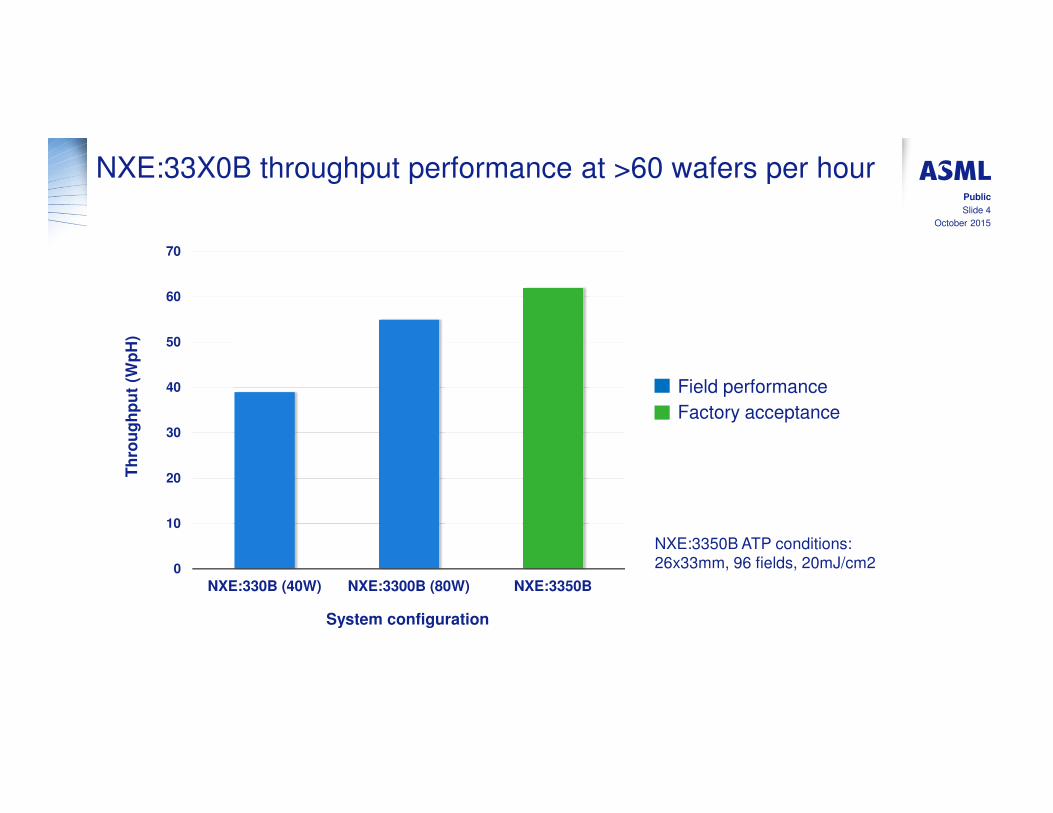
NXE:33X0B throughput performance at >60 wafers per hour
NXE:3350B ATP conditions:
26x33mm, 96 fields, 20mJ/cm2
Field performance
Factory acceptance
October 2015
Public
Slide 4
0
10
20
30
40
50
60
70
NXE:330B (40W) NXE:3300B (80W) NXE:3350B
Th
rou
gh
pu
t (W
pH
)
System configuration
Slide 5
Public
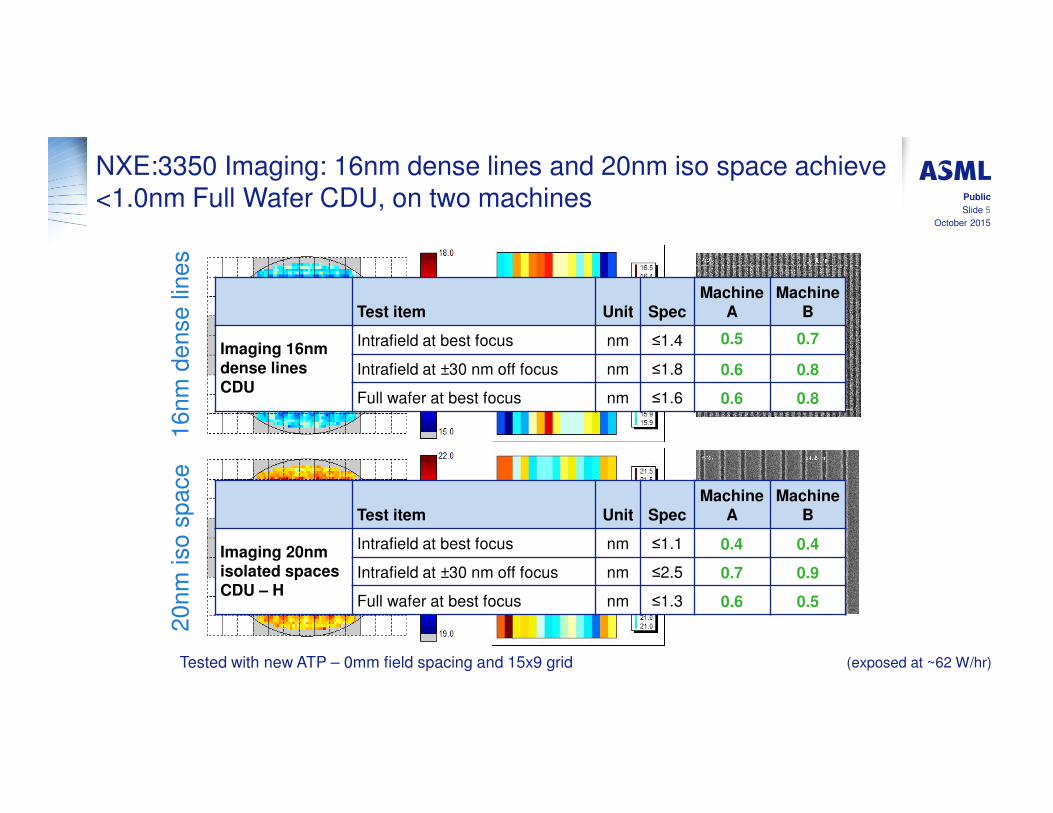
NXE:3350 Imaging: 16nm dense lines and 20nm iso space achieve <1.0nm Full Wafer CDU, on two machines
16nm
dense lin
es
20nm
iso
space
Test item Unit SpecMachine
AMachine
B
Imaging 16nm dense linesCDU
Intrafield at best focus nm ≤1.4 0.5 0.7
Intrafield at ±30 nm off focus nm ≤1.8 0.6 0.8
Full wafer at best focus nm ≤1.6 0.6 0.8
Test item Unit SpecMachine
AMachine
B
Imaging 20nm isolated spacesCDU – H
Intrafield at best focus nm ≤1.1 0.4 0.4
Intrafield at ±30 nm off focus nm ≤2.5 0.7 0.9
Full wafer at best focus nm ≤1.3 0.6 0.5
Tested with new ATP – 0mm field spacing and 15x9 grid (exposed at ~62 W/hr)
October 2015
Slide 6
Public
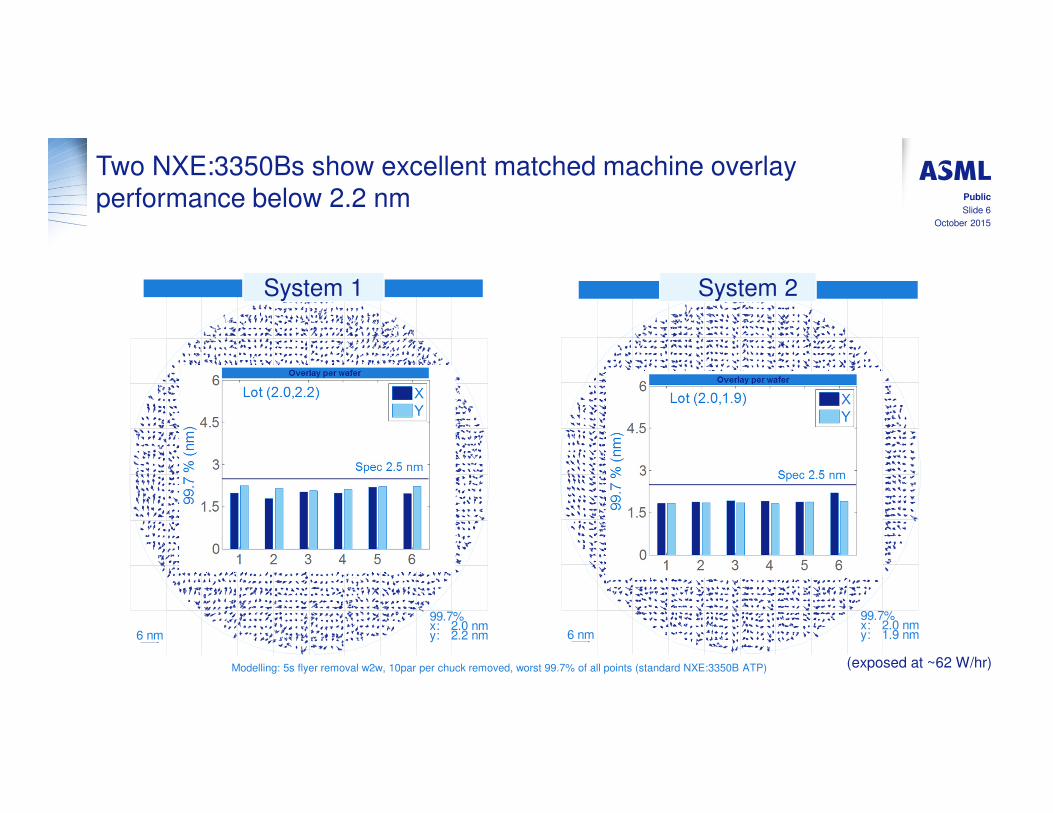
Two NXE:3350Bs show excellent matched machine overlay performance below 2.2 nm
6 nm
99.7%x: 2.0 nmy: 2.2 nm
XYMMO_MMO_150819_1525_wec (S2F)Wafer plot stacked
6 nm
99.7%x: 2.0 nmy: 1.9 nm
XYMMO_BMMO_150818_2144_wec (S2F)Wafer plot stackedSystem 1 System 2 System 2
Modelling: 5s flyer removal w2w, 10par per chuck removed, worst 99.7% of all points (standard NXE:3350B ATP) (exposed at ~62 W/hr)
October 2015
October 2015
Slide 7
Public
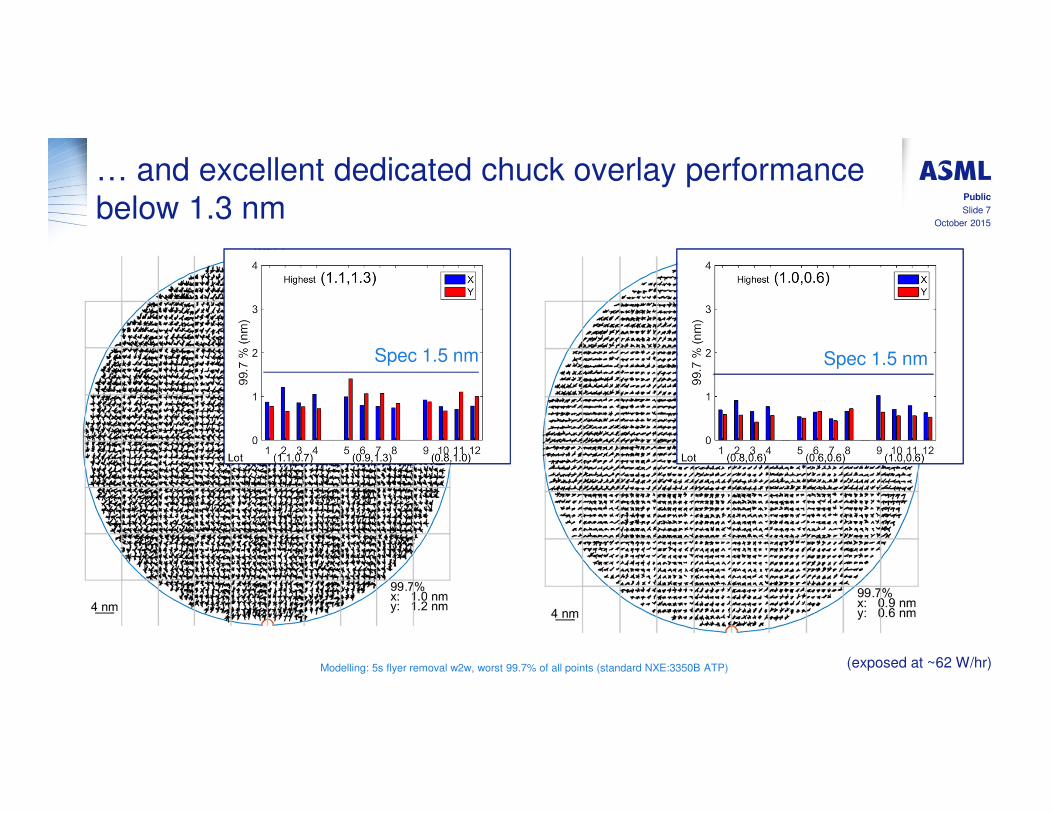
… and excellent dedicated chuck overlay performance
below 1.3 nm
Spec 1.5 nmSpec 1.5 nm
Modelling: 5s flyer removal w2w, worst 99.7% of all points (standard NXE:3350B ATP) (exposed at ~62 W/hr)
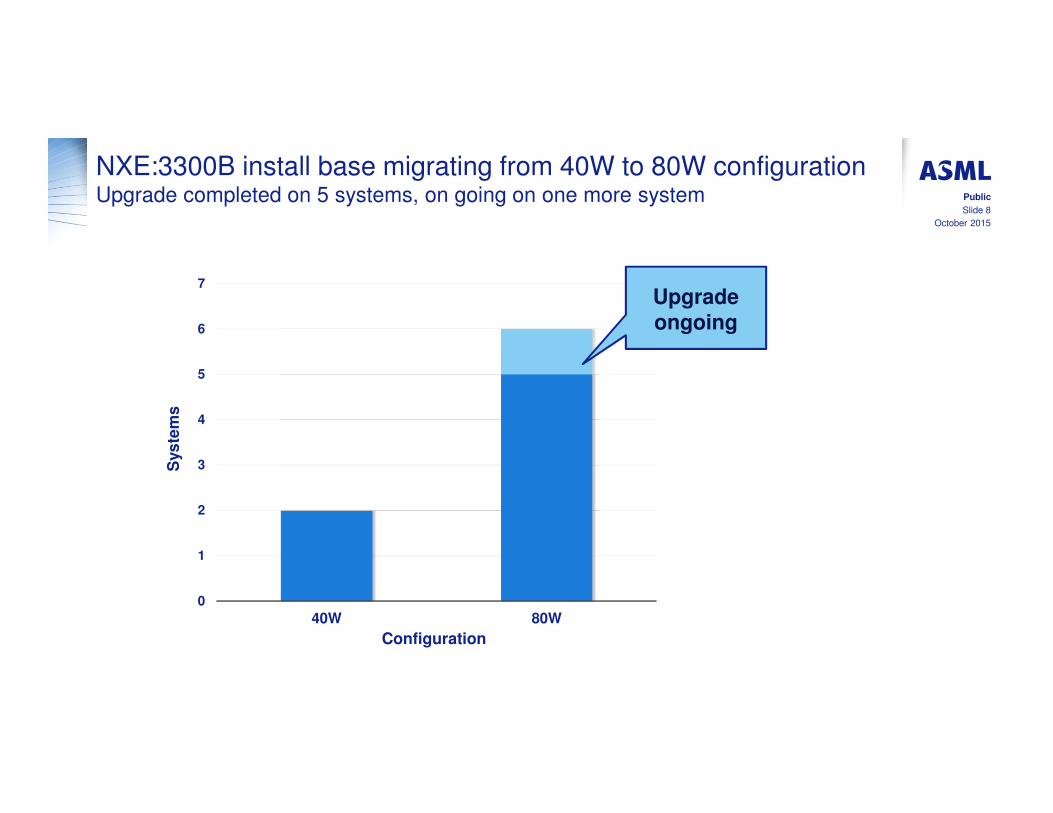
NXE:3300B install base migrating from 40W to 80W configurationUpgrade completed on 5 systems, on going on one more system
October 2015
Public
Slide 8
0
1
2
3
4
5
6
7
40W 80W
Sys
tem
s
Configuration
Upgrade
ongoing
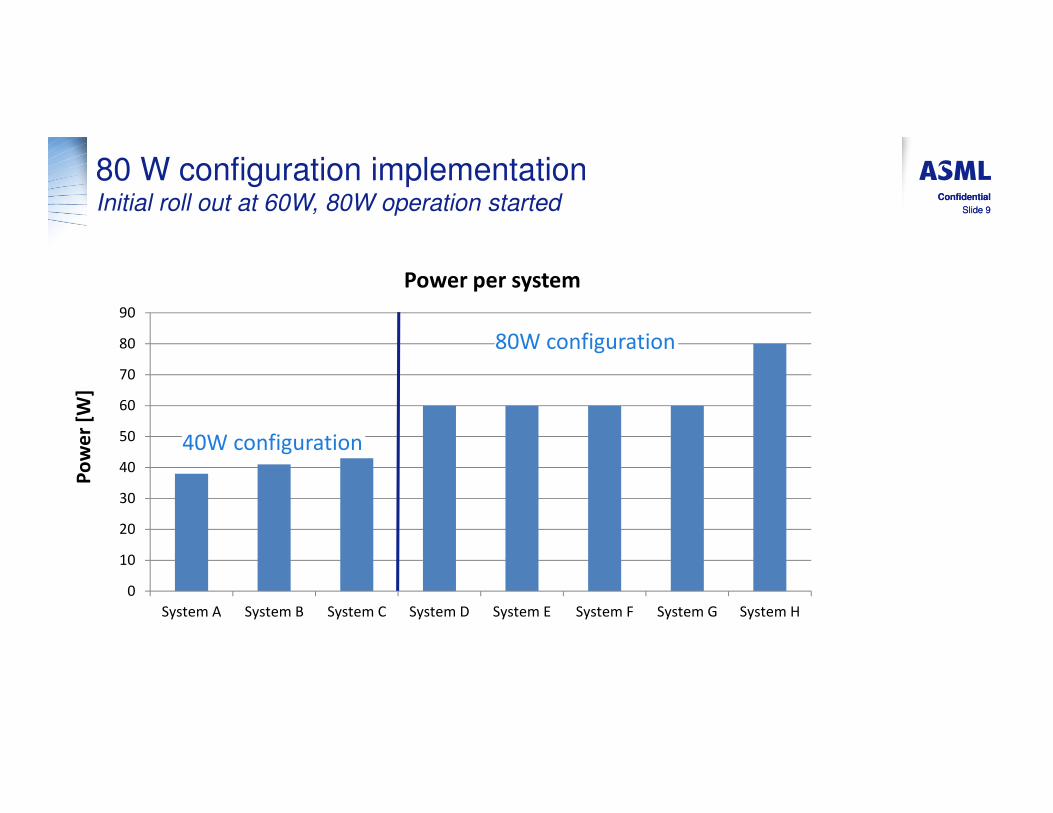
80 W configuration implementation Initial roll out at 60W, 80W operation started Slide 9
ConfidentialConfidential
Slide 9
0
10
20
30
40
50
60
70
80
90
System A System B System C System D System E System F System G System H
Po
we
r [W
]
Power per system
40W configuration
80W configuration
October 2015
Slide 10
Public
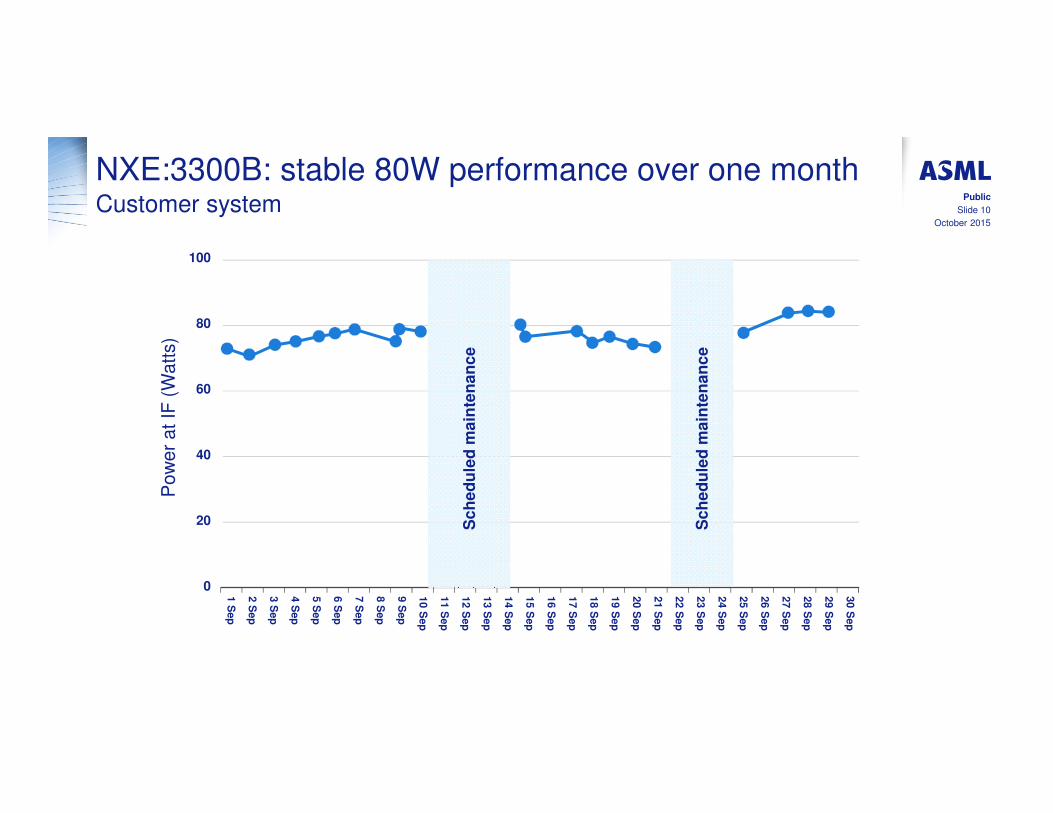
NXE:3300B: stable 80W performance over one monthCustomer system
100
80
60
40
20
0
1 S
ep
2 S
ep
3 S
ep
4 S
ep
5 S
ep
6 S
ep
7 S
ep
8 S
ep
9 S
ep
10 S
ep
11 S
ep
12 S
ep
13 S
ep
14 S
ep
15 S
ep
16 S
ep
17 S
ep
18 S
ep
19 S
ep
20 S
ep
21 S
ep
22 S
ep
23 S
ep
24 S
ep
25 S
ep
26 S
ep
27 S
ep
28 S
ep
29 S
ep
30 S
ep
Sc
he
du
led
ma
inte
na
nc
e
Sc
he
du
led
ma
inte
na
nc
e
Pow
er
at IF
(W
atts)
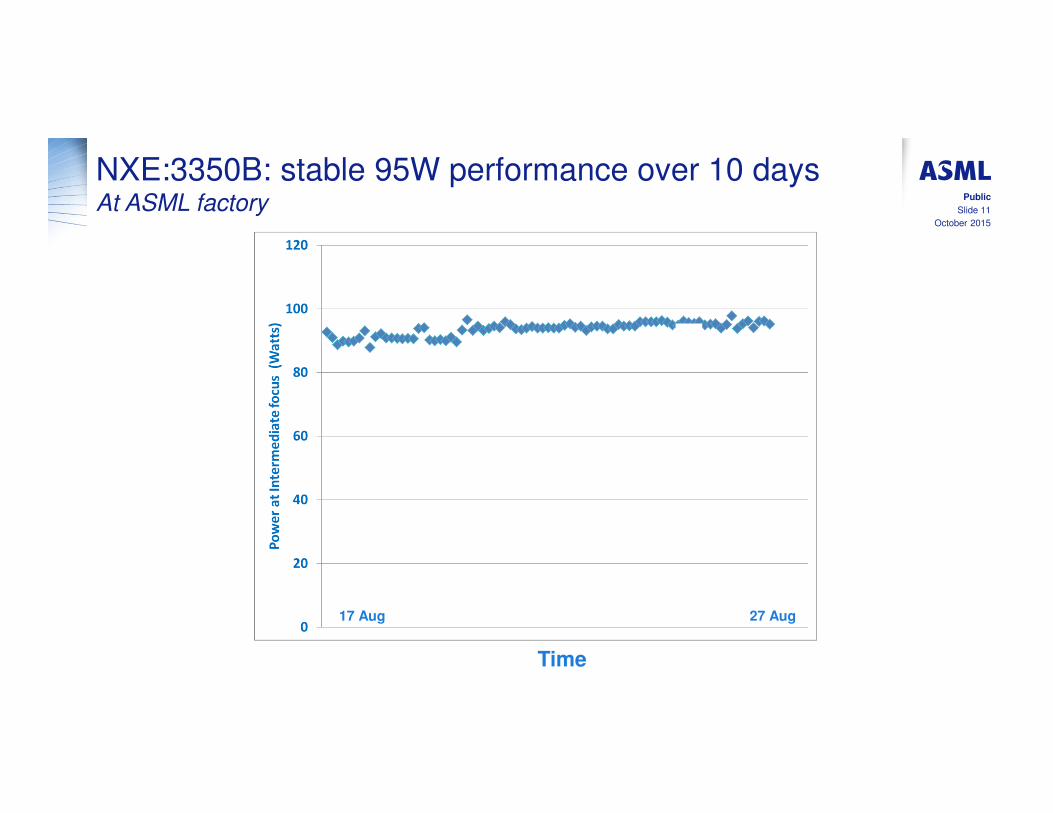
NXE:3350B: stable 95W performance over 10 daysAt ASML factory
October 2015
Public
Slide 11
17 Aug 27 Aug
Time
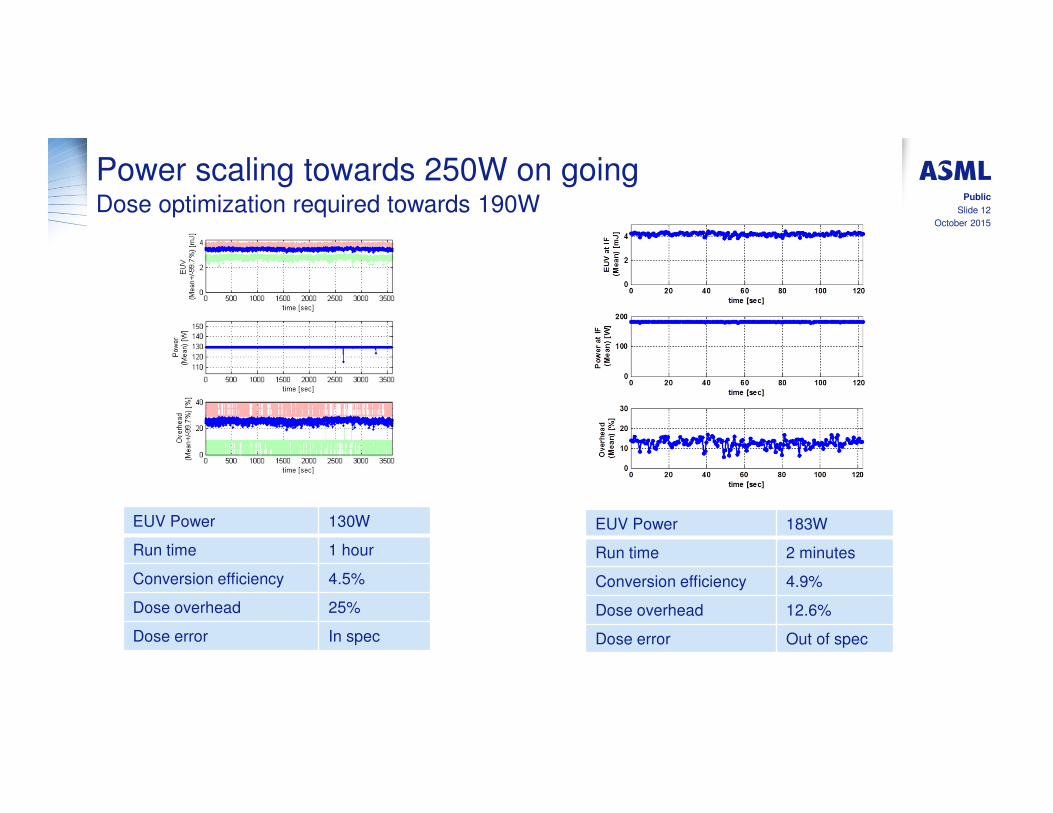
Power scaling towards 250W on goingDose optimization required towards 190W
EUV Power 183W
Run time 2 minutes
Conversion efficiency 4.9%
Dose overhead 12.6%
Dose error Out of spec
EUV Power 130W
Run time 1 hour
Conversion efficiency 4.5%
Dose overhead 25%
Dose error In spec
October 2015
Public
Slide 12
October 2015
Slide 13
Public
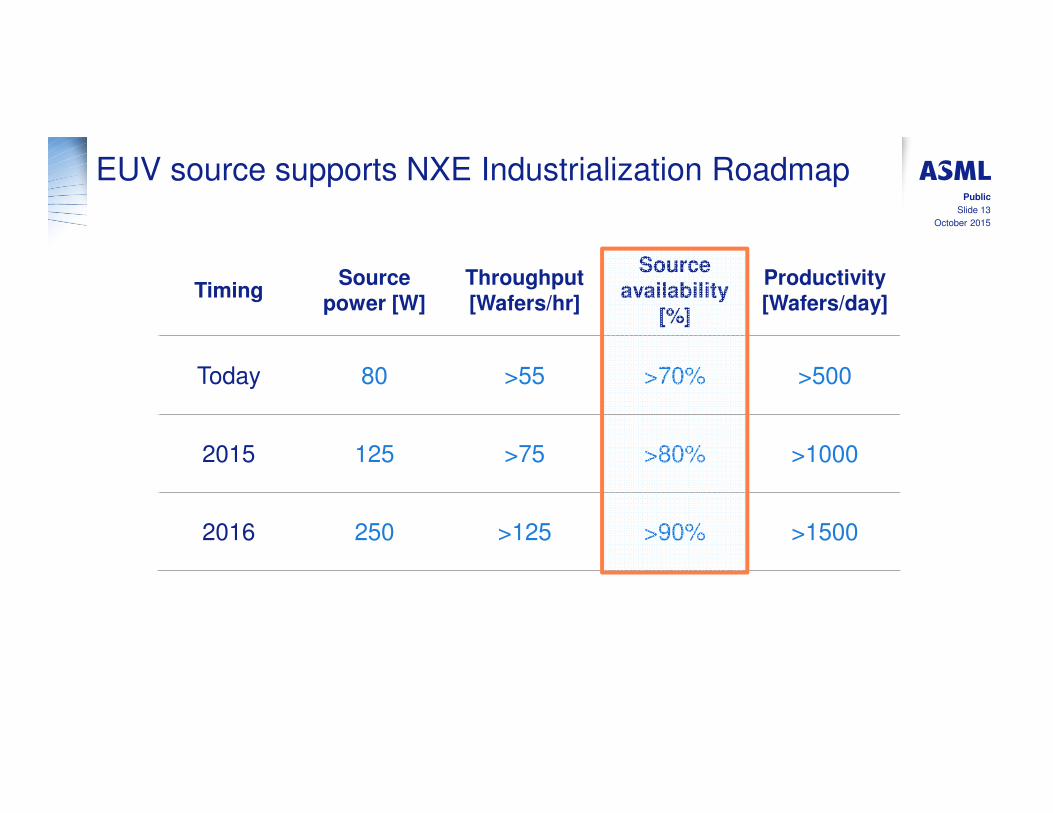
EUV source supports NXE Industrialization Roadmap
TimingSource
power [W]
Throughput
[Wafers/hr]
Source
availability
[%]
Productivity
[Wafers/day]
Today 80 >55 >70% >500
2015 125 >75 >80% >1000
2016 250 >125 >90% >1500
October 2015
Public
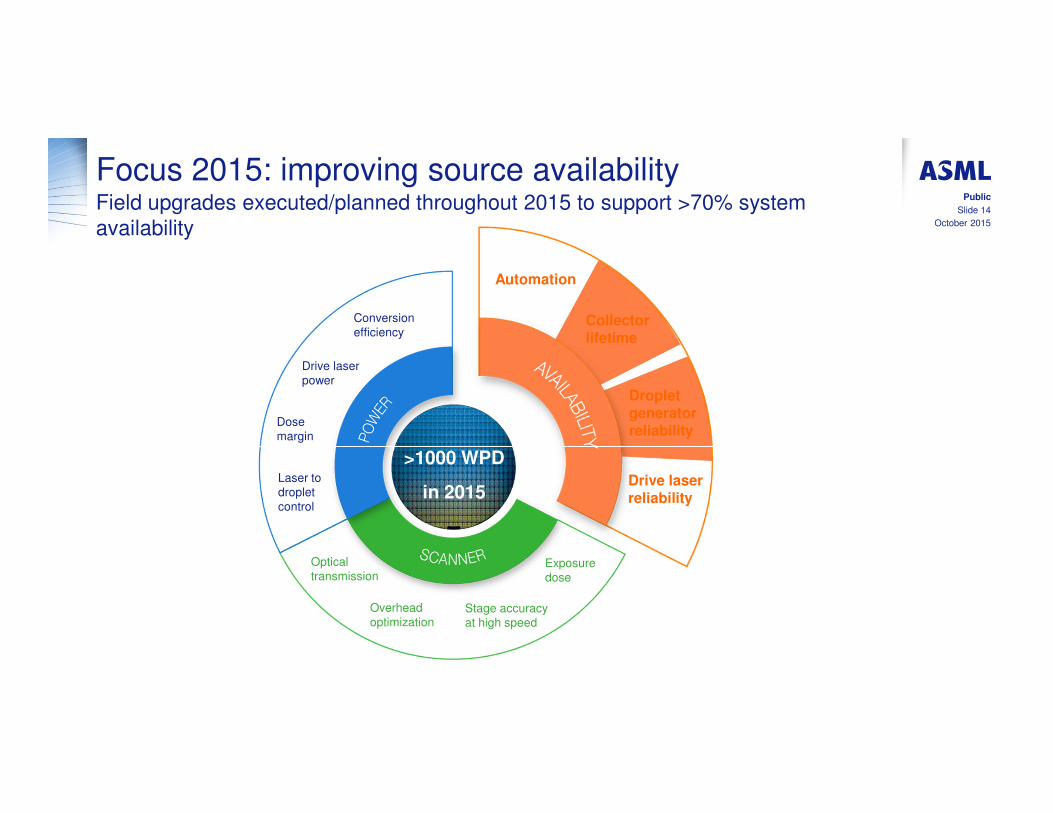
Focus 2015: improving source availabilityField upgrades executed/planned throughout 2015 to support >70% system
availability
Conversion
efficiency
Dose
margin
Drive laser
power
Laser to
droplet
control
Optical
transmission
Overhead
optimization
Exposure
dose
Stage accuracy
at high speed
>1000 WPD
in 2015
Automation
Collector lifetime
Droplet generator reliability
Drive laser reliability
Slide 14
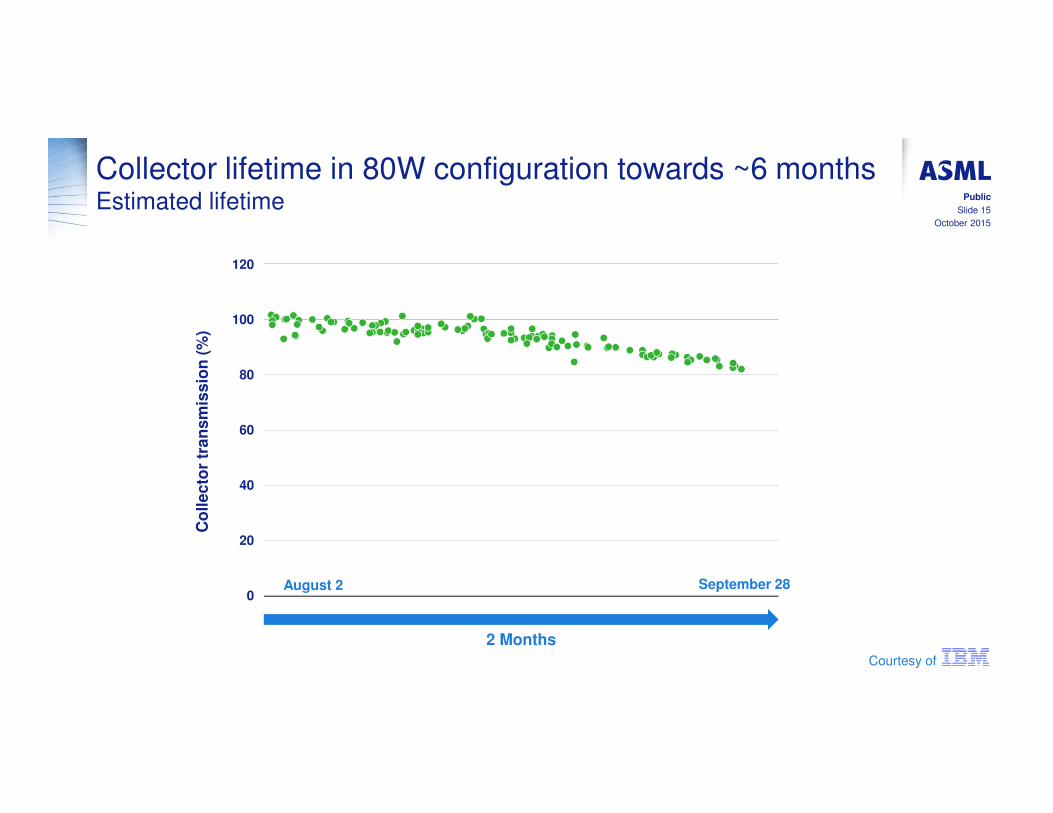
Collector lifetime in 80W configuration towards ~6 months Estimated lifetime
October 2015
Public
Slide 15
2 Months
120
Co
lle
cto
r tr
an
sm
iss
ion
(%
)
100
80
40
20
0
60
Courtesy of
August 2 September 28
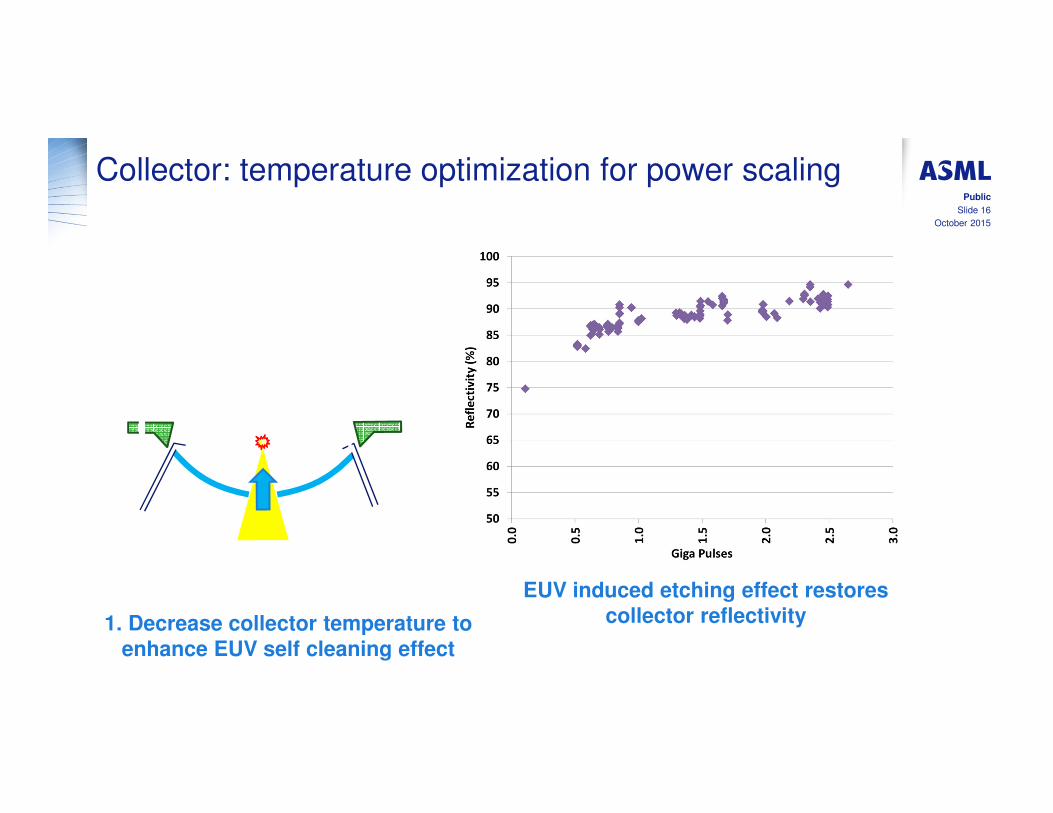
Collector: temperature optimization for power scaling
October 2015
Public
Slide 16
1. Decrease collector temperature to
enhance EUV self cleaning effect
EUV induced etching effect restores
collector reflectivity
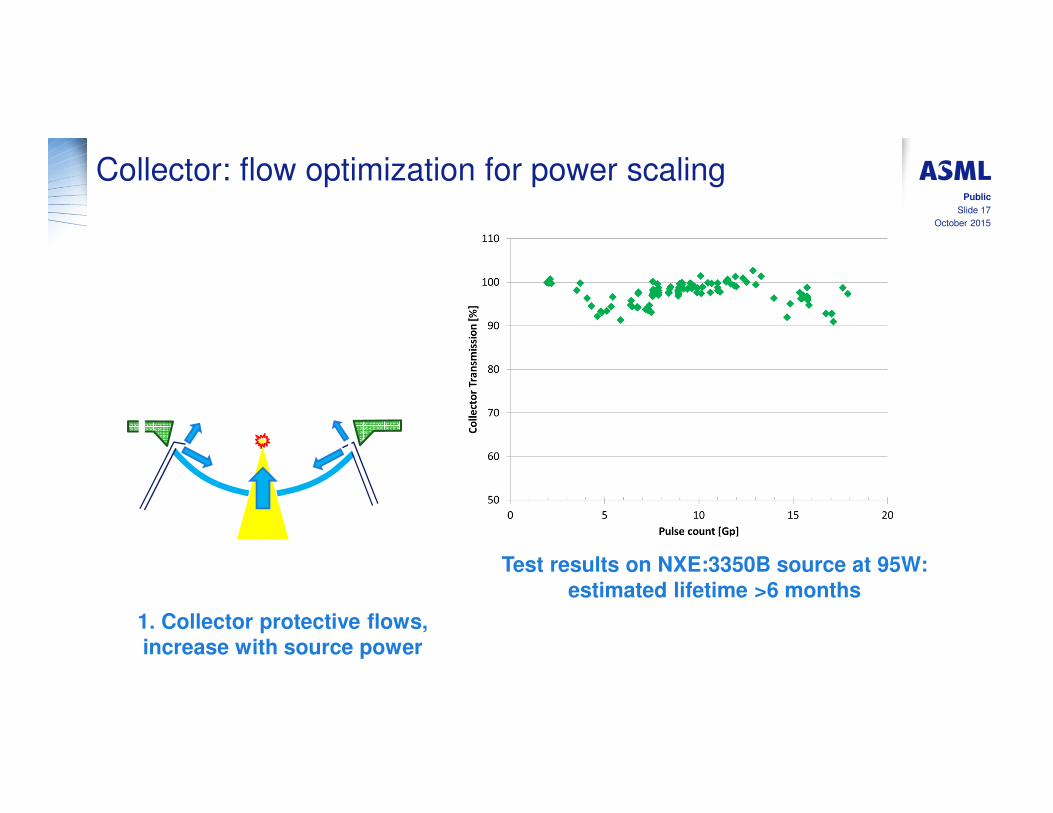
Collector: flow optimization for power scaling
October 2015
Public
Slide 17
1. Collector protective flows,
increase with source power
Test results on NXE:3350B source at 95W:
estimated lifetime >6 months
October 2015
Public
Slide 18
In situ collector cleaning to extend lifetime
October 2015
Slide 19
Public
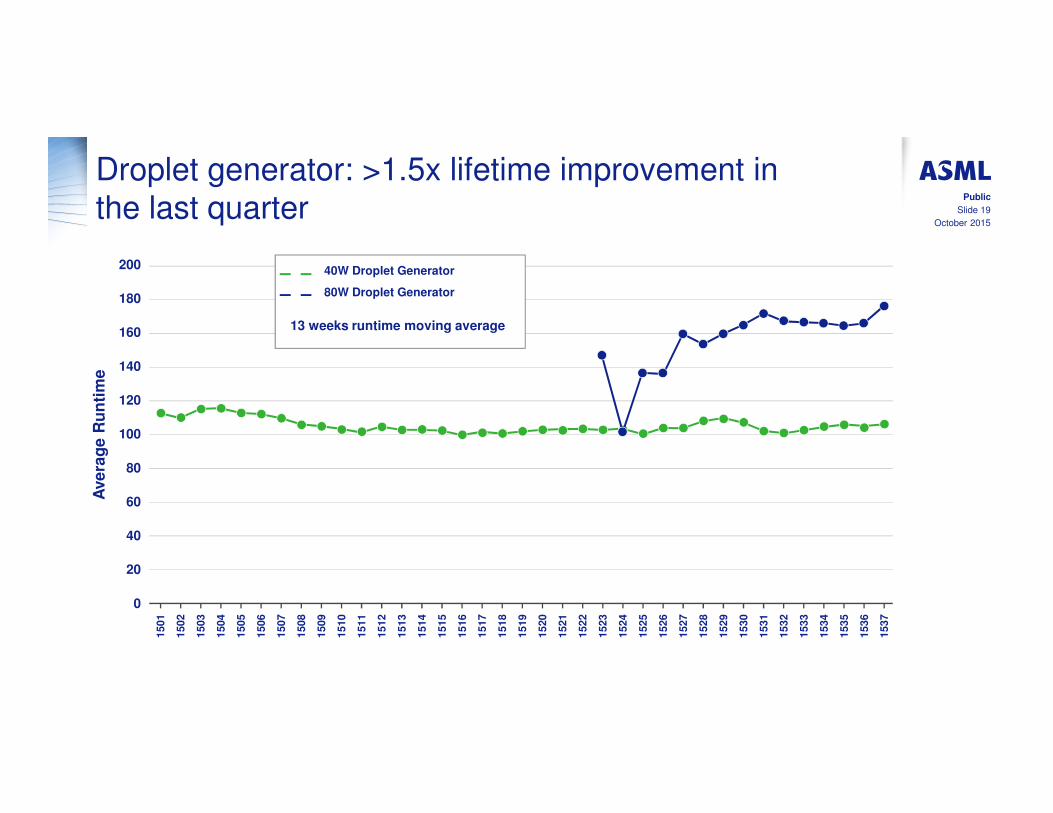
Droplet generator: >1.5x lifetime improvement in
the last quarter
200
180
160
140
120
100
80
60
40
20
0
1501
Ave
rag
e R
un
tim
e
1502
1503
1504
1505
1506
1507
1508
1509
1510
1511
1512
1513
1514
1515
1516
1517
1518
1519
1520
1521
1522
1523
1524
1525
1526
1527
1528
1529
1530
1531
1532
1533
1534
1535
1536
1537
40W Droplet Generator
80W Droplet Generator
13 weeks runtime moving average
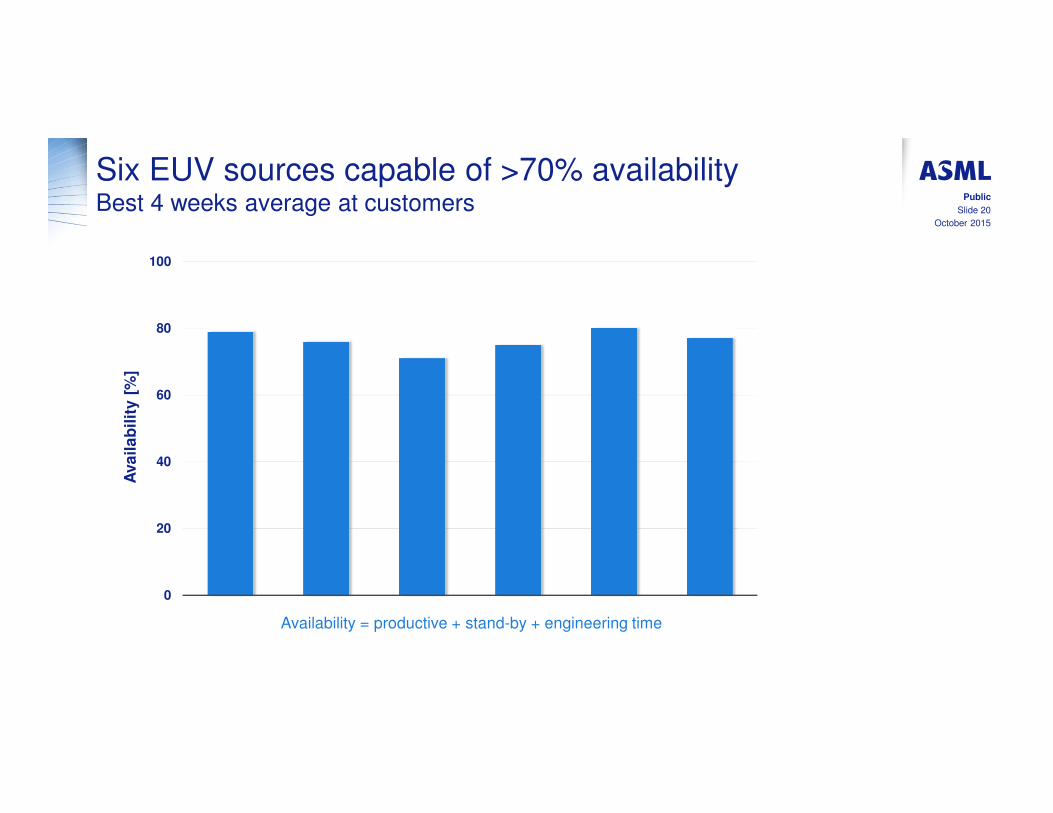
Six EUV sources capable of >70% availability Best 4 weeks average at customers
Availability = productive + stand-by + engineering time
October 2015
Public
Slide 20
0
20
40
60
80
100
Ava
ila
bil
ity [
%]
0%
10%
20%
30%
40%
50%
60%
70%
80%
90%
100%
26 27 28 29 30 31 32 33 34 35 36 37 38
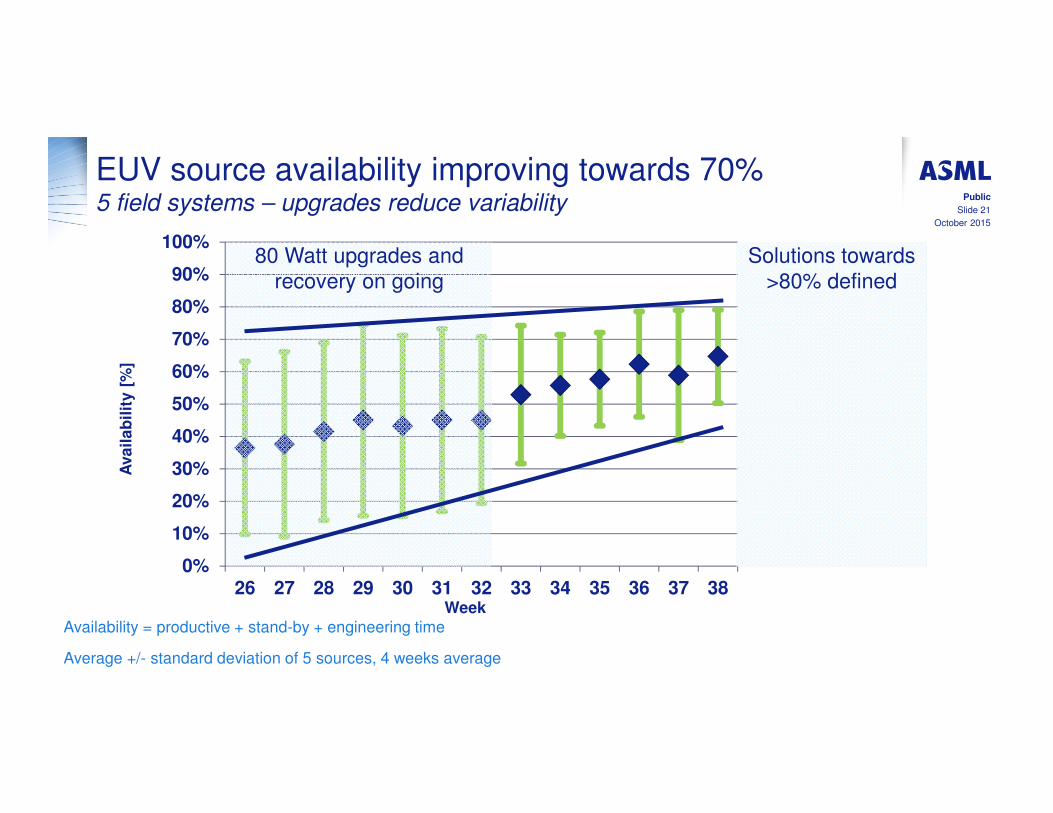
EUV source availability improving towards 70%5 field systems – upgrades reduce variability
Availability = productive + stand-by + engineering time
Average +/- standard deviation of 5 sources, 4 weeks average
October 2015
Public
Slide 21
Ava
ila
bil
ity [
%]
Week
80 Watt upgrades and
recovery on going
Solutions towards
>80% defined
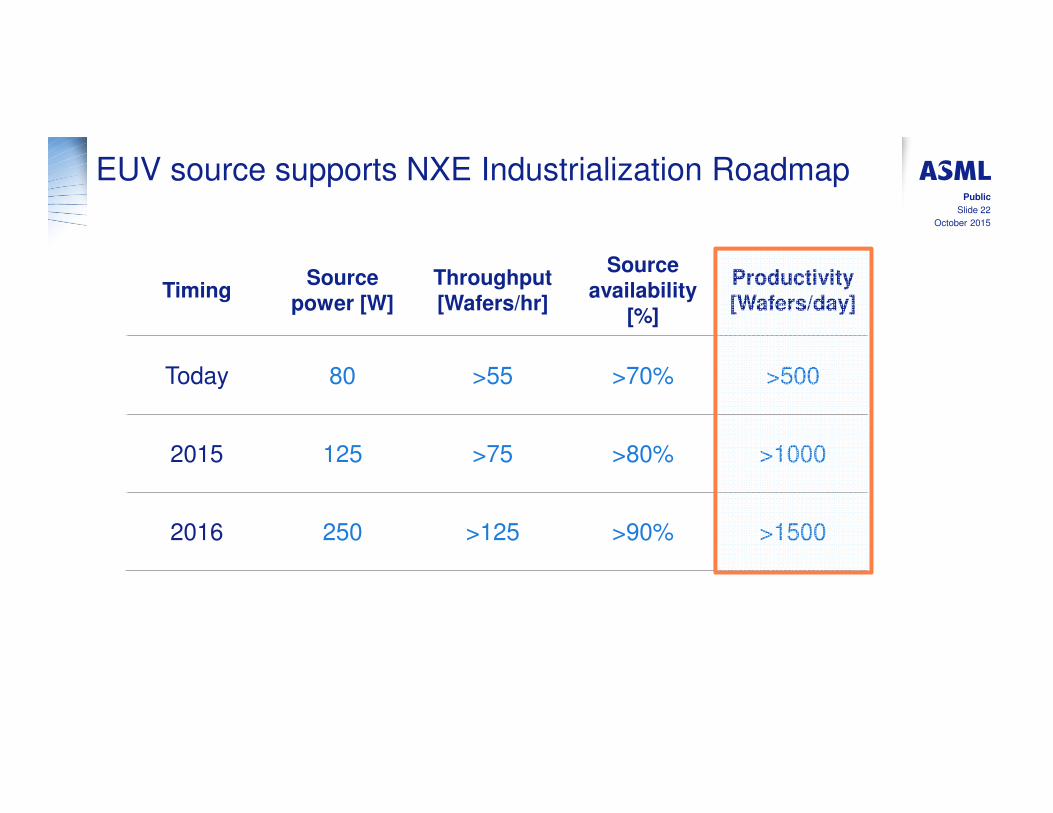
EUV source supports NXE Industrialization Roadmap
TimingSource
power [W]
Throughput
[Wafers/hr]
Source
availability
[%]
Productivity
[Wafers/day]
Today 80 >55 >70% >500
2015 125 >75 >80% >1000
2016 250 >125 >90% >1500
October 2015
Public
Slide 22
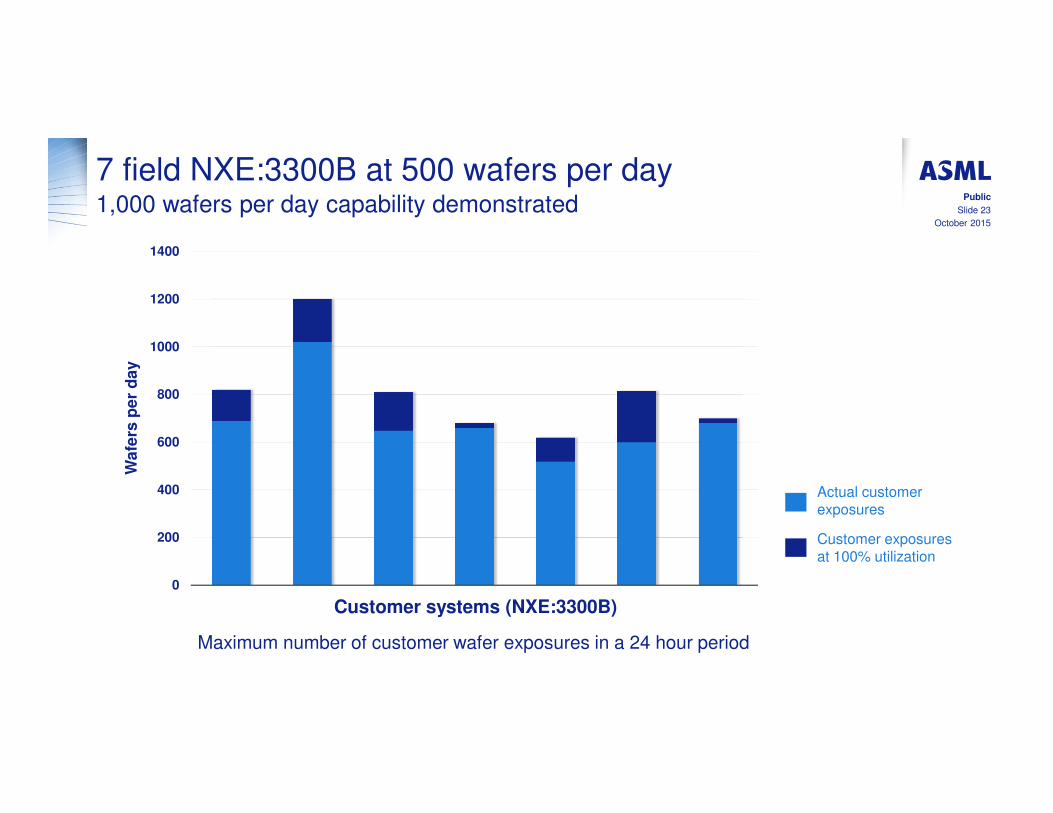
7 field NXE:3300B at 500 wafers per day1,000 wafers per day capability demonstrated
Maximum number of customer wafer exposures in a 24 hour period
Customer systems (NXE:3300B)
October 2015
Public
Slide 23
0
200
400
600
800
1000
1200
1400
Actual customer exposures
Customer exposures at 100% utilization
Wa
fers
pe
r d
ay
October 2015
Slide 24
Public
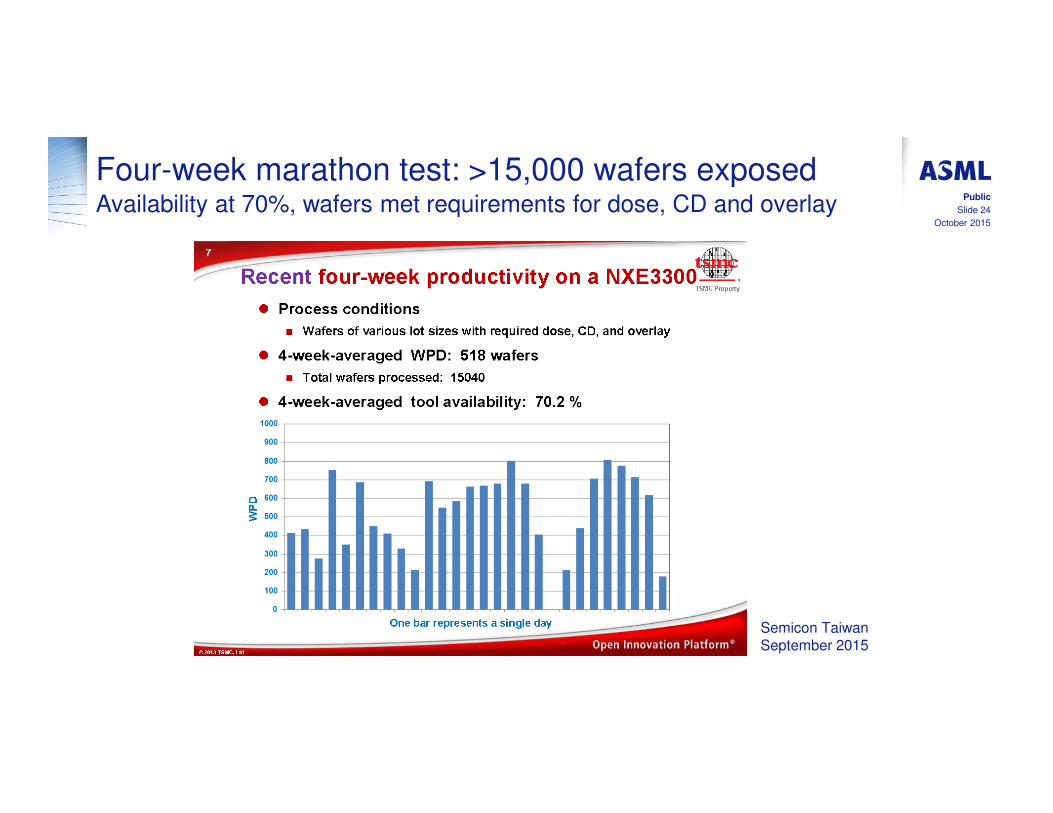
Four-week marathon test: >15,000 wafers exposedAvailability at 70%, wafers met requirements for dose, CD and overlay
Semicon TaiwanSeptember 2015
October 2015
Slide 25
Public
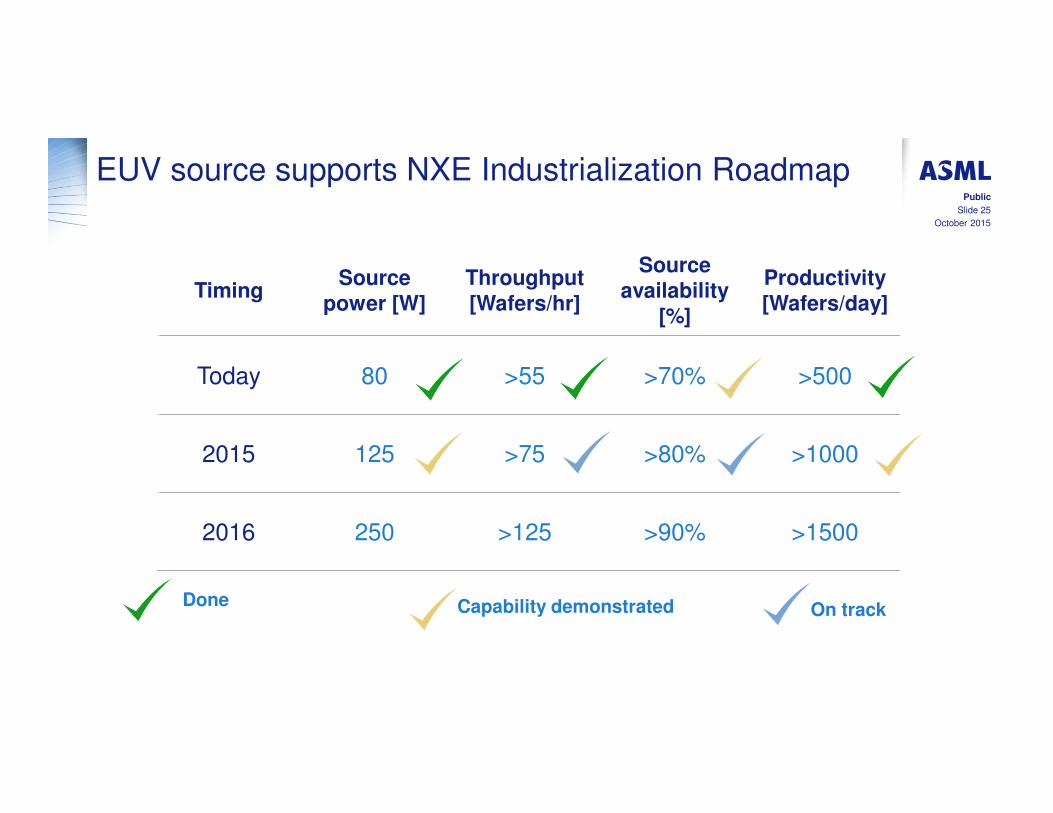
EUV source supports NXE Industrialization Roadmap
TimingSource
power [W]
Throughput
[Wafers/hr]
Source
availability
[%]
Productivity
[Wafers/day]
Today 80 >55 >70% >500
2015 125 >75 >80% >1000
2016 250 >125 >90% >1500
Done Capability demonstrated On track
October 2015
Slide 26
Public
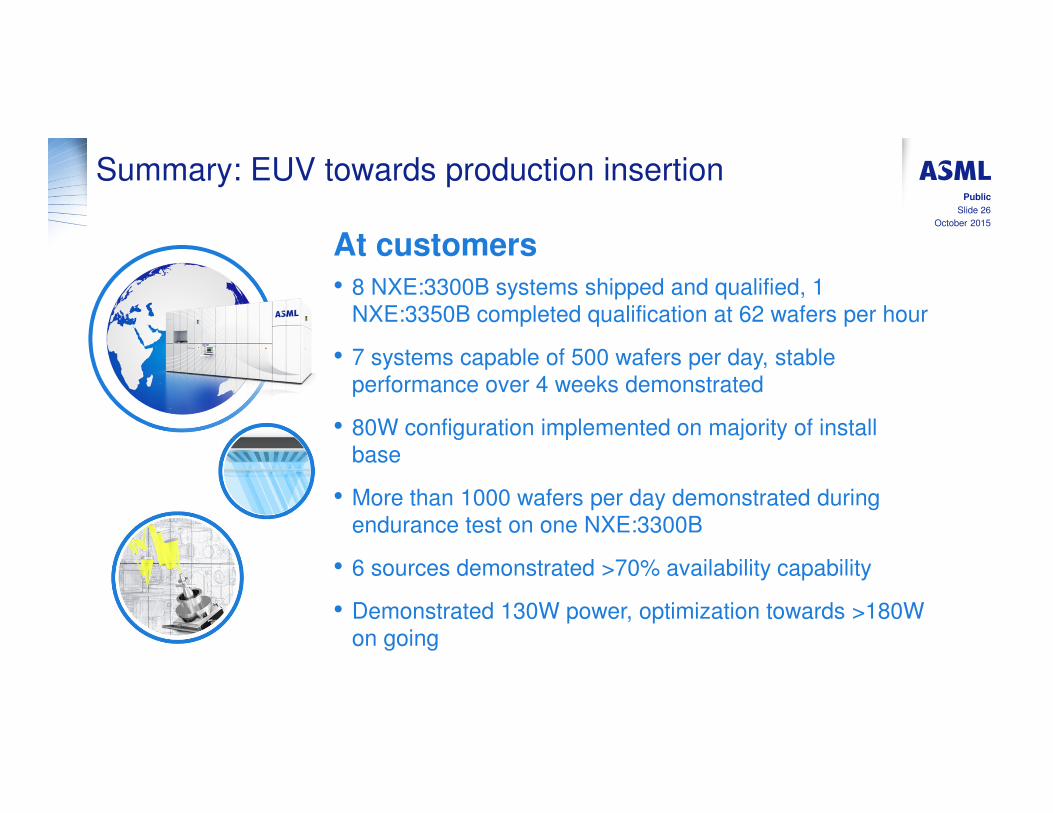
Summary: EUV towards production insertion
At customers
• 8 NXE:3300B systems shipped and qualified, 1 NXE:3350B completed qualification at 62 wafers per hour
• 7 systems capable of 500 wafers per day, stable performance over 4 weeks demonstrated
• 80W configuration implemented on majority of install base
• More than 1000 wafers per day demonstrated during endurance test on one NXE:3300B
• 6 sources demonstrated >70% availability capability
• Demonstrated 130W power, optimization towards >180W on going
Acknowledgements
ASML customers
ASML employees:
Sjoerd Lok, Marrit Hermans, Yong-Jin Byun,
Jeannot Driedonkx, Nicolae Maxim, Lisa
Mohanty, Niclas Mika, Sander Hofmann,
Tomasz Bak, Giuseppina Toto, Jan-Willem
van der Horst, Jowan Jacobs, William van
Drent, Ivo de Jong


