
Seedcamp Catalysing Europe’s Next Generation Technology Entrepreneurs.
December 2016
Europe’s Hidden EntrepreneursEntrepreneurial Employee Activity and Competitiveness in Europe

B Europe’s Hidden Entrepreneurs
World Economic Forum2016 – All rights reserved.
No part of this publication may be reproduced or transmitted in any form or by any means,including photocopying and recording, or by any information storage and retrieval system.

Europe’s Hidden Entrepreneurs 1
PrefaceContents
Preface
Executive summary
3 1. Introduction
3 1.1. Background: Our work to date4 1.2. Methodology4 1.3. Report outline
5 2. Entrepreneurial employee activity in European economies
5 2.1. Europe’s entrepreneurship puzzle
6 2.2. Completing the puzzle: Adding entrepreneurial employee activity to the story
6 2.3. An updated view of entrepreneurial activity in Europe
9 3. Entrepreneurial employee activity, competitiveness and regional clusters in Europe
9 3.1. The relationship between competitiveness and entrepreneurial employee activity
11 3.2. Competitiveness clusters and entrepreneurship
14 4. Country profiles of select economies
14 4.1. North and West Europe cluster: Germany
16 4.2. East Europe cluster: Poland
17 4.3. South Europe cluster: Italy
19 4.4. Baltics and Slovenia cluster: Estonia
21 5. Conclusions and implications
Appendices23 Appendix 1: Cluster analysis
23 Appendix 2: Economies in the global sample
24 Appendix 3: Correlation matrix
Endnotes
Acknowledgements
A major feature of the Fourth Industrial Revolution is the decentralization of innovation. Historically, innovation came from legendary laboratories or the state-of-the-art research campuses of large corporations and educational institutions. Now the next big breakthrough is likely to come from a suburban garage, cramped apartment or college dorm room. This new wave of inventiveness is fuelled by entrepreneurs who are the vanguard of innovative thinking in the new economy and are a core component of a dynamic society. Fostering entrepreneurship pays dividends across sectors and allows new ideas, models and energy to invigorate the entire international economic system. Entrepreneurship is a key driver of the Fourth Industrial Revolution and the reason the World Economic Forum and the Global Entrepreneurship Monitor (GEM) have partnered to explore it within one of the world’s crucial economic engines: Europe.
Our previous report, Leveraging Entrepreneurial Ambition and Innovation, found that Europe lags the world in entrepreneurship in terms of business starts (businesses started based on a new idea). Business starts, however, tell only half the story of European entrepreneurship. This report focuses on a hidden aspect of European innovation – intrapreneurship. Intrapreneurship involves workers formulating and implementing new ideas within organizations rather than starting their own businesses. In other words, Europe doesn’t lack entrepreneurs, they just choose to innovate inside larger organizations. This is part of the reason economies like Denmark, Sweden and the United Kingdom maintain such vibrant, cutting-edge economies despite low levels of business starts. The innovation and vitality European workers are injecting into the global economy come from entrepreneurs within organizations whose existence is masked by competing methods of measurements.
This report draws upon data from the Forum’s Global Competitiveness Index and GEM’s Adult Population Survey to analyse the associations between the competitiveness of European economies and the types of entrepreneurship exhibited. The analysis highlights the impact of intrapreneurial activity and how it changes the overall picture of European entrepreneurship. This report encourages decision-makers to look at the whole picture of entrepreneurship when designing policies. Leveraging the positive impacts of the Fourth industrial Revolution will depend on the energy and inventiveness of entrepreneurs around the world so understanding how and where they work will be crucial to national, regional and, ultimately, global success.
Cheryl MartinHead of the Centre for Global Industries

2 Europe’s Hidden Entrepreneurs
In partnership with the Global Entrepreneurship Monitor (GEM), the World Economic Forum undertook this study to explore the truth behind the perception that Europe lacks entrepreneurship. The results presented here show that, in fact, entrepreneurs are thriving in some parts of Europe. However, their successes are often obscured by the fact that many entrepreneurs work within organizations rather than in new business start-ups.
Two unique data sets were combined for this study: the World Economic Forum’s Global Competitiveness Index data, which rank economies on their economic competitiveness, and GEM’s assessment of entrepreneurial activity. These data showed that many European economies do not lack entrepreneurial activity. Instead, due to the risk and opportunity profiles that European economies offer, entrepreneurial individuals in Europe frequently choose to start new ventures or projects while working for their employers rather than start their own business. Where this occurs, a shift into intrapreneurship is observed, also known as entrepreneurial employee activity (EEA).
EEA is not a widespread phenomenon. Only about 4% of the working-age populations in the sample of European economies are currently involved in EEA, but its prevalence differs markedly across individual countries, from slightly more than zero to almost 10%. EEA does not make Europe the world’s most entrepreneurial region. Most other regions of the world have higher rates of business start-up, including higher proportions of necessity-based entrepreneurship. Still, EEA helps some European economies narrow the gap with other regions and, because EEA tends to be of higher quality in terms of growth potential, helps explain why Europe remains highly competitive despite low rates of business starts.
Sweden and Denmark are at the top of the European EEA rankings, outperforming the other economies in the sample by a significant margin. Since neither economy has a high rate of total early-stage entrepreneurial activity (TEA), this changes the view of how entrepreneurial they are – showing them to be more entrepreneurial than their rate of TEA suggests. Most northern and western European economies show a similar, though less pronounced effect.
Most of the eastern European and Baltic economies experience the opposite effect: while they have high rates of business formation, they have generally lower rates of EEA. At the bottom of the EEA rankings are the southern European economies that – with the exception of Portugal – do not report high rates of entrepreneurship in any form.
The important implications for policy-makers include:
Executive summary
1.
2.
3.
4.
5.
6.
Entrepreneurial activity goes beyond business starts; to focus on this measure exclusively misses an important aspect of entrepreneurship.
EEA is an important asset to an economy and should be reflected in policy accordingly.
Economies differ across a typology of clusters and therefore there is no one-size-fits-all solution to jump-start entrepreneurship.
Social and cultural values matter, which means the time frames for change can be decades, not years. However, top management can change corporate cultures and release latent entrepreneurial potential, short-circuiting the slow change of national cultures.
Several economies in the sample have succeeded in promoting entrepreneurship, including EEA, showing that policies matter and can achieve successful outcomes if designed appropriately.
Business formation and EEA are complementary; policy-makers should actively encourage collaborative innovation and develop policies that incentivize it wherever possible.
Europe’s Hidden Entrepreneurs 3
It is hardly a new insight to say entrepreneurship is a critical driver of growth, innovation and prosperity. Both the World Economic Forum and Global Entrepreneurship Monitor (GEM) have studied this link extensively – most recently in the joint report entitled Leveraging Entrepreneurial Ambition and Innovation: A Global Perspective on Entrepreneurship, Competitiveness and Development. However, while the general principle that entrepreneurship is a pillar of growth is well understood, governments and policy-makers are perplexed about the best ways to support it. This is especially true of economies with ostensibly low levels of entrepreneurship.
Europe is a vexing case in this regard, as many European economies are among the most competitive in the world. In the Forum’s 2014-2015 Global Competitiveness Index ranking, six of the top 10 economies are European. This high level of competitiveness is reflected in high productivity levels generally, and by the significant number of leading multinational companies that compete globally. And yet, our recent research shows that many European economies exhibit a poor record with regard to entrepreneurial business starts.
This report, part of the World Economic Forum’s work on Enhancing European Competitiveness, aims to resolve this issue. European firms and political leaders could help achieve this growth in entrepreneurship by taking a more expansive perspective of this activity. By taking into account entrepreneurial activity that happens within firms – also known as entrepreneurial employee activity (EEA) or, more commonly, intrapreneurship – Europe’s entrepreneurial capabilities improve dramatically and new policy options emerge. This report proposes that European leaders invest time, energy and capital in EEA, and develop competitive advantages that will play to Europe’s strengths, rather than to try and emulate other regions that are driven by spin-offs and independent entrepreneurship, like Silicon Valley.
Section 1
Introduction
Box 1: Definitions
EEA Entrepreneurial employee activity is the proportion of the population aged between 18 and 64 currently actively involved in and playing a leading role in idea development or in the preparation and implementation of a new activity for their employer, such as developing or launching new goods or services, or setting up a new business unit or subsidiary.
TEA Total early-stage entrepreneurial activity is the proportion of the population aged between 18 and 64 either actively trying to start a new business, or managing a business that is less than three-and-a-half years old, in which they have an ownership stake. It can be broken into opportunity- based TEA (most easily explained as entrepreneurs who could find a job but choose to branch out on their own) and necessity-based TEA (most easily explained as entrepreneurs who could not find a job and had to start a business to survive).
1.1. Background: The work to date
This report builds on a substantial line of work produced both jointly and individually by the World Economic Forum and Global Entrepreneurship Monitor. Over the past three years, the Forum’s work on enhancing European competitiveness has produced several insights. The Enhancing Europe’s Competitiveness: Fostering Innovation-driven Entrepreneurship in Europe 1 report showed that, while Europe has an increasingly vibrant set of entrepreneurship hubs, young firms face a wide range of barriers when it comes to scaling up their great ideas. The region, therefore, needs to invest in both frameworks for commercialization within a large number of countries and in the cross-country links that enable firms, research centres and governments to take advantage of Europe’s regional markets and assets.
4 Europe’s Hidden Entrepreneurs
Introduction
The joint Forum and GEM report, Leveraging Entrepreneurial Ambition and Innovation 2, revealed that Europe has a lower rate of entrepreneurship than other economies, as measured in business starts. Nevertheless, to conclude that Europe lacks entrepreneurship would not be capturing the whole story. GEM’s Special Report on Entrepreneurial Employee Activity 3 provided the first clues as to where many of Europe’s entrepreneurs go: into corporations. Undetected by traditional metrics that capture entrepreneurial activity, they are Europe’s hidden entrepreneurs.
Since 1999, GEM Global reports have demonstrated how entrepreneurial attitudes and activities compare across European countries – and in a global perspective. GEM has supplied custom data to the European Commission for its joint project with the OECD on “Inclusive Entrepreneurship in Europe”.4 Individual national GEM teams in Europe have contributed with annual country reports, which inform policy by contributing unique information on the entrepreneurial attitudes, activity and aspirations of Europeans. As a result, the European Commission draws on GEM data to inform its Small Business Act country fact sheets, providing timely data on countries’ progress in implementing the Small Business Act.5 Most recently, the Collaborative Innovation: Transforming Business, Driving Growth 6 report examined the critical importance existing firms and corporations play in galvanizing innovation and entrepreneurship in the European context.
Taken together, to date this work has developed a substantive range of policy proposals that cover the full range of actions governments can undertake to build an ecosystem that supports innovation, by both individuals and teams, in new and established businesses, and by interactions between them.
1.2. MethodologyDrawing from the Forum’s own Global Competitiveness Index (GCI) and GEM’s Adult Population Survey, this report summarizes the associations between competitiveness and the nature of entrepreneurship in those economies. To maximize the robustness of the findings from the two data sets, the study averages the aggregate GCI scores for competitiveness from the 2011-2012 to 2014-2015 surveys and averages GEM’s annual entrepreneurship data from its 2011-2014 surveys, where available for an economy.
Using the competitiveness data, a cluster analysis was performed to identify four groups of like economies and draw broader conclusions about how competitiveness and entrepreneurship are related (see Appendix 1).
1.3. Report outlineThis report aims to uncover Europe’s hidden entrepreneurs and develop policy proposals on how to leverage them for greater innovation and growth. It argues that this strategy plays to Europe’s strengths as an economic region of high competitiveness, with successful international corporations that drive innovation through internal and collaborative innovation. To do so, the report does four things:
— Section 2 describes the entrepreneurial landscape in Europe through mapping EEA and other forms of entrepreneurial activity.
— Section 3 assesses the relationship between EEA and competitiveness and explores the role regional groups play, across four clusters of European economies, which all differ in terms of their competitiveness pillars.
— Section 4 presents case studies for four economies, offering insight into the interaction between the competitiveness pillars and EEA.
— Section 5 draws conclusions and summarizes policy implications to support entrepreneurial activity in whichever form it takes, whether in business starts or within firms by employees.
government, business and civil society regarding the actions required to improve economic prosperity. Competitiveness in the GCI is defined as the set of institutions, policies and factors that determine the level of productivity of a country. The level of productivity, in turn, determines the level of prosperity that can be attained in an economy. The GCI captures the different aspects of competitiveness in 12 pillars. Each of these pillars is scored on a scale from 1 to 7, with 7 being the most competitive. This report averages the scores of each country from 2011-2012 to 2014-2015.
Global Entrepreneurship Monitor (GEM)The GEM is the largest ongoing annual study of entrepreneurial activity in the world, exploring the role of entrepreneurship in economic growth within nations by unveiling detailed national features and characteristics associated with their entrepreneurial activity. Initiated in 1999 as a partnership between London Business School and Babson College, the first study covered 10 countries; since then, more than 100 “national teams” worldwide have participated in the research. The national teams oversee annual surveys of at least 2,000 adults (aged between 18 and 64) in their respective countries, assessing the rate and profile of entrepreneurship, the motivations and aspirations of entrepreneurs and social attitudes towards entrepreneurial activity. The data collected are overseen by a central team of experts who guarantee its quality and “harmonize” it to facilitate cross-national comparisons. With its focus on individuals, GEM offers a lens to view the people who participate in entrepreneurship at all phases of the entrepreneurial process. Additionally, unlike studies focusing on business registrations, GEM captures both informal and formal entrepreneurship and both new business creation activity and entrepreneurial employee activity. In less competitive economies, a substantial portion of entrepreneurial activity is represented in the informal sector, while entrepreneurial employee activity is more significant in more competitive economies.
Box 2: Data sources
Global Competitiveness Index (GCI)The GCI assesses competitiveness in 144 economies, providing insight into their productivity drivers. The GCI is the most comprehensive worldwide assessment of national competitiveness, providing a platform for dialogue between
Europe’s Hidden Entrepreneurs 5
2.1. Europe’s entrepreneurship puzzle
European economies are not entrepreneurial. At least that’s the story as it is sometimes told, which, on the face of it, seems to be supported by past research. Compared to all other regions in the world, European economies – and in particular the most competitive ones – are behind others when it comes to the proportion of people starting businesses.
In Leveraging Entrepreneurial Ambition and Innovation, this was explained with a number of factors, ranging from cultural attitudes towards entrepreneurship to regulatory regimes that do not encourage it enough. And yet, it remains a paradox why so many of the world’s most successful and wealthy economies perform so poorly with regard to entrepreneurial activity.
Our last report found that European economies do not exhibit the same levels of early-stage entrepreneurial activity (also known as total early-stage entrepreneurial activity, or TEA) as other regions.
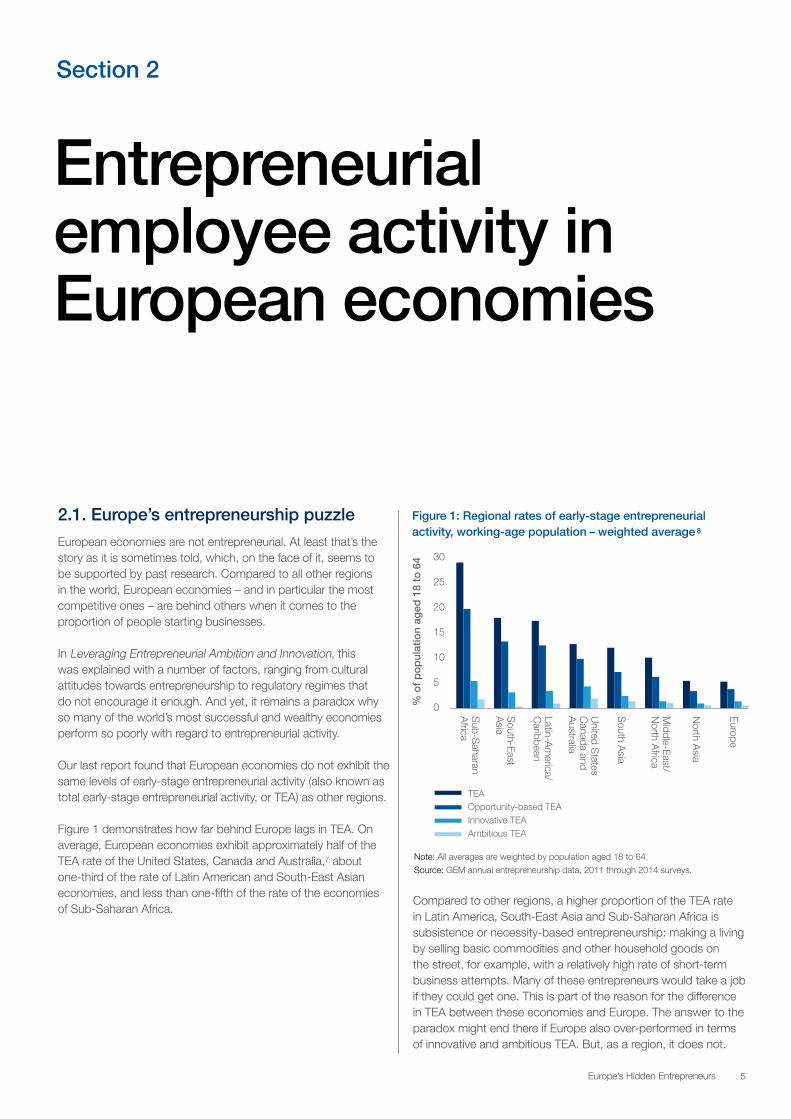
Figure 1 demonstrates how far behind Europe lags in TEA. On average, European economies exhibit approximately half of the TEA rate of the United States, Canada and Australia,7 about one-third of the rate of Latin American and South-East Asian economies, and less than one-fifth of the rate of the economies of Sub-Saharan Africa.
Compared to other regions, a higher proportion of the TEA rate in Latin America, South-East Asia and Sub-Saharan Africa is subsistence or necessity-based entrepreneurship: making a living by selling basic commodities and other household goods on the street, for example, with a relatively high rate of short-term business attempts. Many of these entrepreneurs would take a job if they could get one. This is part of the reason for the difference in TEA between these economies and Europe. The answer to the paradox might end there if Europe also over-performed in terms of innovative and ambitious TEA. But, as a region, it does not.
Section 2
Entrepreneurial employee activity in European economies
Figure 1: Regional rates of early-stage entrepreneurial activity, working-age population – weighted average 8
Note: All averages are weighted by population aged 18 to 64.
Source: GEM annual entrepreneurship data, 2011 through 2014 surveys.
TEA Opportunity-based TEA Innovative TEA Ambitious TEA
% o
f p
op
ulat
ion
aged
18
to 6
4 30
25
20
15
10
5
0 Europe
North A
sia
Middle-East/
North A
frica
South A
sia
United S
tates C
anada and A
ustralia
Latin-Am
erica/ C
aribbean
South-East
Asia
Sub-S
aharan A
frica

6 Europe’s Hidden Entrepreneurs
Figure 3: EEA and TEA in 28 European economies
EEA only Both TEA and EEA TEA only
Latvia
Estonia
Slovak R
epublic
Lithuania
Rom
ania
Netherlands
Austria
Poland
Portugal
Hungary
United K
ingdom
Bosnia &
Herzegovina
Luxenbourg
Croatia
Irland
Czech R
epublic
Sw
eden
Sw
itzerland
Greece
Norw
ay
Finland
Spain
Slovenia
Germ
any
Belgium
France
Denm
ark
Italy18%
16%
14%
12%
10%
8%
6%
4%
2%
0%
Source: GEM annual entrepreneurship data, 2011 through 2014 surveys.
Entrepreneurial employee activity in European economies
Figure 1 shows the average rate for innovative and ambitious TEA (which are both subgroups of entrepreneurs captured under TEA) by region. Innovative TEA entrepreneurs are defined as those who state their product or service is new to some, if not all, consumers in a given market in which few or no other businesses offer the same product. TEA entrepreneurs are defined as ambitious if they expect to employ 20 or more people in five years. These figures show the United States, Canada and Australia to be well ahead of Europe in the prevalence of both innovative and ambitious TEA.
2.2. Completing the puzzle: Adding EEA to the story
The story as told so far, however, is incomplete. By introducing EEA into the equation, it becomes clear that focusing on TEA alone misses an important piece of evidence regarding entrepreneurial activity. What Europe lacks in TEA, it makes up for, in part, with EEA. As Figure 2 exhibits, Europe gains significantly from including EEA in the analysis. Only the United States, Canada and Australia (grouped as a region – see endnote 7) have a higher rate of EEA in this sample of world economies.In Europe, a greater proportion of entrepreneurship is expressed as EEA than anywhere else in the world. In Europe, 40% of entrepreneurial individuals are EEA entrepreneurs, compared with 29% in the United States. However, 25% of EEA entrepreneurs in the United States are also TEA entrepreneurs, compared with just 15% of European EEA entrepreneurs. In other regions of the world, EEA entrepreneurs are much rarer.
Source: GEM annual entrepreneurship data, 2011 through 2014 surveys;
Forum global competitiveness data, 2011/12 through 2014/15 surveys.
Figure 2: Share of TEA and EEA by region (including people active in both TEA and EEA)
TEA EEA
% o
f p
op
ulat
ion
aged
18
to 6
4
Europe
North A
sia
Middle-East/
North A
frica
South A
sia
United S
tates C
anada and A
ustralia
Latin-Am
erica/ C
aribbean
South-East
Asia
Sub-S
aharan A
frica
30
25
20
15
10
5
0
The significance of EEA is greater than its prevalence relative to TEA because research has shown that the quality of EEA is on average higher than the quality of TEA. For example, EEA entrepreneurs have substantially higher job creation expectations for their new projects than TEA entrepreneurs.9
Europe’s Hidden Entrepreneurs 7
Entrepreneurial employee activity in European economies
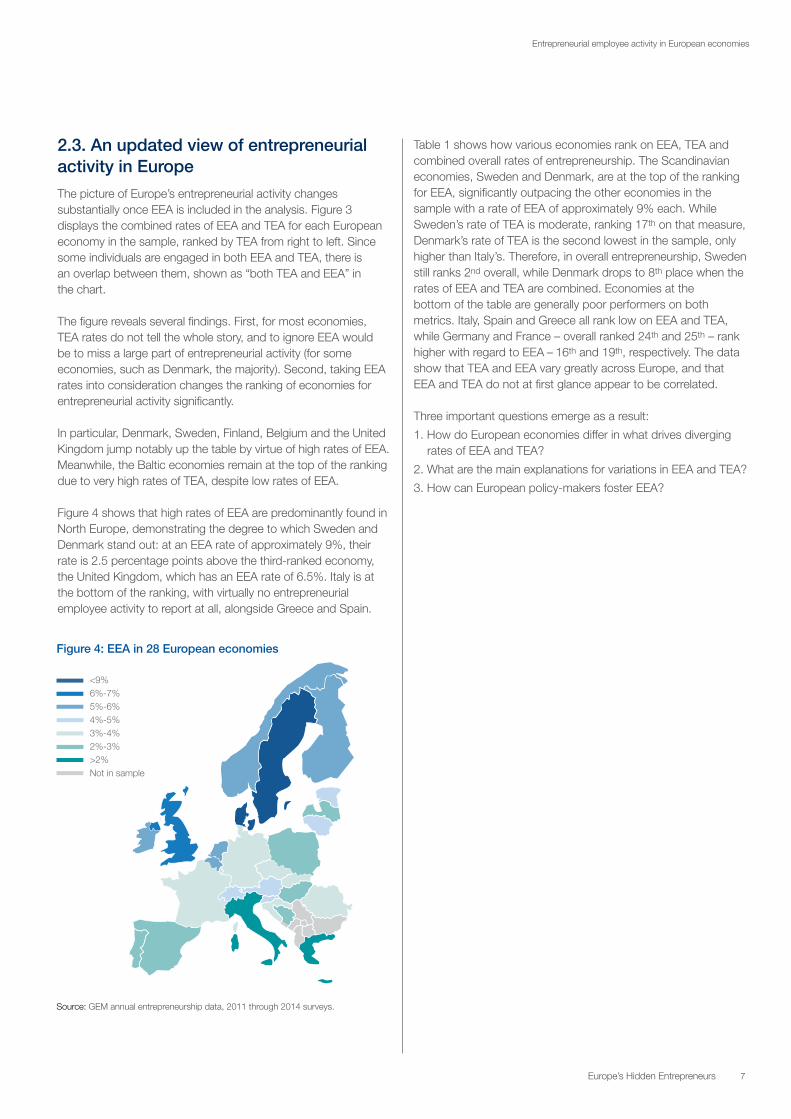
Figure 4: EEA in 28 European economies
<9% 6%-7% 5%-6% 4%-5% 3%-4% 2%-3% >2% Not in sample
Source: GEM annual entrepreneurship data, 2011 through 2014 surveys.
2.3. An updated view of entrepreneurial activity in Europe
The picture of Europe’s entrepreneurial activity changes substantially once EEA is included in the analysis. Figure 3 displays the combined rates of EEA and TEA for each European economy in the sample, ranked by TEA from right to left. Since some individuals are engaged in both EEA and TEA, there is an overlap between them, shown as “both TEA and EEA” in the chart.
The figure reveals several findings. First, for most economies, TEA rates do not tell the whole story, and to ignore EEA would be to miss a large part of entrepreneurial activity (for some economies, such as Denmark, the majority). Second, taking EEA rates into consideration changes the ranking of economies for entrepreneurial activity significantly.
In particular, Denmark, Sweden, Finland, Belgium and the United Kingdom jump notably up the table by virtue of high rates of EEA. Meanwhile, the Baltic economies remain at the top of the ranking due to very high rates of TEA, despite low rates of EEA.
Figure 4 shows that high rates of EEA are predominantly found in North Europe, demonstrating the degree to which Sweden and Denmark stand out: at an EEA rate of approximately 9%, their rate is 2.5 percentage points above the third-ranked economy, the United Kingdom, which has an EEA rate of 6.5%. Italy is at the bottom of the ranking, with virtually no entrepreneurial employee activity to report at all, alongside Greece and Spain.
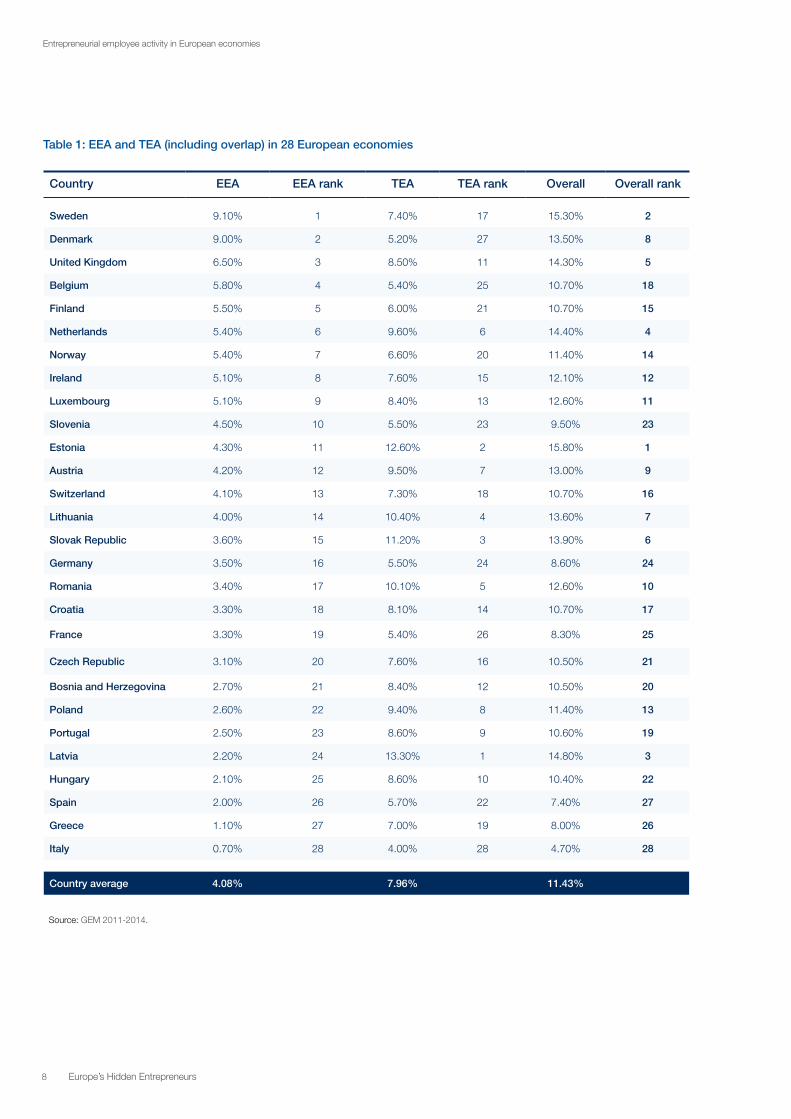
Table 1 shows how various economies rank on EEA, TEA and combined overall rates of entrepreneurship. The Scandinavian economies, Sweden and Denmark, are at the top of the ranking for EEA, significantly outpacing the other economies in the sample with a rate of EEA of approximately 9% each. While Sweden’s rate of TEA is moderate, ranking 17th on that measure, Denmark’s rate of TEA is the second lowest in the sample, only higher than Italy’s. Therefore, in overall entrepreneurship, Sweden still ranks 2nd overall, while Denmark drops to 8th place when the rates of EEA and TEA are combined. Economies at the bottom of the table are generally poor performers on both metrics. Italy, Spain and Greece all rank low on EEA and TEA, while Germany and France – overall ranked 24th and 25th – rank higher with regard to EEA – 16th and 19th, respectively. The data show that TEA and EEA vary greatly across Europe, and that EEA and TEA do not at first glance appear to be correlated.
Three important questions emerge as a result:
1. How do European economies differ in what drives divergingrates of EEA and TEA?
2. What are the main explanations for variations in EEA and TEA?
3. How can European policy-makers foster EEA?
8 Europe’s Hidden Entrepreneurs
Table 1: EEA and TEA (including overlap) in 28 European economies
Country EEA EEA rank TEA TEA rank Overall Overall rank
Sweden 9.10% 1 7.40% 17 15.30% 2
Denmark 9.00% 2 5.20% 27 13.50% 8
United Kingdom 6.50% 3 8.50% 11 14.30% 5
Belgium 5.80% 4 5.40% 25 10.70% 18
Finland 5.50% 5 6.00% 21 10.70% 15
Netherlands 5.40% 6 9.60% 6 14.40% 4
Norway 5.40% 7 6.60% 20 11.40% 14
Ireland 5.10% 8 7.60% 15 12.10% 12
Luxembourg 5.10% 9 8.40% 13 12.60% 11
Slovenia 4.50% 10 5.50% 23 9.50% 23
Estonia 4.30% 11 12.60% 2 15.80% 1
Austria 4.20% 12 9.50% 7 13.00% 9
Switzerland 4.10% 13 7.30% 18 10.70% 16
Lithuania 4.00% 14 10.40% 4 13.60% 7
Slovak Republic 3.60% 15 11.20% 3 13.90% 6
Germany 3.50% 16 5.50% 24 8.60% 24
Romania 3.40% 17 10.10% 5 12.60% 10
Croatia 3.30% 18 8.10% 14 10.70% 17
France 3.30% 19 5.40% 26 8.30% 25
Czech Republic 3.10% 20 7.60% 16 10.50% 21
Bosnia and Herzegovina 2.70% 21 8.40% 12 10.50% 20
Poland 2.60% 22 9.40% 8 11.40% 13
Portugal 2.50% 23 8.60% 9 10.60% 19
Latvia 2.20% 24 13.30% 1 14.80% 3
Hungary 2.10% 25 8.60% 10 10.40% 22
Spain 2.00% 26 5.70% 22 7.40% 27
Greece 1.10% 27 7.00% 19 8.00% 26
Italy 0.70% 28 4.00% 28 4.70% 28
Country average 4.08% 7.96% 11.43%
Entrepreneurial employee activity in European economies
Source: GEM 2011-2014.
Europe’s Hidden Entrepreneurs 9
EEA rates across economies in Europe are affected by a number of factors, none of which alone explains EEA variance in its entirety. Instead, EEA is driven by the interaction of economic, cultural and regulatory factors. This section examines how EEA is associated with competitiveness, as measured by the World Economic Forum’s annual Global Competitiveness Index (GCI), and explores the role regional clusters play for EEA.
3.1. The relationship between competitiveness and entrepreneurial employee activity
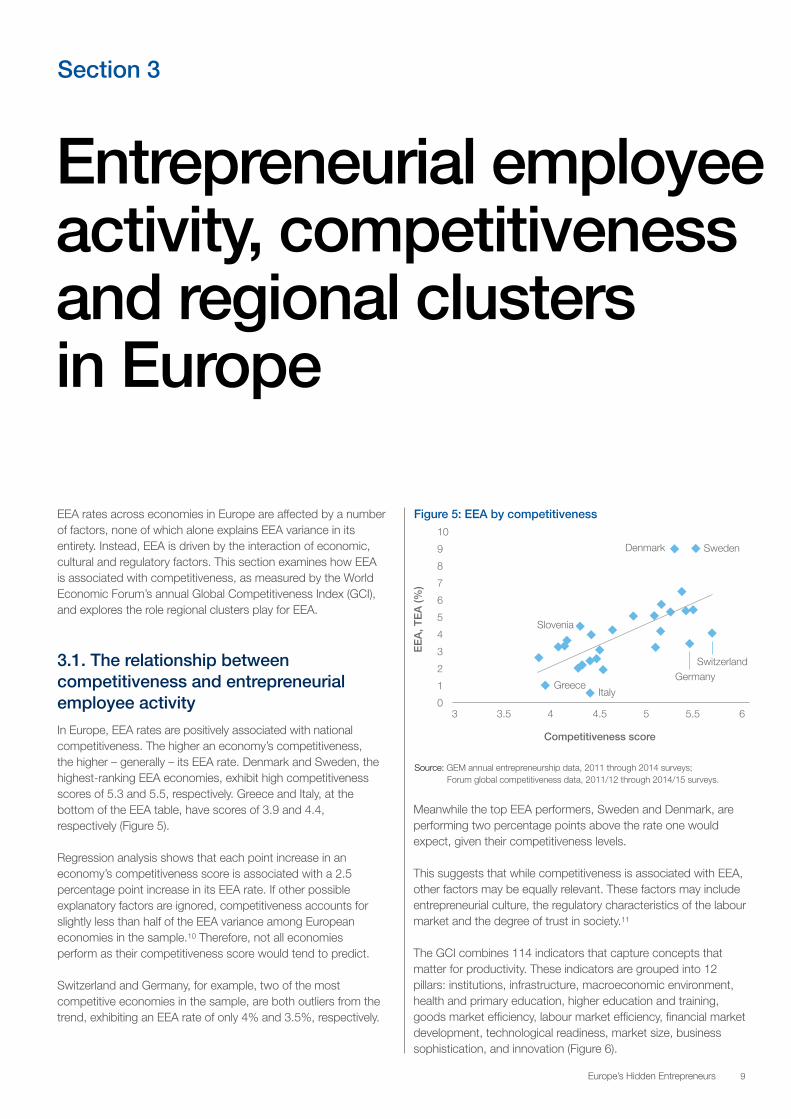
In Europe, EEA rates are positively associated with national competitiveness. The higher an economy’s competitiveness, the higher – generally – its EEA rate. Denmark and Sweden, the highest-ranking EEA economies, exhibit high competitiveness scores of 5.3 and 5.5, respectively. Greece and Italy, at the bottom of the EEA table, have scores of 3.9 and 4.4, respectively (Figure 5).
Regression analysis shows that each point increase in an economy’s competitiveness score is associated with a 2.5 percentage point increase in its EEA rate. If other possible explanatory factors are ignored, competitiveness accounts for slightly less than half of the EEA variance among European economies in the sample.10 Therefore, not all economies perform as their competitiveness score would tend to predict.
Switzerland and Germany, for example, two of the most competitive economies in the sample, are both outliers from the trend, exhibiting an EEA rate of only 4% and 3.5%, respectively.
Section 3
Entrepreneurial employee activity, competitiveness and regional clusters in Europe
Figure 5: EEA by competitiveness
Source: GEM annual entrepreneurship data, 2011 through 2014 surveys; Forum global competitiveness data, 2011/12 through 2014/15 surveys.
Meanwhile the top EEA performers, Sweden and Denmark, are performing two percentage points above the rate one would expect, given their competitiveness levels.
This suggests that while competitiveness is associated with EEA, other factors may be equally relevant. These factors may include entrepreneurial culture, the regulatory characteristics of the labour market and the degree of trust in society.11
The GCI combines 114 indicators that capture concepts that matter for productivity. These indicators are grouped into 12 pillars: institutions, infrastructure, macroeconomic environment, health and primary education, higher education and training, goods market efficiency, labour market efficiency, financial market development, technological readiness, market size, business sophistication, and innovation (Figure 6).
Competitiveness score
EE
A, T
EA
(%)
10
9
8
7
6
5
4
3
2
1
03 3.5 4 4.5 5 5.5 6
Slovenia
GreeceItaly
GermanySwitzerland
Denmark Sweden

10 Europe’s Hidden Entrepreneurs
Labour market efficiency and flexibility, meritocracy and gender parity in the workplace
Flexibility
Efficient use of talent
Entrepreneurial employee activity, competitiveness and regional clusters in Europe
Figure 6: The 12 pillars of the Global Competitiveness Index
Institutions
Concepts related to protection of property rights, efficiency and transparency of public administration, independence of the judiciary, physical security, business ethics and corporate governance
Public institutions
Private institutions
Infrastructure
Quality and avalability of transport, electricity and communication infrastructures
Transport infrastructure
Electricity & telephony infrastructure
Macroeconomic environment
Fiscal and monetary indicators, savings rate and sovereign debt rating
Health & primary education
State of public health, quality and quantity of basic education
Health
Primary education
Higher education & training
Quality and quantity of higher education, and quality and availability of on-the-job training
Quantity of education
Quality of education
On-the-job training
Goods market efficiency
Factors that drive the intensity of domestic and foreign competition, and demand conditions
Competition
Quality of demand conditions
Labour market efficiencyFinancial market development
Efficiency, stability and trustworthiness of the financial banking system
Efficiency
Trustworthiness and confidence
Technological readiness
Adoption of the technologies by individuals and businesses
Technological adoption
ICT use
Market size
Size of the domestic and export markets
Domestic market size
Foreign market size
Innovation
Capacity for, and commitment to technological innovation
Business sophistication
Efficiency and sophistication of business process in the country
Source: World Economic Forum, “Methodology: The 12 pillars of competitiveness”, available at http://reports.weforum.org/global-competitiveness-report-2014-2015/methodology/#read.
The correlation matrix provided in Appendix 3 shows that across Europe, TEA correlates negatively, but EEA correlates positively, with most of the 12 pillars. In fact, EEA correlates significantly with 11 of the 12 pillars and in five of these 11, the correlation coefficient is higher than 0.65. It is also noteworthy that while 11 pillars correlate highly with each other, the one exception (market size) does not correlate significantly with EEA either.
Box 3 suggests why EEA might be related to the five pillars it correlates most highly with across European countries:
— Pillar 1: Institutions
— Pillar 6: Goods market efficiency
— Pillar 7: Labour market efficiency
— Pillar 9: Technological readiness
— Pillar 12: Innovation

Europe’s Hidden Entrepreneurs 11
Entrepreneurial employee activity, competitiveness and regional clusters in Europe
Box 3: Description of the focus pillars
The institutions pillar measures intellectual property protection, public trust in politicians, judicial independence, the burden of government regulation, the efficacy of corporate boards, the protection of minority shareholders’ interests and the strength of investor protection. The inclination of firms to invest in projects that create new value (and the EEA associated with that) is heavily dependent on an economy’s institutional environment, which influences investment decisions and plays a key role in the ways in which societies distribute the benefits and bear the costs of economic strategies and policies. For example, owners of land, corporate shares or intellectual property are unwilling to invest in the improvement and upkeep of their property if their rights as owners are not protected. It is not surprising, therefore, that this pillar has a relatively high correlation with EEA across European economies.
The goods market efficiency pillar measures domestic competition and foreign competition – via metrics such as the intensity of local competition, the extent of market dominance, the effectiveness of anti-monopoly policy and the number of procedures required to start a business. The pillar also assesses quality of demand conditions, such as buyer sophistication and the degree of customer orientation. Firms in highly competitive market environments face greater pressures to increase business productivity and innovation – for both of which EEA is an essential ingredient. This pillar, therefore, measures the strength of competitive pressure on firms in an economy to support and encourage EEA.
The labour market efficiency pillar measures cooperation in labour-employer relations, flexibility of wage determination, the effect of taxation on incentives to work, a country’s capacity to retain and attract talent, and female participation in the labour force as proxies for efficient labour markets. The pillar, therefore, measures how easily EEA can be expressed in an economy’s labour market. Efficient and flexible labour markets ensure that workers are allocated to their most effective use in an economy and provided with incentives to give their best effort in their jobs, which are critical conditions for entrepreneurially-inclined employees to become entrepreneurially active for firms. Labour markets therefore require the flexibility to shift workers from one economic activity to another rapidly and at low cost, and to allow for wage fluctuations without much social disruption. In this way entrepreneurial individuals can find work settings that encour-age them to find new ways to create value, and where their value creation is rewarded. These settings are likely to promote meritocracy and equity in the business environment, including between men and women. Taken together, these factors have a positive effect on employee performance and the attractiveness of the country for talent, two aspects of the labour market that are growing more important as talent shortages loom on the horizon.
The technological readiness pillar measures the agility with which an economy adopts existing technologies to enhance the productivity of its industries. Specific emphasis is placed on an economy’s capacity to fully leverage information and communication technologies in daily activities, and production processes for increased efficiency and for the creation of an enabling environment for competitiveness. The ability of firms to develop and implement projects that create new value (and the EEA associated with that) is closely tied to an economy’s technology infrastructure, especially with regard to innovative and knowledge-intensive projects. This pillar, therefore, measures the degree to which companies can launch EEA- driven ventures that have a technology component.
The innovation pillar measures company spending on R&D, university-industry collaboration in R&D and patent applications filed under the Patent Cooperation Treaty, as well as auxiliary factors such as the capacity for innovation in an economy, the quality of scientific research institutions, government procurement of advanced technology products, and the availability of scientists and engineers. EEA is directly related to the degree to which companies invest in new ventures and innovation. EEA can be both the result, as well as the driver, for investment of this type. The pillar, therefore, provides an indication of the capabilities for companies in an economy associated with EEA.
Taken together, these five pillars go a long way towards providing diagnostic guidance for economies looking to improve EEA rates by identifying areas of competitive strength and weakness. Later, this lens is applied to regional clusters to identify strengths and weaknesses of groups of countries that have similar competitiveness profiles.
3.2. Competitiveness clusters and entrepreneurship
European economies exhibit a wide spectrum of performance on the competitiveness pillars. To form a comprehensive picture of how economies differ, a cluster analysis was performed, grouping European economies into “competitiveness clusters” by similarity with regard to their performance against the 12 pillars of the GCI.12
As Figure 7 shows, this analysis produced a striking regional congruence. All of the highly competitive European economies are grouped in the “North and West Europe cluster”, while Mediterranean economies are grouped in the “South Europe cluster”. Eastern European economies are in the “East Europe cluster”, except Slovenia, which joins the Baltic economies in the “Baltics and Slovenia cluster”.

12 Europe’s Hidden Entrepreneurs
Entrepreneurial employee activity, competitiveness and regional clusters in Europe
Figure 7: Competitiveness cluster countries, based on the GCI pillars
North and West Europe cluster East Europe cluster Baltics and Slovenia cluster South Europe cluster
Source: GEM
Source: GEM annual entrepreneurship data, 2011 through 2014 surveys.
Source: GEM annual entrepreneurship data, 2011 through 2014 surveys.
Source: GEM
Though these clusters were created from competitiveness data, they also vary significantly in terms of different forms of entrepreneurial activity – especially EEA. Figure 8 shows that the North and West Europe cluster has below average rates of TEA, but a very high rate of EEA, which makes up almost half of those economies’ entrepreneurial activity. It is worth pointing out that the average rate of EEA in the North and West Cluster is the same as that in North America.
East Europe cluster
Bosnia and HerzegovinaCroatiaCzech RepublicHungaryPolandRomaniaSlovak Republic
North and West Europe cluster
AustriaBelgiumDenmarkFinlandFranceGermanyIrelandLuxembourgNetherlandsNorwaySwedenSwitzerlandUnited Kingdom
South Europe cluster
GreeceItalyPortugalSpain
Baltics and Slovenia cluster
EstoniaLatviaLithuaniaSlovenia
1 2
3
4
Table 2: Competitiveness cluster member countries, based on the GCI pillars
Figure 8: EEA and TEA by Competitiveness cluster Figure 9: Opportunity-based TEA and necessity-based TEA by Competitiveness cluster
EEA (with TEA overlap) TEA (with EEA overlap)
12%
10%
8%
6%
4%
2%
0% Baltics and
Slovenia
North
and West
Europe
East Europe
South
Europe
Both the South Europe cluster and the East Europe cluster havesignificantly lower rates of EEA than the mean. However, theSouth Europe cluster has particularly low rates of both EEA andTEA, while the TEA rate in East Europe is significantly higher thanaverage. The Baltics and Slovenia cluster has the highest overallrate of entrepreneurship, combining the highest rate of TEA withan average rate of EEA.
8
7
6
5
4
3
2
1
0
% o
f p
op
ulat
ion
aged
18
to 6
4
% 18-64 pop: TEA and necessity motive (no better choice for work) % 18-64 pop: TEA and opportunity motive
Baltics and
Slovenia
South Europe
East Europe
North and
West Europe

Europe’s Hidden Entrepreneurs 13
Figure 10: Lifestyle TEA, ambitious TEA and innovative TEA by Competitiveness cluster
Entrepreneurial employee activity, competitiveness and regional clusters in Europe
Source: GEM annual entrepreneurship data, 2011 through 2014 surveys.
Source: GEM annual entrepreneurship data, 2011 through 2014 surveys.The clusters have varying rates and types of TEA, as shown in Figures 9 and 10. For example, the Baltics and Slovenia cluster stands out for its high rate of opportunity-based, innovative, ambitious and lifestyle TEA,13 in contrast with the South Europe cluster, which has low rates of all four types of TEA. On the other hand, East Europe has a significantly higher rate of necessity- based TEA on average.
In summary, countries within these four competitiveness clusters appear to allocate entrepreneurial effort in different ways. The most competitive cluster, North and West Europe, does not have a significantly higher proportion of either ambitious or innovative TEA entrepreneurs. Instead, entrepreneurial effort is channel disproportionately into EEA. While the other three clusters differ in the allocation of effort across different types of TEA, they all have significantly lower rates of EEA than the North and West Europe cluster, and are less successful economically.
A more fine-grained analysis of the competitiveness pillars that correlate most highly with EEA may help in understanding these significant differences in entrepreneurial activity between the clusters. It is not possible in a cross-sectional analysis like this to attribute cause and effect to the relationship between competitiveness and EEA. However, when addressing low performance in these areas, improving EEA may be equally as important as an improvement in competitiveness.
Figure 11 shows how the cluster averages differ from the sample average using the five pillars that correlate most highly with EEA. The North and West Europe cluster is, unsurprisingly, above average for all pillars. The other clusters are all below average for all pillars, with the exception of the Baltics and Slovenia cluster in the labour market efficiency pillar. The biggest gaps between clusters are in the innovation, institutions and technological readiness pillars. These differences may be clues to why entrepreneurial activity is expressed differently in different clusters.
Figure 11: Difference in performance against sample average for 5 key pillars of the Global Competitiveness Index (weighted by population)
% o
f p
op
ulat
ion
aged
18
to 6
4
7
6
5
4
3
2
1
0 Baltics and
Slovenia
South Europe
East Europe
North and
West Europe
Lifestyle TEA: neither ambitious nor innovative Ambitious TEA: expects at least 20 jobs in 5 years Innovative TEA: new product, low competition North and West Europe
East Europe Baltics and Slovenia South Europe
Difference from average of overall sample
Pillar 1: Institutions
Pillar 6: Goods market efficiency
Pillar 7: Labour market efficiency
Pillar 9: Technological readiness
Pillar 12: Innovation
-1.5 -1 -0.5 0 0.5 1

14 Europe’s Hidden Entrepreneurs
To gain a more granular understanding of the interaction between the highlighted competitiveness pillars and EEA, this section presents case studies for four economies from the sample:
— North and West Europe cluster: Germany
— East Europe cluster: Poland
— South Europe cluster: Italy
— Baltics and Slovenia cluster: Estonia
Section 4
Country profiles of select economies
Figure 12: Headline Metrics, Germany
4.1. North and West Europe cluster: Germany
Germany is Europe’s largest economy and at the top end of GDP per capita rankings (Figure 12). It is a highly competitive economy in the centre of Europe, yet it ranks only 24th for overall entrepreneurship (see Table 1).
Germany’s poor entrepreneurship ranking is the result of a low rate of TEA (5.5%) and a moderate rate of EEA (3.5%), ranking it 24th and 16th, respectively. Germany’s performance is very similar to that of France, with both economies hovering near the bottom of the field in terms of overall entrepreneurial activity, and just above Italy, Spain and Greece.
Other economies in the North and West Europe cluster face similar headwinds with regard to TEA, but compensate with higher rates of EEA (Figure 13). None of the Scandinavian conomies, for example, has high rates of TEA – Sweden’s is the highest at 7.4% – so while all four (Sweden, Denmark, Finland and Norway) are ranked in the high teens to 20s on TEA, they rank in the top 10 on EEA, thereby climbing significantly in overall rankings. As the best-performing large European economy in terms of entrepreneurship, the United Kingdom benefits from the 3rd best rate of EEA, alongside a moderately high rate of TEA, thereby ending up in 5th place overall. These patterns stand in stark contrast to the German experience.
Germany (2015)
Population: 81,197,537.00GDP per capita: €34,100.00EEA (incl. overlap): 3.5%EEA + TEA: 8.6%Competitiveness: 5.5
Source: Eurostat population change, demographic balance and crude rates at national level and Eurostat real GDP per capita, growth rate and totals.
Europe’s Hidden Entrepreneurs 15
Country profiles of select economies
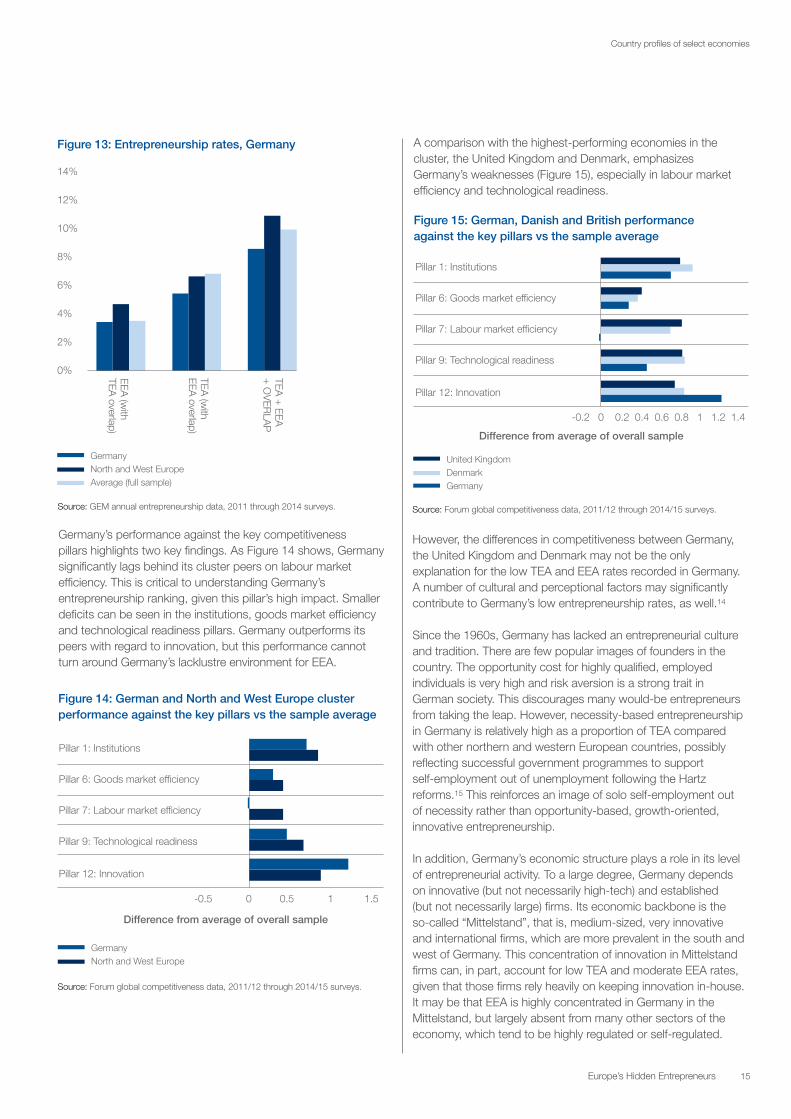
Figure 13: Entrepreneurship rates, Germany
Germany North and West Europe Average (full sample)
EEA (w
ith TEA
overlap)
TEA (w
ith EEA
overlap)
TEA +
EEA
+ O
VERLA
P
14%
12%
10%
8%
6%
4%
2%
0%
Figure 14: German and North and West Europe cluster performance against the key pillars vs the sample average
Source: GEM annual entrepreneurship data, 2011 through 2014 surveys.
Source: Forum global competitiveness data, 2011/12 through 2014/15 surveys.
A comparison with the highest-performing economies in the cluster, the United Kingdom and Denmark, emphasizes Germany’s weaknesses (Figure 15), especially in labour market efficiency and technological readiness.
However, the differences in competitiveness between Germany, the United Kingdom and Denmark may not be the only explanation for the low TEA and EEA rates recorded in Germany. A number of cultural and perceptional factors may significantly contribute to Germany’s low entrepreneurship rates, as well.14
Since the 1960s, Germany has lacked an entrepreneurial culture and tradition. There are few popular images of founders in the country. The opportunity cost for highly qualified, employed individuals is very high and risk aversion is a strong trait in German society. This discourages many would-be entrepreneurs from taking the leap. However, necessity-based entrepreneurship in Germany is relatively high as a proportion of TEA compared with other northern and western European countries, possibly reflecting successful government programmes to support self-employment out of unemployment following the Hartz reforms.15 This reinforces an image of solo self-employment out of necessity rather than opportunity-based, growth-oriented, innovative entrepreneurship.
In addition, Germany’s economic structure plays a role in its level of entrepreneurial activity. To a large degree, Germany depends on innovative (but not necessarily high-tech) and established (but not necessarily large) firms. Its economic backbone is the so-called “Mittelstand”, that is, medium-sized, very innovative and international firms, which are more prevalent in the south and west of Germany. This concentration of innovation in Mittelstand firms can, in part, account for low TEA and moderate EEA rates, given that those firms rely heavily on keeping innovation in-house. It may be that EEA is highly concentrated in Germany in the Mittelstand, but largely absent from many other sectors of the economy, which tend to be highly regulated or self-regulated.
Germany’s performance against the key competitiveness pillars highlights two key findings. As Figure 14 shows, Germany significantly lags behind its cluster peers on labour market efficiency. This is critical to understanding Germany’s entrepreneurship ranking, given this pillar’s high impact. Smaller deficits can be seen in the institutions, goods market efficiency and technological readiness pillars. Germany outperforms its peers with regard to innovation, but this performance cannot turn around Germany’s lacklustre environment for EEA.
Difference from average of overall sample
Pillar 1: Institutions
Pillar 6: Goods market efficiency
Pillar 7: Labour market efficiency
Pillar 9: Technological readiness
Pillar 12: Innovation
Germany North and West Europe
-0.5 0 0.5 1 1.5
Source: Forum global competitiveness data, 2011/12 through 2014/15 surveys.
Figure 15: German, Danish and British performance against the key pillars vs the sample average
United Kingdom Denmark Germany
-0.2 0 0.2 0.4 0.6 0.8 1 1.2 1.4
Difference from average of overall sample
Pillar 1: Institutions
Pillar 6: Goods market efficiency
Pillar 7: Labour market efficiency
Pillar 9: Technological readiness
Pillar 12: Innovation
16 Europe’s Hidden Entrepreneurs
Country profiles of select economies
This set of circumstances indicates that cultural factors are a key driver of Germany’s entrepreneurial performance. German policy-makers can therefore have a high impact on entrepreneurship, by working to change the image of what it means to be an entrepreneur and a founder of a business. Policies could range from promoting the idea that failure is a normal and acceptable attribute of entrepreneurship, to supporting self-employment as a natural alternative to employment. Policies could also look to encourage entrepreneurial behaviour more widely. Cultural values and social norms among young people are formed in the family, peer networks and at school, and, in general, much earlier than at university. It is important for this work to start early and focus on youth. Entrepreneurship education needs to start as early as primary school, since it is typically too late to try to implant entrepreneurial motivations in university students in their twenties.
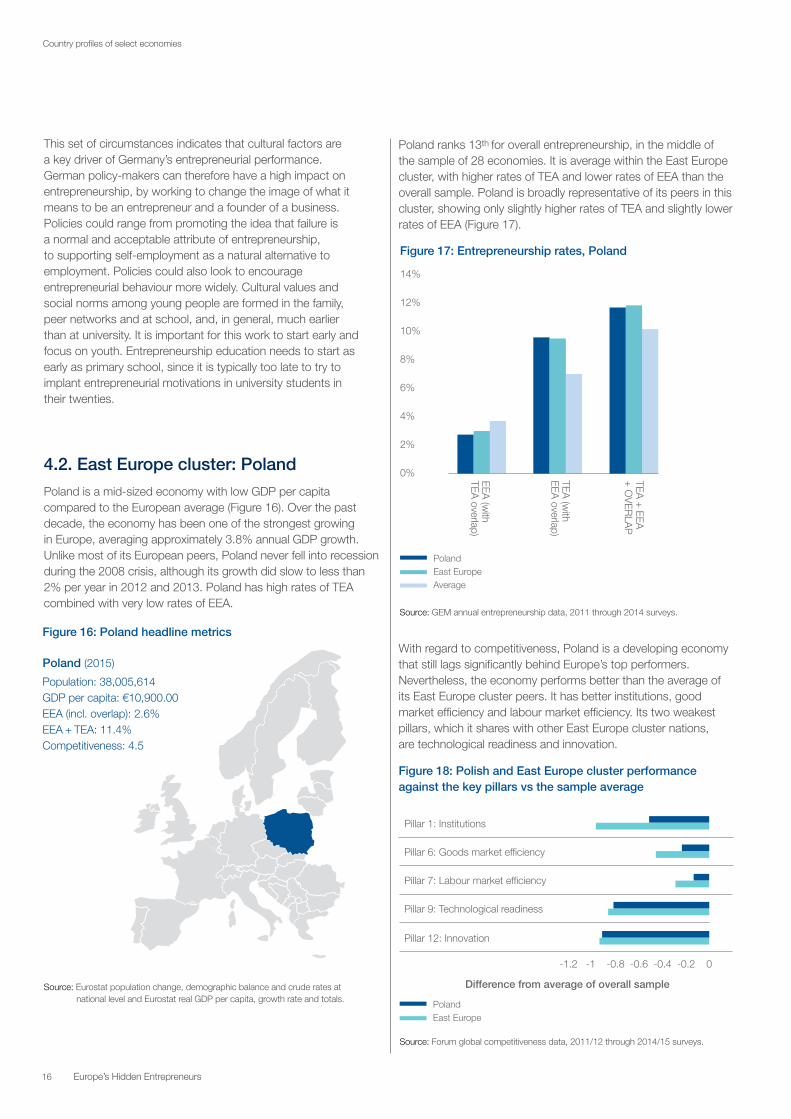
4.2. East Europe cluster: Poland
Poland is a mid-sized economy with low GDP per capita compared to the European average (Figure 16). Over the past decade, the economy has been one of the strongest growing in Europe, averaging approximately 3.8% annual GDP growth. Unlike most of its European peers, Poland never fell into recession during the 2008 crisis, although its growth did slow to less than 2% per year in 2012 and 2013. Poland has high rates of TEA combined with very low rates of EEA.
Figure 16: Poland headline metrics
Poland (2015)
Population: 38,005,614GDP per capita: €10,900.00EEA (incl. overlap): 2.6%EEA + TEA: 11.4%Competitiveness: 4.5
Source: Eurostat population change, demographic balance and crude rates at national level and Eurostat real GDP per capita, growth rate and totals.
Poland ranks 13th for overall entrepreneurship, in the middle of the sample of 28 economies. It is average within the East Europe cluster, with higher rates of TEA and lower rates of EEA than the overall sample. Poland is broadly representative of its peers in this cluster, showing only slightly higher rates of TEA and slightly lower rates of EEA (Figure 17).
Figure 17: Entrepreneurship rates, Poland
Figure 18: Polish and East Europe cluster performance against the key pillars vs the sample average
Poland East Europe Average
14%
12%
10%
8%
6%
4%
2%
0% EEA (w
ith TEA
overlap)
TEA (w
ith EEA
overlap)
TEA +
EEA
+ O
VERLA
P
Source: GEM annual entrepreneurship data, 2011 through 2014 surveys.
Source: Forum global competitiveness data, 2011/12 through 2014/15 surveys.
With regard to competitiveness, Poland is a developing economy that still lags significantly behind Europe’s top performers. Nevertheless, the economy performs better than the average of its East Europe cluster peers. It has better institutions, good market efficiency and labour market efficiency. Its two weakest pillars, which it shares with other East Europe cluster nations, are technological readiness and innovation.
Poland East Europe
-1.2 -1 -0.8 -0.6 -0.4 -0.2 0
Difference from average of overall sample
Pillar 1: Institutions
Pillar 6: Goods market efficiency
Pillar 7: Labour market efficiency
Pillar 9: Technological readiness
Pillar 12: Innovation
Europe’s Hidden Entrepreneurs 17
Country profiles of select economies
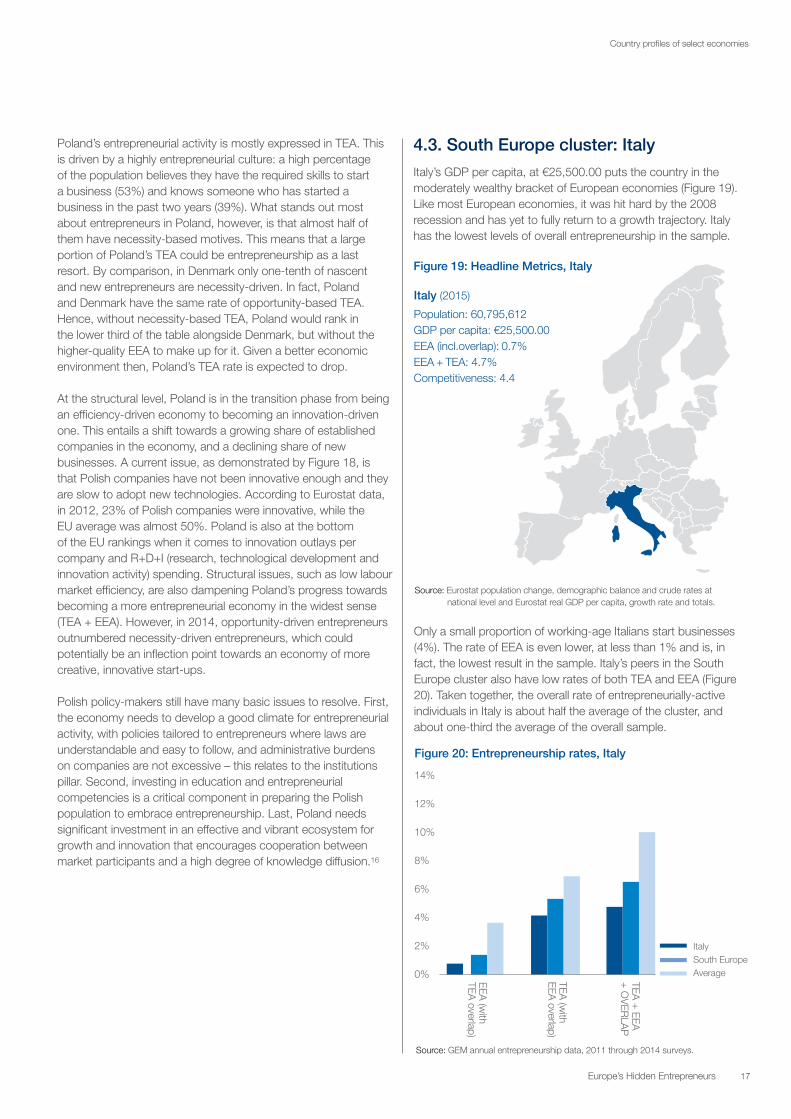
Figure 19: Headline Metrics, Italy
Italy (2015)
Population: 60,795,612GDP per capita: €25,500.00EEA (incl.overlap): 0.7%EEA + TEA: 4.7%Competitiveness: 4.4
Figure 20: Entrepreneurship rates, Italy
Italy South Europe Average EEA
(with
TEA overlap)
TEA (w
ith EEA
overlap)
TEA +
EEA
+ O
VERLA
P
14%
12%
10%
8%
6%
4%
2%
0%
Poland’s entrepreneurial activity is mostly expressed in TEA. This is driven by a highly entrepreneurial culture: a high percentage of the population believes they have the required skills to start a business (53%) and knows someone who has started a business in the past two years (39%). What stands out most about entrepreneurs in Poland, however, is that almost half of them have necessity-based motives. This means that a large portion of Poland’s TEA could be entrepreneurship as a last resort. By comparison, in Denmark only one-tenth of nascent and new entrepreneurs are necessity-driven. In fact, Poland and Denmark have the same rate of opportunity-based TEA. Hence, without necessity-based TEA, Poland would rank in the lower third of the table alongside Denmark, but without the higher-quality EEA to make up for it. Given a better economic environment then, Poland’s TEA rate is expected to drop.
At the structural level, Poland is in the transition phase from being an efficiency-driven economy to becoming an innovation-driven one. This entails a shift towards a growing share of established companies in the economy, and a declining share of new businesses. A current issue, as demonstrated by Figure 18, is that Polish companies have not been innovative enough and they are slow to adopt new technologies. According to Eurostat data, in 2012, 23% of Polish companies were innovative, while the EU average was almost 50%. Poland is also at the bottom of the EU rankings when it comes to innovation outlays per company and R+D+I (research, technological development and innovation activity) spending. Structural issues, such as low labour market efficiency, are also dampening Poland’s progress towards becoming a more entrepreneurial economy in the widest sense (TEA + EEA). However, in 2014, opportunity-driven entrepreneurs outnumbered necessity-driven entrepreneurs, which could potentially be an inflection point towards an economy of more creative, innovative start-ups.
Polish policy-makers still have many basic issues to resolve. First, the economy needs to develop a good climate for entrepreneurial activity, with policies tailored to entrepreneurs where laws are understandable and easy to follow, and administrative burdens on companies are not excessive – this relates to the institutions pillar. Second, investing in education and entrepreneurial competencies is a critical component in preparing the Polish population to embrace entrepreneurship. Last, Poland needs significant investment in an effective and vibrant ecosystem for growth and innovation that encourages cooperation between market participants and a high degree of knowledge diffusion.16
4.3. South Europe cluster: Italy
Italy’s GDP per capita, at €25,500.00 puts the country in the moderately wealthy bracket of European economies (Figure 19). Like most European economies, it was hit hard by the 2008 recession and has yet to fully return to a growth trajectory. Italy has the lowest levels of overall entrepreneurship in the sample.
Source: Eurostat population change, demographic balance and crude rates at national level and Eurostat real GDP per capita, growth rate and totals.
Source: GEM annual entrepreneurship data, 2011 through 2014 surveys.
Only a small proportion of working-age Italians start businesses (4%). The rate of EEA is even lower, at less than 1% and is, in fact, the lowest result in the sample. Italy’s peers in the South Europe cluster also have low rates of both TEA and EEA (Figure 20). Taken together, the overall rate of entrepreneurially-active individuals in Italy is about half the average of the cluster, and about one-third the average of the overall sample.

18 Europe’s Hidden Entrepreneurs
Country profiles of select economies
With a competitiveness score of 4.4, Italy is a moderately competitive economy. The main difference from Poland, however, is a lower performance in the institutions pillar, where it also significantly underperforms its peers in the South Europe Cluster. Good institutions are a foundation for both TEA and EEA, and Italy’s low score on this pillar potentially goes a long way towards explaining its low rates of entrepreneurship (Figure 21). Compared to the overall sample, Italy also lags behind in labour market efficiency, technological readiness and innovation.
Figure 21: Italian and South Europe cluster performance against the key pillars vs the sample average
Source: Forum global competitiveness data, 2011/12 through 2014/15 surveys.
Italy, as an example, shows how important the “basic” pillars are to economic performance and entrepreneurial activity. The lack of predictable and stable institutions generates uncertainty that discourages entrepreneurship in any form. Regulatory issues put significant burdens on all businesses in Italy, but especially on new ones. Additionally, the regulatory system is perceived to be particularly slow and burdensome, with large numbers of required permissions to get a business off the ground. Corruption is another factor that discourages entrepreneurs, and Italy has one of the lowest scores in Europe in the Transparency International Index.
But Italy’s problems run deeper, still. Italy’s micro-environment is a significant cause of its suppressed entrepreneurial rate, with its economy remaining in stagnation since the 2008 crisis. Only 21% of working-age Italians believe there are good opportunities to start a business in the next six months – one of the lowest scores in the sample.
Aside from the institutional issues facing Italy, strong cultural forces also discourage entrepreneurship. Only 30% of Italians believe they have the required knowledge to start a business and only 20% know someone who has started a business in the past two years – both of these values are the lowest in the sample. Italy also exhibits one of the highest fear of failure rates in Europe, at 57%.
An important feature of Italy’s economy is the north-south divide, which shows a stark difference between a more prosperous northern Italy, and a struggling southern Italy. Interestingly, the south has a higher TEA rate than the north but, in Sicily, for example, 90% of entrepreneurship is necessity-based. This indicates that traditional employment opportunities are rare in the south of the country. As a corollary to this, northern Italy has a higher proportion of innovative and ambitious start-ups.17
The Italian government recently recognized the importance of promoting entrepreneurship, and created incentives for knowledge and technology based start-ups. Chief among these is the Italian Start-up Act, passed in 2012, which allows certain types of start-ups to receive government support. To qualify, firms must have one of the following: 1) at least 15% of expenses attributable to R&D; 2) at least one-third of the workforce with a complete or in-progress PhD, or at least two-thirds of the workforce with a Master’s degree; or 3) at least one patent. Designated innovative start-ups receive a number of benefits for the first five years of their business, including exemptions from certain registration fees, special rights that are not permitted to ordinary companies (including delays in reducing share capital following losses), permission to issue stock options and raise equity crowdfunding, simplified access to government-backed loans, and a “fail fast” system.18
This example shows that Italy has a long road to travel. The country needs to improve the basics and create a strong set of reliable and efficient institutions that do not actively discourage entrepreneurship, and then shift the focus to improving the situation for start-ups. Italy has made a start by targeting innovative start-ups for special treatment under the law, which directly tackles weaknesses in the pillars of technological readiness and innovation. However, more remains to be done for entrepreneurship in general, especially with regard to institutions.
Italy South Europe
-1.2 -1 -0.8 -0.6 -0.4 -0.2 0
Difference from average of overall sample
Pillar 1: Institutions
Pillar 6: Goods market efficiency
Pillar 7: Labour market efficiency
Pillar 9: Technological readiness
Pillar 12: Innovation

Europe’s Hidden Entrepreneurs 19
Country profiles of select economies
Estonia Baltics and Slovenia Average
14%
12%
10%
8%
6%
4%
2%
0% EEA (w
ith TEA
overlap)
TEA (w
ith EEA
overlap)
TEA +
EEA
+ O
VERLA
P
Figure 23: Entrepreneurship rates, Estonia4.4. Baltics and Slovenia cluster: Estonia
Estonia is a small economy, with a per capita GDP of just under €14,000 (Figure 22). Over the past decade, it has gone from extraordinary growth to experiencing one of the most severe recessions in Europe, with a contraction of almost 15% of GDP in 2009. Since then, it has been on a slow path to recovery.
Figure 22: Headline Metrics, Estonia
Estonia (2015)
Population: 1,313,271GDP per capita: €13,400.00EEA (incl. overlap): 4.3%EEA + TEA: 15.8%Competitiveness: 4.6
Source: Eurostat population change, demographic balance and crude rates at national level and Eurostat real GDP per capita, growth rate and totals.
Source: Forum global competitiveness data, 2011/12 through 2014/15 surveys.
Source: Forum global competitiveness data, 2011/12 through 2014/15 surveys.
However, Estonia tops the ranking for overall entrepreneurship, thanks to its high rate of TEA, for which it ranks 2nd in the sample. Meanwhile Estonia’s EEA rate is slightly above average (Figure 23). Almost 80% of businesses started in Estonia are opportunity-driven and Estonia is often cited as a model for entrepreneurially-oriented policy.
Estonia’s overall competitiveness score is approximately the same as Italy’s and Poland’s: 4.6. However, a breakdown by pillar reveals some crucial differences: Estonia outperforms not only its peers, but the full sample averages, with regard to institutions and labour market efficiency – two critical pillars where Italy and Poland struggle (Figure 24). The only pillar on which Estonia visibly underperforms the sample average is innovation. This indicates why Estonia’s EEA rate is double that of Poland, and six times that of Italy.
Figure 24: Estonian and Baltics and Slovenia cluster performance against the key pillars vs the sample average
Estonia Baltics and Slovenia
Difference from average of overall sample
Pillar 1: Institutions
Pillar 6: Goods market efficiency
Pillar 7: Labour market efficiency
Pillar 9: Technological readiness
Pillar 12: Innovation
-1 -0.5 0 0.5 1

20 Europe’s Hidden Entrepreneurs
Country profiles of select economies
Estonia’s entrepreneurial success is no accident. In the early 1990s the Estonian government purposefully initiated a set of reforms that turned an existing system of state-owned companies, guaranteed product-markets and fixed prices upside down. Estonia’s government has continued to innovate, most visibly with the digitalization of government services, an area where Estonia has a global lead. Estonia now offers e-residency to anyone in the world who would like to do business online from a virtual base.
Aside from structural economic factors, the country has other drivers of entrepreneurship. First, Estonia has a long-standing history and culture of self-reliance and persistence, stemming from living in the shadow of large, sometimes hostile neighbours. As a result, Estonian entrepreneurs pride themselves on the ability to be persistent and inventive, whatever the conditions. Second, in the last decade, Estonia has seen a number of success stories, which have elevated entrepreneurship visibly in the public eye. Most notably, Skype’s success has inspired a whole generation of Estonian entrepreneurs. Former Skype employees have gone on to start their own companies, while the original four Estonian co-founders have made significant investments in new ventures. Recently, David McClure, Founder of start-up accelerator 500 Startups, went so far as to coin the co-founders the “Estonian mafia”, a tongue-in-cheek reference to Silicon Valley’s “PayPal mafia”. Third, Estonia is a very small country, which means that entrepreneurs with ambitious goals are forced to think internationally from the start. It also means the network of Estonians is very tight-knit.19 It is interesting that this is a characteristic shared by all the countries in this cluster: what might seem to be a handicap – small population size – is turned, by necessity, into an advantage.
The Estonian government has greatly supported this trend, and has adopted several strategies over the past decade to boost business starts.20 While those efforts are paying off with a high TEA rate, Estonia’s EEA rate is only moderate. This could be the result of entrepreneurially-inclined individuals shifting into business starts, thereby narrowing the pool in corporate environments. If it wants to balance high TEA with high EEA, Estonia has some more work ahead. For example, the quality of scientific research institutions in Estonia is high, but there are questions about their economic impact; company spending on R&D and the number of patents issued are low. The economy is also lacking large employers that have deep pockets for capital expenditure and much of Estonian R&D is assisted by EU funding sources. In marked contrast to the high profile but relatively narrow tech start-up sector, Estonia’s established industrial base is dominated by low to medium technology SMEs competing in low margin industries, often as subcontractors. Almost 80% of Estonians work for SMEs, compared to approximately 67% of Europeans overall.21
Estonia is structurally and culturally predisposed to be a high- TEA economy and indeed the economy’s Baltic neighbours have similarly high rates (though with less sophisticated policy support). In part, this is because of limited opportunities to behave entrepreneurially within Estonia’s established business base. If Estonia can work on transforming its established businesses from within, by encouraging EEA, it could maintain its position as Europe’s most entrepreneurial economy.22
Europe’s Hidden Entrepreneurs 21
In the Leveraging Entrepreneurial Ambition and Innovation report, global rates of independent entrepreneurial activity (TEA: including ambitious and innovative types) were compared and many economies in Europe were found lacking. This report set out to explain how a highly competitive continent could display such low rates of entrepreneurial activity, and shows that by including entrepreneurial employee activity (EEA) in the analysis, a picture emerges of a significantly more entrepreneurial Europe. Several insights can be gained from this report.
1. Entrepreneurial activity goes beyond TEA and entrepreneurial employee activity is an important asset
This report reinforces an important emerging insight: entrepreneurship is expressed in more than one form. It can be found in all phases of the business life cycle, in the private and public sector, and in all countries across the globe.
The results from the analysis clearly show that many European economies are not as devoid of entrepreneurs as is commonly assumed. Rather than starting businesses, those entrepreneurs work for established organizations and innovate from within.
Compared to other employees, individuals who are involved in EEA are significantly more likely to perceive entrepreneurial opportunities, believe they have the capabilities for starting a business, and are less likely to state that fear of failure would prevent them from starting a business. The enterprising instincts of entrepreneurial employees are remarkably similar to those of early-stage entrepreneurs.
However, these findings reveal the fact that entrepreneurial employees may differ from independent entrepreneurs in other respects. For example, entrepreneurial employees are usually less exposed to personal financial risk, and have access to the resources of the organization where they work. In addition, they receive support and encouragement from their employers. In that respect, entrepreneurial employee activity can rightly be called a special type of entrepreneurship.
As with entrepreneurs who start businesses, entrepreneurs who are employed within organizations produce new products and services, and are important drivers of economic innovation. In addition, on average, the new projects they are working on can have greater potential for job creation than those of independent entrepreneurs.
However, EEA is not a widespread phenomenon. Only about 4% of the working-age populations in the sample of European economies are currently involved in EEA, but its prevalence differs markedly across individual countries, from slightly more than zero to almost 10%.
As was extensively documented in this report, EEA is most prevalent in highly competitive economies. The pattern of entrepreneurial employee activity across the stages of economic development is thus the reverse of that for early-stage business starts, which tend to decrease with economic development.
These data, therefore, strongly corroborate the conclusion from the recent report entitled Collaborative Innovation: Transforming Business, Driving Growth that entrepreneurship is more than starting a business, and many European economies have a head start when it comes to EEA. Governments can benefit significantly from building on this advantage and supporting EEA, where possible.
Section 5
Conclusions and implications

22 Europe’s Hidden Entrepreneurs
For policy-makers, this means that it is critical to understand the effects of both types of entrepreneurial activity on the institutional and regulatory environments, and set policy accordingly. This has a strong implication: intensify the inclusion of educational activities (programmes, learning/teaching methods) related to the development of entrepreneurial competencies and initiative and do not restrict such education to the technical aspects of starting a new business.
These patterns suggest that at the country level, entrepreneurship in organizations may, to some extent, serve as an alternative to individual entrepreneurship activity.
2. TEA and EEA are complementary
While TEA and EEA draw from the same pool of entrepreneurial individuals, it would be wrong to assume they compete with each other. On the contrary, the presence of both TEA and EEA offers opportunities for “collaborative innovation”, where a young firm and an established firm share complementary resources and combine efforts to support innovative ideas. This can create significant value for both parties, as well as for the economies in which such collaborations take place.
Given the challenges faced by innovative European entrepreneurs who seek to scale across fragmented markets, and have limited access to venture financing, the potential of these partnerships to contribute to innovation and growth is particularly high for European firms and countries. Policy-makers should actively encourage collaborative innovation and develop policies that incentivize it wherever possible.
3. Due to social and cultural values, economies differ across a typology of clusters
The cluster analysis showed that it is not impossible to rank highly on both EEA and TEA metrics – as indeed the Netherlands does, for example – but a number of structural, regulatory and cultural factors typically drive entrepreneurially-minded individuals towards one or the other.
For policy-makers, especially in the field of education, social security and labour markets, this highlights the importance of fully appreciating the time dimension for intervening in social and cultural values. Entrepreneurship policy targeted at changing attitudes is important – and a very long-term endeavour. But attitudes also reflect current perceptions of the economy and, if institutions are weak, then social resilience to economic shocks is also weak.
Part of the poor performance of the South Europe cluster, for instance, seems to be driven by the lack of an entrepreneurial culture. This is expressed through a high fear of failure, a lack of belief in entrepreneurial abilities and a low prevalence of opportunity perception. In part, this is influenced by the long-lasting impact of the recession on these countries, where weak institutional resilience caused a slide in confidence that has only recently begun to change.
Therefore, policy-makers need to assess the strengths and weaknesses of their own economies when designing entrepreneurship policies, and take into account unique features, rather than attempt to replicate the success of other countries. It would be hard, for example, for Germany to copy Estonian policies and expect similar results. Instead, governments should tailor policies to the unique features of their economy.
4. Policies matter
As seen in the case examples, both EEA and TEA can be levered through national policies. Examples of possible government interventions to support both types of entrepreneurs include:
— Acknowledging the importance of both modes of entrepreneurial activity and understanding their dependence on the quality of the institutional and regulatory context of a country
— Focusing on improving competitiveness in an economy to increase opportunities for entrepreneurial activity – both in the form of EEA and TEA
— Helping established firms become more innovative and open to entrepreneurial employee activity by incentivizing company R&D and making university-industry collaboration easier
— Developing entrepreneurial cultures by intensifying the inclusion of educational activities (programmes, learning/teaching methods) related to the development of entrepreneurial competencies and initiative at all educational levels, including – perhaps especially – executive education for senior management in established organizations on how to encourage EEA, since these may, unwittingly, hold back the entrepreneurial potential of their employees
This is not an exhaustive list. As noted above, national context is important and policy development should be preceded by a careful assessment of an economy’s strengths and weaknesses.
Conclusions and implications

Europe’s Hidden Entrepreneurs 23
Appendices
Appendix 1: Cluster analysis
A cluster analysis is a statistical method to identify groups or clusters within observed data based on commonality across a set of relevant variables. The groups or clusters, so formed, are “homogeneous within and heterogeneous between”, in the sense that all members belonging to a group or cluster share similar characteristics and they are different from members belonging to another cluster.
There are several clustering procedures to form clusters or groups. This study used a Hierarchical Cluster Analysis method, which starts with each case (economy in the analysis) as a separate cluster and then combines the cluster sequentially at each step until one large cluster is formed at the end of the procedure. By forming fewer clusters or groups from a larger set of clusters (or, individual cases), most likely “dissimilar” objects are added to be the members of a same group or cluster. The
procedure produces a hierarchical tree diagram (“dendrogram”) to show how the clusters are formed from individual cases, and displays the dissimilarity measure of forming fewer clusters from a larger set of cases. Depending on the research objectives and dissimilarity measures, one can select an appropriate number of clusters for the analysis.23
In the analysis, the aim was to group economies that share similar characteristics into homogenous segments based on the 12 pillars of the GCI. The cluster analysis suggested four groupings among 28 economies. Though the cluster analysis attempts to identify relatively homogenous groups, the use of 12 variables might not be enough to form four homogenous groups out of 28 diverse economies. Hence, the economies belonging to a group may not be fully homogenous within that group, or two economies belonging to two different groups may not be fully heterogeneous from each other.
Appendix 2: Economies in the global sample
Europe Latin America, CaribbeanUnited States, Canada, Australia
North AsiaMiddle East, North Africa
Austria Latvia Anguilla Panama Australia Georgia Algeria
Belgium Lithuania Argentina Peru Canada Japan Ethiopia
Bosnia and Herzegovina Luxembourg Barbados Puerto Rico United States Kazakhstan Egypt
Croatia Netherlands Belize Suriname Russia Gaza Strip and WestBank
Czech Republic Norway Bolivia Trinidad and Tobago South Korea Israel
Denmark Poland Brazil Uruguay Qatar
Estonia Portugal Chile Venezuela Tunisia
Finland Romania Colombia United Arab Emirates
France Slovak Republic Costa Rica
Germany Slovenia Ecuador
Greece Spain El Salvador
Hungary Sweden Guatemala
Ireland Switzerland Jamaica
Italy United Kingdom Mexico
South Asia South-East Asia Sub-Saharan Africa
Bangladesh Pakistan Indonesia Thailand Angola Namibia
China Taiwan Malaysia Vietnam Botswana Nigeria
India Turkey Philippines Burkina Faso South Africa
Iran Singapore Cameroon Uganda
Note: Countries were included if they measured EEA at least once in the four years from 2011 to 2014. Multi-year estimates from the same country were averaged before calculating their contribution to the regional estimate. Population data for the 18 to 64 age group for each country for each year were taken from the US Census International database.

24 Europe’s Hidden Entrepreneurs
Appendix 3: Correlation matrix
1 2 3 4 5 6 7
1 1st pillar: Institutions 1.00
2 2nd pillar: Infrastructure 0.72 * 1.00
3 3rd pillar: Macroeconomic environment 0.56 * 0.19 1.00
4 4th pillar: Health and primary education 0.78 * 0.75 * 0.20 1.00
5 5th pillar: Higher education and training 0.86 * 0.75 * 0.43* 0.87* 1.00
6 6th pillar: Goods market efficiency 0.91 * 0.71 * 0.53* 0.75* 0.79* 1.00
7 7th pillar: Labour market efficiency 0.80 * 0.43 * 0.61* 0.49* 0.66* 0.80* 1.00
8 8th pillar: Financial market development 0.79 * 0.48 * 0.75* 0.47* 0.64* 0.74* 0.77*
9 9th pillar: Technological readiness 0.93 * 0.87 * 0.46* 0.77* 0.85* 0.90* 0.70*
10 10th pillar: Market size 0.18 0.54 * -0.19 0.30 0.35 0.16 -0.03
11 11th pillar: Business sophistication 0.88 * 0.86 * 0.45* 0.82* 0.88* 0.87* 0.66*
12 12th pillar: Innovation 0.94 * 0.82 * 0.51* 0.81* 0.89* 0.87* 0.71*
13 TEA -0.26 -0.52 * 0.07 -0.45* -0.36 -0.16 0.12
14 Opportunity-based TEA 0.07 -0.15 0.27 -0.17 -0.01 0.17 0.36
15 Ambitious TEA -0.44 * -0.63 * -0.04 -0.57* -0.41* -0.32 -0.04
16 Innovative TEA 0.08 -0.15 0.22 -0.17 -0.11 0.23 0.34
17 EEA 0.73 * 0.39 * 0.50* 0.46* 0.62* 0.69* 0.66*
8 9 10 11 12 13 14
8 8th pillar: Financial market development 1.00
9 9th pillar: Technological readiness 0.72 * 1.00
10 10th pillar: Market size 0.19 0.30 1.00
11 11th pillar: Business sophistication 0.70 * 0.91* 0.49* 1.00
12 12th pillar: Innovation 0.75 * 0.92* 0.37 0.96* 1.00
13 TEA -0.01 -0.36 -0.51* -0.46* -0.44* 1.00
14 Opportunity-based TEA 0.23 0.05 -0.39* -0.10 -0.10 0.87* 1.00
15 Ambitious TEA -0.13 -0.49* -0.37 -0.54* -0.53* 0.77* 0.60*
16 Innovative TEA 0.19 0.05 -0.48* -0.13 -0.13 0.77* 0.84*
17 EEA 0.61 * 0.71* -0.03 0.62* 0.67* -0.14 0.11
15 16 17
15 Ambitious TEA 1.00
16 Innovative TEA 0.52 * 1.00
17 EEA -0.19 0.11 1.00
Starred correlation coefficients are statistically significant at the 5% level.

Europe’s Hidden Entrepreneurs 25
Endnotes
1 World Economic Forum Insight Report available at http://www3. weforum.org/docs/WEF_EuropeCompetitiveness_Fostering InnovationDrivenEntrepreneurship_Report_2014.pdf.
2 Joint GEM and World Economic Forum available at http://www3. weforum.org/docs/WEFUSA_EntrepreneurialInnovation_Report.pdf.
3 Bosma, N. et al. (2013), Global Entrepreneurship Monitor Special Report on Entrepreneurial Employee Activity, London: Global Entrepreneurship Research Association (GERA).
4 See “Inclusive Entrepreneurship in Europe – An OECD-European Commission Project”, available at http://www.oecd.org/cfe/leed/ inclusive-entrepreneurship.htm.
5 See Small Business Act fact sheets available at http://ec.europa. eu/growth/smes/business-friendly-environment/performance-review/ index_en.htm#sba-fact-sheets.
6 World Economic Forum Regional Agenda report available at http:// www3.weforum.org/docs/WEF_Collaborative_Innovation_report_ 2015.pdf.
7 The United States, Canada and Australia are grouped together in this report as they show remarkably similar entrepreneurial activity rates and share a common Anglo-Saxon heritage.
8 See Appendix 2 for a list of economies by region.
9 See Bosma, N. et al., op. cit., p. 51.
10 R2 = 0.46
11 A recent study provides initial support for these explanations. See Bosma, N., Stam, E. and Wennekers, S. (2015), Incomplete Contracts and the Allocation of Entrepreneurship in Society, Academy of Management Proceedings, New York: Academy of Management (AOM).
12 See Appendix 1 for the detailed methodology.
13 Lifestyle TEA is defined as total early-stage entrepreneurial activity that does not fall into either the ambitious or innovative subgroups of entrepreneurs.
14 The authors thank Professor Rolf Sternberg, whose insight contributed substantially to this section.
15 For an explanation and assessment of the Hartz reforms, see “How have the Hartz reforms shaped the German labour market?”, available at http://www.tresor.economie.gouv.fr/File/386657.
16 The authors thank Anna Tarnawa and Dorota Wecławska of the GEM Poland team for their insights on entrepreneurship in Poland, which contributed substantially to this section.
17 The authors thank Professor Moreno Muffato, Head of GEM Italy, whose insight contributed substantially to this section.
18 See the “Executive Summary of the new Italian legislation on innovative startups” (26 May 2015) from the Italian Ministry of Economic Development, available at http://www.sviluppoeconomico. gov.it/images/stories/documenti/Executive_Summary_of%20 Italy_Startup_Act%2026_05_2015.pdf.
19 See Silver Tambur’s article, “What can others learn from Estonian entrepreneurs – lessons from Europe’s startup capital”, in estonian world, available at: http://estonianworld.com/business/ lessons-from-europes-startup-capital/.
20 See information provided by Signe Ratso, Deputy Secretary- General of EU and International Co-operation at the Ministry of Economic Affairs and Communications of Estonia, entitled “Miracle of Estonia: Entrepreneurship and Competitiveness Policy in Estonia”, available at http://www.unece.org:8080/fileadmin/DAM/ ie/wp8/documents/mayfor/Signe%20Ratsop.pdf.
21 Enterprise and Industry 2014 SBA Fact Sheet: Estonia, available at http://ec.europa.eu/DocsRoom/documents/16121/ attachments/10/translations.
22 The authors thank Tõnis Arro for his helpful comments on an earlier draft of this section.
23 For more information, see Chapter 8 of Hair et al. (2010), Multivariate Data Analysis, 7th edition, New Jersey: Pearson Prentice Hall.

26 Europe’s Hidden Entrepreneurs
World Economic Forum
Michael Drexler, Senior Director, Head of Invetors Industries, World Economic Forum
Maha Eltobgy, Director, Head of Private Investors, World Economic Forum
Peter Gratzke, Project Specialist, Investors Industries, World Economic Forum
Joseph Losavio, Community Specialist, Investors Industries, World Economic Forum USA
Megan O’Neill, Community Specialist, Investors Industries, World Economic Forum USA
Production and design team (in alphabetical order)
Adelheid Christian-Zechner, Designer
Fabienne Stassen, Editor
Peter Vanham, Media Lead, US and Industries, World Economic Forum USA
Acknowledgements
Project teamGlobal Entrepreneurship Monitor (in alphabetical order)
Abdul Ali, Associate Professor, Babson College, Boston, USA; Technical Leader, GEM United States
Niels Bosma, Assistant Professor, Utrecht University School of Economics; GEM Belgium and GEM Netherlands; Board of Directors, Global Entrepreneurship Research Association; Research Fellow, Vlerick Business School
Mark Hart, Professor of Small Business and Entrepreneurship, Aston Business School, Aston University, United Kingdom; Deputy Director, Enterprise Research Centre (ERC); Co-director, GEM United Kingdom
Donna Kelley, Professor of Entrepreneurship, Babson College, Boston, USA; Team Leader, GEM United States; Board of Directors, Global Entrepreneurship Research Association
Jonathan Levie, Professor of Entrepreneurship, Hunter Centre for Entrepreneurship, Strathclyde Business School, University of Strathclyde, Glasgow, United Kingdom; Co-director, GEM United Kingdom
World Economic Forum91-93 route de la CapiteCH-1223 Cologny/GenevaSwitzerland
Tel: +41 (0) 22 869 1212Fax: +41 (0) 22 786 2744
The World Economic Forum – committed to improving the state of the world – is the International Organization for Public-Private Cooperation.
The Forum engages the foremost political, business and other leaders of society to shape global, regional and industry agendas.