European Subsea Cable Report & Forecast 2015-2025 · PDF fileSubsea Cables 11 4. Cable...
9
European Subsea Cable Report Sample An Analysis and Forecast to 2025 4C Offshore Limited OrbisEnergy Centre Lowestoſt, Suffolk NR32 1XH, UK +44 (0)1502 307 037 info@4coffshore.com Published May 2015
Transcript of European Subsea Cable Report & Forecast 2015-2025 · PDF fileSubsea Cables 11 4. Cable...
European Subsea Cable Report Sample
An Analysis and Forecast to 2025
4C Offshore Limited
OrbisEnergy Centre
Lowestoft, Suffolk
NR32 1XH, UK
+44 (0)1502 307 037
Published May 2015
European Subsea Cable Report & Forecast 2015-2025 - SAMPLE| 1
Table of Contents
1. Executive Summary 7
2. Market Development to Date 9
3. Subsea Cables 11
4. Cable Installation 14
5. Cable Monitoring 16
6. Cable Inspection 16
7. Cable Intervention and Repairs 17
8. Cable Faults 19
9. Weather Related Installation Delays 23
10. Market Share: Array Cable Supply 26
11. Market Share: Export Cable Supply 27
12. Market Share: Interconnector Cable Supply 28
13. Market Share: Array Cable Installation 29
14. Market Share: Export Cable Installation 30
15. Market Share: Interconnector Cable Installation 31
16. At a Glance: Subsea Cable Installation Companies and Their Assets 32
17. Transmission Policy Frameworks Overview 33
18. Country Overview: Belgium 37
19. Country Overview: Denmark 40
20. Country Overview: France 42
21. Country Overview: Germany 44
22. Country Overview: Netherlands 46
23. Country Overview: United Kingdom 49
24. Costs: Cable Supply Costs 51
25. Costs: Cable Installation Costs 53
26. Costs: Capital Expenditure 54
27. Forecasting Methodology 55
28. Forecasting Results: Cable demand and expenditure to 2025 57
29. Appendix: Project Pipelines by Country 64
30. Appendix: Future Wind Farm Opportunities 68
31. Appendix: Future Interconnector Opportunities 73
32. Appendix: Offshore Wind Subsea IMR Contracts 81
33. Appendix: Offshore Wind Subsea IMR Players Schematic 83
34. Appendix: German North Sea Grid Connections 84
35. Appendix: Baltic Sea Grid Connections 85
European Subsea Cable Report & Forecast 2015-2025 - SAMPLE| 2
Table of Figures
Figure 1. Summary of offshore wind subsea cable market development 2002-2014 7
Figure 2. Percentage of incidents by problem and median delay length 7
Figure 3. Number of players and market leaders for subsea cable and installation since 2010 8
Figure 4. Current (April 2015) and future (2025) installed capacity for the six main European markets 8
Figure 5.Offshore Wind CAPEX spend by country summed for period 2015-2025 9
Figure 6.Demand for array, export, HVDC transmission and interconnector cabling 2015-2025 (km) 9
Figure 7. Water depth and distance to shore at installed or underway European projects 10
Figure 8. Percent of capacity being exported via transmission technology (MVAC, HVAC, HVDC) 10
Figure 9. Nysted's substation (HVAC transformer) and Helwin Alpha (HVDC converter station) 10
Figure 10. Offshore wind cabling to date plotted by offshore installation start year 11
Figure 11. Preparing for installation, array cable being wound on a carousel and subsea power cable cross section 11
Figure 12. Ready for installation: export cable being wound on a carousel utilizing a tensioner 12
Figure 13. Four 66kV cable designs receiving qualification funding from the Carbon Trust's OWA 12
Figure 14. Single bipole arrangement schematic 13
Figure 15. Loading HVDC onto a cable lay vessel at the factory 13
Figure 16. Reef Subsea’s Q1000 Jet trencher, Subsea 3M Cable Plough and DeepOcean's UT-1 trencher 15
Figure 17. Typical Survey Programme for a Round 2 UK Wind Farm 17
Figure 18. Thanet Export cable replacement 18
Figure 19. Indicative CAPEX reduction potential of transmission initiatives and cost reduction options 19
Figure 20. Percentage of incidents by problem and median delay length 20
Figure 21. Actual versus expected array cable rates at Gwynt-y-Môr 23
Figure 22. Significant delays attributable to weather 24
Figure 23. Example cable installation elements and influencing metocean components 24
Figure 24. Reducing weather risk during cable installation by optimising elements of the process 25
Figure 25. Market share: array cable manufacture since 2010 26
Figure 26. Market share: export cable manufacture since 2010 27
Figure 27. Market share: interconnector cable manufacture for on and offshore cable length since 2010 28
Figure 28. Market share: array cable installation since 2010 29
Figure 29. Market share: Export cable installation since 2010 30
Figure 30. Market share: interconnector installation (subsea component) 31
Figure 31. European offshore wind and interconnector subsea cable installation companies 33
European Subsea Cable Report & Forecast 2015-2025 - SAMPLE| 3
Figure 32. Estimated OFTO O&M expenditure per annum 34
Figure 33. Results OFTO Tenders 1-3 and operations and maintenance body 35
Figure 34. Belgian Offshore Grid 37
Figure 35. Belgium: Projects installed 38
Figure 36. Belgium: Investor types and owners for projects that are commissioned or in construction 39
Figure 37. Cumulative installations according to 4C's 2025 projection 39
Figure 38. Denmark: Projects installed 41
Figure 39. Denmark: Investor types and owners for projects that are commissioned or in construction 41
Figure 40. Cumulative installations according to 4C's 2025 projection 41
Figure 41. French offshore wind tender results. 42
Figure 42. Supply chain investments in France 43
Figure 43. Cumulative installations according to 4C's 2025 projection 43
Figure 44. The extension of the higher initial remuneration has opened further investment in German offshore wind 45
Figure 45. Progress towards goals and grid allocation to date 45
Figure 46. Germany: Investor types and owners for projects that are commissioned or in construction 45
Figure 47. Annual installations according to 4C's 2025 projection 46
Figure 48. Map of current and future Netherlands offshore wind projects 47
Figure 49. Netherlands progress to date and scale of future tenders 48
Figure 50. Cumulative installations according to 4C's 2025 projection 49
Figure 51. UK development, licensing rounds and progress to date 50
Figure 52. Ownership of generating and under construction projects in the UK 50
Figure 53. Annual installations according to 4C's 2025 projection 51
Figure 54. Array cable manufacture costs versus array cable length; regression analysis and table of projects 52
Figure 55. HVAC cable manufacture costs versus array cable length; regression analysis and table of projects 52
Figure 56. HVDC cable manufacture costs and table of projects 53
Figure 57. Array cable supply costs versus array length; regression analysis and table of projects 53
Figure 58. Export cable supply costs versus length; regression analysis and table of projects 54
Figure 59. CAPEX modelling to 2025 55
Figure 60. Observed array cable lengths (km) plotted against the two predictive components 56
Figure 61. Observed substation capacity by construction start year and number of substations by project capacity 57
Figure 62. Observed turbine capacity by construction start year and number of confirmed turbine orders 57
Figure 63. Cumulative annual offshore wind CAPEX to 2015-2025 and breakdown by country 58
European Subsea Cable Report & Forecast 2015-2025 - SAMPLE| 4
Figure 64. Annual array cable demand (km) 2015-2025 by country 59
Figure 65. Annual MVAC export cable demand (km) 2015-2025 by country plus total MVAC cable demand by country 60
Figure 66. Annual HVAC export cable demand (km) 2015-2025 by country plus total HVAC cable demand by country 61
Figure 67. Annual HVDC export cable demand (km) 2015-2025 by country plus total HVDC cable demand by country 62
Figure 68. European HVDC interconnector cable demand for the period 2015-2025 63
Figure 69. Expenditure on HVDC interconnector cable supply and installation for the period 2015-2025 63
Figure 70. Rate of installation data set: MW/year increasing with start of offshore installation 64
Figure 71. Belgium: Project installations to 2025 65
Figure 72. Denmark: Project installations to 2025 65
Figure 73. France: Project installations to 2025 66
Figure 74. Germany: Project installations to 2025 66
Figure 75. Netherlands: project installations to 2025 67
Figure 76. United Kingdom: Project installations to 2025 67
Figure 77. Future UK offshore wind farm projects awarded cable supply and manufacture contracts 68
Figure 78. Future German offshore wind farm projects awarded cable supply and manufacture contracts 69
Figure 79. HVDC Transmission cable supply and installation contracts for German North Sea Converter Stations 70
Figure 80. Future Belgian offshore wind farm projects awarded cable supply and manufacture contracts 70
Figure 81. Future Danish offshore wind farm projects awarded cable supply and manufacture contracts and contracts 71
European Subsea Cable Report & Forecast 2015-2025 - SAMPLE| 5
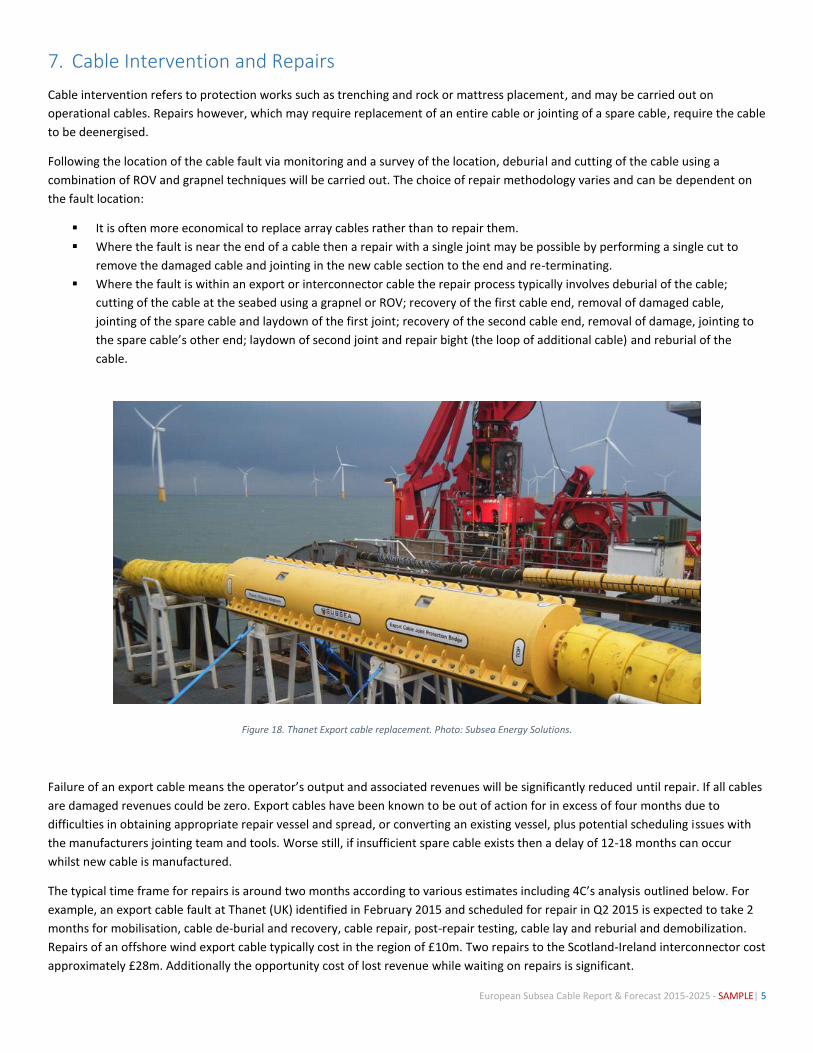
7. Cable Intervention and Repairs
Cable intervention refers to protection works such as trenching and rock or mattress placement, and may be carried out on
operational cables. Repairs however, which may require replacement of an entire cable or jointing of a spare cable, require the cable
to be deenergised.
Following the location of the cable fault via monitoring and a survey of the location, deburial and cutting of the cable using a
combination of ROV and grapnel techniques will be carried out. The choice of repair methodology varies and can be dependent on
the fault location:
It is often more economical to replace array cables rather than to repair them.
Where the fault is near the end of a cable then a repair with a single joint may be possible by performing a single cut to
remove the damaged cable and jointing in the new cable section to the end and re-terminating.
Where the fault is within an export or interconnector cable the repair process typically involves deburial of the cable;
cutting of the cable at the seabed using a grapnel or ROV; recovery of the first cable end, removal of damaged cable,
jointing of the spare cable and laydown of the first joint; recovery of the second cable end, removal of damage, jointing to
the spare cable’s other end; laydown of second joint and repair bight (the loop of additional cable) and reburial of the
cable.
Figure 18. Thanet Export cable replacement. Photo: Subsea Energy Solutions.
Failure of an export cable means the operator’s output and associated revenues will be significantly reduced until repair. If all cables
are damaged revenues could be zero. Export cables have been known to be out of action for in excess of four months due to
difficulties in obtaining appropriate repair vessel and spread, or converting an existing vessel, plus potential scheduling issues with
the manufacturers jointing team and tools. Worse still, if insufficient spare cable exists then a delay of 12-18 months can occur
whilst new cable is manufactured.
The typical time frame for repairs is around two months according to various estimates including 4C’s analysis outlined below. For
example, an export cable fault at Thanet (UK) identified in February 2015 and scheduled for repair in Q2 2015 is expected to take 2
months for mobilisation, cable de-burial and recovery, cable repair, post-repair testing, cable lay and reburial and demobilization.
Repairs of an offshore wind export cable typically cost in the region of £10m. Two repairs to the Scotland-Ireland interconnector cost
approximately £28m. Additionally the opportunity cost of lost revenue while waiting on repairs is significant.
European Subsea Cable Report & Forecast 2015-2025 - SAMPLE| 6
The telecoms sector’s solution to this cable-repair problem is the Atlantic Cable Maintenance & Repair Agreement (ACMA), a non-
profit cable maintenance programme with 62 members who are provided access to vessels staffed permanently with dedicated
repair teams. Such an agreement, with its strong performance targets ensuring efficient repairs does not exist between offshore
wind developers. Recognising that ACMA vessels are less suitable for power cable maintenance Global Marine Systems Ltd (GMSL),
now Prysmian, are working with Transmission Capital (an OFTO) to upgrade the deck layout, turntable, equipment of vessel Wave
Sentinal, a current ACMA telecom-cable repair vessel to provide it with power cable repair capabilities. The vessel’s draught means it
will not be able to operate in shallow waters but is expected to be able to repair 80% of OFTO cable faults. In parallel, a universal
jointing system will be developed capable of joining power cables from different suppliers, and a team of appropriately qualified
staff will be trained and assigned to the vessel. Upon completion ACMA network participants will have access to the new power
cable repair service from 2017. A DNVGL survey (DNV, 2014) found that 15% of industry respondents cited a cable repair framework
agreement as a potential route to cost reduction in offshore transmission.
Currently some park and transmission operators employ framework agreements for cable maintenance and repair. For example in
2011 the Briggs Group secured a five year agreement with SSE to repair and maintain a network comprising 102 live cables over a
distance of 515km. Briggs provides 24/7 immediate mobilisation and specialist end-to-end support, including network surveys, cable
protection work, cable installation, repair and testing through all seasons. Similarly Transmission Capital has contracted Global
Marine (GM) under a framework where GM is the preferred repair contractor offering a 24/7 call out facility. Other UK OFTOs are
known to be exploring framework agreements.
In a report for the Crown Estate (DNV 2014) concerning good practice in offshore transmission, several areas were identified with
the potential for cost reduction. Potential CAPEX savings relating to cable technology and installations are shown in Figure 19 in
bold. These included avoiding damage to or failures of cables during installation; increasing the number of bidders for offshore
export cable supply; bringing the supply chain into the development process earlier and use of appropriate ratings. Not all savings
can be attributed to the cabling, increased competition, appropriate ratings and early supply chain involvement are also relevant for
substations. The report also suggests a 1% reduction in LCOE may be possible through increased energy production as a result of
having cable repair agreements in place to reduce downtime.
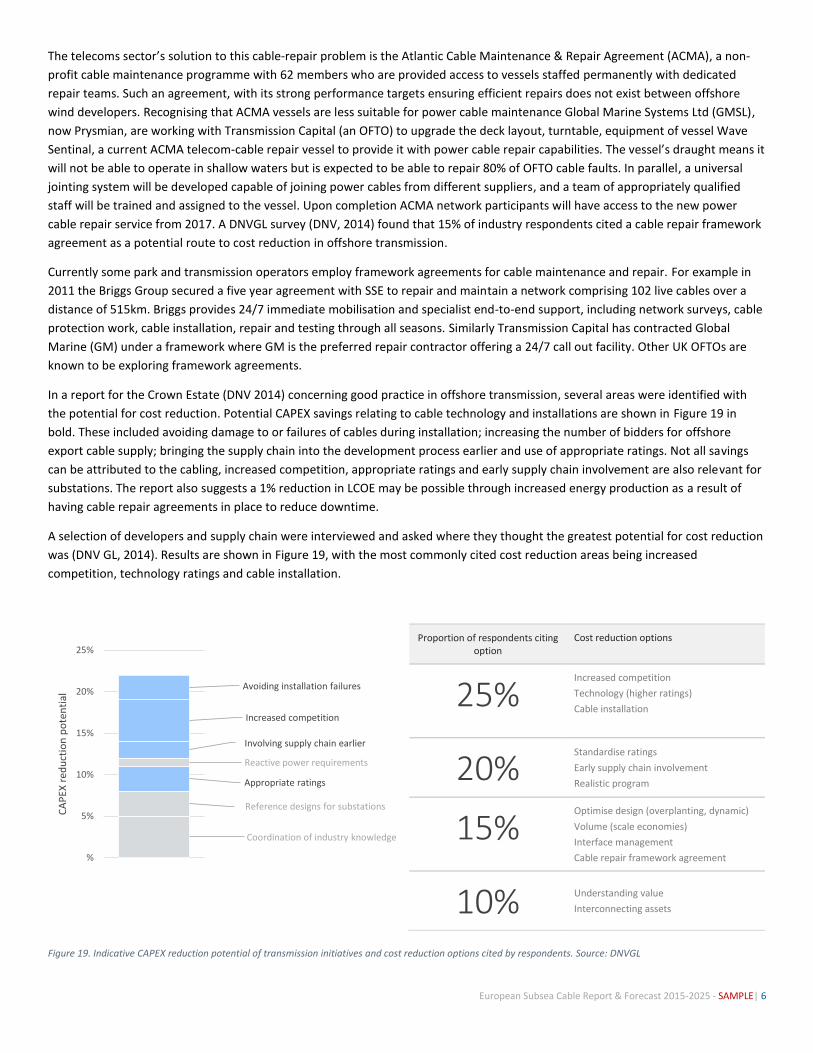
A selection of developers and supply chain were interviewed and asked where they thought the greatest potential for cost reduction
was (DNV GL, 2014). Results are shown in Figure 19, with the most commonly cited cost reduction areas being increased
competition, technology ratings and cable installation.
Proportion of respondents citing option
Cost reduction options
25% Increased competition
Technology (higher ratings)
Cable installation
20% Standardise ratings
Early supply chain involvement
Realistic program
15% Optimise design (overplanting, dynamic)
Volume (scale economies)
Interface management
Cable repair framework agreement
10% Understanding value
Interconnecting assets
Figure 19. Indicative CAPEX reduction potential of transmission initiatives and cost reduction options cited by respondents. Source: DNVGL
Coordination of industry knowledge
Reference designs for substations
Appropriate ratings
Reactive power requirements
Involving supply chain earlier
Increased competition
Avoiding installation failures
%
5%
10%
15%
20%
25%
CA
PEX
red
uct
ion
po
ten
tial
European Subsea Cable Report & Forecast 2015-2025 - SAMPLE| 7
8. Cable Faults
Cabling has become synonymous with cost overruns and delays in offshore wind. According to 2012 estimates from offshore
insurance company Codan, cables account for 90% of the number of offshore wind claims and 70% of the actual cost of all offshore
wind claims. This is highly disproportionate to the CAPEX associated with their manufacture and installation. It is reported that the
majority of claims are due to incorrect installation and load out of cables (GCube), and that there is no evidence to date of damage
during operations by e.g. anchor strike (Offshore Wind Accelerator (OWA), 2015). According to the OWA between 2007 and 2014,
the cumulative cost to insurers was £75 million with over 60 incidents alone resulting in pay outs of between £0.5 million and £13.5
million per claim.
Historically offshore wind projects have used the Burial Protection Index (BPI) to set the optimum Depth of Lowering in the seabed
for adequate protection from external threats. A weakness of this approach however is that it does not optimize for actual levels of
external risk and therefore can be overly conservative, increasing time and cost of installation and even introducing risk through
excessive handling of cabling by trenching equipment. To address these shortcomings and unify emerging best practices, a
repeatable and probabilistic Cable Burial Risk Assessment Methodology (CBRA) has been published (OWA, 2015) which is “practically
and economically achievable whilst providing adequate protection”.
Cable Delay and Fault Study
In order to improve insight into cable problems and their impacts, 4C has undertaken a detailed cable fault study on European wind
farms. A total of 66 separate problems were identified through both public information and direct communications. These incidents
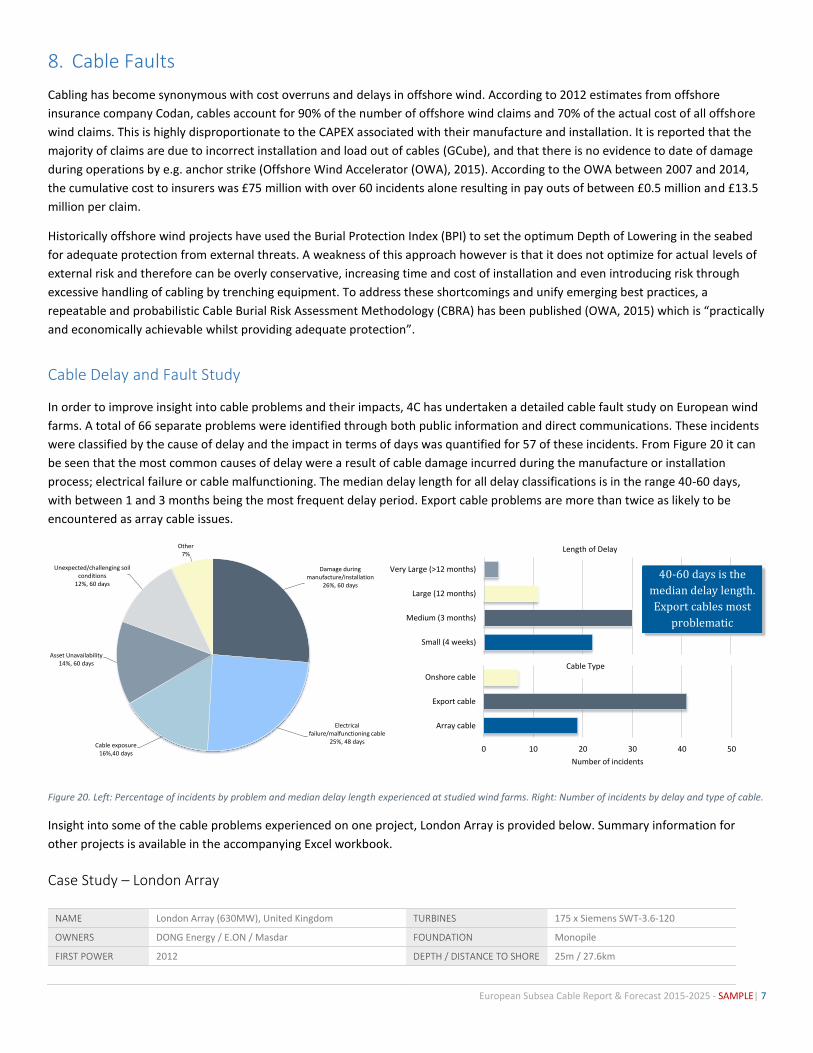
were classified by the cause of delay and the impact in terms of days was quantified for 57 of these incidents. From Figure 20 it can
be seen that the most common causes of delay were a result of cable damage incurred during the manufacture or installation
process; electrical failure or cable malfunctioning. The median delay length for all delay classifications is in the range 40-60 days,
with between 1 and 3 months being the most frequent delay period. Export cable problems are more than twice as likely to be
encountered as array cable issues.
Figure 20. Left: Percentage of incidents by problem and median delay length experienced at studied wind farms. Right: Number of incidents by delay and type of cable.
Insight into some of the cable problems experienced on one project, London Array is provided below. Summary information for
other projects is available in the accompanying Excel workbook.
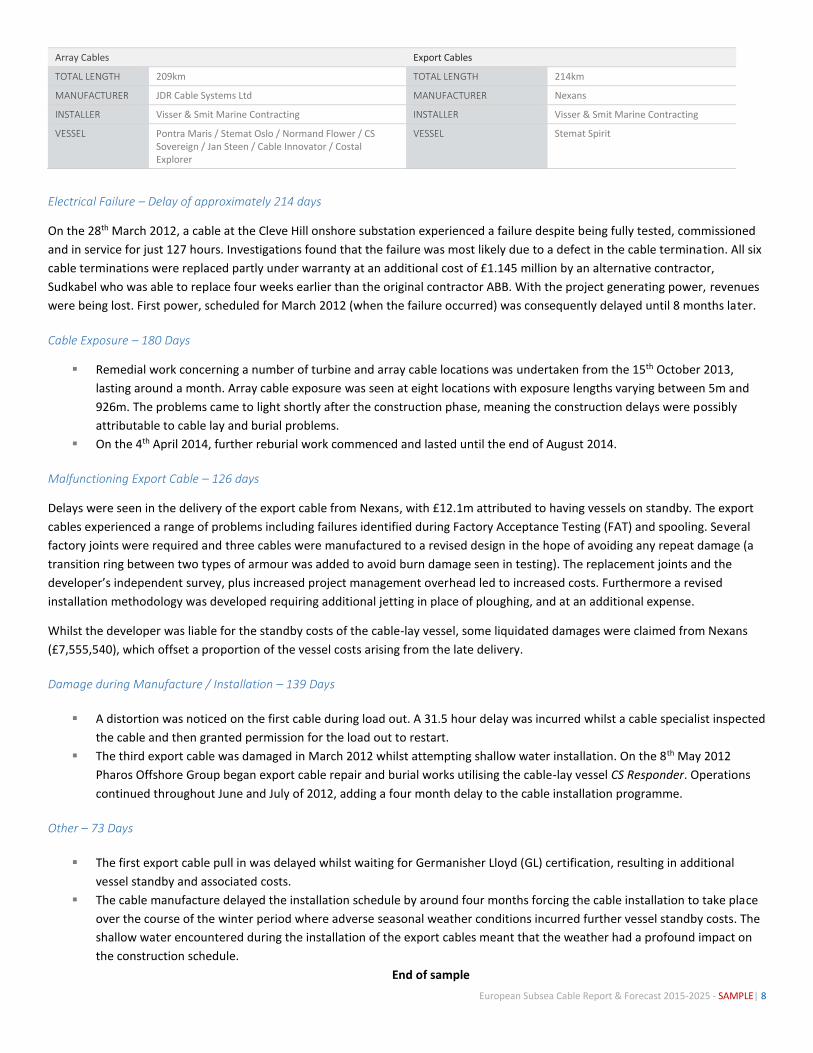
Case Study – London Array
NAME London Array (630MW), United Kingdom TURBINES 175 x Siemens SWT-3.6-120
OWNERS DONG Energy / E.ON / Masdar FOUNDATION Monopile
FIRST POWER 2012 DEPTH / DISTANCE TO SHORE 25m / 27.6km
Damage during manufacture/installation
26%, 60 days
Electrical failure/malfunctioning cable
25%, 48 daysCable exposure
16%,40 days
Asset Unavailability14%, 60 days
Unexpected/challenging soil conditions
12%, 60 days
Other7%
Array cable
Export cable
Onshore cable
0 10 20 30 40 50
Number of incidents
Cable Type
Small (4 weeks)
Medium (3 months)
Large (12 months)
Very Large (>12 months)
Length of Delay
40-60 days is the
median delay length.
Export cables most
problematic
European Subsea Cable Report & Forecast 2015-2025 - SAMPLE| 8
Array Cables Export Cables
TOTAL LENGTH 209km TOTAL LENGTH 214km
MANUFACTURER JDR Cable Systems Ltd MANUFACTURER Nexans
INSTALLER Visser & Smit Marine Contracting INSTALLER Visser & Smit Marine Contracting
VESSEL Pontra Maris / Stemat Oslo / Normand Flower / CS Sovereign / Jan Steen / Cable Innovator / Costal Explorer
VESSEL Stemat Spirit
Electrical Failure – Delay of approximately 214 days
On the 28th March 2012, a cable at the Cleve Hill onshore substation experienced a failure despite being fully tested, commissioned
and in service for just 127 hours. Investigations found that the failure was most likely due to a defect in the cable termination. All six
cable terminations were replaced partly under warranty at an additional cost of £1.145 million by an alternative contractor,
Sudkabel who was able to replace four weeks earlier than the original contractor ABB. With the project generating power, revenues
were being lost. First power, scheduled for March 2012 (when the failure occurred) was consequently delayed until 8 months later.
Cable Exposure – 180 Days
Remedial work concerning a number of turbine and array cable locations was undertaken from the 15th October 2013,
lasting around a month. Array cable exposure was seen at eight locations with exposure lengths varying between 5m and
926m. The problems came to light shortly after the construction phase, meaning the construction delays were possibly
attributable to cable lay and burial problems.
On the 4th April 2014, further reburial work commenced and lasted until the end of August 2014.
Malfunctioning Export Cable – 126 days
Delays were seen in the delivery of the export cable from Nexans, with £12.1m attributed to having vessels on standby. The export
cables experienced a range of problems including failures identified during Factory Acceptance Testing (FAT) and spooling. Several
factory joints were required and three cables were manufactured to a revised design in the hope of avoiding any repeat damage (a
transition ring between two types of armour was added to avoid burn damage seen in testing). The replacement joints and the
developer’s independent survey, plus increased project management overhead led to increased costs. Furthermore a revised
installation methodology was developed requiring additional jetting in place of ploughing, and at an additional expense.
Whilst the developer was liable for the standby costs of the cable-lay vessel, some liquidated damages were claimed from Nexans
(£7,555,540), which offset a proportion of the vessel costs arising from the late delivery.
Damage during Manufacture / Installation – 139 Days
A distortion was noticed on the first cable during load out. A 31.5 hour delay was incurred whilst a cable specialist inspected
the cable and then granted permission for the load out to restart.
The third export cable was damaged in March 2012 whilst attempting shallow water installation. On the 8th May 2012
Pharos Offshore Group began export cable repair and burial works utilising the cable-lay vessel CS Responder. Operations
continued throughout June and July of 2012, adding a four month delay to the cable installation programme.
Other – 73 Days
The first export cable pull in was delayed whilst waiting for Germanisher Lloyd (GL) certification, resulting in additional
vessel standby and associated costs.
The cable manufacture delayed the installation schedule by around four months forcing the cable installation to take place
over the course of the winter period where adverse seasonal weather conditions incurred further vessel standby costs. The
shallow water encountered during the installation of the export cables meant that the weather had a profound impact on
the construction schedule.
End of sample