
European Priorities for Pedestrian Safety
19
European priorities for pedestrian safety Jeanne Breen, Executive Director, European Transport Safety Council 1. Introduction The safety of people walking in urban areas has now to be considered in many European countries in the context of policies for encouraging people to travel on foot, by cycle or by public transport rather than by car in order to reduce environmental damage, improve public health, and enhance the quality of life in towns and cities. The principal conclusion of a recent review by the European Transport Safety Council (ETSC) was that by implementing known countermeasures it should be possible to achieve considerable increases in the use of healthier and more environmentally friendly means of transport and still reduce the numbers of deaths and injuries among pedestrians and cyclists. However, further concerted action needs to be taken by policymakers at local, national and international levels to ensure that this positive scenario can be brought about (ETSC, 1999a). Practically everyone needs to walk whether for work, shopping, education or leisure and making the pedestrian environment safer will affect many people. The core of this paper is to set out the challenge that providing for safer walking presents to policymakers and professionals concerned with the many relevant aspects of urban planning and design of the road transport system and its use. The aim is, also, to reflect the consensus which exists, at least between independent road safety experts from across the European Union, about the strategies and priority measures needed to reduce pedestrian crash injury risk against the background of policies to increase levels of walking. Updates on developments in European Union and national policies on pedestrian safety will be presented along the way. The basis of this contribution are recent ETSC’s recent reviews on the Safety of Pedestrians and Cyclists in Urban Areas and Priorities for EU Motor Vehicle Safety Design, as well as the contributions on vulnerable road user safety made recently by the OECD, ECMT, and the EU projects, MASTER, DUMAS, PROMISING and WALCYNG. Wherever possible, the international statistical comparisons presented include New South Wales and Australia in addition to EU countries. These indicate broadly similar motorisation levels and per capita pedestrian death rates. 2. The amount of walking in Europe Survey data from a selection of seven European countries show that 15-30% of all trips are made by walking, the highest figure being for Great Britain (PROMISING, 2001). For short trips the share of walking can rise to 40%. This EU project also identified that: the average length of walking trips varies from just under 1km to 2.8km the larger the city, the more walking trips people tend to perform the number of daily walking trips is higher for women than for men the distances and the proportions of trips performed by walking seem to have been decreasing since the early 1980s, which may be partly related both to the increased travelling distances resulting from urban development, and to the increase in vehicle ownership.
-
Upload
brett-castro -
Category
Documents
-
view
214 -
download
0
Transcript of European Priorities for Pedestrian Safety

8/12/2019 European Priorities for Pedestrian Safety
http://slidepdf.com/reader/full/european-priorities-for-pedestrian-safety 1/19

8/12/2019 European Priorities for Pedestrian Safety
http://slidepdf.com/reader/full/european-priorities-for-pedestrian-safety 2/19
2
3. The risks faced by pedestrians in EU countries
While car users comprise the greatest proportion of overall road deaths (57%), the risk ofdeath on EU roads is substantially higher for vulnerable road users. It has been estimated,albeit roughly, that walking is around 9 times riskier than travel by car for the EU as awhole. Pedestrian deaths comprise 15% of total road deaths, with the UK (25%) and theNetherlands (10%) at either end of the range.
Table 1. EU deaths per 100 million person km ETSC 1999b
Motorcycle/moped 16Foot 7.5Cycle 6.3Car 0.8Bus and coach 0.08Rail 0.04
Figure 1. Pedestrian deaths as % of road deaths: 2000 Source: IRTAD 2002
Whether measured by rates of pedestrian deaths per 100,000 population or motor vehicleswhich, of course, do not take any account of the level of the activity there are substantialdifferences between Member States with the highest rates in Portugal and Greece and thelowest rates in Sweden and the Netherlands. More information is needed about levels ofpedestrian and cyclist traffic in the EU, however, before crash risk differences can be fullyunderstood.
Figure 2. Pedestrian deaths per 100,000 population: 2000 Source: IRTAD 2002
43.8
2.72.3 2.3
1.9 1.7 1.7 1.6 1.5 1.5 1.5 1.4 1.4 1.2 1.20.8 0.7
0
1
2
3
4
5
P O R T G R L U
X
S P A I N
I R E D K A
N S W E U
A U
S U K
I T A L Y
B E L G F R
A F I N
G E R
S W E D
N E T H
0
5
10
15
20
25
U K
P O R T
D K
I R E
G R E E C E
N S W
F I N
S P A I N
A U S
E U L U X A
I T A L Y
G E R
S W E D
F R A
B E L
N L
8/12/2019 European Priorities for Pedestrian Safety
http://slidepdf.com/reader/full/european-priorities-for-pedestrian-safety 3/19
3
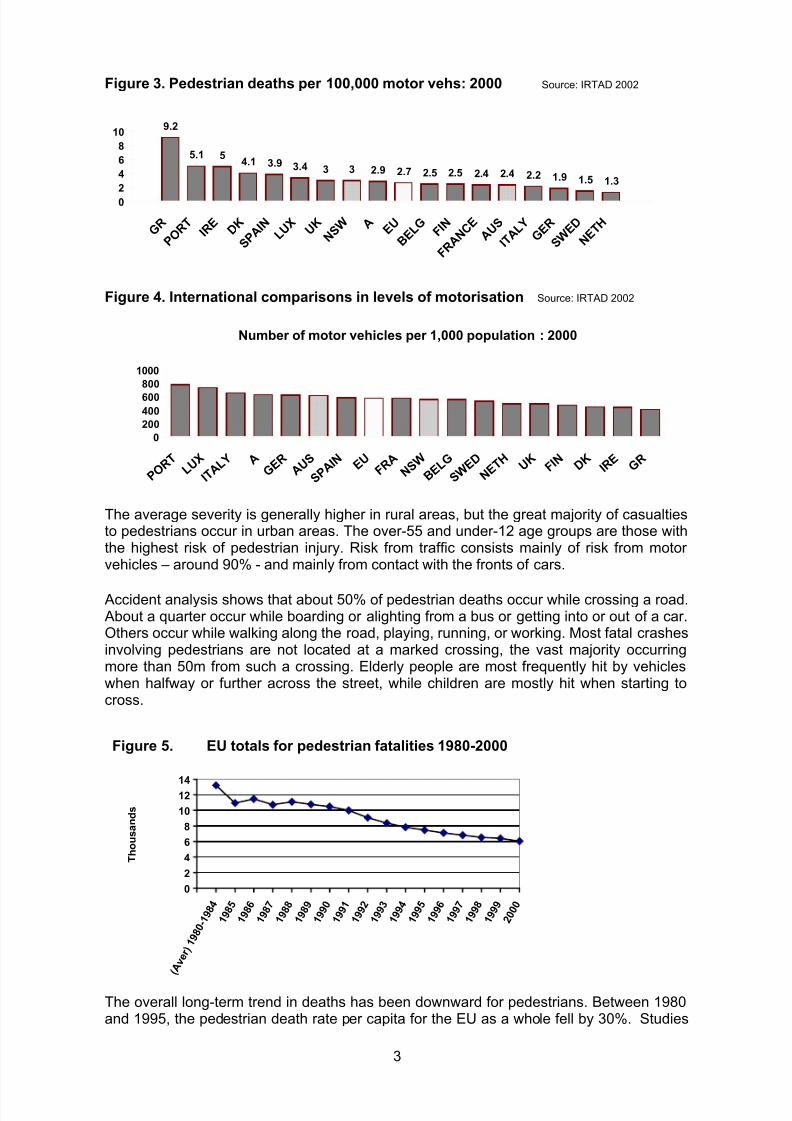
Figure 3. Pedestrian deaths per 100,000 motor vehs: 2000 Source: IRTAD 2002
9.2
5.1 54.1 3.9 3.4 3 3 2.9 2.7 2.5 2.5 2.4 2.4 2.2 1.9 1.5 1.3
0
2
4
6
8
10
G R P O
R T I R E D K
S P A I N
L U X U K
N S W A E U
B E L G F I
N
F R A N
C E A U S
I T A L Y
G E R
S W E D
N E T H
Figure 4. International comparisons in levels of motorisation Source: IRTAD 2002
The average severity is generally higher in rural areas, but the great majority of casualtiesto pedestrians occur in urban areas. The over-55 and under-12 age groups are those withthe highest risk of pedestrian injury. Risk from traffic consists mainly of risk from motorvehicles – around 90% - and mainly from contact with the fronts of cars.
Accident analysis shows that about 50% of pedestrian deaths occur while crossing a road. About a quarter occur while boarding or alighting from a bus or getting into or out of a car.Others occur while walking along the road, playing, running, or working. Most fatal crashesinvolving pedestrians are not located at a marked crossing, the vast majority occurringmore than 50m from such a crossing. Elderly people are most frequently hit by vehicleswhen halfway or further across the street, while children are mostly hit when starting tocross.
Figure 5. EU totals for pedestrian fatalities 1980-2000
0
2
4
6
8
10
1214
( A v e r ) 1 9 8 0
- 1 9 8 4
1 9 8 5
1 9 8 6
1 9 8 7
1 9 8 8
1 9 8 9
1 9 9 0
1 9 9 1
1 9 9 2
1 9 9 3
1 9 9 4
1 9 9 5
1 9 9 6
1 9 9 7
1 9 9 8
1 9 9 9
2 0 0 0
T h o u s a n d s
The overall long-term trend in deaths has been downward for pedestrians. Between 1980and 1995, the pedestrian death rate per capita for the EU as a whole fell by 30%. Studies
Number of motor vehicles per 1,000 population : 2000
0
200
400
600
800
1000
P O R T L U
X
I T A L Y A
G E R
A U S
S P A I N E U F R
A N S W
B E L G
S W E D
N E T H U K F I
N D K I R E G R

8/12/2019 European Priorities for Pedestrian Safety
http://slidepdf.com/reader/full/european-priorities-for-pedestrian-safety 4/19
4
indicate this may be due in some instances to a decline in walking (for example, amongstchildren) as more people take to their cars for local journeys.
However, several Member States are now experiencing annual increases in pedestriandeaths and encouragement is now being given in various countries to travel by foot,bicycle or public transport. For example, the Danish National Traffic Plan states that 4% oftotal car traffic should be converted into cycling and walking by the year 2005 and one-
third of all car traffic under 3 km into non-motorised travel. As travel by public transport isalso encouraged, increasing account needs to be taken of the safety of walking or cyclingto catch the bus, tram or train.
The ageing of the road user population experienced internationally (shown below) is alsolikely to influence future trends and increase the need for action. For both Australia andthe European Union (15), over one fifth of the population will be 65 years or above by2030. Despite the rising number of older driving licence holders in many countries,declining driving ability and financial constraints mean that many motorists will have, atsome stage, to give up their car. A larger percentage of the older population will bedependent on public transport which will involve pedestrian trips. The risk of death in EUtraffic for pedestrians aged 65 and older is currently four times higher than for youngadults.
Table 2. International comparisons: Percentage of population aged 65 or above
COUNTRY 2000 2010 2020 2030
AUSTRIA 15.4 17.8 20.1 25.2BELGIUM 16.8 17.9 21 25.4DENMARK 14.9 16.7 20.3 23FINLAND 14.5 17.1 22.6 25.8FRANCE 16 16.8 20.6 24GERMANY 16.2 19.7 21.4 25.8GREECE 17.3 19.5 21.8 25.4IRELAND 11.3 12.2 15.3 18.7ITALY 18.1 20.6 23.5 28.1LUXEMBOURG 14 14.5 16.4 19.8NETHERLANDS 13.6 15.3 19.7 23.9PORTUGAL 15.4 16.9 19.4 22.8SPAIN 16.9 18.4 21.2 26.4SWEDEN 17.3 19.2 22.7 25.1UNITED KINGDOM 15.7 16.7 19.6 23.5EU (15) AVERAGE 15.5 17.2 20.4 24.2
AUSTRALIA 12.4 13.9 17.6 21.1
USA 12.6 13.2 16.5 20JAPAN 17 21.8 26.8 28.3
Source: US Bureau of the Census, International Databases February 2001 in Transport and Ageing Society, ECMT 2001
4. The key problems for pedestrians in today’s traffic system
Most road safety problems for pedestrians are common to all European countries andbeyond. These result from a complex mix of factors. However, underlying all otherproblems is the fact that the modern traffic system is designed largely from a car-userperspective. Mass motorisation in much of Europe since the 1960s has created a traffic
system which caters mainly for motor vehicle users. Only since the 1980s has there beenunderstanding about the need for coherent planning of route networks for pedestrians and
8/12/2019 European Priorities for Pedestrian Safety
http://slidepdf.com/reader/full/european-priorities-for-pedestrian-safety 5/19
5
only since the 1990s has long term planning for sustainable transport policies got off theground (OECD, 2001).
The following problems emerge as being key issues for improving pedestrian safety andneed to be addressed in combination in future traffic system planning.
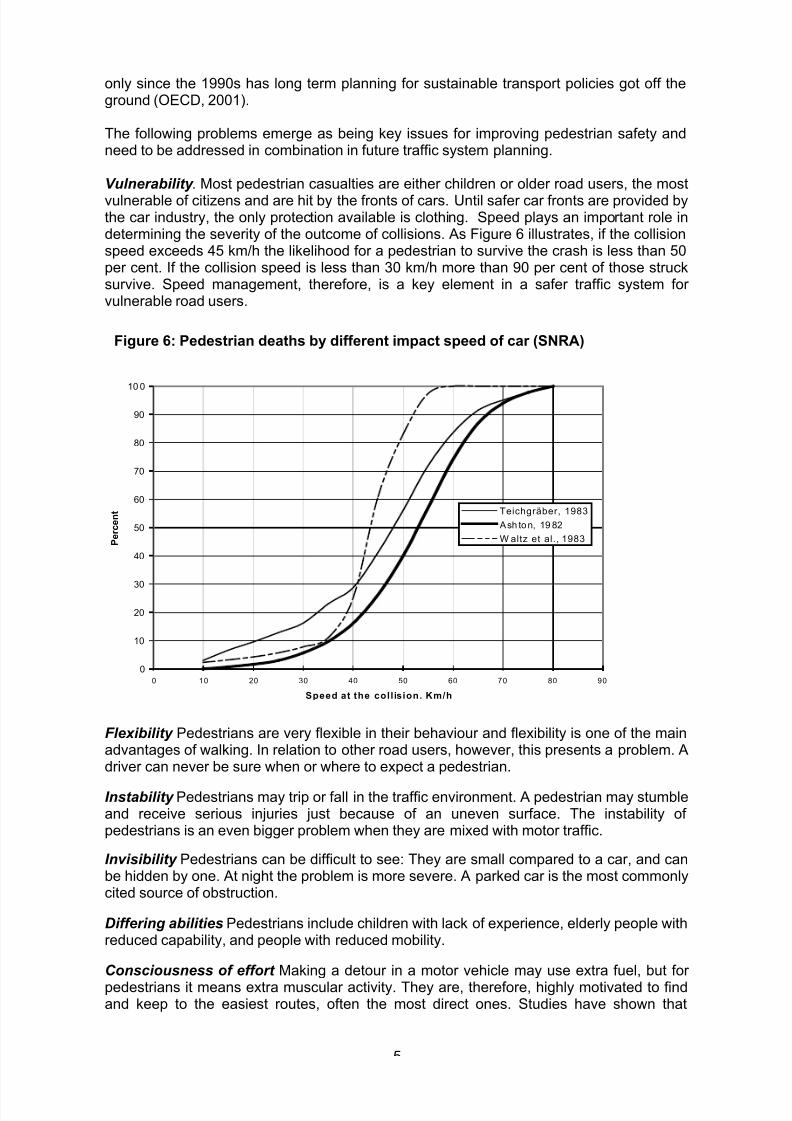
Vulnerability . Most pedestrian casualties are either children or older road users, the most
vulnerable of citizens and are hit by the fronts of cars. Until safer car fronts are provided bythe car industry, the only protection available is clothing. Speed plays an important role indetermining the severity of the outcome of collisions. As Figure 6 illustrates, if the collisionspeed exceeds 45 km/h the likelihood for a pedestrian to survive the crash is less than 50per cent. If the collision speed is less than 30 km/h more than 90 per cent of those strucksurvive. Speed management, therefore, is a key element in a safer traffic system forvulnerable road users.
Flexibility Pedestrians are very flexible in their behaviour and flexibility is one of the mainadvantages of walking. In relation to other road users, however, this presents a problem. Adriver can never be sure when or where to expect a pedestrian.
Instability Pedestrians may trip or fall in the traffic environment. A pedestrian may stumbleand receive serious injuries just because of an uneven surface. The instability ofpedestrians is an even bigger problem when they are mixed with motor traffic.
Invisibility Pedestrians can be difficult to see: They are small compared to a car, and canbe hidden by one. At night the problem is more severe. A parked car is the most commonlycited source of obstruction.
Differing abilities Pedestrians include children with lack of experience, elderly people withreduced capability, and people with reduced mobility.
Consciousness of effort Making a detour in a motor vehicle may use extra fuel, but forpedestrians it means extra muscular activity. They are, therefore, highly motivated to findand keep to the easiest routes, often the most direct ones. Studies have shown that
0
10
20
30
40
50
60
70
80
90
10 0
0 10 20 30 40 50 60 70 80 90
Speed at the collision. Km/h
P e r c e n t Teichgräber, 1983
Ash ton, 19 82
W altz et al., 1983
Figure 6: Pedestrian deaths by different impact speed of car (SNRA)
8/12/2019 European Priorities for Pedestrian Safety
http://slidepdf.com/reader/full/european-priorities-for-pedestrian-safety 6/19
6
pedestrians place a higher value on their time than drivers or those on board publictransport vehicles.
Impairment due to alcohol and drugs 35% of adult pedestrians (over the age of 16)killed in a crash and tested for alcohol were found to have blood alcohol levels above thelegal limit for driving. This rate was higher than that of drivers involved in fatal crashes(Fontaine et al., 1997).
‘Estrangement’ Pedestrians are usually doing things other than thinking about walking asthe priority task, like window-shopping or chatting with friends. This, together with the factthat the modern traffic environment is often designed for cars rather than for pedestrians,creates a state of estrangement. Providing pedestrian facility is typically an afterthoughtrather being considered as an integral part in the planning and design of the traffic system.Even the majority of European car drivers believe that much consideration should be paidto walking and cycling when planning for the future according to SARTRE, a survey of cardrivers conducted in 19 European countries in 1997.
5. Recognising physical limitations and needs of pedestrians in safety strategies
In the development of EU and national targeted programmes, and most explicitly in thoseembodying the sustainable safety or Vision Zero concepts, it is recognised increasinglythat preventing road death and disabling injury entails a traffic system that is betteradapted to the needs, errors and physical vulnerabilities of its users rather than one whichexpects users to cope with increasingly demanding conditions. While challenging todeliver, this approach is founded in pragmatism and ergonomics. Its innovation lies inrecognising that road death and severe public health loss is a feature of poor design; that itcan and should be avoided by putting to greater effect and implementing more widely intargeted programmes, key safety principles and measures which have been known aboutfor many years.
The European Commission has accepted that such an approach is necessary to meet thehighly ambitious target which has just been set to reduce deaths by 50% by the year 2010across the EU (CEC, 2001a). In their consultation on a new EU road safety programme2002-2010, which is expected shortly, the Commission has already concluded that a betterbalance is needed between the safety of vulnerable road users and the mobility of motorvehicle users especially in urban and residential areas (CEC, 2001b).
In the next sections, the strategies and measures which European experts believe are keyto the delivery are set out and observations made on the efforts at EU, national or locallevel. The focus is on evidence-based strategies and measures aimed at the provision ofsafer environments through planning, infrastructure provision and vehicle design.
6. Key strategies and measures for improving pedestrian safety
There are many ways in which transport policy in general and road safety policy inparticular can contribute to reducing crash injury risk from traffic for those travelling on foot.
ETSC has identified the key strategies for pedestrian safety as follows:
Land use planning which minimises exposure to risk in the course of pedestrian journeys
Creating safer, attractive, connected pedestrian routes within urban safety
management framework Managing traffic mix, by separating different kinds of road use to eliminate conflicts,
where conditions are favourable to separation.

8/12/2019 European Priorities for Pedestrian Safety
http://slidepdf.com/reader/full/european-priorities-for-pedestrian-safety 7/19
7
Creating safer conditions elsewhere for integrated use of road space, e.g. througharea-wide speed and traffic management, increased pedestrian and vehicleconspicuity, and vehicle engineering and technology.
Mitigating the consequences of crashes through car crash protective design.
Modifying the attitudes and behaviour of drivers of motor vehicles through information,training and the enforcement of traffic law.
Consulting and informing pedestrians about changes being made for their benefit, andencouraging them in steps that they can take to reduce their risk.
6.1. Land use planning to minimise risk exposure in the course of pedestrian journeys
Land use planning can make a useful contribution to minimising pedestrian exposure torisk of accident and injury. In planning the evolution of land-use, priority can be given tolocating the most likely destinations for walking and cycling - homes, schools, workplaces,shops, social and recreational facilities, and public transport stops - where they can be
more readily served by safe, attractive and convenient routes for walking and cycling. As sites and buildings are adapted, redeveloped or developed for the first time,opportunities can be taken to achieve layouts which separate access by motor vehiclesfrom that on foot, and adapt the latter to the existing local network of pedestrian routes,including routes from public transport stops.
6.2. Creating a hierarchy of safe, attractive integrated pedestrian routes
Classifying the urban road network according to road function, setting appropriate speedlimits according to that road function and improving road layout and design to encourage
better use is now recognised, amongst EU Member States active in road safety, asfundamental to urban safety management.
The Netherlands, in particular, has made considerable progress in establishing roadhierarchies and the UK and the Nordic countries have stated their intention to do this toprovide a better framework for area-wide risk reduction in their national road safetystrategies. The development of EU best practice guidelines on urban safety management,amongst other themes, is foreseen in the new EU road safety programme, which isexpected to be announced this summer.
In the context of encouragement for walking, urban safety management needs to give highpriority first to identifying the pattern of journeys that people want to make on foot and then
to creating safe, attractive and connected routes for this pattern of journeys. These routesshould be designated in conjunction with the functions of each road for all kinds of roaduser, and in particular so that motor traffic uses each road in ways that are consistent withthe safety and convenience of pedestrians.
Routes will typically consist of a mixture of sections of footpath separate from anycarriageway, wholly pedestrian areas with or without admission of cyclists, footwaysalongside carriageways, and carriageways or other surfaces shared with motor vehicles.Where routes cross appreciable flows of motor vehicles, careful attention will be given tothe location and design of the crossing point. Where the routes are not separated fromcarriageways, and even more so where surfaces are shared with motor vehicles, thelayout will be such that the speeds of the latter are moderated.
Concentration of motor traffic onto main roads should enable the more local roads to beadapted to enable them to perform their functions in respect of motor vehicles consistently
8/12/2019 European Priorities for Pedestrian Safety
http://slidepdf.com/reader/full/european-priorities-for-pedestrian-safety 8/19
8
with their forming parts of safe and attractive routes for pedestrians and cyclists. The morethese roads are used for walking and cycling, the more aware drivers will become of thelikelihood of encountering pedestrians and cyclists, and thus the lower the risk that motorvehicles will pose to them. On public transport routes, whether bus or light rail routes onmain or more local roads, or bus or rail services on segregated tracks, stopping placesshould be served by the network of routes for walking and cycling.
A fresh look at road hierarchies in relation to pedestrian safety has been undertakenrecently by researchers coming together in the EU PROMISING project. It was based onthe requirements of coherence of the network, directness, safety, comfort andattractiveness on the one hand and on the new concepts for road safety in the Dutchsustainable traffic system and the Swedish Zero Vision on the other hand. The hierarchywas developed only for built-up areas and is set out in Table 2.
Table 3. Hierarchy of roads proposed in PROMISING
through-traffic route with a speed limit of 70km/h and only grade-separated crossings; main street or urban arterial road with speed limit of 50km/h and, in some areas 30km/h; residential street with a speed limit of 30 km/h;
walking-speed street; car-free areas for pedestrians and cyclists.
With reference to this hierarchy, it is worth noting that the long debate about whether thegeneral speed limit to be favoured across Europe should be 50km/h or 60 km/h has beenlargely resolved in favour of 50km/h, with increasing use of 30km/h off main roads. ETSC’scomment on grade-separate crossings can be found in a later section.
6.3. Separating different kinds of road use
Separation can take the form of pedestrian areas, footways alongside carriageways,
sections of footpath separate from the carriageway and grade-separated crossings.Pedestrians need designated physical space with adequate pavement width such thatpedestrians need not walk on the carriageway and for those using wheelchairs.
6.3.1. Pedestrian areas
Pedestrian areas may be designed as such or be conversions from streets used byvehicles. Their value in improving safety has been demonstrated widely, especially forshopping streets (e.g. DUMAS). Pedestrian areas may be exclusively for pedestrian use,for pedestrians and cyclists or for pedestrians and cyclists along with some permittedvehicles at certain times of the day. The facility for vehicles to use converted areas outsidetimes of closure will often remain for reasons of access and servicing, but the surface andlayout of the street are designed for pedestrians, with a clear indication of the paths to befollowed by vehicles when they have access.
While streets dominated by heavy flows of traffic tend to be threatening to pedestrians,traffic-free areas, such as shopping precincts, with too little activity, can also promoteanxiety. Whilst the fear of personal crime may be out of proportion to its reality, this needsto be considered in the layout and design of areas used by pedestrians, if they are to beused.
By physically restricting access for vehicles, pedestrian zones create an environment
where travel on foot and by cycle is safer. Opinion on admission of cyclists to these areasmay be divided, but there is a need to avoid pedestrian areas resulting in unsafe orinconvenient conditions for cyclists, for example by forcing them to use busy distributorroads. In Mechelin cycling is permitted in pedestrian streets in order to avoid detours for

8/12/2019 European Priorities for Pedestrian Safety
http://slidepdf.com/reader/full/european-priorities-for-pedestrian-safety 9/19
9
cyclists and evaluation had shown that this, so far, has proved to be safe (Dykstra et al,1998). Research in the UK indicated that conflicts between cyclists and pedestrians inpedestrian areas were less of a problem than appeared (Trevelyan and Morgan, 1993).Segregating cyclists and pedestrians in pedestrian areas will not always be possible.Where it is desirable, cycle movements can be combined with those of selected vehicles,such as buses and service vehicles, permitted at particular times of day or channelled bydefined paths.
6.3.2. Grade–separated crossings
Pedestrians and cyclists are particularly at risk when crossing heavily trafficked roads andare generally safer when separated from traffic. However, the benefits of grade-separatedcrossings, which can be expensive in relative terms, are not always realised. To besuccessful, grade-separation, either by footbridges or subways, should be without steps ortroublesome ramps and keep vulnerable road users on their natural desire-line whilstmotor vehicles undergo the changes in grade and level. The main use is for crossing roadswith speed limits of 60km/h or higher or heavily trafficked roads. Subways should bebrightly lit, regularly cleaned, have good through visibility and be consistently overlooked(IHT, 1997).
6.4. Creating safer conditions in shared road space:
Where separation can be achieved in ways which provide convenient and attractive routesfor all road users, it very largely removes risk from traffic in the areas of separation - butthis advantage may be offset by increased risk where road users re-enter shared space.Integration of different kinds of road use by sharing of space often has the advantages ofrequiring less adaptation of the roads and paths and enabling more direct routes to beprovided.
Taken together, the means of reducing risk require action to create safer conditions forintegrated use of shared road space through:
(a) managing speed and traffic through improving junction design and layout,implementing area-wide treatments and speed zones and developing intelligentspeed adaptation and
(b) improving vehicle and user conspicuity.
6.4.1. Area-wide speed and traffic management
Road safety engineering measures to create safer conditions for pedestrians can beconsidered in terms of traffic reduction, speed reduction, junction treatments, theredistribution of road space and the creation of special facilities.
Traffic reduction The selective closure or partial closure of minor streets can offer lightlytrafficked routes for cyclists and a safer pedestrian environment as part of an area-wideapproach to avoid displaced traffic leading to more crashes elsewhere. Even at lowspeeds, mixing with heavy traffic, especially lorries, is hazardous. The diversion of throughand unnecessary traffic from some areas will reduce potential conflict but will requireappropriate advance signing and, possibly, some road construction.
Speed reduction and traffic calming measures
Speed of motor vehicles is critical to the safety of vulnerable road users. At low speedsdrivers have more time to react to the unexpected and avoid collisions. At speeds of below30 km/h pedestrians can mix with motor vehicles in relative safety.

8/12/2019 European Priorities for Pedestrian Safety
http://slidepdf.com/reader/full/european-priorities-for-pedestrian-safety 10/19
10
The development of speed management and traffic calming to deal with inappropriatespeed in urban areas in Europe has been documented by Kjemtrup and Herrstedt (1992).These techniques comprise traffic management measures ranging from discouragingtraffic from entering certain areas to installing physical speed reducing measures includingroundabouts, road narrowings, chicanes and road humps (Webster, 1993). Suchmeasures are often backed up by speed limits of 30 km/h, but they can be designed to
achieve various levels of appropriate speed (DRD, 1989, 1991, 1993).
Traffic calming reduces the speed of motor vehicles by various physical modifications:vertical and horizontal deflections, changes in surface colour and texture, a reduction inoverall carriageway area, and signs and other symbols to convey to drivers that they needto have greater awareness of vulnerable road users. Gateways may indicate entries intotraffic-calmed areas. Traffic calming measures, based upon various national guidelines,are now common throughout the EU and are often introduced as part of area-wide urbansafety management Recent experience in the Netherlands has shown positive effects oftraffic calming measures not only implemented in traffic calming areas, but also onsurrounding traffic arteries. Speeds have also been reduced on 'distributor roads' byconstructing traffic calming facilities which include use of roundabouts.
Experience in several EU Member States over the last twenty years has shown thataccident reductions of between 15 and 80 per cent can be achieved by comprehensivearea-wide treatments (Brilon and Blanke, 1993; Herrstedt et al, 1993; IHT, 1990a; CERTU,1994). The results indicate that application of such speed management measures in urbanareas throughout the EU might reduce the total number of injury accidents by 5%.
Speed limits In urban areas, speed limits should reinforce an easily understood roadhierarchy. Speed limit zones of 30 km/h are most appropriate where an urban safetymanagement strategy has been adopted. Self-enforcing measures in the zones are usuallynecessary to reduce speeds.
Table 4. Serious accident risk by urban road type (per mill mot veh km, the Netherlands)
Speed limit Riskkm/h
Woonerf and residential roads 30 0.20Residential roads 50 0.75Urban arteries 50/70 1.33
SWOV, 1997
As the Table above illustrates, the more urban roads which can more appropriately begiven a ‘residential’ function with the maximum speed limit of 30 km/h the better.
In the Netherlands, re-classification of the road network is well underway to distinguishbetween areas where priority can be given to residential, recreational and agriculturalfunctions, which comprise 65-90 per cent of total road length in the network, and trafficarteries which give priority to traffic flow. It has been established that two-thirds of theDutch road network within built-up areas can be converted into 30km/h zones. Central andlocal government have signed an agreement to convert 50% of these streets into 30km/hzones by the year 2002. To date, the number of kilometres of 30km/h-streets has beenincreased to 19,000 km with 9 people killed a year on these streets.
Monitoring of this rapid expansion In the Netherlands over the last few years has shownvery large reductions in casualties, particularly in fatalities - perhaps 17% of fatalities inurban areas had been saved through this policy by 2000. With more direct conversion

8/12/2019 European Priorities for Pedestrian Safety
http://slidepdf.com/reader/full/european-priorities-for-pedestrian-safety 11/19
8/12/2019 European Priorities for Pedestrian Safety
http://slidepdf.com/reader/full/european-priorities-for-pedestrian-safety 12/19
12
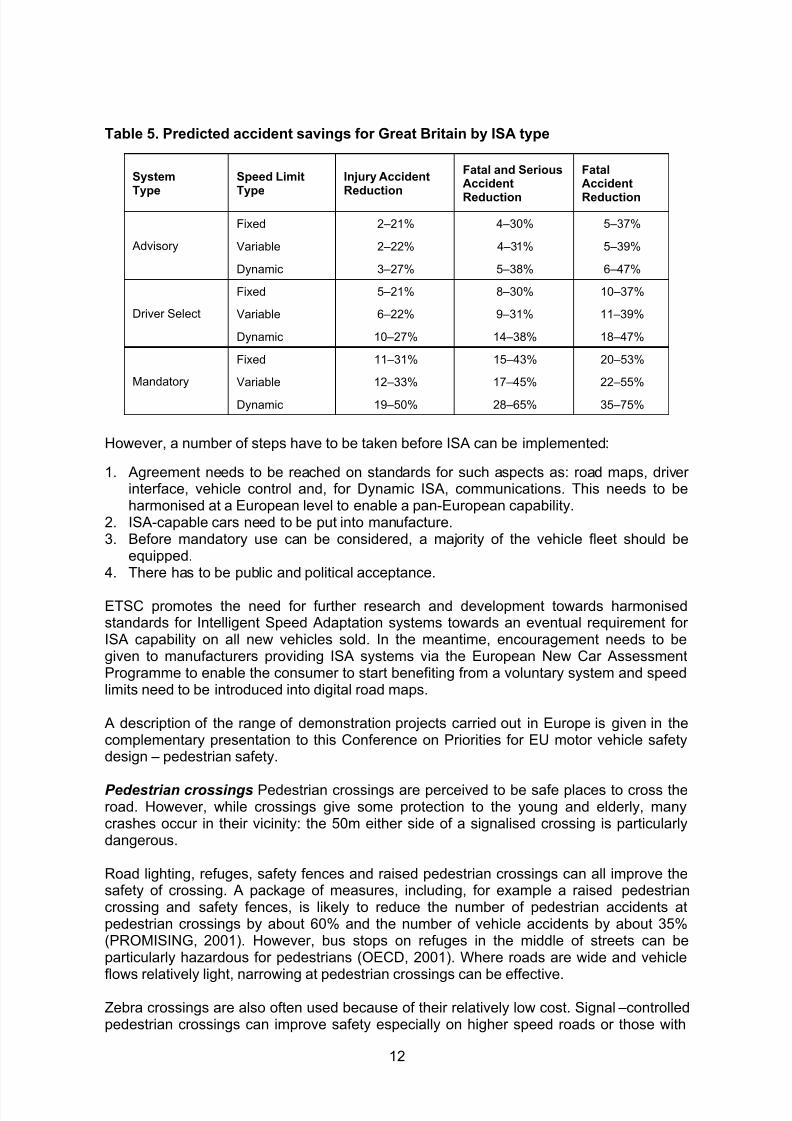
Table 5. Predicted accident savings for Great Britain by ISA type
System
Type
Speed Limit
Type
Injury Accident
Reduction
Fatal and SeriousAccident
Reduction
FatalAccident
Reduction
Fixed 2–21% 4–30% 5–37%
Variable 2–22% 4–31% 5–39% Advisory
Dynamic 3–27% 5–38% 6–47%
Fixed 5–21% 8–30% 10–37%
Variable 6–22% 9–31% 11–39%Driver Select
Dynamic 10–27% 14–38% 18–47%
Fixed 11–31% 15–43% 20–53%
Variable 12–33% 17–45% 22–55%Mandatory
Dynamic 19–50% 28–65% 35–75%
However, a number of steps have to be taken before ISA can be implemented:
1. Agreement needs to be reached on standards for such aspects as: road maps, driverinterface, vehicle control and, for Dynamic ISA, communications. This needs to beharmonised at a European level to enable a pan-European capability.
2. ISA-capable cars need to be put into manufacture.3. Before mandatory use can be considered, a majority of the vehicle fleet should be
equipped.4. There has to be public and political acceptance.
ETSC promotes the need for further research and development towards harmonisedstandards for Intelligent Speed Adaptation systems towards an eventual requirement forISA capability on all new vehicles sold. In the meantime, encouragement needs to begiven to manufacturers providing ISA systems via the European New Car AssessmentProgramme to enable the consumer to start benefiting from a voluntary system and speedlimits need to be introduced into digital road maps.
A description of the range of demonstration projects carried out in Europe is given in thecomplementary presentation to this Conference on Priorities for EU motor vehicle safetydesign – pedestrian safety.
Pedestrian crossings Pedestrian crossings are perceived to be safe places to cross theroad. However, while crossings give some protection to the young and elderly, manycrashes occur in their vicinity: the 50m either side of a signalised crossing is particularlydangerous.
Road lighting, refuges, safety fences and raised pedestrian crossings can all improve thesafety of crossing. A package of measures, including, for example a raised pedestriancrossing and safety fences, is likely to reduce the number of pedestrian accidents atpedestrian crossings by about 60% and the number of vehicle accidents by about 35%(PROMISING, 2001). However, bus stops on refuges in the middle of streets can beparticularly hazardous for pedestrians (OECD, 2001). Where roads are wide and vehicleflows relatively light, narrowing at pedestrian crossings can be effective.
Zebra crossings are also often used because of their relatively low cost. Signal –controlledpedestrian crossings can improve safety especially on higher speed roads or those with

8/12/2019 European Priorities for Pedestrian Safety
http://slidepdf.com/reader/full/european-priorities-for-pedestrian-safety 13/19
13
high traffic levels (Jensen, 1998). School crossing patrols provide a managed means ofsafer crossing for children as a particularly vulnerable group.
Increasingly, where signal-controlled crossings are being upgraded, closer attention isbeing given in identifying the pedestrian crossing phase to pedestrian ‘value of time’assessments which tend to be higher than those of motor vehicle users.
Guard rails A continuous safety fence on the edge of the footway can improve safety atconflict points but should be installed only where there are risks of crashes frompedestrians walking onto the road. Guardrails restrict people’s freedom and are resentedunless there is no practical alternative. Drivers must be able to see pedestrians waiting tocross at the end of a length of guardrail.
Shared use of footways Cycling on the footway is common. Indeed in some countries,such as Belgium and the Netherlands, small children are allowed to cycle there. However itis of much concern to many pedestrians, particularly the elderly and people who arevisually impaired. In specific instances where no on-carriageway solution can be found,and where visibility is good, it may be appropriate to convert the footway to shared use.Widening of the footway clear signs and markings will help to make shared use moreacceptable. Segregation by white line only may be expedient but segregation by kerb orlevel is preferred by the visually handicapped.
Facilities for people with reduced mobility A significant proportion of people have somedegree of reduced mobility and all of us are sometimes ill, impaired or encumbered. Theresulting needs must be understood before facilities, especially pedestrian crossings, aredesigned or redesigned. Blind or partially-sighted people can usually follow kerb lines orthe facades of buildings, but they can have problems in finding their way in pedestrianareas (IHT, 1991). Different surface textures or directional guidance paving can help them.Street furniture can be a hazard and should not be placed on the natural routes taken byblind or partially-sighted people. Changes in level should avoid the exclusive use of steps.
If steps are unavoidable, the top and bottom of flights of steps should have warningsurfaces. Dropped kerbs at pedestrian crossings assist those with physical impairmentswhile tactile surfaces help those with visual impairments.
Parking regulations Parked cars are a traffic hazard for pedestrians, particularly children.Research has shown that prohibiting on-street parking improves safety. The number ofaccidents is reduced by about 25% in streets where on-street parking is prohibited.
6.4.2. Improving vehicle and user conspicuity
About 30% of struck pedestrians fail to see the car before the collision. The more
conspicuous motor vehicles are to road users outside them, and the latter are to drivers,the more opportunity both will have to avoid collisions. Road layout can help in this and socan the use of daytime running lights by drivers, the use of lights at night by cyclists, andthe wearing of reflective or light-coloured clothing by pedestrians and cyclists (ETSC,1999a).
6.5. Mitigating the consequences of crashes
Since the majority of severe pedestrian collisions are with cars, major improvements incrash protection for pedestrians can be achieved in the short term and with great efficiencyby changing car design.
Developing technical tests suitable for use in legislation to require protection for vulnerableroad users in frontal impacts with cars has been the focus of a 22-year EU-funded

8/12/2019 European Priorities for Pedestrian Safety
http://slidepdf.com/reader/full/european-priorities-for-pedestrian-safety 14/19
14
research and development programme. Funded by the EU and Member States, theprogramme involving national transport laboratories, government departments andindustry, was brought together by the European Enhanced Vehicle-safety Committee(EEVC).
The pedestrian tests, proposed by EEVC originally in 1991 with an updated report to theCommission in 1994 (EEVC 1994) and in 1998 (EEVC 1998), are an integrated package of
four tests representing impacts to the parts of the body which most frequently sustainsevere injuries in car to pedestrian impacts. Sub-system tests were used because theyhave many advantages over pedestrian dummies for tests intended for legislative use.
The state of the art EEVC tests comprise:
1. Legform to bumper test to prevent serious knee joint injuries and leg fractures2. Upper legform to bonnet leading edge test to prevent femur and hip fractures and
injuries
3. Child headform to bonnet top test to prevent life-threatening head injuries4. Adult headform to bonnet top test to prevent life-threatening head injuries
On the basis of national and European studies carried out under the EU programme, it hasbeen estimated that around 2,000 lives and 17,000 serious injuries to pedestrians andcyclists could be prevented annually if all cars on EU roads today met these tests. Anupdated benefit analysis on pedestrian savings is expected to be published shortly by theUK TRL.
EEVC-based pedestrian tests have been used since 1996 by the European New Car Assessment Programme (EuroNCAP) which provides information to consumers on thecrash performance of new cars and which receives substantial Commission funding. Nocar tested has yet performed well enough to have passed the EEVC tests proposed forlegislation. Results to date indicate that only 3 EuroNCAP tested cars have received 3 outof a possible 4 star rating, 65 have obtained two stars and 14 have obtained one star(Official Report, 2001).
However, just as the European Commission was expected to come forward withlegislation, with a Directive promised in the last two road safety action programmes (, witha draft proposal for regulation translated into all the Community languages (6065/2000)and following pressure from the European Parliament and Council of Ministers for alegislative proposal, the European car industry came forward with an alternative proposalfor a voluntary agreement. The European Commission is currently consulting the
European Council of Ministers and the European Parliament as to whether to accept it orto propose a Directive (CEC,2001c).
This proposal comprised two phases of pedestrian protection tests (the second phase
TRL 27714
Legform
to bumper
Legform
to bonnet
leading edge
Child Headformto bonnet
Adult Headform
to bonnet
The 4 EEVC Tests – Scientifically based

8/12/2019 European Priorities for Pedestrian Safety
http://slidepdf.com/reader/full/european-priorities-for-pedestrian-safety 15/19
15
being subject to review in 2004 before being confirmed) and several other measuresassessed by safety experts to be either peripheral to pedestrian safety or needingseparate treatment by Directive (anti-lock braking, daytime running lights). The detail ispresented in the complementary paper being presented at this Conference.
The Phase 1 tests – the only certain pedestrian sub-system tests in the agreement - havebeen roundly criticised by experts as non-scientific (Janssen 2001, Hobbs 2001, Lawrence2001). The Phase 2 tests mention the possibility of adopting EEVC by 2010 but ‘equivalentmeasures’ are allowed and, as previously noted, the second Phase would be subject to areview in 2004.
The safety content of this agreement has received close scrutiny from experts in theleading research organisations involved in European pedestrian work and have beenrejected by European non-governmental safety and consumer organisations for severalreasons.
•
The agreement would not implement with certainty the scientifically developed cost-effective EEVC tests.
• The industry’s own Phase 1 tests were fewer in number and weaker than EEVC andoffered a 75% lower level of protection against fatal injury according to the UK TRL(Official Report of the House of Commons, 12.11.2001). Independent experts involvedin pedestrian protection research told the Commission Hearing on PedestrianProtection on 6th February 2001 and a subsequent UK Parliamentary briefing that, inaddition to providing substantially lower levels of protection than the EEVC tests, thePhase 1 tests were not scientific; the tests were not a natural first step towards EEVC,could drive car design in the wrong way for effective protection as well as producingserious side-effects (Janssen 2001, Hobbs 2001, Lawrence 2001).
• The Phase 1 lower leg bumper test would lead to a situation where many of thosesaved from lower leg fractures would instead suffer serious knee joint injuries, whichare more important because these have a greater risk of permanent disability andconsequently are of higher societal cost.
• The Phase 1 head impact test used a headform which represents an older child thanselected by EEVC and did not represent the adult head, thus providing inappropriateprotection for the adult head and leaving one third of the bonnet area unprotected.
• The introduction of a lower leg test which is not accompanied by a bonnet leading edgetest requirement in Phase 1 would be likely to increase femur and pelvic fractures.
• The absence of the bonnet leading edge tests would not protect against fatal childhead injuries nor femur and pelvic injury.
• The agreement failed to implement best practice achieved already on the road today.The Honda Civic offers now 80% of EEVC (without using new technology) at an
TRL 27714
Weaker
lower
legform
to bumper
Weaker
“average”
headform to
bonnet
Phase 1 voluntary agreement tests:
2 non scientific tests – weaker leg test and head test

8/12/2019 European Priorities for Pedestrian Safety
http://slidepdf.com/reader/full/european-priorities-for-pedestrian-safety 16/19
16
additional cost, according to the TRL of only £6.50 (10 Euro) – that is 3 times the levelof the Phase 1 protection which the industry offered to implement fully in 11 years time.
• If any small initial saving occurred as a result of the agreement, this would beoutweighed in a very short time by the large safety gains of a Directive implementingEEVC.
The opinion of the lead Committee in the European Parliament (four Committees haveconsidered the issue) has indicated support for the take up of EEVC or equivalent testmethods (which do not exist) by the year 2010 in a Framework Directive. A final opinion isexpected in June and the Commission has indicated that that Parliament’s opinion will bemost important in contributing to their final decision.
ETSC continues to campaign for legislation which implements EEVC with certainty and forcar industry focus on meeting the state of the art EEVC pedestrian tests as soon aspossible. ETSC is also urging the European New Car Assessment Programme to combinethe star ratings from car occupant and pedestrian tests to give consumers a quickreference guide to the overall crash test performance of new cars. EuroNCAP has
recently taken the decision to continue with EEVC rather than include the voluntaryagreement Phase One testing in its programme.
6.6. Modifying drivers’ attitudes and behaviour
The attitudes and behaviour of motor vehicle users towards pedestrians are veryimportant. Training provided by driving instructors, the advice and information that driversreceive from user and safety organisations, and the influence exerted upon them byenforcement should all be reoriented to promote attitudes and behaviour based on higherpriority for the safety of pedestrians on the roads the drivers use. Emphasis should beplaced both upon greater consideration and upon greater compliance with traffic laws
concerning speed and giving way, whose effect on the safety of pedestrians is strongest.
6.7. Consulting and influencing pedestrians
Achievement of safe routes for walking and cycling which are also attractive to theirintended users will be helped by consultation with pedestrians, cyclists and prospectivecyclists in the catchment areas of the routes, as well as research into the journeys theywish to make on foot or bicycle.
Even on the best practicable routes, safer walking calls for competence on the part of thepedestrians. Information, education and training should therefore be provided forpedestrians of all ages from the nursery and kindergarten through the school years toyoung adulthood, and later as parents and as middle-aged and elderly people adjusting tothe changes in capability that come with advancing years.
7. Implementation strategies
Action on pedestrian safety can be taken at international, national and local levels.Improvements need to be considered within the framework of national and local targetedroad safety programmes and as part of a comprehensive pedestrian safety policy.Effective implementation of measures for safer walking requires dedicated and technically
informed effort by all of the many professionals involved, together with commitment bypolicymakers and the support of a convinced public.

8/12/2019 European Priorities for Pedestrian Safety
http://slidepdf.com/reader/full/european-priorities-for-pedestrian-safety 17/19
17
This requires systematic dissemination of research-based interdisciplinary technicalguidance that synthesises current best practice to town planners, architects, highway andtraffic engineers, road safety professionals, the police and judiciary, driving instructors,teachers, those who work with parents and elderly people, and designers of vehicles andprotective equipment. It also requires technically supported guidance in policy formulationto be communicated to policymakers, who in turn should be encouraged to join with roadsafety organisations and road user groups in campaigns to inform the public and win their
acceptance of the necessary policies and measures.
The report on pedestrians (PROMISING, 2001a) described an implementation strategy asconsisting of the following steps:
Identification and understanding of pedestrian safety problems: This may take place atvarious levels, for example concerning a whole country or a specific part of a town.
Selection of relevant safety actions and measures: Definition of implementation conditions: These arise from case-specific analyses. Three-step implementation process: It consists of strategy, preparation and execution. Pedestrian safety improvement and feedback: The result of the implementation is fed
back to the overall understanding of pedestrian safety problems
8. Conclusions – a change in thinking
A better balance between the mobility and safety of all road users is necessary to allowthem to participate fully in society. Walking needs to be recognised as a mode of transportin its own right if people are to be encouraged to travel on foot or by public transport ratherthan by car in order to reduce environmental damage, improve public health, and enhancethe quality of life in towns and cities.
Given that the focus of planning and infrastructure provision for at least the last thirty yearshas been to consider the mobility of vehicle users as the main priority, this is clearly going
to take some time.
However, this does not mean that very positive results cannot be achieved in the shortterm, whether in infrastructure of vehicle engineering as, indeed the examples set out inthis paper demonstrate.
9. Acknowledgement
This paper is based principally on the review activity of the following experts from acrossthe EU who comprise the following ETSC Working Parties:
Safety of Pedestrians and Cyclists Road Vehicle Safetyin Urban Areas Prof Adrian HOBBS (Chairman) (UK)Dr Rudolf Gunther (Chairman) (D) Mr Dominique CESARI (F)Professor Richard Allsop (Editor) (UK) Mr Edgar JANSSEN (NL)Dr Lars Ekman (S) Mr Anders KULLGREN (S)Mr Dominque Fleury (F) Prof Klaus LANGWIEDER (D)Dr Lene Herrstedt (DK) Mr Dietmar OTTE (D)Dr Christa Michalik (A) Prof. Fernando PINA DA SILVA (P)Ir Edgar Janssen (NL) Mr Pete THOMAS (UK)Mr Derek Palmer (UK) Mr Thomas TURBELL (S)Mr Antiono Lemonde de Maecdo (P) Dr Oliver CARSTEN
(ETSC Road User Behaviour and TelematicsWorking Parties) (UK)
I am particularly grateful to Professor Richard Allsop, Chairman of the ETSC RoadInfrastructure Working Party for his help with updating the road safety engineering aspects.

8/12/2019 European Priorities for Pedestrian Safety
http://slidepdf.com/reader/full/european-priorities-for-pedestrian-safety 18/19

8/12/2019 European Priorities for Pedestrian Safety
http://slidepdf.com/reader/full/european-priorities-for-pedestrian-safety 19/19


