European Innovation Scoreboard (EIS): Evolution … Innovation Indicators for Latin America Workshop...
32
1 Innovation Indicators for Latin America Workshop OECD, 19 March 2009 European Innovation Scoreboard (EIS): Evolution and Lessons Learnt Hugo Hollanders (Maastricht Economic and social Research and training centre on Innovation and Technology)
Transcript of European Innovation Scoreboard (EIS): Evolution … Innovation Indicators for Latin America Workshop...
1
Innovation Indicators for Latin America Workshop OECD, 19 March 2009
European Innovation Scoreboard (EIS):Evolution and Lessons Learnt
Hugo Hollanders
(Maastricht Economic and social Research and training centre on Innovation and Technology)
2
European Innovation Scoreboard
The European Innovation Scoreboard (EIS)
Was introduced as part of the Lisbon strategy
Measures, on a yearly basis, the innovation performance of Member States, drawing on statistics from a variety of sources (a.o. the Community Innovation Survey)
3
History of the European Innovation Scoreboard
• 2000-2003: MERIT, SPRUPilot launched in 2000, Full versions in 2001, 2002, 2003Thematic papers (15+) on Biotechnology, Life-long Learning, National Innovation Systems, …
• 2004-2007: MERIT (+JRC)Full versions in 2004, 2005, 2006, 2007Thematic papers (20+) on Services Innovation, Innovation Efficiency, Non-R&D Innovation, Global Innovation Scoreboard, …
• 2008-2010: MERIT, SPRU, CNR (+JRC)Revised EIS in 2008Thematic papers on Design and Creativity, Global Innovation Scoreboard, …
4
EIS: Benchmarking innovation performance
• We use data for a wide range of innovation (related) indicators
• Average innovation performance is summarized using a composite indicator: the “Summary Innovation Index” (SII)
• Choice of indicators and methodology for calculating the SII have changed over time:– More indicators, new indicators– Increased use of Community Innovation Survey– More countries (37 in 2007)– Use of composite indicators from 2003 onwards
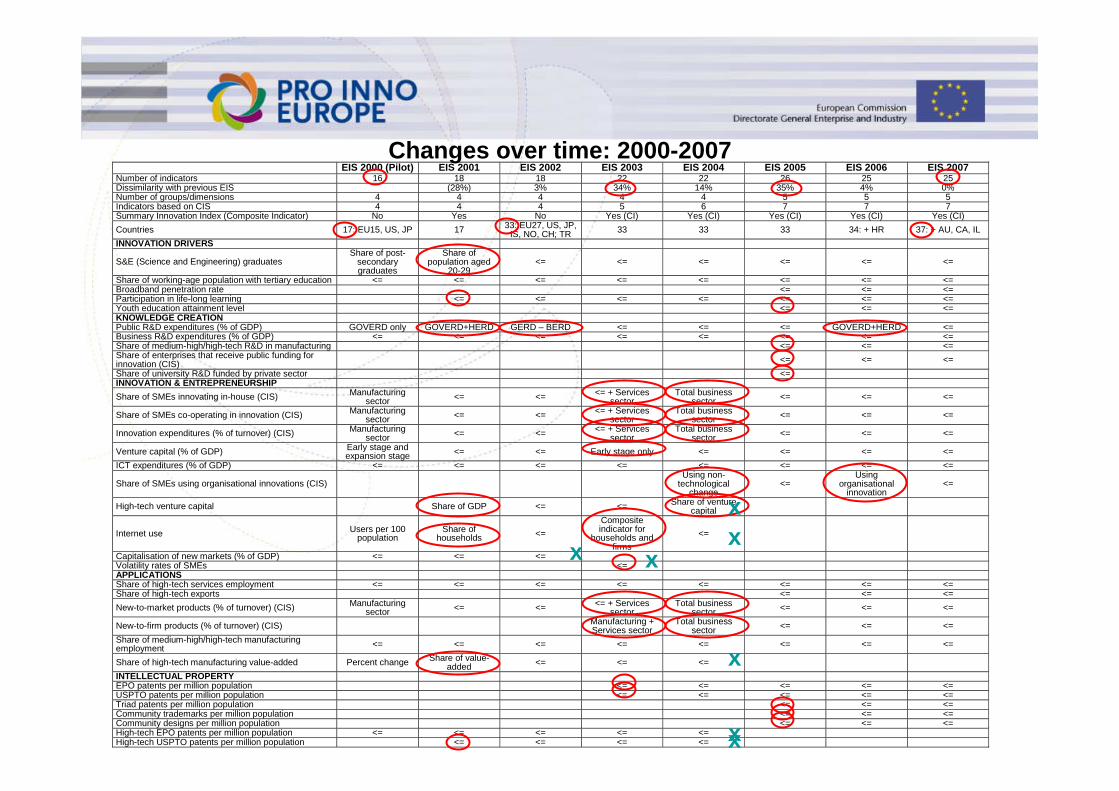
Changes over time: 2000-2007 EIS 2000 (Pilot) EIS 2001 EIS 2002 EIS 2003 EIS 2004 EIS 2005 EIS 2006 EIS 2007Number of indicators 16 18 18 22 22 26 25 25 Dissimilarity with previous EIS (28%) 3% 34% 14% 35% 4% 0% Number of groups/dimensions 4 4 4 4 4 5 5 5 Indicators based on CIS 4 4 4 5 6 7 7 7 Summary Innovation Index (Composite Indicator) No Yes No Yes (CI) Yes (CI) Yes (CI) Yes (CI) Yes (CI) Countries 17: EU15, US, JP 17 33: EU27, US, JP,
IS, NO, CH; TR 33 33 33 34: + HR 37: + AU, CA, IL INNOVATION DRIVERS
S&E (Science and Engineering) graduates Share of post-
secondary graduates
Share of population aged
20-29 <= <= <= <= <= <=
Share of working-age population with tertiary education <= <= <= <= <= <= <= <= Broadband penetration rate <= <= <= Participation in life-long learning <= <= <= <= <= <= <= Youth education attainment level <= <= <= KNOWLEDGE CREATION Public R&D expenditures (% of GDP) GOVERD only GOVERD+HERD GERD – BERD <= <= <= GOVERD+HERD <= Business R&D expenditures (% of GDP) <= <= <= <= <= <= <= <= Share of medium-high/high-tech R&D in manufacturing <= <= <= Share of enterprises that receive public funding for innovation (CIS) <= <= <= Share of university R&D funded by private sector <= INNOVATION & ENTREPRENEURSHIP Share of SMEs innovating in-house (CIS) Manufacturing
sector <= <= <= + Services sector
Total business sector <= <= <=
Share of SMEs co-operating in innovation (CIS) Manufacturing sector <= <= <= + Services
sector Total business
sector <= <= <=
Innovation expenditures (% of turnover) (CIS) Manufacturing sector <= <= <= + Services
sector Total business
sector <= <= <=
Venture capital (% of GDP) Early stage and expansion stage <= <= Early stage only <= <= <= <=
ICT expenditures (% of GDP) <= <= <= <= <= <= <= <=
Share of SMEs using organisational innovations (CIS) Using non-
technological change
<= Using
organisational innovation
<=
High-tech venture capital Share of GDP <= <= Share of venture capital
Internet use Users per 100 population
Share of households <=
Composite indicator for
households and firms
<=
Capitalisation of new markets (% of GDP) <= <= <= Volatility rates of SMEs <= APPLICATIONS Share of high-tech services employment <= <= <= <= <= <= <= <= Share of high-tech exports <= <= <= New-to-market products (% of turnover) (CIS) Manufacturing
sector <= <= <= + Services sector
Total business sector <= <= <=
New-to-firm products (% of turnover) (CIS) Manufacturing + Services sector
Total business sector <= <= <=
Share of medium-high/high-tech manufacturing employment <= <= <= <= <= <= <= <=
Share of high-tech manufacturing value-added Percent change Share of value-added <= <= <=
INTELLECTUAL PROPERTY EPO patents per million population <= <= <= <= <= USPTO patents per million population <= <= <= <= <= Triad patents per million population <= <= <= Community trademarks per million population <= <= <= Community designs per million population <= <= <= High-tech EPO patents per million population <= <= <= <= <= High-tech USPTO patents per million population <= <= <= <=
xx
x
x
x
x
x
6
EIS: New methodology for 2008 - 2010
• Criticism since the introduction of the EIS:Technology bias (focus on high-tech sectors)Choice of dimensions and indicators (“Lack of model”)Use of composite indicators
• Challenges as discussed in the EIS 2007 report:New forms of innovation: services, user, open innovationAssessing overall innovation performanceComparability at national, international and regional levelMeasuring changes over time
7
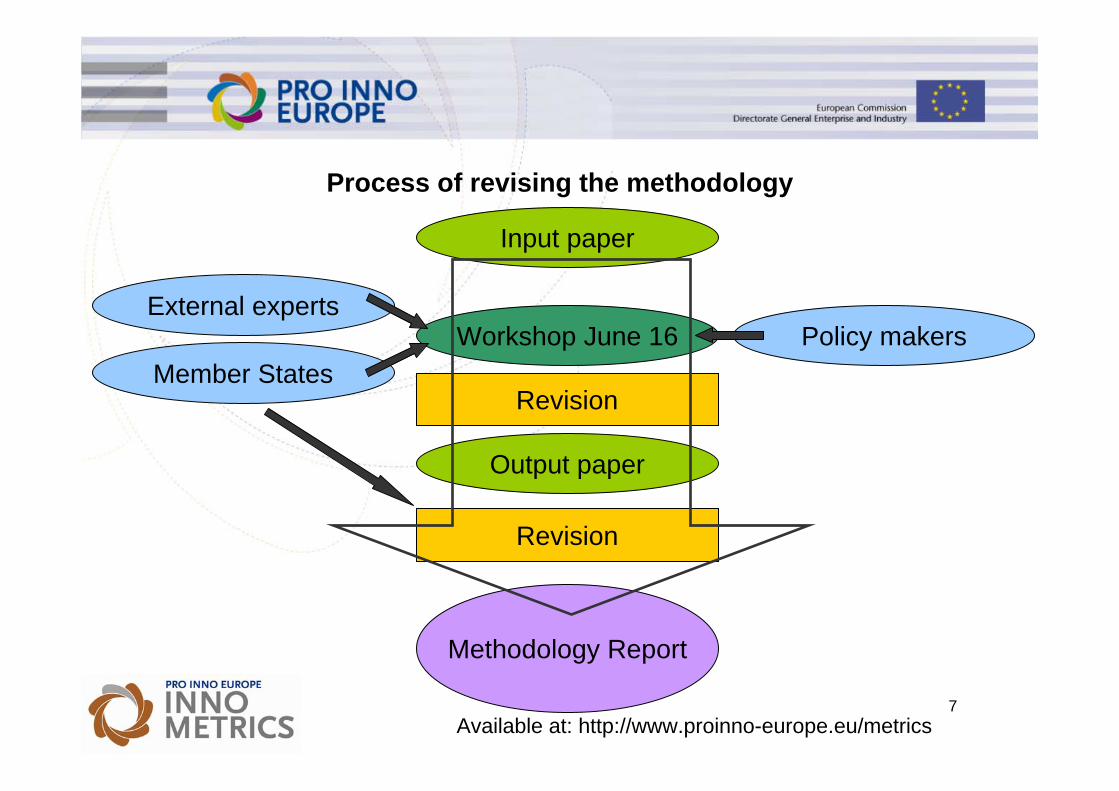
Process of revising the methodology
Input paper
Workshop June 16External experts
Policy makers
Output paper
Revision
Revision
Member States
Methodology Report
Available at: http://www.proinno-europe.eu/metrics
8
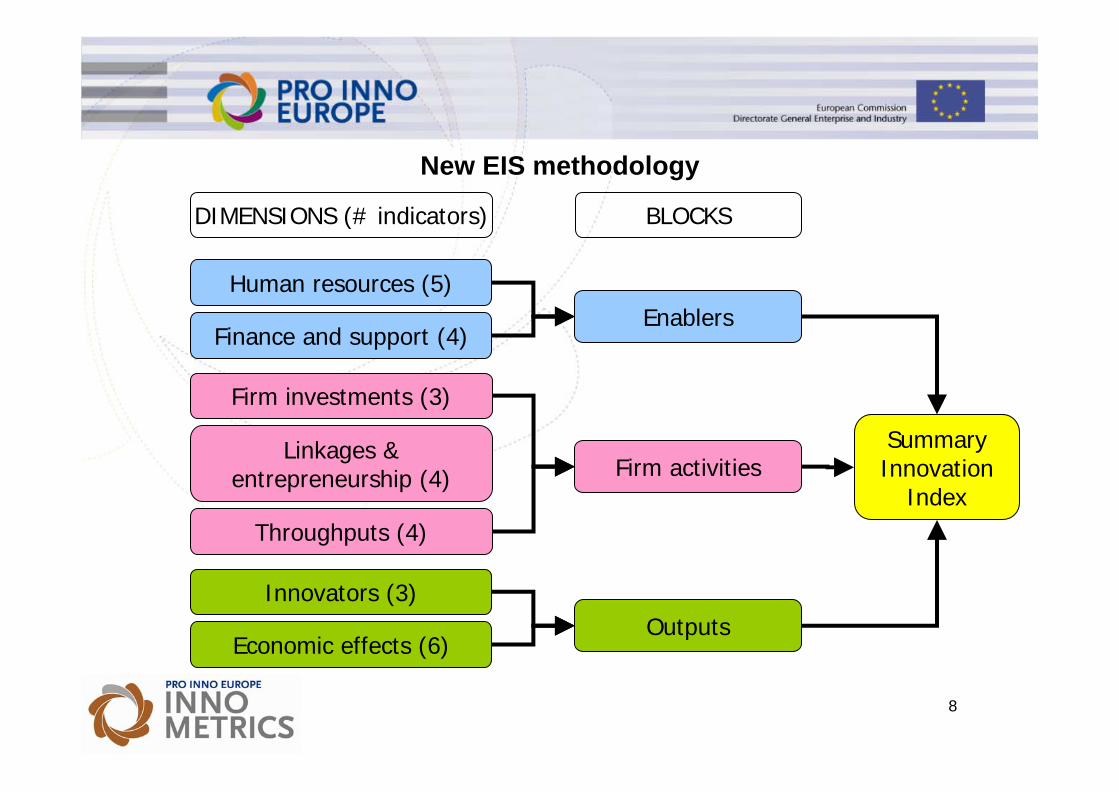
Human resources (5)
Finance and support (4)
Firm investments (3)
Linkages &entrepreneurship (4)
Throughputs (4)
Innovators (3)
Economic effects (6)
Enablers
Firm activities
Outputs
SummaryInnovation
Index
DIMENSIONS (# indicators) BLOCKS
New EIS methodology
9
ENABLERS
Captures the main drivers of innovation that are external to the firm:
• Human resources – the availability of high-skilled and educated people – are one of the most important innovation drivers
• Finance and support – the availability of finance for innovation projects and the support of governments for innovation activities are important drivers of innovation
10
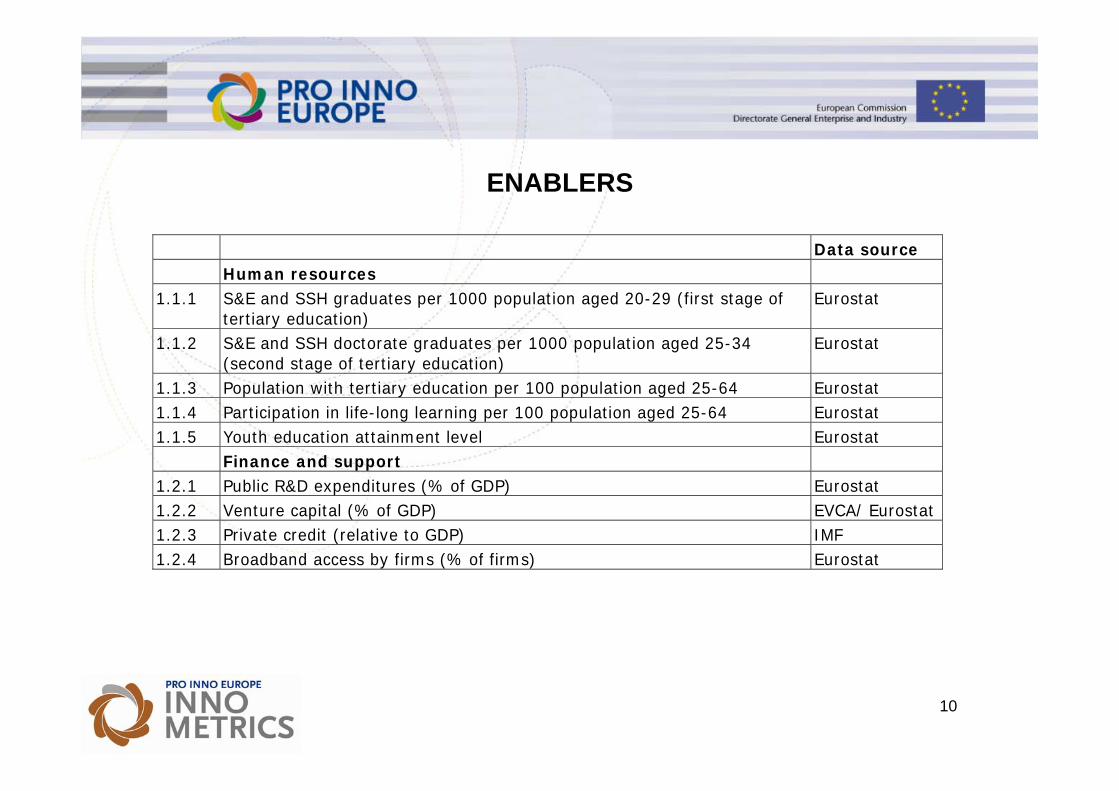
ENABLERS
Data source Human resources 1.1.1 S&E and SSH graduates per 1000 population aged 20-29 (first stage of
tertiary education) Eurostat
1.1.2 S&E and SSH doctorate graduates per 1000 population aged 25-34 (second stage of tertiary education)
Eurostat
1.1.3 Population with tertiary education per 100 population aged 25-64 Eurostat 1.1.4 Participation in life-long learning per 100 population aged 25-64 Eurostat 1.1.5 Youth education attainment level Eurostat Finance and support 1.2.1 Public R&D expenditures (% of GDP) Eurostat 1.2.2 Venture capital (% of GDP) EVCA/ Eurostat 1.2.3 Private credit (relative to GDP) IMF 1.2.4 Broadband access by firms (% of firms) Eurostat
11
FIRM ACTIVITIES
Captures innovation efforts at the firm level:
• Firm investments – Covers a range of different investments needed to generate new products or processes as well as for introducing “softer” innovations as marketing and organisationalinnovations
• Linkages & entrepreneurship – Captures the entrepreneurial efforts and the related collaboration efforts among innovating firms and also with the public sector
• Throughputs – Captures the Intellectual Property Rights (IPR) generated as a throughput in the innovation process and Technology Balance of Payments (TBP) flows
12
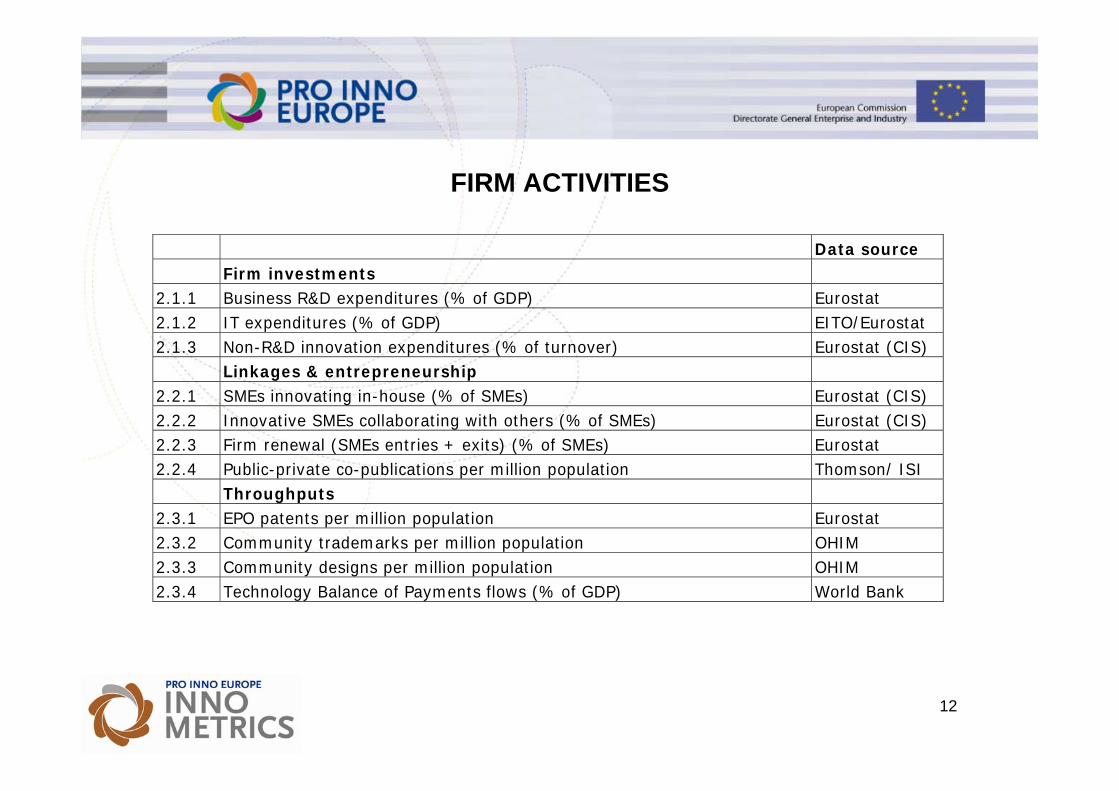
FIRM ACTIVITIES
Data source Firm investments 2.1.1 Business R&D expenditures (% of GDP) Eurostat 2.1.2 IT expenditures (% of GDP) EITO/Eurostat 2.1.3 Non-R&D innovation expenditures (% of turnover) Eurostat (CIS) Linkages & entrepreneurship 2.2.1 SMEs innovating in-house (% of SMEs) Eurostat (CIS) 2.2.2 Innovative SMEs collaborating with others (% of SMEs) Eurostat (CIS) 2.2.3 Firm renewal (SMEs entries + exits) (% of SMEs) Eurostat 2.2.4 Public-private co-publications per million population Thomson/ ISI Throughputs 2.3.1 EPO patents per million population Eurostat 2.3.2 Community trademarks per million population OHIM 2.3.3 Community designs per million population OHIM 2.3.4 Technology Balance of Payments flows (% of GDP) World Bank
13
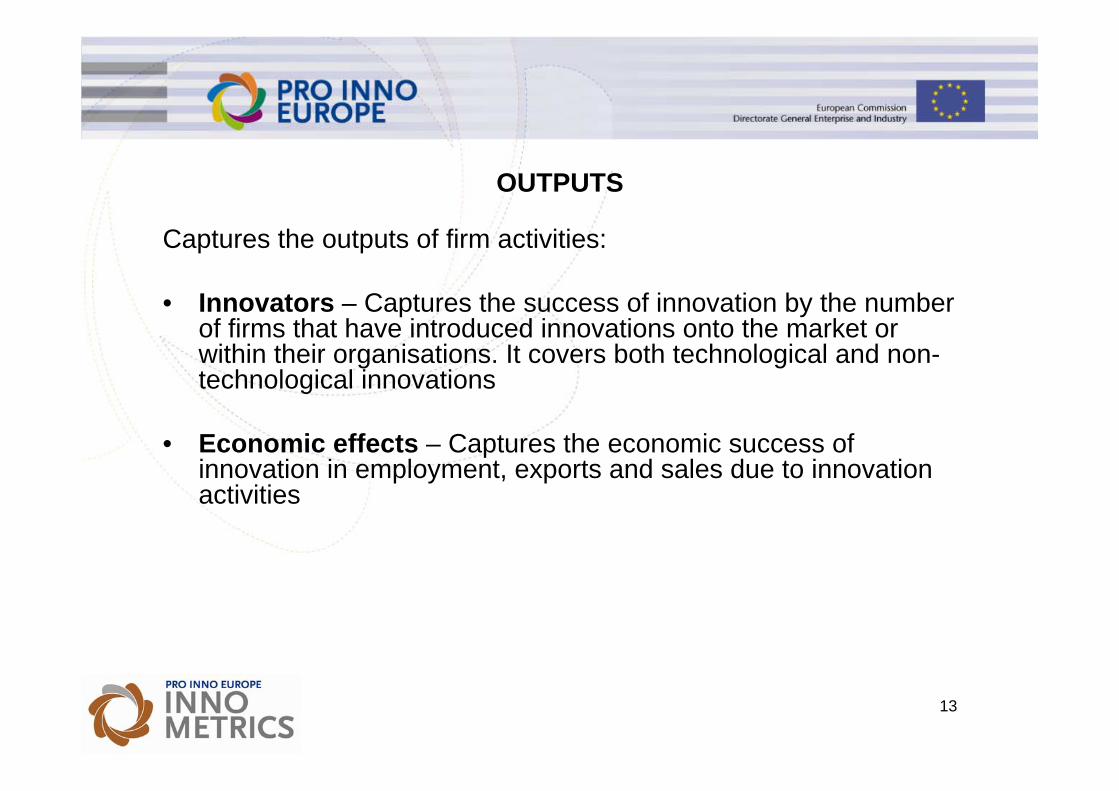
OUTPUTS
Captures the outputs of firm activities:
• Innovators – Captures the success of innovation by the number of firms that have introduced innovations onto the market or within their organisations. It covers both technological and non-technological innovations
• Economic effects – Captures the economic success of innovation in employment, exports and sales due to innovation activities
14
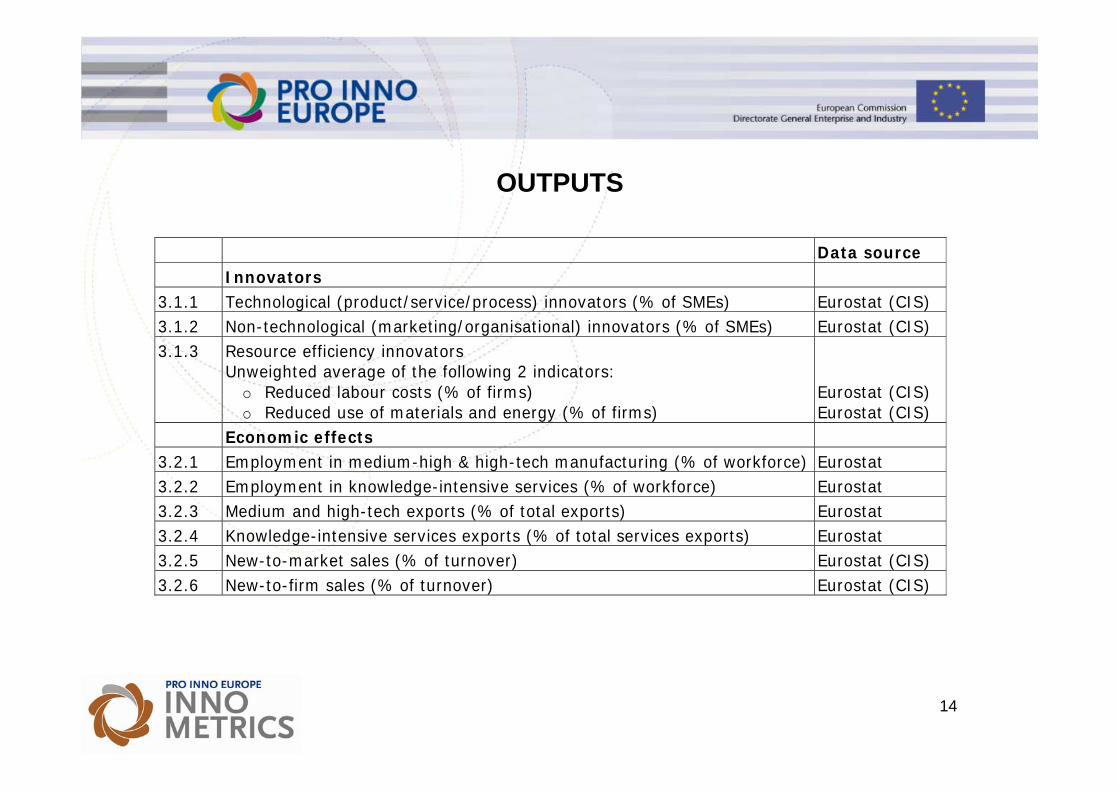
OUTPUTS
Data source Innovators 3.1.1 Technological (product/service/process) innovators (% of SMEs) Eurostat (CIS) 3.1.2 Non-technological (marketing/organisational) innovators (% of SMEs) Eurostat (CIS) 3.1.3
Resource efficiency innovators Unweighted average of the following 2 indicators:
o Reduced labour costs (% of firms) o Reduced use of materials and energy (% of firms)
Eurostat (CIS) Eurostat (CIS)
Economic effects 3.2.1 Employment in medium-high & high-tech manufacturing (% of workforce) Eurostat 3.2.2 Employment in knowledge-intensive services (% of workforce) Eurostat 3.2.3 Medium and high-tech exports (% of total exports) Eurostat 3.2.4 Knowledge-intensive services exports (% of total services exports) Eurostat 3.2.5 New-to-market sales (% of turnover) Eurostat (CIS) 3.2.6 New-to-firm sales (% of turnover) Eurostat (CIS)
15
Need for synthetic view
• Make sense of data for 29 indicators• Build a picture
⇒Use composite indicators to summarize performance for a large set of related but different indicators
16
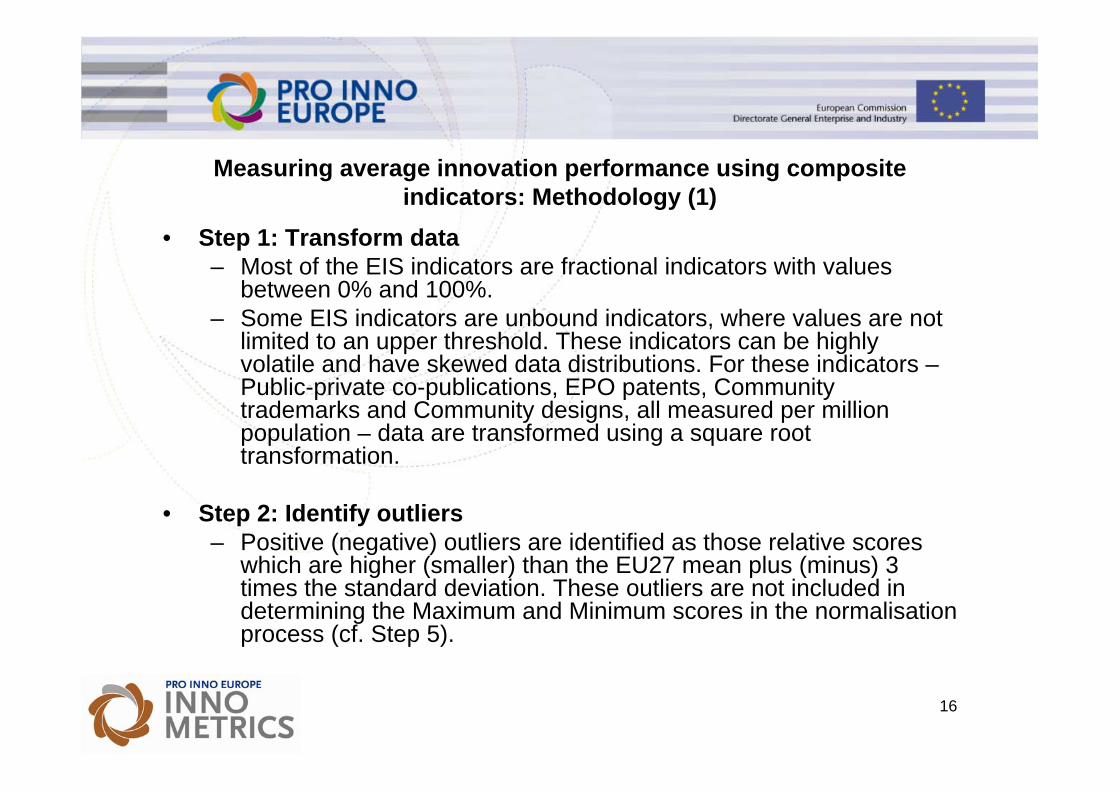
Measuring average innovation performance using composite indicators: Methodology (1)
• Step 1: Transform data– Most of the EIS indicators are fractional indicators with values
between 0% and 100%.– Some EIS indicators are unbound indicators, where values are not
limited to an upper threshold. These indicators can be highly volatile and have skewed data distributions. For these indicators –Public-private co-publications, EPO patents, Community trademarks and Community designs, all measured per million population – data are transformed using a square root transformation.
• Step 2: Identify outliers– Positive (negative) outliers are identified as those relative scores
which are higher (smaller) than the EU27 mean plus (minus) 3 times the standard deviation. These outliers are not included indetermining the Maximum and Minimum scores in the normalisation process (cf. Step 5).
17
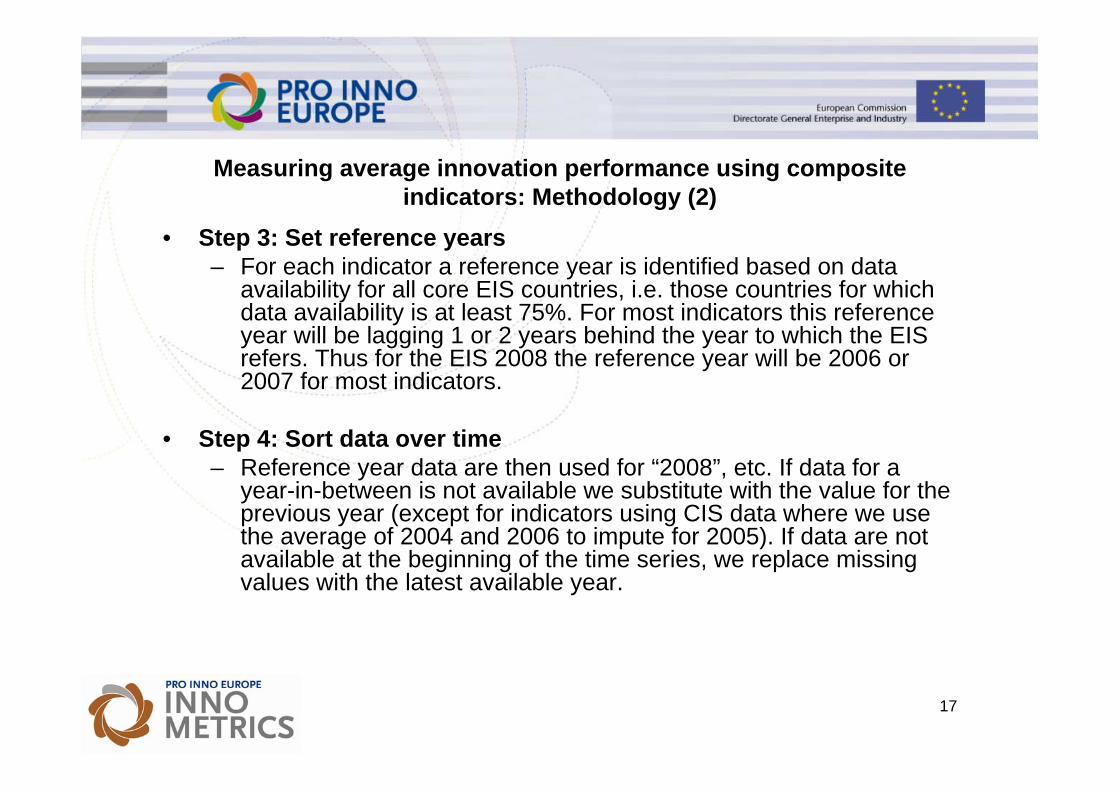
Measuring average innovation performance using composite indicators: Methodology (2)
• Step 3: Set reference years– For each indicator a reference year is identified based on data
availability for all core EIS countries, i.e. those countries for which data availability is at least 75%. For most indicators this reference year will be lagging 1 or 2 years behind the year to which the EIS refers. Thus for the EIS 2008 the reference year will be 2006 or2007 for most indicators.
• Step 4: Sort data over time– Reference year data are then used for “2008”, etc. If data for a
year-in-between is not available we substitute with the value for the previous year (except for indicators using CIS data where we usethe average of 2004 and 2006 to impute for 2005). If data are not available at the beginning of the time series, we replace missing values with the latest available year.
18
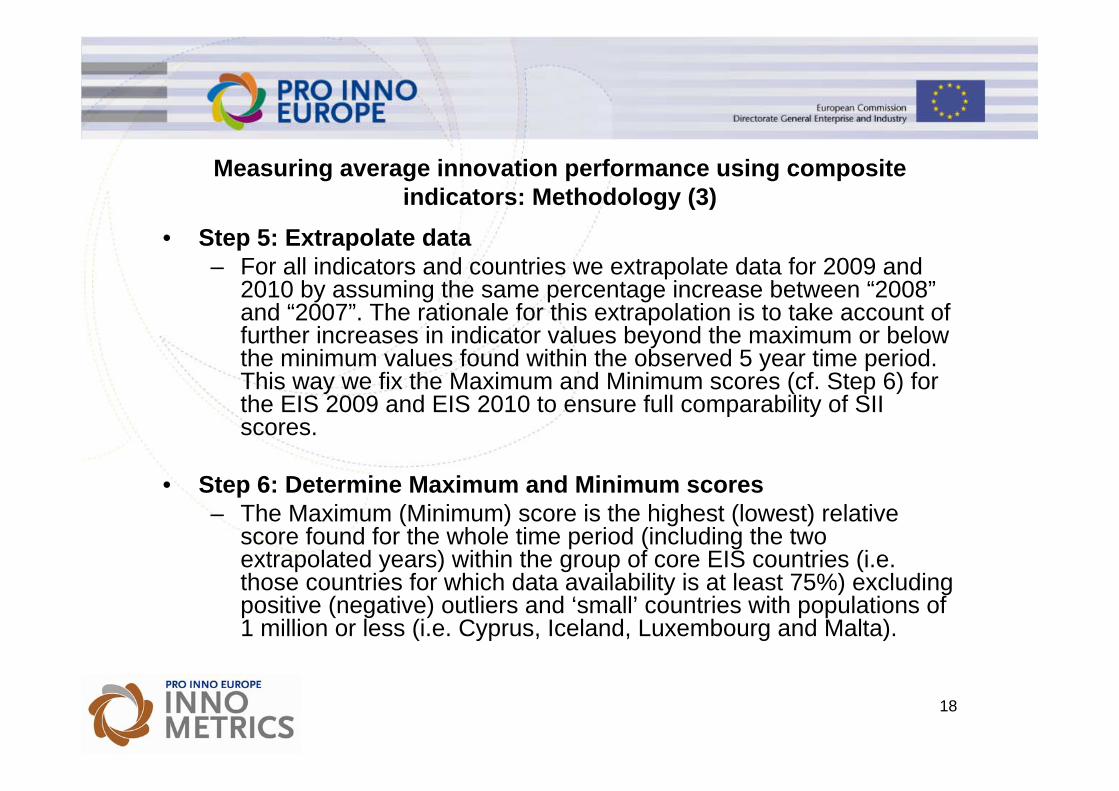
Measuring average innovation performance using composite indicators: Methodology (3)
• Step 5: Extrapolate data– For all indicators and countries we extrapolate data for 2009 and
2010 by assuming the same percentage increase between “2008” and “2007”. The rationale for this extrapolation is to take account of further increases in indicator values beyond the maximum or below the minimum values found within the observed 5 year time period.This way we fix the Maximum and Minimum scores (cf. Step 6) for the EIS 2009 and EIS 2010 to ensure full comparability of SII scores.
• Step 6: Determine Maximum and Minimum scores– The Maximum (Minimum) score is the highest (lowest) relative
score found for the whole time period (including the two extrapolated years) within the group of core EIS countries (i.e.those countries for which data availability is at least 75%) excluding positive (negative) outliers and ‘small’ countries with populations of 1 million or less (i.e. Cyprus, Iceland, Luxembourg and Malta).
19
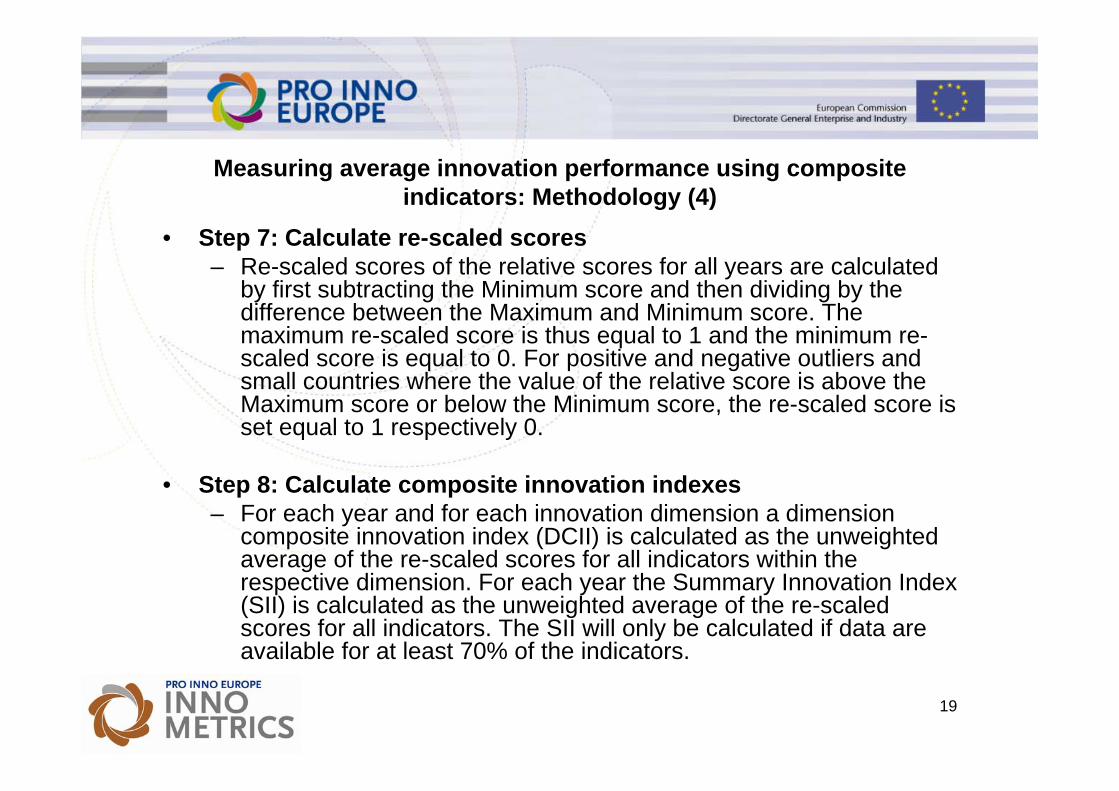
Measuring average innovation performance using composite indicators: Methodology (4)
• Step 7: Calculate re-scaled scores– Re-scaled scores of the relative scores for all years are calculated
by first subtracting the Minimum score and then dividing by the difference between the Maximum and Minimum score. The maximum re-scaled score is thus equal to 1 and the minimum re-scaled score is equal to 0. For positive and negative outliers and small countries where the value of the relative score is above the Maximum score or below the Minimum score, the re-scaled score is set equal to 1 respectively 0.
• Step 8: Calculate composite innovation indexes– For each year and for each innovation dimension a dimension
composite innovation index (DCII) is calculated as the unweighted average of the re-scaled scores for all indicators within the respective dimension. For each year the Summary Innovation Index(SII) is calculated as the unweighted average of the re-scaled scores for all indicators. The SII will only be calculated if data are available for at least 70% of the indicators.
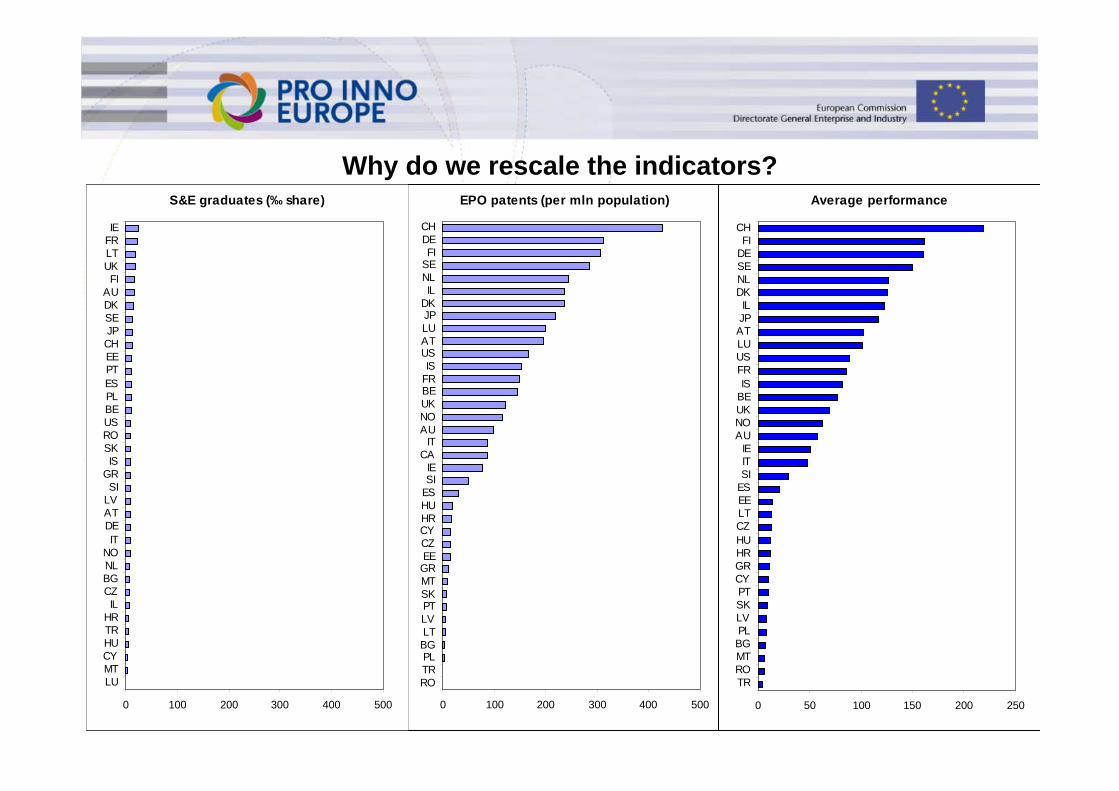
Why do we rescale the indicators?S&E graduates (‰ share)
0 5 10 15 20 25 30
LUMTCYHUTRHRIL
CZBGNLNO
ITDEATLVSI
GRIS
SKROUSBEPLESPTEECHJPSEDKAU
FIUKLTFRIE
EPO patents (per mln population)
0 100 200 300 400 500
ROTRPL
BGLTLVPTSKMTGREECZCYHRHUESSIIE
CAIT
AUNOUKBEFRIS
USATLUJPDKIL
NLSEFI
DECH
S&E graduates (‰ share)
0 100 200 300 400 500
LUMTCYHUTRHRIL
CZBGNLNO
ITDEATLVSI
GRIS
SKROUSBEPLESPTEECHJPSEDKAU
FIUKLTFRIE
Average performance
0 50 100 150 200 250
TRROMTBGPLLVSKPTCYGRHRHUCZLTEEESSIITIE
AUNOUKBEIS
FRUSLUATJPIL
DKNLSEDEFI
CH
S&E graduates (‰ share)
0.00 0.20 0.40 0.60 0.80 1.00
LUMTCYHUTRHRIL
CZBGNLNO
ITDEATLVSI
GRIS
SKROUSBEPLESPTEECHJPSEDKAU
FIUKLTFRIE
EPO patents (per mln population)
0.00 0.20 0.40 0.60 0.80 1.00
ROTRPLBGLTLVPTSKMTGREECZCYHRHUESSIIE
CAIT
AUNOUKBEFRIS
USATLUJPDKIL
NLSEFI
DECH
Average performance
0.00 0.20 0.40 0.60 0.80 1.00
MTCYTRHUHRBGCZLVROSKGRPLPTSI
LUEEESIT
NOIS
BELTUSAT
ILNLAUUKJPDEDK
IESEFRFI
CH
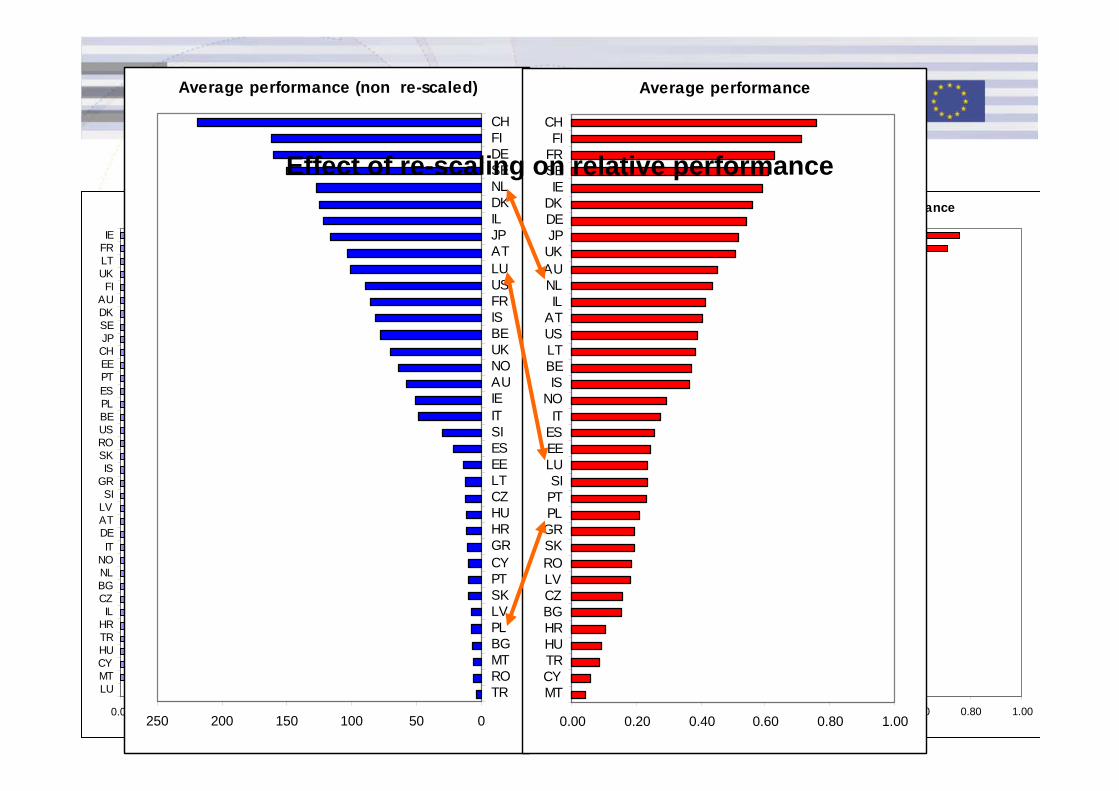
Average performance (non re-scaled)
050100150200250
TRROMTBGPLLVSKPTCYGRHRHUCZLTEEESSIITIEAUNOUKBEISFRUSLUATJPILDKNLSEDEFICH
Average performance
0.00 0.20 0.40 0.60 0.80 1.00
MTCYTRHUHRBGCZLVROSKGRPLPTSI
LUEEESIT
NOIS
BELTUSATIL
NLAUUKJPDEDKIE
SEFRFI
CH
Effect of re-scaling on relative performance
22
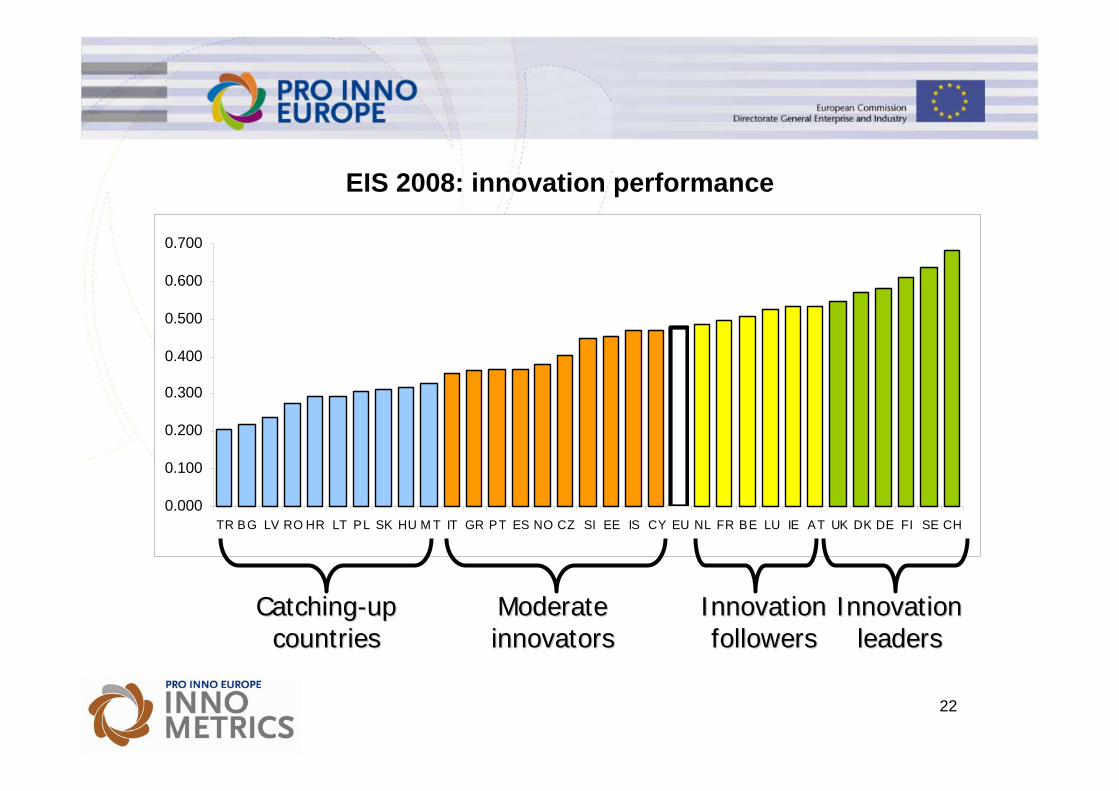
EIS 2008: innovation performance
0.000
0.100
0.200
0.300
0.400
0.500
0.600
0.700
TR BG LV RO HR LT PL SK HU M T IT GR PT ES NO CZ SI EE IS CY EU NL FR BE LU IE AT UK DK DE FI SE CH
ModerateModerateinnovatorsinnovators
InnovationInnovationfollowersfollowers
InnovationInnovationleadersleaders
CatchingCatching--upupcountriescountries
23
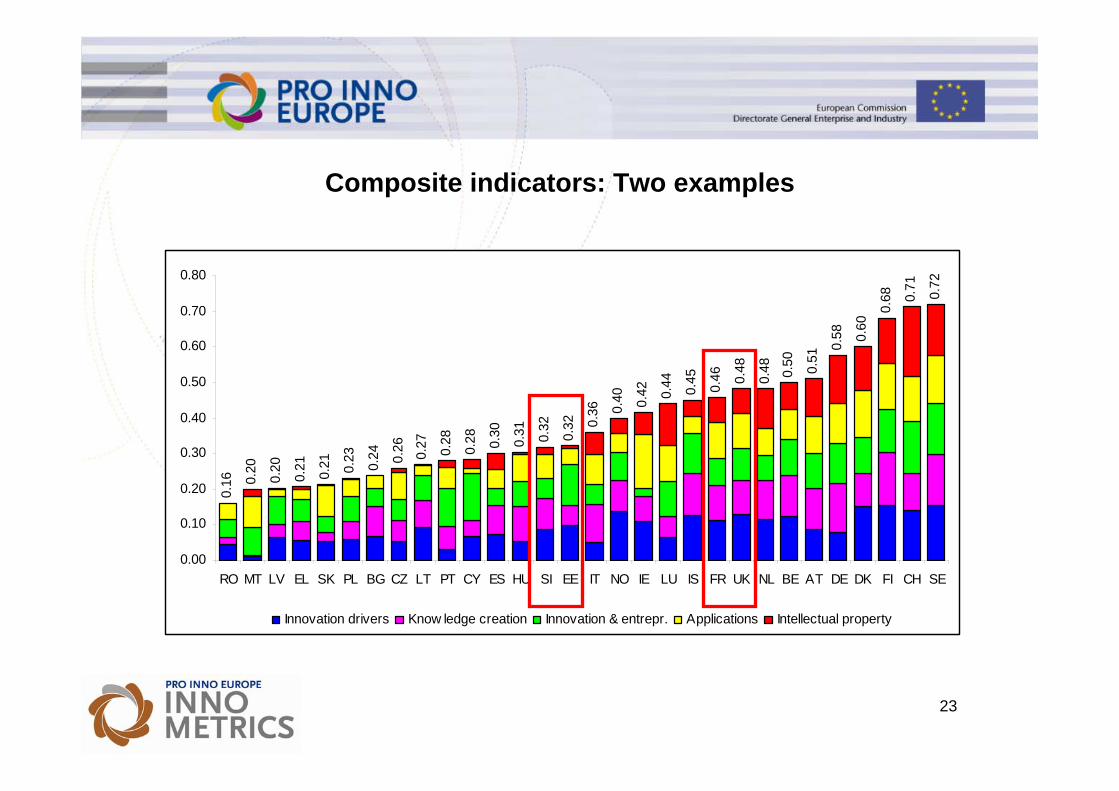
Composite indicators: Two examples0.
16 0.20
0.20
0.21 0.21 0.23 0.24 0.26 0.27 0.28
0.28 0.30
0.31 0.32
0.32 0.
36 0.40 0.42 0.
44 0.45 0.46 0.
48
0.48 0.50 0.51
0.58 0.
60
0.68 0.
71 0.72
0.00
0.10
0.20
0.30
0.40
0.50
0.60
0.70
0.80
RO MT LV EL SK PL BG CZ LT PT CY ES HU SI EE IT NO IE LU IS FR UK NL BE AT DE DK FI CH SE
Innovation drivers Know ledge creation Innovation & entrepr. Applications Intellectual property
24
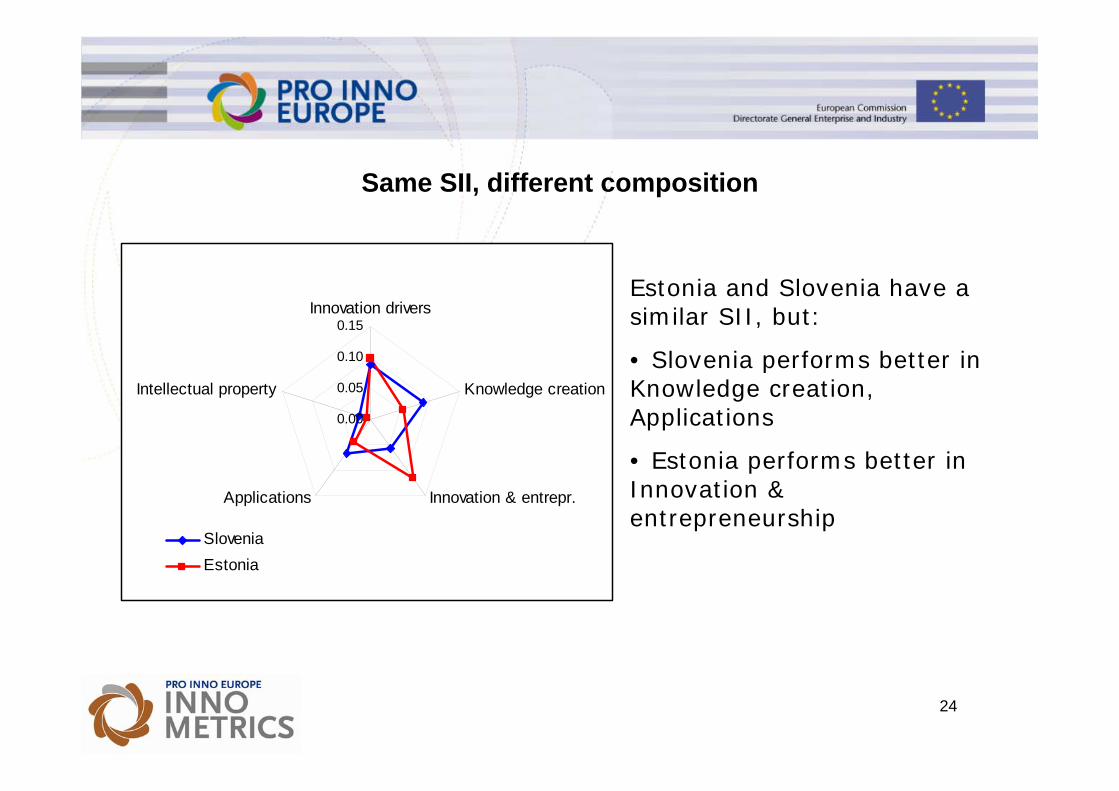
Same SII, different composition
0.00
0.05
0.10
0.15Innovation drivers
Knowledge creation
Innovation & entrepr.Applications
Intellectual property
SloveniaEstonia
Estonia and Slovenia have a similar SII, but:
• Slovenia performs better in Knowledge creation, Applications
• Estonia performs better in Innovation & entrepreneurship
25
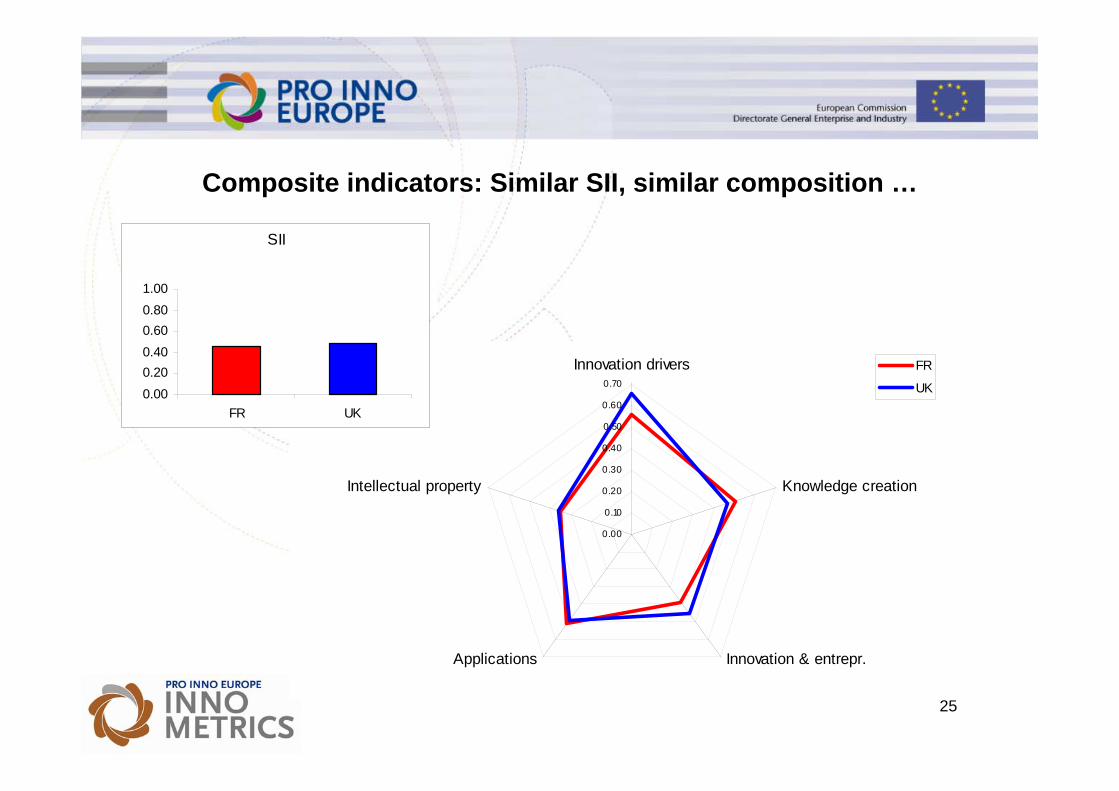
Composite indicators: Similar SII, similar composition …
0.00
0.10
0.20
0.30
0.40
0.50
0.60
0.70
Innovation drivers
Knowledge creation
Innovation & entrepr.Applications
Intellectual property
FR
UK
SII
0.000.200.400.600.801.00
FR UK
26
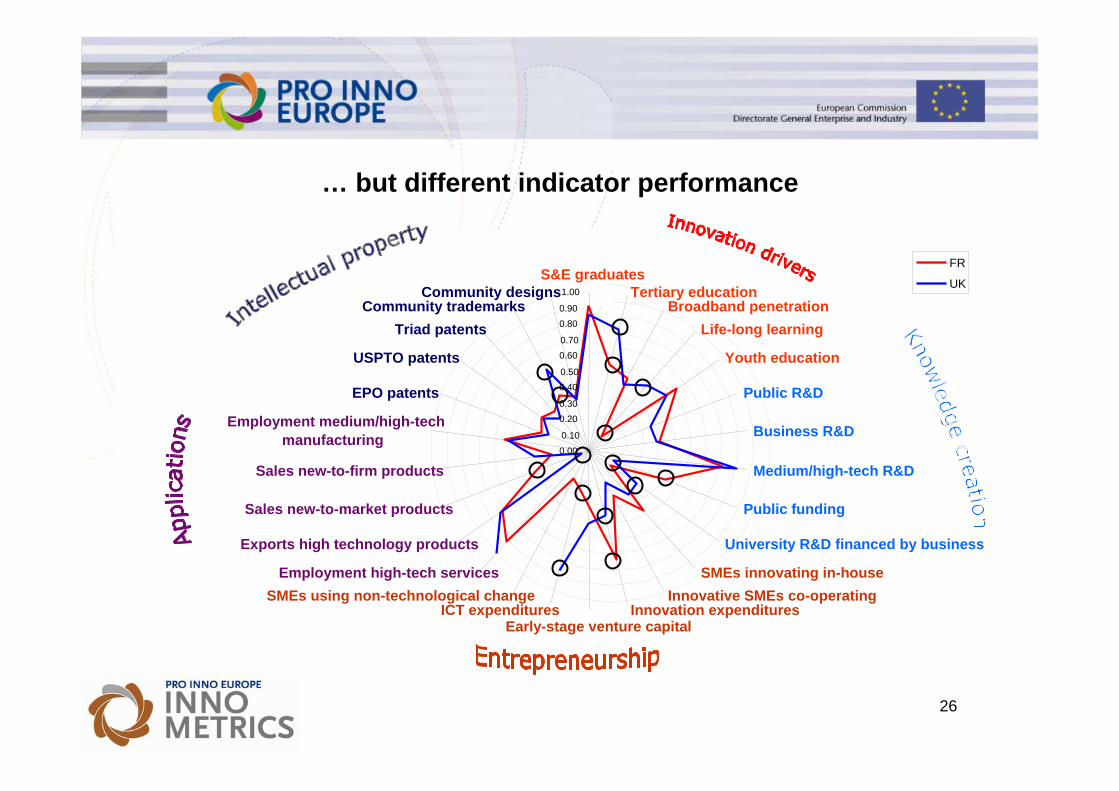
… but different indicator performance
0.000.10
0.200.30
0.400.50
0.600.70
0.800.90
1.00
S&E graduatesTertiary education
Broadband penetrationLife-long learning
Youth education
Public R&D
Business R&D
Medium/high-tech R&D
Public funding
University R&D financed by business
SMEs innovating in-houseInnovative SMEs co-operating
Innovation expendituresEarly-stage venture capital
ICT expendituresSMEs using non-technological change
Employment high-tech services
Exports high technology products
Sales new-to-market products
Sales new-to-firm products
Employment medium/high-techmanufacturing
EPO patents
USPTO patents
Triad patentsCommunity trademarks
Community designs
FR
UK
27
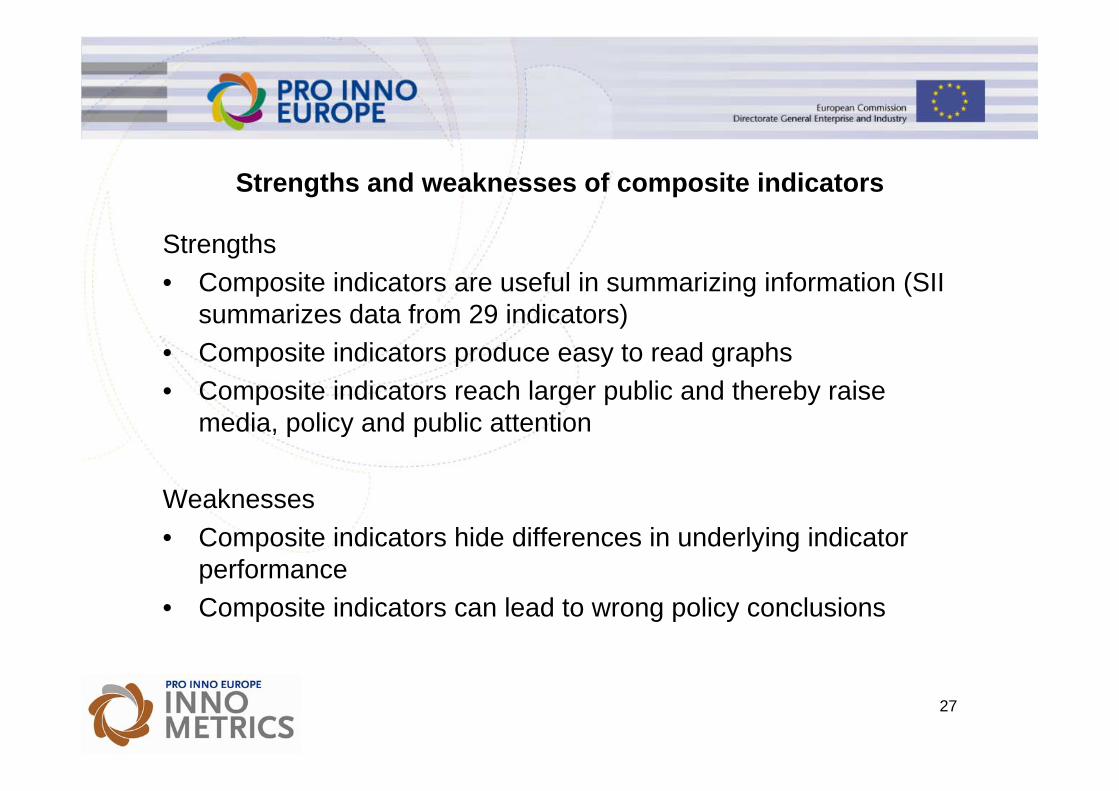
Strengths and weaknesses of composite indicators
Strengths• Composite indicators are useful in summarizing information (SII
summarizes data from 29 indicators)• Composite indicators produce easy to read graphs• Composite indicators reach larger public and thereby raise
media, policy and public attention
Weaknesses• Composite indicators hide differences in underlying indicator
performance• Composite indicators can lead to wrong policy conclusions
28
Lessons learnt
• Innovation performance can be measured using a selection of indicators which either directly or indirectly (‘proxies’) measure innovation
• Average performance can be captured using composite indicators thereby facilitating the interpretation and visualization of innovation performance
• But we have to be aware that we need to look beyond composite indicator scores
• We always need to find explanations for differences in composite indicator scores and composite indicator components
29
Global Innovation Scoreboard
• Attempt to implement the EIS methodology on a larger sample of non-EU countries– 1st report published in 2006– 2nd report published last Tuesday
(Available at: http://www.proinno-europe.eu/index.cfm?fuseaction=page.display&topicID=282&parentID=51)
30
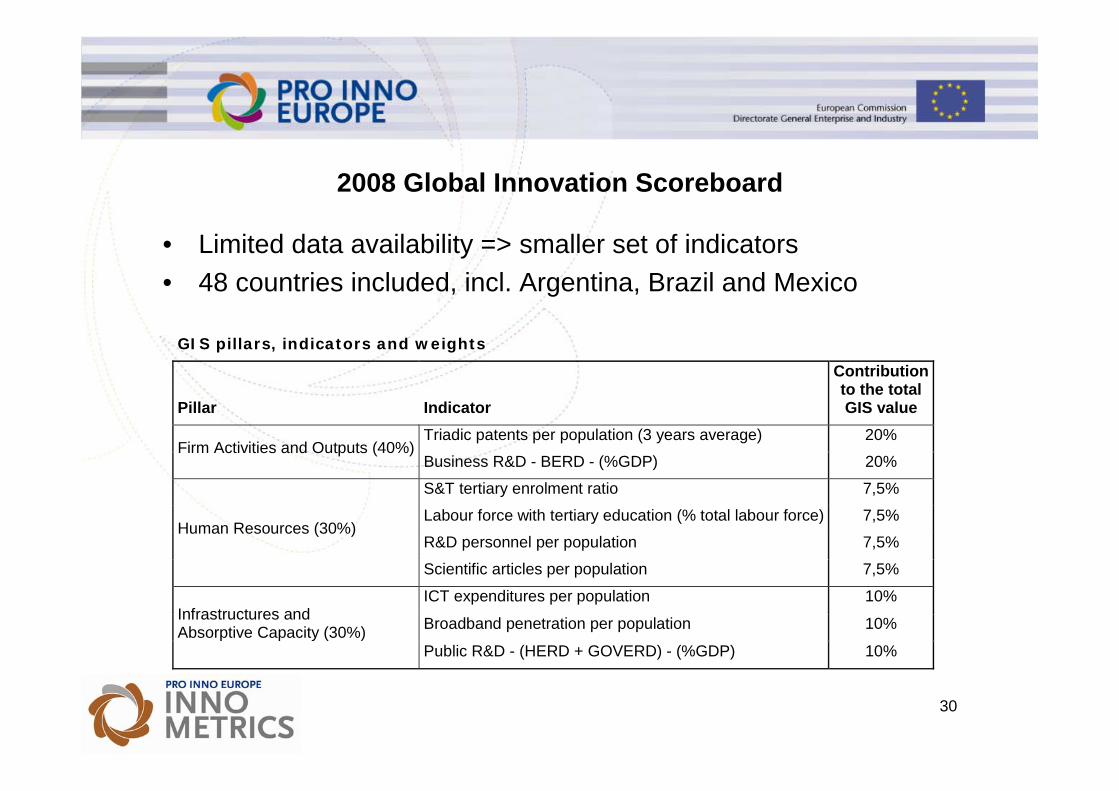
2008 Global Innovation Scoreboard
GIS pillars, indicators and weights
Pillar Indicator
Contribution to the total GIS value
Triadic patents per population (3 years average) 20% Firm Activities and Outputs (40%)
Business R&D - BERD - (%GDP) 20%
S&T tertiary enrolment ratio 7,5%
Labour force with tertiary education (% total labour force) 7,5%
R&D personnel per population 7,5% Human Resources (30%)
Scientific articles per population 7,5%
ICT expenditures per population 10%
Broadband penetration per population 10% Infrastructures and Absorptive Capacity (30%)
Public R&D - (HERD + GOVERD) - (%GDP) 10%
• Limited data availability => smaller set of indicators• 48 countries included, incl. Argentina, Brazil and Mexico
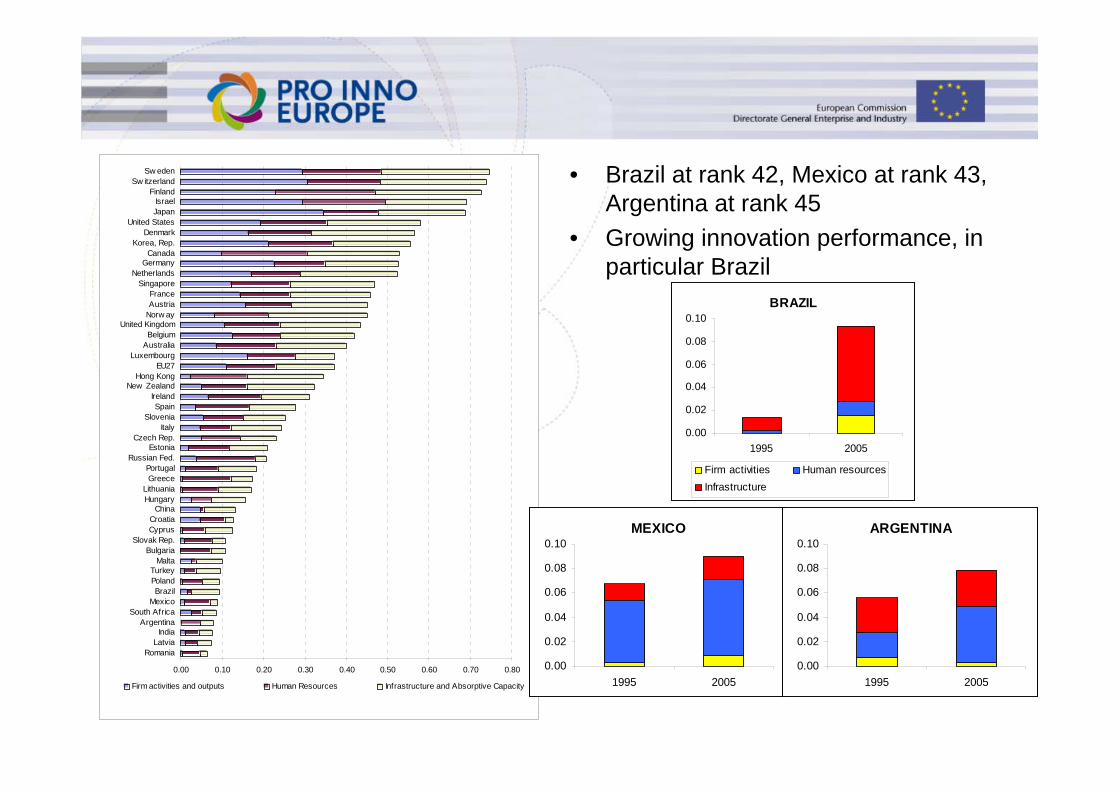
0.00 0.10 0.20 0.30 0.40 0.50 0.60 0.70 0.80
RomaniaLatvia
IndiaArgentina
South AfricaMexico
BrazilPolandTurkey
MaltaBulgaria
Slovak Rep.CyprusCroatia
ChinaHungaryLithuania
GreecePortugal
Russian Fed.Estonia
Czech Rep.Italy
SloveniaSpain
IrelandNew Zealand
Hong KongEU27
LuxembourgAustraliaBelgium
United KingdomNorw ayAustriaFrance
SingaporeNetherlands
GermanyCanada
Korea, Rep.Denmark
United StatesJapanIsrael
FinlandSw itzerland
Sw eden
Firm activities and outputs Human Resources Infrastructure and Absorptive Capacity
BRAZIL
0.00
0.02
0.04
0.06
0.08
0.10
1995 2005
Firm activities Human resourcesInfrastructure
MEXICO
0.00
0.02
0.04
0.06
0.08
0.10
1995 2005
• Brazil at rank 42, Mexico at rank 43, Argentina at rank 45
• Growing innovation performance, in particular Brazil
ARGENTINA
0.00
0.02
0.04
0.06
0.08
0.10
1995 2005
32
• Thank you!
• For questions or comments, please contact:
Hugo HollandersUNU-MERIT - Maastricht UniversityPO Box 616, 6200 MD Maastricht, the NetherlandsTel +31 433884412 Fax +31 433884495Website: www.merit.unu.eduEmail: [email protected]