European Parliament views on the EU’s responsibilities around Fibromyalgia
ANALYST CERTIFICATIONS AND IMPORTANT DISCLOSURES ARE IN THE DISCLOSURE APPENDIX. FOR OTHER IMPORTANT DISCLOSURES, PLEASE REFER TO https://firesearchdisclosure.credit-suisse.com.
European Credit Views
Analysing and hedging the market impact of Solvency II Based on the current specifications, we look at the likely impact on different asset classes, with a focus on credit. We provide a brief, non-technical overview of Solvency II and suggest the impact it will have on several asset classes. We particularly focus on credit, highlighting the different Solvency II rules on each product and our view of the resulting likely impact on relative pricing. Most material focuses on the standard formula for calculating Solvency II charges. Instead, we apply our PR+ model to provide hands-on insight into how an internal model could measure spread risk, what the best hedging instruments might be and what that might mean for relative pricing of these products.
We calculate the capital charges across asset classes for a fictional insurance company, highlighting the high capital charges stemming from the interest rate, spread and illiquidity modules. We also touch on the most efficient hedging strategies.
We dive deeper into the subject and find the following likely impacts on credit products:
• Solvency II is likely to be another factor driving rotation out of financials because concentration risks within credit portfolios are not addressed by the spread risk module under the standard formula, but are likely to be by an internal model
• Current wide spreads on some European sovereigns offer attractive returns (on the ones we see as par assets) with no credit risk capital charge
• We expect steeper cash bond curves
• A bias towards a positive basis between bonds and CDS develops because of their separate treatments
• The use of internal models also could give rise to increased use of convex hedging instruments, particularly OTM payer swaptions and senior tranches
• Greater use of collateralised structures to minimise capital charges and maximise return per unit of capital occurs
17 December 2010Fixed Income Research
http://www.credit-suisse.com/researchandanalytics
Contributors Christian Schwarz +44 20 7888 3161

17 December 2010
European Credit Views 2
Table of contents
Executive summary 3
Introduction 4 The insurance industry 4 Genesis of Solvency II 4 Capital requirements 7
Impact on each asset class 8 Example: Life insurance 8
Impact on the asset class of credit 15 Ratings and maturities of bonds 15 Derivatives vs. their corporate bond counterpart 18 Internal models 21
Credit risk management strategies 26 Capital efficient investments 32
Appendix 34

17 December 2010
European Credit Views 3
Executive summary This is not a technical note on Solvency II, but an assessment of the impact it will have on financial markets, and particularly on credit markets. It thus caters to a wide range of investors with very different knowledge bases and experience with regards to Solvency 2.
As background, we outline the genesis and basics of Solvency II in the introduction. We focus on why changes to regulatory rules in the insurance sector matter to markets. This section hence can be ignored by Solvency II experts.
The subsequent chapter addresses the impact on several asset classes in a similar vein, as it illustrates the capital charges per asset class for a hypothetical insurance company. Comparing these charges across asset classes and adding excess returns to the picture enable us to make relative value assessments.
The chapter about credit and how it is affected by Solvency II goes into more detail and outlines the differing rules for bonds, CDS and structured products. Within each product we compare different maturities and rating classes at different points in the cycle, highlighting the timing dependence. By bringing spreads into the picture we find relative value across the asset class. In this chapter, the section about internal models is probably the most unique. We identify that correlations and curve risk very much should be part of an internal model, as these are spared out by the standard formula. The conclusions we make are far-reaching: Insurers with internal models can greatly reduce their capital charges by diversifying away from banks and financials and reducing overweight exposures to single names and the financial sector by buying CDS protection on each.
The final chapter probably is as important and relevant for insurers as it is for other investors. It outlines how the capital charge due to the spread risk module can be greatly reduced by the use of CDS indices, CD payer swaptions and tranches on Itraxx indices. We compare these instruments by hedging efficiency, cost and liquidity and find that buying OTM payer swaptions and selling ATM receiver swaptions as well as buying protection on the most senior tranches is most efficient.
Having described how to reduce the capital charge by hedging the credit portfolio, we turn to Solvency II efficient investments and find that collateralized structures like securities lending and negative basis packages are most attractive in this regard.
For a more detailed overview on Solvency II, and for practical solutions, we recommend contacting our colleagues from the
Insurance and Pensions solutions team. Their very valuable input and advice on this report is gratefully acknowledged.

17 December 2010
European Credit Views 4
Introduction The insurance industry Insurance is an important and large sector in Europe. The STOXX Insurance 600 (Price) Index has a market cap of €287.6bn, which equals 5.3% of its parent index, the STOXX Europe 600 (Price) Index.
On an inflation-adjusted basis, global insurance premiums contracted by 1.1% to $4,066bn in 2009. Life premiums fell 2% to $2,332bn, while non-life remained flat at $1,735bn.
The UK, France and Germany are among the top five national markets, together with the USA and Japan. In total these five hold $15.6tn of assets1.
The changes from Solvency II will likely have an impact on the asset allocation of insurers in the EU and therefore impact global markets.
Genesis of Solvency II Solvency II is the new capital regime for European insurers. Its design was started in 2003 by the European Commission (EC) consulting with the committee of European regulators, CEIOPS (Committee of European Insurance and Occupational Pension Supervisors). The following is quoted from the CEIOPS webpage: “At the 32nd EU Insurance Committee meeting in April 2003, representatives of the Member States endorsed the proposal by the European Commission regarding the fundamental principles for the design of a future prudential system for the supervision of insurance undertakings in the EU, i.e. the Solvency II Project.”
Solvency II now is at an advanced stage and is expected to come into force on 31 December 2012. Currently, the results from the QIS5 (Quantitative Impact Study), which have been submitted in October and November 2010, are in review and expected to be published before April 2011.
There are three pillars on which Solvency II is based:
• Pillar 1: financial requirements
• Pillar 2: supervisory review process and qualitative aspect of management
• Pillar 3: disclosure requirements
In this publication we mainly focus on the impacts on markets from the first pillar.
The most fundamental change is the introduction of a consistent, EU-wide fair-value standard: Insurance companies will mark assets to market and calculate fair values of liabilities. This is notably changed from the current approach in many European jurisdictions and provides for a consistent valuation across the EU.
One of the changes from Solvency 1 is a move to a risk-based approach of calculating required capital. So far, asset allocations do not enter the risk calculations, meaning that for example the holding of a AAA-rated bond and an equally large position in equities would be treated in the same way from a risk perspective. This means that in the future, asset allocations of insurance companies should increasingly reflect risk considerations. We expect this to have a substantial impact on markets and we expect changes in asset allocations to start taking place in early 2011. We expect only the largest insurance companies in Europe to have the resources to build internal models and subsequently receive approval for them.
The Solvency Capital Requirement (SCR) will be calculated by computing a one-year, 99.5% worst-case change in net asset value (NAV, Assets minus liabilities) due to a shock
1 Source: Swiss Re: http://media.swissre.com/documents/sigma5_2010_en.pdf

17 December 2010
European Credit Views 5
in variables in each module 2 . These then will be aggregated to the total capital requirement by allowing for diversification and non-perfect correlation between the different modules. There are standard stress tests for market, underwriting and other risks.
Breaching the SCR will not automatically result in intervention from regulators. It however is meant to increase regulatory scrutiny. Furthermore, hybrid capital securities will potentially not be called, coupons might be deferred and conversion could be triggered.
There also is a Minimum Capital Requirement (MCR), which is proposed to be in a corridor of 25%-45% of the SCR. The MCR is meant to be an absolute minimum of capital required to be authorised to take out insurance activities.
The EC and CEIOPS also allow for the use of internal models instead of the standard formula. These however need to be approved by the regulator. This is intended to encourage insurers to integrate Solvency II measurement into group risk management and management decisions. A further incentive for insurers to implement internal models is the fact that these can give rise to lower capital requirements. This is possible as long as the models are approved.
As mentioned above, the SCR is calculated by aggregating the requirements from the different risk modules, which are categorised by type of risk. Exhibit 1 illustrates the structure of the SCR. The capital charges from each subsection of the market risk module are calculated from an adverse market movement and its impact on the NAV. These then are aggregated according to a market risk correlation matrix. The capital requirements from the non-life underwriting risk module are challenging assumptions about premiums, reserves and lapse risk. Life underwriting risk, in turn, is determined by applying stress factors to actuarial statistics, like mortality and longevity, etc. Health risk charges are a mix of the previous two. The counterparty default risk module takes into account risks stemming from hedges, reinsurance or securitizations. It reflects the probability of and the loss given a default of a counterparty. All of these add up to the basic SCR, which then is aggregated with the SCRs from the intangible assets and operational risk modules.
Exhibit 1: Structure of Solvency II and its underlying modules
October 2010Slide 7
SCR risk modules
* Source: Credit Suisse.
SCR
SCR – operational risks
SCR – basic risksSCR – intangible assets
Non-life riskMarket risk Life riskCounterparty
risk Health risk
Interest rate Global Equity Other Equity Credit spread Liquidity Premium Real estate CurrencyConcentrations
Mortality Longevity Catastrophe Lapse Expense
Underwriting Lapse Reserve
Underwriting Catastrophe
Source: Credit Suisse
2 Note: the calculations use the Gaussian approximation and thus this relates to much shorter than a "200-year event".

17 December 2010
European Credit Views 6
Rules are not finalized yet. We base our analysis on the QIS5 technical specifications published in July 2010.
Exhibit 2: Solvency II time table
October 2010Slide 8
Solvency II - timetable
Whilst there will be lobbying and some changes to current proposals, the final shape of Solvency II is broadly clear already.
201220112010
31 December 2012
Solvency II enters into force (expected)
Oct-Nov 2010
Formal adoption of the Proposal for Level 2 implementing measures by Commission with accompanying impact assessment report
July 2010
Commission published QIS5 technical specification, with results submitted by December 2010 and published by CEIOPS April 2011
June-October 2011
Discussion of Level 2 implementing measures in Council and Parliament following opinion from EIOPC
Adoption of the Level 2 implementing measures by Commission
December 2011
Final Level 3 supervisory guidance including impact analysis
Adoption process regarding 3rd country equivalence commences January 2012 with formal discussions in EIOPC, official opinion from EIOPC and adoption by Commission of decisions by June 2012
July-September 2010
Finalising the drafting of the Level 2 implementing measures
April 2010
CEIOPS provided a comprehensive calibration paper to the Commission along with a draft QIS5 technical specification
November 2009
CEIOPS published final advice on the great majority of Level 2 implementing measures (following 1st and 2nd
rounds of consultation) and launches 3rd round of consultation including impact analysis
January-May 2011
Formal discussion of Level 2 implementing measures in EIOPC and official opinion from EIOPC
January 2010
CEIOPS delivered its remaining final advice on Level 2 implementing measures (treatment of participations, eligibility of own funds, ring-fenced funds, equity risk shocks, securitisation)
Source: Credit Suisse

17 December 2010
European Credit Views 7
Capital requirements There are three tiers of capital that are allowed to meet the SCR and MCR: Tier 1, Tier 2 and Tier 3. The main limits on the use of these three are set by CEIOPS to be:
• At least 50% of the SCR has to be covered by tier 1 capital. • At most, 15% of the SCR can be met with tier 3 capital • Furthermore, tier 1 capital must exceed tier 2, which itself must be greater than tier
3 capital. • There are no restrictions on tier 2 capital as long as these other restrictions are
fulfilled.
Similar to Basel 3, great emphasis is put on the possibility for debt instruments to absorb losses. At the moment only few instruments other than ordinary shares have this feature enabled. There is great political will to change this and allow certain debt securities to suffer (permanent) write-downs in a “going concern” frame work.
Tier 1 According to Solvency II, tier 1 securities therefore will largely consist of either ordinary shares or debt instruments that can convert into equity capital or equity-like hybrids. However, the share of hybrids in the tier 1 capital may not exceed 20%. The most important characteristics that hybrids will feature in order to fulfil tier 1 treatment are:
• First loss absorption or pari passu with equities • Deeply subordinated in event of winding up • No mandatory redemption or coupon payments • Free of encumbrances • Minimum of ten-year duration
Another key feature of the tier 1 securities is that they automatically trigger coupon removal or withdrawal of redemption in case of breach of the SCR. If the SCR is not breached, the callability of the bond is at the discretion of the issuer. However, these instruments may not exhibit step-ups, or other incentives to redeem the bond at call date.
Tier 2 The rules for tier 2 are less strict. Here a shorter duration on hybrid instruments is allowed. Preference shares that do not have a conversion feature also fall into this category. Similar to tier 1, tier 2 capital must also have the ability to absorb losses to some degree and also is subordinated. Furthermore, the option to call the bond stays with the issuer. Importantly, however, in the event of a breach of the SCR, coupons are just deferred rather than entirely removed as for tier 1 securities. After a coupon has been deferred, it can be paid subsequently at a later point in time; however, this is subject to approval from the regulator. Also in contrast to tier 1, tier 2 securities may entail moderate incentives to redeem.
Tier 3 Tier 3 is made up of other forms of capital that are not included in tier 1 and 2. From tier 2 to tier 3, the rules again become a little less strict, but some of the necessary tier 1 and 2 characteristics are still required to a lesser extent. This means that tier 3 also needs to provide for some degree of subordination in case of a wind-up and is free of encumbrances. Furthermore, there are some restrictions on coupon payments and redemptions in case the SCR is breached. There are no restrictions on incentives to call a tier 3 callable bond. Finally, the minimum maturity for these instruments is three years.
These are only the most important rules on tier 1, 2 and 3 securities. If you have further questions regarding specific issuers or capital securities, please contact our colleagues in the financial sector credit research team.
17 December 2010
European Credit Views 8
Impact on each asset class Example: Life insurance There are several factors that will influence the asset allocation of an insurance company. As Solvency II is expected to become European law by October 2011 and come into effect by December 2012, we anticipate that insurers will start to align their asset allocation (and product variety) increasingly with Solvency II rules. We think this process will gain momentum during 2011.
It therefore is important to understand how asset class will be affected the most by the new rules. Hence, we conduct the following analysis on a typical, but hypothetical life insurer. Property and casualty (P&C) insurers have liabilities that are shorter in duration that are reflected in their asset duration and allocation (i.e., short-dated, high quality bonds). This mainly will result in a different capital requirement from the illiquidity and interest rates modules.
We firstly analyse the impact the standard formula will have and then take the next step and show how an internal model might look.
Furthermore, while capital rules certainly will have their impact, we believe that other economic factors will as well.
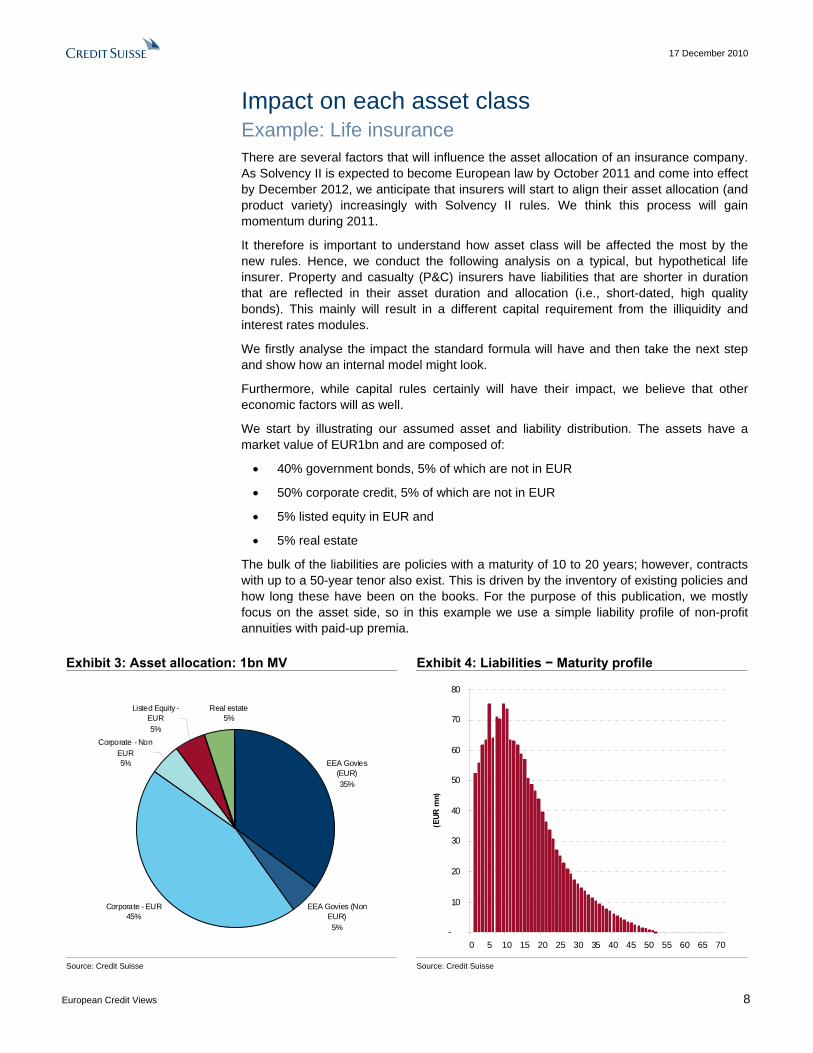
We start by illustrating our assumed asset and liability distribution. The assets have a market value of EUR1bn and are composed of:
• 40% government bonds, 5% of which are not in EUR
• 50% corporate credit, 5% of which are not in EUR
• 5% listed equity in EUR and
• 5% real estate
The bulk of the liabilities are policies with a maturity of 10 to 20 years; however, contracts with up to a 50-year tenor also exist. This is driven by the inventory of existing policies and how long these have been on the books. For the purpose of this publication, we mostly focus on the asset side, so in this example we use a simple liability profile of non-profit annuities with paid-up premia.
Exhibit 3: Asset allocation: 1bn MV Exhibit 4: Liabilities − Maturity profile
EEA Govies (EUR)35%
EEA Govies (Non EUR)5%
Corporate - EUR45%
Corporate - Non EUR5%
Listed Equity - EUR5%
Real estate5%
-
10
20
30
40
50
60
70
80
0 5 10 15 20 25 30 35 40 45 50 55 60 65 70
(EUR
mn)
Source: Credit Suisse Source: Credit Suisse

17 December 2010
European Credit Views 9
We will now illustrate the capital requirements that are due to each module:
Interest rates The interest rate module is going to be the biggest component of the required capital according to the standard formula. This is mainly due to the mismatch in duration between the asset and liability side.
In order to calculate the interest rate charge, two scenarios will be considered:
1. Rates go up 2. Rates go down3
In each scenario we calculate the impact on the PV of the liabilities of each maturity by discounting them with the respective part of the stressed interest rate curve4. Taking the sum over these arrives at the impact of each scenario on the liabilities. Similarly, the impact of each scenario on the PV of the assets is calculated and combining assets with liabilities results in the NAV change in each scenario. The worse of the two scenarios will then determine the capital charge. In this example we start with a present value of liabilities of 950mn.
3. If rates go up, the present value of the liabilities decreases by 116mn to 834mn. Similarly, the government and corporate bonds portfolio will fall by 69mn, less than the liabilities, which have a longer duration. The NAV will increase by 47mn.
4. If rates go down, the present value of the liabilities increases by 132mn to 1082mn. The bond portfolio will rise by 61mn, resulting in a NAV decrease of 71mn.
Clearly, the second case is the worse of the two; hence, the capital charge from the interest rate model will be 71mn. The below table is a summary:
Exhibit 5: Changes in NAV due to interest rate moves The first column is the PV of the liabilities for each scenario and the second is the resulting change in PV. The columns Swaps, Swaptions and Bonds show the PV change in each of those asset classes and the last column is the net of all.
IR Liab PV change in PV of Liab Swaps Swaptions Bonds Net Rates Up 834 -116 0.00 0.00 -69.1 -47 Rates Down 1,082 132 0.00 0.00 61.1 71 132.04 - - 61.09 71 Source: Credit Suisse
There are several important things to observe:
• The duration mismatch between assets and liabilities will be the strongest driver of the standalone interest rate capital requirement. Life and Reinsurers have long-duration liabilities that are not easy to match on the asset side; therefore, their interest rate charge will be determined by a “rates down” scenario. P&C insurers have shorter-duration liabilities and hence will be affected less.
• In this base case we haven’t taken into account the impact that hedges via interest rate swaps and swaptions would have. By entering into (long dated) receiver swaps one could mitigate the impact that both of the scenarios will have on the NAV and therefore decrease the interest rate capital charge. By using swaptions, and their asymmetric payoff, one can optimise the hedging efficiency and cost. Examples of how swaps and swaptions can be used to optimize the asset liability management (ALM) for this sample insurer can be found in the appendix.
3 The actual up and downward bumps are not parallel. We illustrate them in the appendix 4 The discount curve for the liabilities actually is the swaps curve minus 10bp plus an illiquidity premium that is dependent on the actual
policies in the liabilities. For non-profit annuity policies with paid-up premium, satisfying various conditions, 100% of the illiquidity premium is applied. For policies with profit participation, 75% of the illiquidity premium is applied, for other policies, 50% of the illiquidity premium is applied. Very long duration liability cash flows do not benefit from credit for an illiquidity premium; the cut-off point is 15 years.
17 December 2010
European Credit Views 10
The existence of optionalities on the liability side, as for example through policies with return guarantees or bonus rates, would warrant an even greater use of swaptions. We therefore think that the use of these instruments by insurance companies will increase with the advent of Solvency II.
Equity, Property and Foreign Exchange The capital charge due to equity and property risk is calculated by applying a shock to the market value of each. The shock for developed, market-listed equities is 39% and 25% for property. EM equity, Private Equity, Commodities, Hedge Funds, etc., suffer a 49% drop in market value under this module; however, our example insurer is not invested in these.
There also is a dampener between -10% and +10% that can be applied to these shocks. Currently it stands at 9%, resulting in the developed market equities only suffering a shock of 30%. The dampener does not apply to the property module.
The shock applied to the market value of the assets denominated in other currencies under the FX module is 25%. Here we assume that all FX exposures are perfectly hedged.
In our hypothetical insurance, 5% of the market value of assets is each in equities and property. The resulting capital requirements are 15mn and 12.5mn, respectively.
Exhibit 6: Capital charges due to equity, property and FX risk
Assets shock MV Standalone Capital Capital after diversification Global 30% 50 15.00 15.00 Other 40% - - Property 25% 50 12.50 FX 25% - - Source: Credit Suisse
The shock to the equity market value can be hedged via put options. These are very liquid instruments, whose use can be optimized by selecting a strike, maturity and underlying to minimize the capital charge. In this example we illustrate the impact of buying 100mn of an equity put option struck at 80% and a one-year maturity on the benchmark index (e.g., Euro Stoxx). The equity capital charge would stay at 15mn while the relief from the option is the difference between the value of the option in the 30% shock scenario minus the price at inception. Both can be calculated via the Black – Scholes option pricing formula. For an 80% put option with one year to maturity and an implied option volatility of 30%, the price at inception would be 4.04mn5. Leaving all parameters unchanged but reducing the spot price by 30% results in a price of the option of 15.77mn in the stress scenario. The resulting capital relief is 11.73mn (15.77mn-4.04mn) and the lower overall equity capital charge is 3.27mn (15mn-11.73mn).
Credit and sovereigns The credit module is likely to be the second biggest component of the required capital under the standard formula. The capital requirement under the spread risk module is based on the rating via a so-called “F” factor and the modified duration of the investment. Derivatives, like Credit Default Swaps (CDS), which are not part of a risk-mitigating strategy, give rise to a capital charge. These can be affected negatively by either a credit spread widening or tightening. Government bonds from a European Economic Area (EEA) country attract no capital. However sovereign CDS on these do. Current wide spreads on
5 These prices are model prices for the purpose of illustration. They may differ from current market prices.

17 December 2010
European Credit Views 11
some European government bonds therefore offer attractive returns (on the ones we see as par assets)6. On the other hand, they do introduce a fair amount of NAV volatility, which also needs to be considered in the investment decision. In a subsequent chapter we will analyse the credit module more rigorously, by introducing a potential implementation of an internal model.
The capital charge for a corporate bond can be calculated by multiplying the market value with the Duration and the “F” factor. For example a BBB-rated par bond with a duration of five years would incur a capital charge of EUR100 x 5y x 2.5% = EUR 12.5. In addition, caps and floors on the duration exist. The capital charge on the whole bond portfolio then is the sum of the capital charges for all of its constituents. For this example we use the rating distribution of the LEI Euro index to compute the capital charge. The market values and durations per maturity bucket used can be found in the appendix.
We summarise in the exhibit below.
Exhibit 7: Capital charges due to spread risk The first column specifies the “F” factor per rating. The maturity buckets Short, Medium, Long and Ultra Long are the product of the market value, the duration and the “F” factor for the respective rating class.
F 1-3 4-7 7-10 10+ Total Sovereign 0.00% 0.00 0.00 0.00 0.00 0.00 AAA Cov 0.60% 0.00 0.00 0.00 0.00 0.00 AAA 0.90% 0.14 0.20 0.23 0.29 0.87 AA 1.10% 1.13 1.30 1.20 0.52 4.15 A 1.40% 3.41 5.27 4.30 2.28 15.25 BBB 2.50% 2.90 4.70 2.80 1.85 12.26 BB 4.50% 0.00 0.00 0.00 0.00 0.00 B 7.50% 0.00 0.00 0.00 0.00 0.00 CCC 7.50% 0.00 0.00 0.00 0.00 0.00 Unrated 3.00% 0.00 0.00 0.00 0.00 0.00 32.53 Source: Credit Suisse
The overall capital charge adds up to 32.53mn as shown in Exhibit 7. Importantly, higher -rated bonds incurred charges substantially less than the lower-rated ones. Furthermore, long-dated bonds also suffer from a higher capital charge than shorter-dated ones. Hence, taken purely from a cost of capital perspective, issuers will be incentivized to invest in short-dated, highly rated bonds. We will investigate this issue in greater detail in a subsequent section, where we compare these findings with the results of an internal model and in relation to an economic rationale as opposed to one that is purely capital based.
Illiquidity premium The PV of the liabilities is calculated by discounting all cash flows with a discount curve that is the swap curve minus 10bp plus an Illiquidity premium, which is based on a reference bond index for each currency. In the illiquidity stress module this illiquidity premium is reduced by 65% so that the PV of the liabilities increases and the NAV is stressed. The difference between this increased value of the liabilities and the original value is the capital requirement due to the illiquidity module7.
6 We elaborate in more detail which sovereigns we mean by that in our publication: European Credit Views, Outlook and trades
2011, 3 December 2010 7 This obviously is equivalent to the difference in the stressed and non-stressed NAV, as assets are unaffected.
17 December 2010
European Credit Views 12
Diversification and total capital charge The total solvency capital due to market risk can actually be less than the sum of the totals of the individual modules. Insurers hence benefit from a diversification effect between the different asset classes. The aggregated charge from two market risks is
2122
21 2 σρσσσ ++
Where 1σ and 2σ are the capital charges from each module and ρ is the correlation between them.
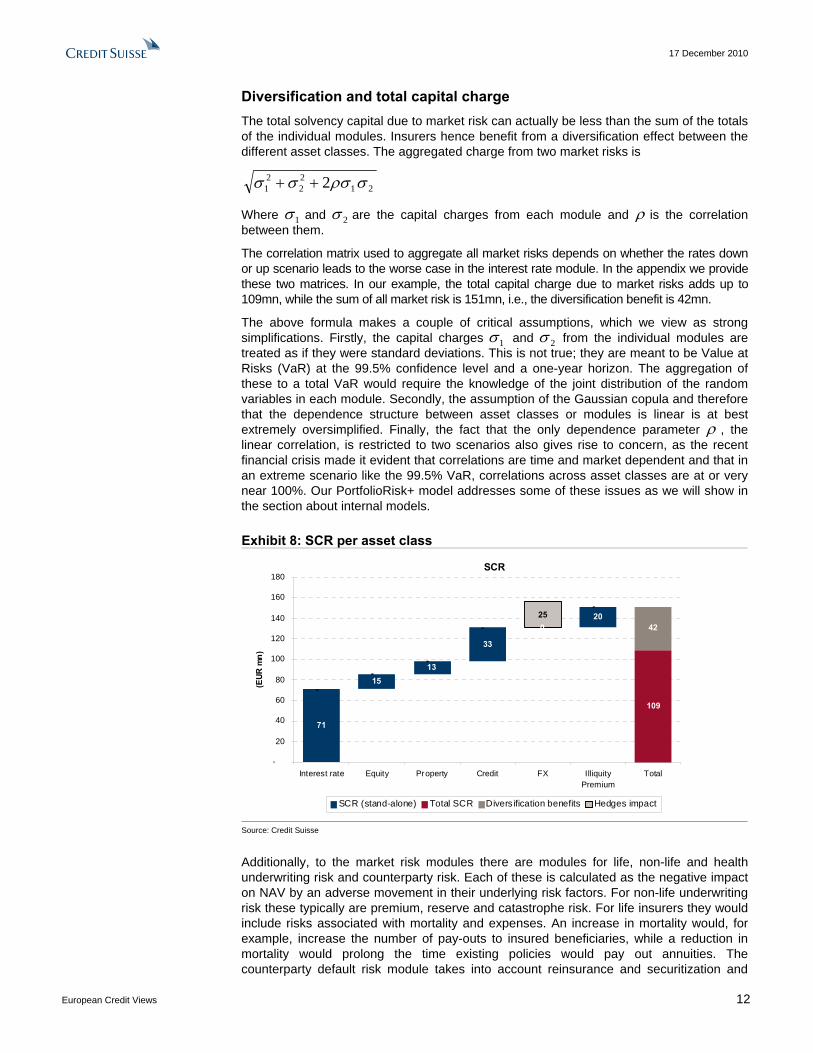
The correlation matrix used to aggregate all market risks depends on whether the rates down or up scenario leads to the worse case in the interest rate module. In the appendix we provide these two matrices. In our example, the total capital charge due to market risks adds up to 109mn, while the sum of all market risk is 151mn, i.e., the diversification benefit is 42mn.
The above formula makes a couple of critical assumptions, which we view as strong simplifications. Firstly, the capital charges 1σ and 2σ from the individual modules are treated as if they were standard deviations. This is not true; they are meant to be Value at Risks (VaR) at the 99.5% confidence level and a one-year horizon. The aggregation of these to a total VaR would require the knowledge of the joint distribution of the random variables in each module. Secondly, the assumption of the Gaussian copula and therefore that the dependence structure between asset classes or modules is linear is at best extremely oversimplified. Finally, the fact that the only dependence parameter ρ , the linear correlation, is restricted to two scenarios also gives rise to concern, as the recent financial crisis made it evident that correlations are time and market dependent and that in an extreme scenario like the 99.5% VaR, correlations across asset classes are at or very near 100%. Our PortfolioRisk+ model addresses some of these issues as we will show in the section about internal models.
Exhibit 8: SCR per asset class
SCR
71
1513
33
020
-
--
-25
-
109
42
-
20
40
60
80
100
120
140
160
180
Interest rate Equity Property Credit FX IlliquityPremium
Total
(EUR
mn)
SCR (stand-alone) Total SCR Divers ification benefits Hedges impact
Source: Credit Suisse
Additionally, to the market risk modules there are modules for life, non-life and health underwriting risk and counterparty risk. Each of these is calculated as the negative impact on NAV by an adverse movement in their underlying risk factors. For non-life underwriting risk these typically are premium, reserve and catastrophe risk. For life insurers they would include risks associated with mortality and expenses. An increase in mortality would, for example, increase the number of pay-outs to insured beneficiaries, while a reduction in mortality would prolong the time existing policies would pay out annuities. The counterparty default risk module takes into account reinsurance and securitization and

17 December 2010
European Credit Views 13
estimates the risk of a counterparty not fulfilling its obligation to pay for policies or other liabilities that have come due.
Furthermore, all the above risks are aggregated to a Basic Solvency Capital Requirement (SCR), by accounting for imperfect correlations and thereby allowing for diversification between business lines.
Finally, the total SCR is the Basic SCR plus (1) a separate operational risk category, which assesses the risk of inadequate processes and (2) an adjustment for the loss absorbency potential of technical provisions and deferred tax assets.
A rated credit currently looks attractive vs. equities, BBB does not In this section we compare the attractiveness of the asset classes of equity, property and credit by measuring their ratios of excess return over Solvency II capital. As discussed above, the equity and property charges are flat at 30% (for global equities including the dampener, without the dampener it would be 39%) and 25%, respectively. Our example portfolio consists of A-rated bonds with a duration of 5.1 and an average spread of 119bp. Thus, the capital charge for the spread module is 7.2%. The illiquidity premium module encourages a minimum investment into credit through its negative correlation, but has little impact beyond that. The rates module also depends on the size of the bond portfolio and its duration mismatch with the liabilities of the insurance (as we discussed in the rates module). In the case of a negative duration mismatch (longer-duration liabilities than assets) and no lapse risk, the worst-case scenario would be lower rates, which the bond portfolio would benefit from and which therefore decrease the rates capital charge. However in the opposite case the corporate bonds could increase the interest rate charge. We therefore ignore this module for the purpose of comparing credit with the other two asset classes.
In Exhibit 9 we show Iso8 curves, which highlight points of equal performance. They demonstrate that equities are more attractive than the credit portfolio, if their excess return is higher than 5%. Similarly, a 6.5% excess return is required, excluding the dampener effect and 4.2% for property investments. Our equity strategy colleagues confirm that the long-term average of equity excess returns historically has been between 4% and 4.5%9 and that their current estimate for the cyclical excess return over the next 12 months will be 4.3%. Under these assumptions, A-rated credit looks relatively attractive vs. equities.
Exhibit 9: Excess return vs. Solvency II charge for equity and credit
0%2%4%6%8%
10%12%14%16%18%
0.0% 0.4% 0.8% 1.2% 1.6% 2.0% 2.4% 2.8%
Average credit spread
Equi
ty e
xces
s re
turn
ove
r Li
bor
EquityEquity without dampenerProperty
Source: Credit Suisse
8 Equal performance 9 From an academic point of view one might argue that a long-term average of historical equity premia is skewed due to the
survivorship bias. 100 years ago, a benchmark portfolio most likely would have included German and Russian Imperial assets, whose eventual downturn would have considerably reduced the equity excess return. We leave it to the reader to decide what number is most relevant to him.

17 December 2010
European Credit Views 14
In addition, we compare the attractiveness of equity as an asset class against credit across different rating buckets in Exhibit 11. We assume a 4.3% excess return over the risk-free rate for equities. As above, the equity capital charge is 30% of the market value and the credit charge is the market value times the “F”-factor times the duration. For equities and credit to earn equal amounts of excess return per capital, the excess return for credit therefore needs to be greater than
DurationfactorF ×−×%30%5
Below we illustrate the benchmark spreads required for each rating bucket of the LEI index to meet this condition. We also include the cases without the dampener effect. Currently, only the A-rated bonds exhibit a spread that is higher than the benchmark spread of 103bp. AAA- and AA-rated bonds currently exhibit a spread that meets the equilibrium spread and would look attractive vs. equities, only if the dampener effect would not be applicable. At current spreads BBB-rated bonds look very rich in comparison to equities with a 4.3% excess return (without the dampener they barely do). BBB-rated credit hence needs to widen if insurers are the marginal buyer.
This obviously is dependent on spread levels and at wider levels this year, these rating buckets would have looked more attractive than equities, with or without the dampener. See table below.
Exhibit 10: Required credit spreads to outperform equity
Rating ASW spread Duration Equity SCR=30% Equity SCR=39% AAA 68.9 5.19 67 51 AA 82.0 5.18 82 63 A 119.0 5.11 103 79 BBB 145.1 5.02 180 138 Source: Credit Suisse
Exhibit 11: Credit vs. equity performance across rating buckets
0.0%
5.0%
10.0%
15.0%
20.0%
25.0%
30.0%
0.0% 0.4% 0.8% 1.2% 1.6% 2.0% 2.4% 2.8%
AAA AAA BBBAAA excl. damp. AA excl. damp.A excl. damp. BBB excl. damp.
Source: Credit Suisse

17 December 2010
European Credit Views 15
Impact on the asset class of credit Ratings and maturities of bonds Stress on lower-rated and longer-dated bonds is more punitive As we already mentioned in the previous section, the calculation of the capital charge for corporate bonds will be more onerous for lower-rated and longer-dated bonds. The reason for this is twofold:
1. The higher “F” factors for lower-rated bonds
2. The scaling of the “F” factor with the duration (and the Market Value)
The second point is actually very interesting, as market prices of bonds fall, their duration is reduced, too, both resulting in lower capital charges. In Exhibits 12 and 13 we show the time series of the average prices of several subsections of the Liquid Eurobond Index (LEI), based on these there are two dates on which we will investigate the capital charges:
1. 21 October 2008, when the market was near or at its low, and
2. 2 September 2010, when market prices were near their recent highs.
Exhibit 12: Average market prices per rating Exhibit 13: Average market prices per tenor
80
85
90
95
100
105
110
115
Feb-
06
May
-06
Aug-
06
Nov-
06
Feb-
07
May
-07
Aug-
07
Nov-
07
Feb-
08
May
-08
Aug
-08
Nov
-08
Feb-
09
May
-09
Aug
-09
Nov
-09
Feb-
10
May
-10
Aug-
10
Nov
-10
BBBAAAAAA
80
85
90
95
100
105
110
115N
ov-0
5
Feb-
06
May
-06
Aug
-06
Nov-
06
Feb-
07
May
-07
Aug-
07
Nov
-07
Feb-
08
May
-08
Aug
-08
Nov
-08
Feb-
09
May
-09
Aug-
09
Nov-
09
Feb-
10
May
-10
Aug-
10
Nov
-10
"7-10""4-7""1-4"
Source: Credit Suisse Source: Credit Suisse
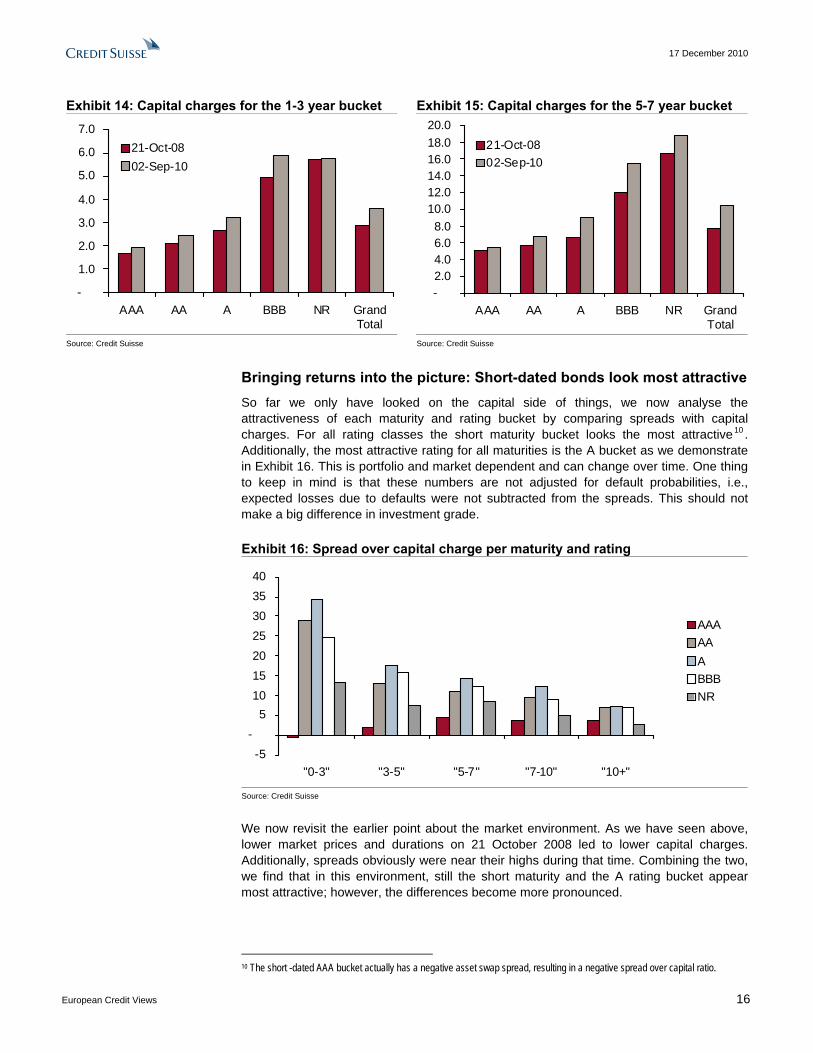
Below we demonstrate the impact on the capital charges per rating and maturity bucket for those two dates. As we can see, the capital charges in the weaker market on 21 October 2008 were less strict. The impact is not very significant and increases with lower ratings. This could be intentional to soften a vicious cycle. When bond prices have fallen already, it could be desirable to loosen the capital charges in order to not force insurers to sell bonds and fuel a falling market.
17 December 2010
European Credit Views 16
Exhibit 14: Capital charges for the 1-3 year bucket Exhibit 15: Capital charges for the 5-7 year bucket
-
1.0
2.0
3.0
4.0
5.0
6.0
7.0
AAA AA A BBB NR GrandTotal
21-Oct-0802-Sep-10
-2.04.06.08.0
10.012.014.016.018.020.0
AAA AA A BBB NR GrandTotal
21-Oct-0802-Sep-10
Source: Credit Suisse Source: Credit Suisse
Bringing returns into the picture: Short-dated bonds look most attractive So far we only have looked on the capital side of things, we now analyse the attractiveness of each maturity and rating bucket by comparing spreads with capital charges. For all rating classes the short maturity bucket looks the most attractive 10 . Additionally, the most attractive rating for all maturities is the A bucket as we demonstrate in Exhibit 16. This is portfolio and market dependent and can change over time. One thing to keep in mind is that these numbers are not adjusted for default probabilities, i.e., expected losses due to defaults were not subtracted from the spreads. This should not make a big difference in investment grade.
Exhibit 16: Spread over capital charge per maturity and rating
-5-
510152025303540
"0-3" "3-5" "5-7" "7-10" "10+"
AAAAAABBBNR
Source: Credit Suisse
We now revisit the earlier point about the market environment. As we have seen above, lower market prices and durations on 21 October 2008 led to lower capital charges. Additionally, spreads obviously were near their highs during that time. Combining the two, we find that in this environment, still the short maturity and the A rating bucket appear most attractive; however, the differences become more pronounced.
10 The short -dated AAA bucket actually has a negative asset swap spread, resulting in a negative spread over capital ratio.

17 December 2010
European Credit Views 17
Exhibit 17: Spread over capital charge in stressed markets: 21 October 2008
-
20
40
60
80
100
120
140
"0-3" "3-5" "5-7" "7-10" "10+"
AAAAAABBBNR
Source: Credit Suisse
Because insurance companies’ corporate credit portfolios entail mostly investment grade credits, we have focused so far on high grade. However, high yield investments also look attractive from a spread to capital risk charge point of view relative to IG. Here, there is less dispersion amongst the rating buckets – CCC and lower ratings look relatively attractive due to their equal capital charge to single Bs – however, maturity wise the short bucket looks most attractive again. What is quite remarkable is the high ratio of spread over capital charge for the non-rated bonds. These only suffer a 3% “F” factor, which is lower than for any of the high yield ratings. We don’t anticipate a huge amount of HY bonds to be bought by insurers, nor do we think that the relative attractiveness of non-rated bonds will have a big impact, but we think that the discussed Solvency II charges will create some interest from insurers with the capability to trade high yield bonds, especially in the short maturity space.
An additional factor that will matter for the evolvement of the capital charge of a given credit portfolio is rating migrations. Downgrades of parts of a portfolio can substantially increase the capital charge. Particularly for high yield bonds the incremental capital charge is much stronger under QIS5.
Exhibit 18: Spread over capital charge in HY
-
20
40
60
80
100
120
140
160
"0-3" "3-5" "5-7" "7-10" "10+"
BBB-BBBCCCNR
Source: Credit Suisse
17 December 2010
European Credit Views 18
Derivatives vs. their corporate bond counterpart Stress on credit derivatives is more punitive As mentioned in the previous section, there is a difference in the way the capital charge is computed for credit derivatives and their underlying corporate bonds.
On the one hand, it matters if the credit derivative is used to hedge an existing bond position or not. In the former case the package of the underlying and its hedge will assume a reduced capital charge, but potentially give rise to a counterparty risk charge.
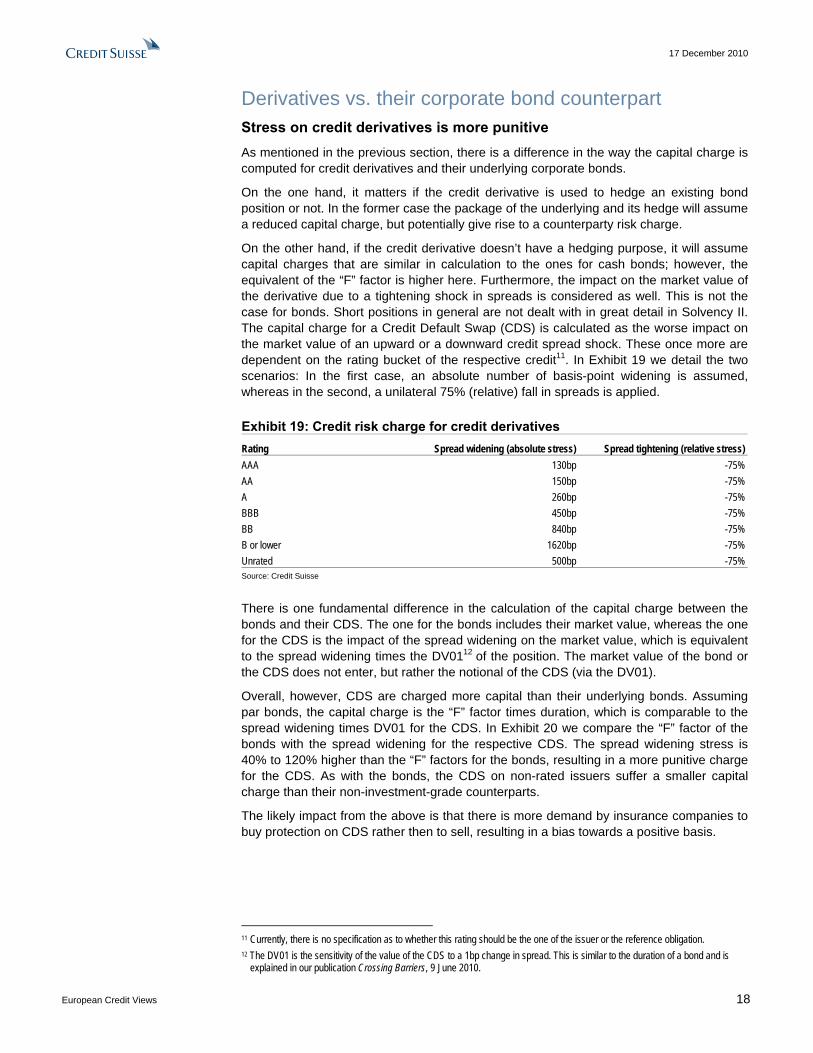
On the other hand, if the credit derivative doesn’t have a hedging purpose, it will assume capital charges that are similar in calculation to the ones for cash bonds; however, the equivalent of the “F” factor is higher here. Furthermore, the impact on the market value of the derivative due to a tightening shock in spreads is considered as well. This is not the case for bonds. Short positions in general are not dealt with in great detail in Solvency II. The capital charge for a Credit Default Swap (CDS) is calculated as the worse impact on the market value of an upward or a downward credit spread shock. These once more are dependent on the rating bucket of the respective credit11. In Exhibit 19 we detail the two scenarios: In the first case, an absolute number of basis-point widening is assumed, whereas in the second, a unilateral 75% (relative) fall in spreads is applied.
Exhibit 19: Credit risk charge for credit derivatives
Rating Spread widening (absolute stress) Spread tightening (relative stress) AAA 130bp -75% AA 150bp -75% A 260bp -75% BBB 450bp -75% BB 840bp -75% B or lower 1620bp -75% Unrated 500bp -75% Source: Credit Suisse
There is one fundamental difference in the calculation of the capital charge between the bonds and their CDS. The one for the bonds includes their market value, whereas the one for the CDS is the impact of the spread widening on the market value, which is equivalent to the spread widening times the DV0112 of the position. The market value of the bond or the CDS does not enter, but rather the notional of the CDS (via the DV01).
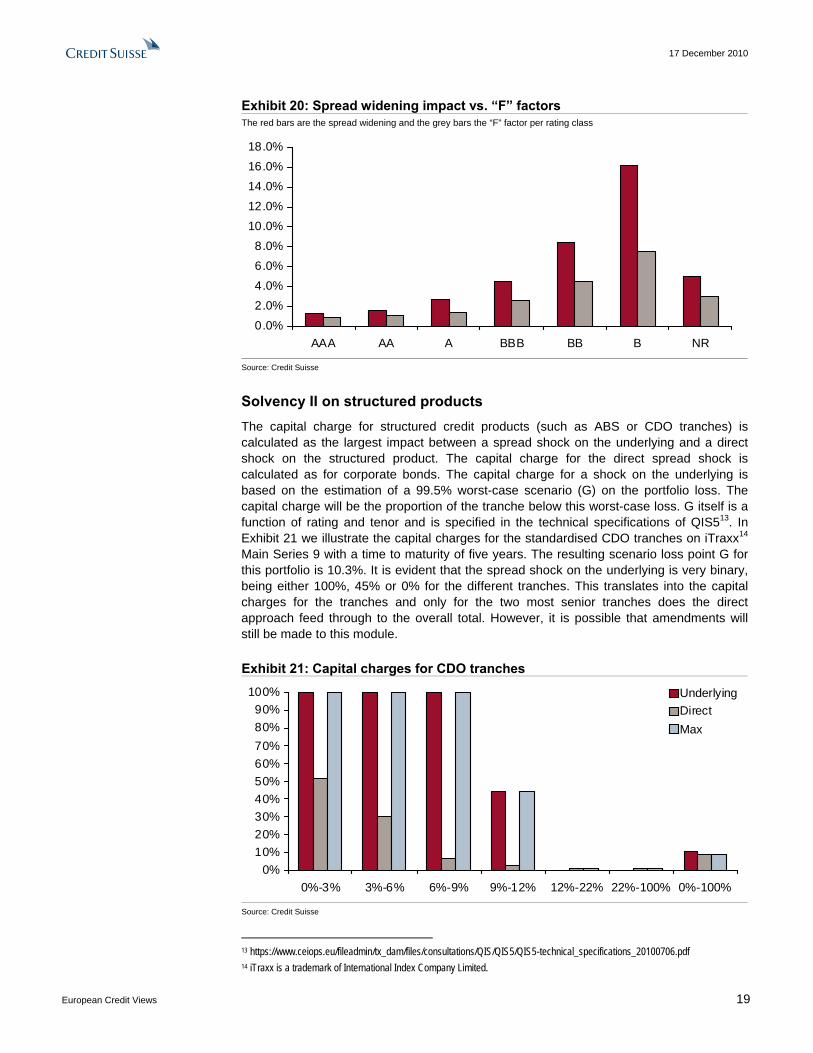
Overall, however, CDS are charged more capital than their underlying bonds. Assuming par bonds, the capital charge is the “F” factor times duration, which is comparable to the spread widening times DV01 for the CDS. In Exhibit 20 we compare the “F” factor of the bonds with the spread widening for the respective CDS. The spread widening stress is 40% to 120% higher than the “F” factors for the bonds, resulting in a more punitive charge for the CDS. As with the bonds, the CDS on non-rated issuers suffer a smaller capital charge than their non-investment-grade counterparts.
The likely impact from the above is that there is more demand by insurance companies to buy protection on CDS rather then to sell, resulting in a bias towards a positive basis.
11 Currently, there is no specification as to whether this rating should be the one of the issuer or the reference obligation. 12 The DV01 is the sensitivity of the value of the CDS to a 1bp change in spread. This is similar to the duration of a bond and is
explained in our publication Crossing Barriers, 9 June 2010.
17 December 2010
European Credit Views 19
Exhibit 20: Spread widening impact vs. “F” factors The red bars are the spread widening and the grey bars the “F” factor per rating class
0.0%2.0%4.0%6.0%8.0%
10.0%12.0%14.0%16.0%18.0%
AAA AA A BBB BB B NR
Source: Credit Suisse
Solvency II on structured products The capital charge for structured credit products (such as ABS or CDO tranches) is calculated as the largest impact between a spread shock on the underlying and a direct shock on the structured product. The capital charge for the direct spread shock is calculated as for corporate bonds. The capital charge for a shock on the underlying is based on the estimation of a 99.5% worst-case scenario (G) on the portfolio loss. The capital charge will be the proportion of the tranche below this worst-case loss. G itself is a function of rating and tenor and is specified in the technical specifications of QIS513. In Exhibit 21 we illustrate the capital charges for the standardised CDO tranches on iTraxx14 Main Series 9 with a time to maturity of five years. The resulting scenario loss point G for this portfolio is 10.3%. It is evident that the spread shock on the underlying is very binary, being either 100%, 45% or 0% for the different tranches. This translates into the capital charges for the tranches and only for the two most senior tranches does the direct approach feed through to the overall total. However, it is possible that amendments will still be made to this module.
Exhibit 21: Capital charges for CDO tranches
0%10%20%30%40%50%60%70%80%90%
100%
0%-3% 3%-6% 6%-9% 9%-12% 12%-22% 22%-100% 0%-100%
UnderlyingDirectMax
Source: Credit Suisse
13 https://www.ceiops.eu/fileadmin/tx_dam/files/consultations/QIS/QIS5/QIS5-technical_specifications_20100706.pdf 14 iTraxx is a trademark of International Index Company Limited.
17 December 2010
European Credit Views 20
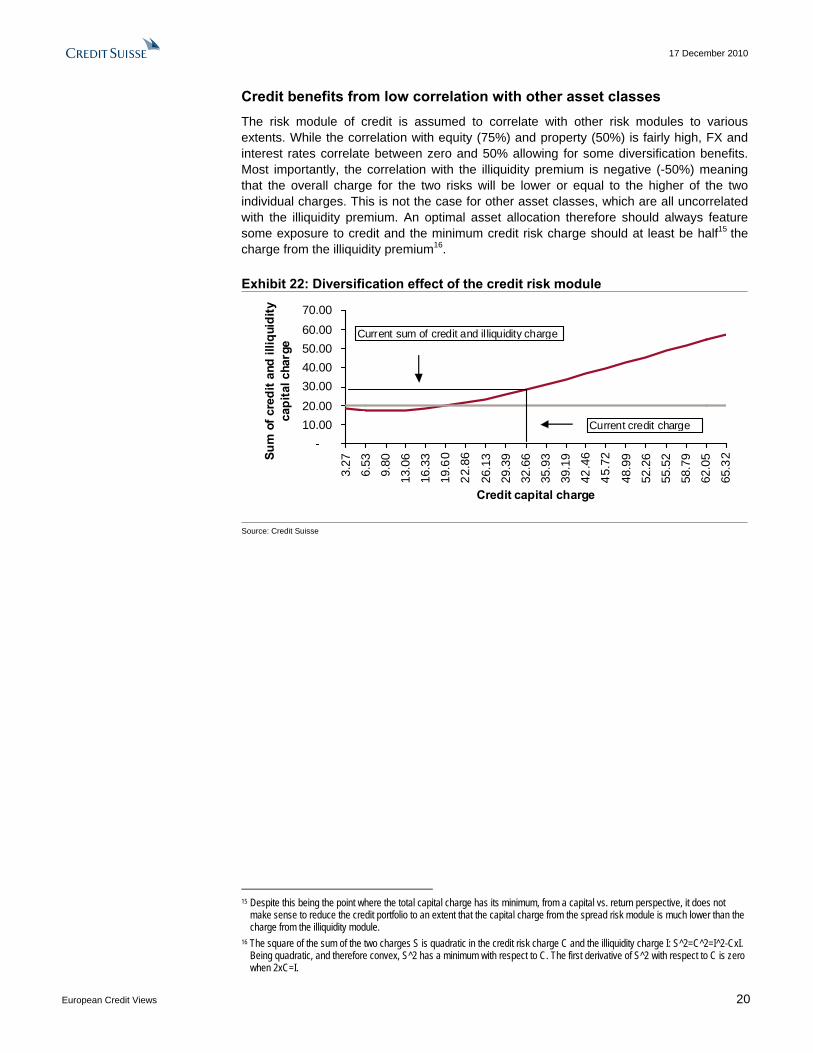
Credit benefits from low correlation with other asset classes The risk module of credit is assumed to correlate with other risk modules to various extents. While the correlation with equity (75%) and property (50%) is fairly high, FX and interest rates correlate between zero and 50% allowing for some diversification benefits. Most importantly, the correlation with the illiquidity premium is negative (-50%) meaning that the overall charge for the two risks will be lower or equal to the higher of the two individual charges. This is not the case for other asset classes, which are all uncorrelated with the illiquidity premium. An optimal asset allocation therefore should always feature some exposure to credit and the minimum credit risk charge should at least be half15 the charge from the illiquidity premium16.
Exhibit 22: Diversification effect of the credit risk module
-10.0020.0030.0040.0050.0060.0070.00
3.27
6.53
9.80
13.0
616
.33
19.6
022
.86
26.1
329
.39
32.6
635
.93
39.1
942
.46
45.7
2
48.9
952
.26
55.5
258
.79
62.0
565
.32
Credit capital charge
Sum
of c
redi
t and
illiq
uidi
ty
capi
tal c
harg
e
Current sum of credit and il liquidity charge
Current credit charge
Source: Credit Suisse
15 Despite this being the point where the total capital charge has its minimum, from a capital vs. return perspective, it does not
make sense to reduce the credit portfolio to an extent that the capital charge from the spread risk module is much lower than the charge from the illiquidity module.
16 The square of the sum of the two charges S is quadratic in the credit risk charge C and the illiquidity charge I: S^2=C^2=I^2-CxI. Being quadratic, and therefore convex, S^2 has a minimum with respect to C. The first derivative of S^2 with respect to C is zero when 2xC=I.
17 December 2010
European Credit Views 21
Internal models Internal models might take into account correlations and curve risk, resulting in a need to diversify away from banks and financials Internal models need to follow the Solvency II principles and must satisfy several tests for approval. One of the most recent publications relates to the pre-application process for internal model approval17.
The standard formula, as it has been introduced above, is a good start towards assessing the mark-to-market risk of a credit investment. Some insurers, however, might want to fine tune their credit portfolio spread risk. There are two crucial aspects such a model should take into account:
1. Concentration in the portfolio
o Through over-proportional exposures in a few single issuers o Through over-proportional exposure in a certain sector o Through exposure to names and sectors that correlate very strongly
2. Curve risk
o In a long only (or mainly long) portfolio, the 99.5% worst case is most likely a stark widening of spreads across the board. This will likely go hand in hand with a flattening and inversion of the credit curves. DV01 neutral curve positions (long and short risk in different maturities of the same issuer) should therefore attract a risk charge.
The former introduces the concept of correlations 18 . If the credits in a portfolio are (positively) correlated, the tail risk of the portfolio (for example measured as the 99.5% worst-case loss or VaR) will increase drastically. In other words, the higher the average correlation, the higher the 99.5% VaR. This introduces a well known problem in practice. In a portfolio of n credits, there are n x (n-1)/2 correlations to determine. One can see how this becomes a problem fairly quickly as for n=100, one has 4950 correlations to deal with. This can be circumvented by introducing factors, which we assume to be sectors here. Each credit correlates with the sector it is in and the different sectors correlate also with each other. This way, the dimensionality problem is greatly resolved and issuer and sector concentrations can be measured effectively.
The latter is explained best by an example. If the investor holds $10mn in a two-year bond and hedged the exposure by having bought a five-year CDS in a DV01 neutral way19, then a parallel widening of the credit curve is not going to affect the P&L (assuming the basis stays fixed, too). However, a 99.5% worst-case scenario should also take into account the fact that the curve might flatten and the trade could lose money. This is illustrated in Exhibits 23 and 24, which show steep average credit curves in a benign scenario as in June 2007 and a stressed scenario with flat and inverted credit curves as seen in November 2008.
While an internal model obviously should take into account a whole array of aspects, we think the two previously mentioned will likely be part of internal solutions. We therefore employ our in-house portfolio risk model, PortfolioRisk+ (PR+) 20 , to assess what 17 https://www.ceiops.eu/fileadmin/tx_dam/files/consultations/consultationpapers/CP80/CEIOPS-DOC-76-10-Guidance-pre-
application-internal-models.pdf 18 Actually, it introduces the concept of dependencies. Correlations just measure linear dependencies and therefore do not capture
non-linear effects like for example tail dependence. Since the concept of correlation, however, is commonly far better understood, we shall use it henceforth.
19 I.e.. they bought less than $10mn protection, namely $10mn times the ratio of the DV01s of the two maturities 20 To find out more about PortfolioRisk+, contact your sales representative or visit https://www.credit-
suisse.com/investment_banking/research/en/portfolio_risk.jsp

17 December 2010
European Credit Views 22
conclusions insurers might come to, if they were to implement the above. This is important to the market, as these conclusions might lead to behavior that could influence the market in a technical way.
Before we compare the results of PR+ with the Solvency II capital charges, there are a couple of points to keep in mind:
o The inputs into PR+ are market prices rather than ratings. They therefore entail risk premia21. We address this by dividing the spread levels by a factor of three22.
o The Solvency II capital charges are from a “through the cycle” perspective, while the PR+ results are more “point in time”. In a low spread and risk environment the PR+ numbers will likely be lower than in a very volatile high spread scenario23.
o In the standard Solvency II formula, the inputs are ratings, while in PR+ they are spreads. While there is some relationship between the two, it is far from one to one. As illustrated in Exhibits 23 and 24, spreads have a wide possible range in each rating class. This makes a ratings-based approach somewhat questionable.
Exhibit 23: Average bond curves in a benign environment: 10 June 2007
Exhibit 24: Average bond curves in a stressed environment: 10 November 2008
-40
-20
0
20
40
60
80
100
1-4 4-7 7-10 10PLUS
AAA Bucket AA BucketA Bucket BBB Bucket
0
50
100
150
200
250
300
350
400
450
500
1-4 4-7 7-10 10PLUS
AAA Bucket AA Bu cketA Bucket BBB Bucket
Source: Credit Suisse Source: Credit Suisse
Credit portfolios of insurers usually consist almost exclusively of investment grade credits and have a large bias towards financials. We approximate such a portfolio by analysing the Liquid Eurobond (LEI) index, which has a very similar asset allocation. We have also performed the same analysis on the iBoxx Index and have come to the same conclusions. Before we start the risk calculations, it is worth noting the concentrations in this portfolio.
o 50% of the total index exposure is in the top 32 names (total of 216 issuers) o The top five issuers contribute 15% of the portfolio notional o Rabobank is the single name with the highest nominal exposure in the index,
being allocated more than nine times the average exposure in the index o 41% of the exposure of the index is in banks, 3% in insurance and another 8% in
other financials o A total of 920mn is invested
21 From a mathematical perspective, it operates in the risk neutral probability measure rather than the real world measure. 22 The estimation of the risk premium is difficult and seems subjective, but there are several publications, e.g., Linking credit risk
premia to the equity premium, T. Berg and C. Kaserer, January 2008, which suggests a factor of 3. 23 For a comparison how the PR+ risk of a portfolio of credits evolves over time please see our publication, The fear factor - What
market prices tell us about systemic risk, 27 September 2010 and its frequent updates.
17 December 2010
European Credit Views 23
We now investigate how an internal model like PortfolioRisk+ would assess this portfolio.
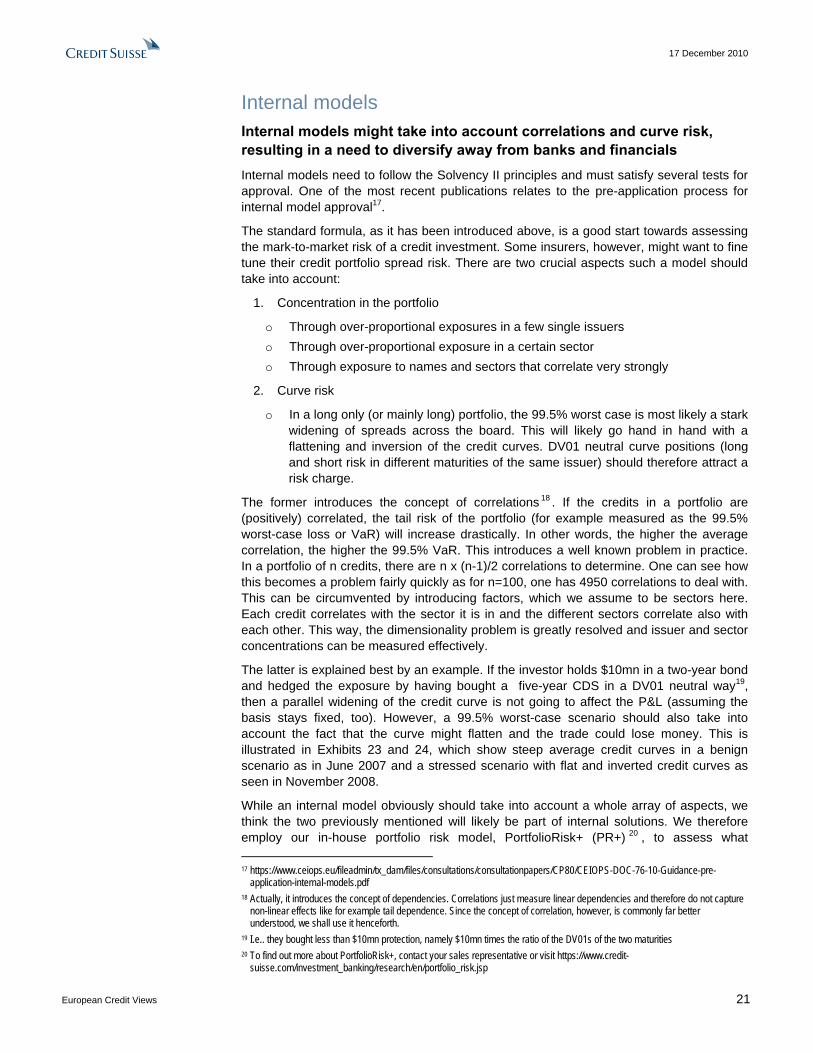
The headline one-year 99.5% VaR is calculated to be 154mn, which equals 16.7% of the notional. This sounds very high, but one should keep in mind that it is not a loss due to default, but MtM risk at an extremely high confidence level, with no discount given by misapplication of the Gaussian approximation, on which PR+ specifically does not rely24. Exhibits 25 and 26 highlight the top ten risk contributors in terms of single names and sectors. Unsurprisingly, the number one risk contributor is RABOBK, which is AAA-rated and more importantly currently has a tight CDS spread of 87bp, but by far has the highest single-name exposure in the index. Furthermore, four of the top five names in the exposure list feature in the top ten risk list. In addition, the banks are identified as by far the highest risk-contributing sector. Hence it makes sense that all but one of the highest risk contributors are banks. GE only ranks that high because of its high exposure and moderate correlation with the financials. This is a classic example of how a portfolio that is heavily biased towards “good” financial names is penalized for exactly that under the tail risk measure, which measures an unlikely, but extremely painful worst case. We therefore expect insurance companies with internal models to diversify away from banks and financial names.
Exhibit 25: Top single-name risk contributors Exhibit 26: Top sector risk contributors
0.0 2.0 4.0 6.0 8.0
RABOBKISPIM
GSGE
CBACR
RBSMS
SOCGENBAC
0 20 40 60 80 100
Bank
Finance
Manufacturing
Gas Pipelines
Basic industries
Healthcare
Electric utili ties
Consumer products
Source: Credit Suisse Source: Credit Suisse
Given our explanations from above, and the high concentration in this portfolio, it does not make sense to compare the PR+ results outright with the ones from the standard Solvency formula. To make them a little more comparable, we show the risk contribution over exposure, which is the same as the 99.5% worst-case loss as a percent of exposure across sectors. Exhibit 27 illustrates this for the sub-universe of A-rated bonds (the cross-sections for AA- or BBB-rated bonds look very similar). As we can see, the sectors that are most affected by the concentration of risk have far higher charges than under the standard formula. Other sectors like Healthcare or Gas and Pipelines, which feature further down in the highest sector risk list, have very similar capital charges to the ones from the standard formula.
24 The spread distributions of single-name credits can be heavily skewed and fat tailed. The normal distribution does not take this
into account. We capture these aspects of credit spreads with our in-house CUSP model, by employing jumps in the firm value process. PortfolioRisk+ reflects this on a portfolio level, as CUSP is one of its primary inputs.

17 December 2010
European Credit Views 24
Exhibit 27: Risk contribution per exposure
Sector "0-3" "3-5" "5-7" "7-10" "10+" Grand Total Bank 26.0% 28.1% 29.4% 35.6% 32.4% 29.1% Finance 18.6% 21.9% 19.7% 32.5% 24.7% 21.0% Manufacturing 12.4% 15.1% 17.0% 19.0% 30.1% 14.7% Electric Utilities 9.0% 9.8% 12.2% 10.7% Technology 10.6% 8.4% 11.6% 13.6% 11.2% Insurance 8.4% 8.7% 14.7% 15.9% 10.5% Basic Industries 9.3% 8.6% 14.9% 9.8% Gas Pipelines 4.7% 6.1% 7.4% 7.7% 9.5% 6.8% Sovereign 6.2% 7.6% 6.9% Healthcare 4.8% 4.8% 8.0% 6.7% 9.3% 6.4% Consumer products
5.5% 6.1% 4.7% 5.6%
Energy 3.1% 4.3% 4.0% Source: Credit Suisse
The aforementioned curve risk also plays an important role. Curve flattening and inversion are key contributors to the risk in this portfolio. Similar to above, the curve inversion is most pronounced in the sectors that suffer from concentration risk. Intuitively, sectors like Bank and Finance, experience the most dramatic widening and therefore are the most likely to flatten and invert in this scenario. Sectors that are more sensible to compare to the Solvency II rules are Gas and Pipelines and Healthcare, as mentioned above. For example their A-rated cross sections widen on average the same as assigned by the “F” factor for that rating (1.4%); however, looking across maturity buckets, the front end widens substantially more than the back end, giving rise to curve-flattening risk, as shown in Exhibit 28. While a curve flattening is likely due to the (strong) widening of spreads, the maturity profile of the exposures in these sectors also contributes to the risk of a flattening. As shown in Exhibit 29 the front-end maturities are significantly overweight in comparison to those in the back end.
Exhibit 28: Spread widening per maturity bucket under risk scenario Spread widening in bp per maturity bucket in the Gas and Pipeline and Healthcare sectors that are A rated.
Sector Rating Bucket "0-3" "3-5" "5-7" "7-10" "10+" Grand Total Gas Pipelines A 224 162 125 83 64 139 Healthcare A 216 111 129 74 71 137 Source: Credit Suisse
Exhibit 29: Exposures per maturity bucket Exposures in EUR mn per maturity bucket in the Gas and Pipeline and Healthcare sectors that are A rated.
Sector Rating Bucket "0-3" "3-5" "5-7" "7-10" "10+" Grand Total Gas Pipelines A 14 23 14 14 8 73 Healthcare A 16 6 9 2 6 39 Grand Total 30 30 23 16 14 113 Source: Credit Suisse
Simple hedges can reduce the risk Under the standard formula, the risk-mitigating benefits are heavily affected by the basis risk between credits and their hedges. Below we continue to follow the internal model approach.
We now illustrate how two simple hedges can reduce the overall risk of the portfolio and increase its diversification. We simply address the highest concentration in single names
17 December 2010
European Credit Views 25
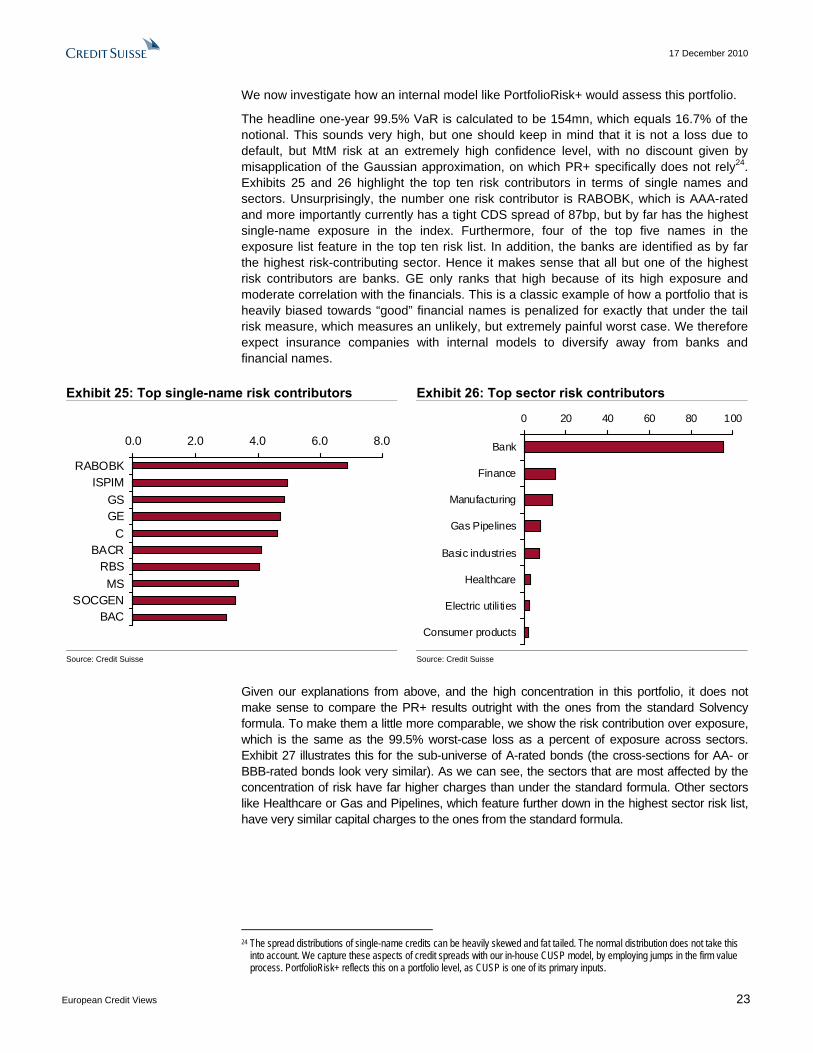
and sectors and reduce them by buying 15mn of CDS protection on RABOBK and 300mn on the iTraxx Financial Senior Index. The results are
• Buying 15mn of CDS protection on Rabobank reduces the total VaR by 2mn to 152mn
• Adding 300mn of protection on Financial Senior further reduces the risk by 54mn to 98mn, a reduction of more than a third of the original portfolio risk
• Rabobank no longer is the highest risk contributor, it now features in the list at number 5
• The risk among the highest contributing single names now is more homogeneously distributed, but further improvement could be made by buying protection on GE
• Banks still are the highest risk-contributing sector, but their risk contribution has decreased from nearly 100mn to less than 30mn. Other sectors consequently marginally increase in risk contribution, resulting in a more equally distributed risk contribution across sectors. However there still is room for improvement
Exhibit 30: Top single-name risk contributors after hedging
Exhibit 31: Top sector risk contributors after hedging
0.0 1.0 2.0 3.0 4.0 5.0
GEISPIM
GSC
RABOBKRBS
BACREDFMS
SOCGEN
0 10 20 30
Bank
Finance
Gas Pipelines
Manufacturing
Basic industries
Healthcare
Electric utili ties
Consumer products
Source: Credit Suisse Source: Credit Suisse
17 December 2010
European Credit Views 26
Credit risk management strategies Solvency II capital can be reduced significantly by buying payer swaptions or senior index tranches In this section we highlight how instruments like indices, swaptions and tranches can be used to efficiently hedge systemic risk in a credit portfolio. Except for indices, most of these instruments are not covered under the standard formula. However an internal model could give rise to capital relief due to the recognition of spread risk reduction via these instruments.
Indices The iTraxx indices consist of the 125 most liquidly traded CDS on European corporate (and sovereign) debt25. The indices are the most liquid instrument traded in the credit markets and therefore are an efficient tool for the investor to hedge systemic spread risk. They therefore are a natural choice for an insurance company to reduce its capital charge from the spread risk module. Most of the CDS indices trade in four maturities: 3-, 5-, 7- and 10-year. The financial senior and subordinated indices only have 5- and 10-year maturities. By far the most liquid point on the curve is the 5-year maturity. A hedge via a CDS index is fully recognized under the standard formula in Solvency II if there is no “material basis risk”. Material basis risk needs to be reserved for in a prudent way26. An internal model would likely provide more flexibility in the (partial) mitigation of the spread risk module.
Swaptions A payer (receiver) CD swaption gives the purchaser the right but not the obligation, to buy (sell) CDS protection on the underlying at maturity of the option at the strike agreed at inception of the trade. In exchange for this the option buyer pays a premium to the option seller. The buyer (seller) of a CD payer swaption makes money if at maturity of the contract, the CDS spread of the underlying is higher (lower) than the strike. However, the buyer of an option does not have to wait until maturity, the option can be sold before its maturity, resulting in a MtM P&L that mainly is a function of spread of the underlying, volatility and time to maturity.
The most liquid underlying is the five-year maturity of the CDS indices, e.g., iTraxx Main 5-year and the option maturity dates are standardized to: 20 March, June, Sep and Dec. The most liquid options have maturities up to six months and exist on a range of strikes27.
Since insurers are interested in hedging a 99.5% worst-case scenario under Solvency II, CD payer swaptions with high strikes are a natural choice. These essentially hedge scenarios in which the underlying portfolio makes large MtM losses due to market-wide, i.e., systemic spread, widening. In such scenarios out-of-the money (OTM) payer swaptions would pay out an offsetting amount to the portfolio loss, while giving rise to costs that are lower than for the underlying index positions. Unfortunately, swaptions with a one-year maturity do not trade as liquidly. However, swaptions with a shorter maturity give rise to a capital charge relief that is proportional to the shorter maturity, e.g., an option with a time to maturity of six months will give half the benefit.
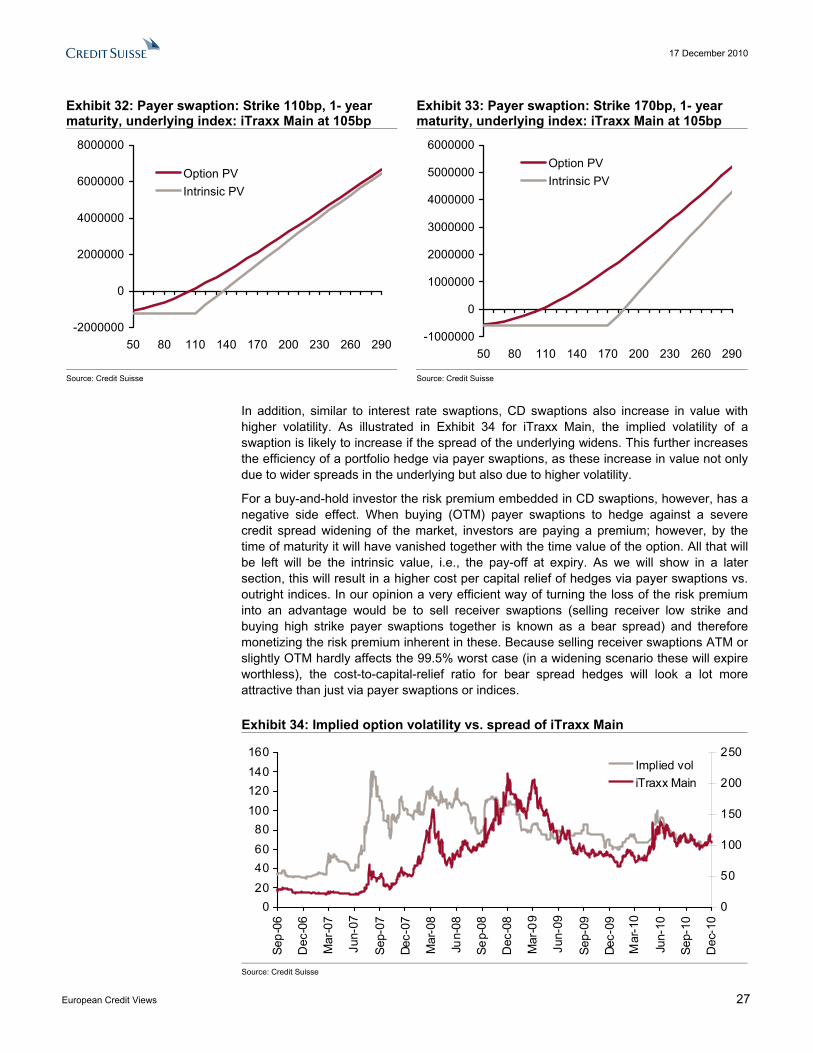
Exhibits 32 and 33 graphically illustrate the pay-offs at maturity of a 110bp and 170bp one-year payer swaption. They also show the PV of the option at inception. While the pay-offs differ for spreads of the underlying near the strikes, they are very similar in the tail of the distribution, i.e. at the right of the charts where iTraxx Main is as wide as 290bp. From current levels on iTraxx Main around 105bp, a 99.5% worst case would likely be even wider. Hence, from a Solvency II perspective, it makes sense to buy far OTM payer swaptions with a six-month, or if possible, one-year maturity. However historically, spreads have never been that wide, which highlights the need for a model to predict unobserved tail events. We will come back to this point in a later section.
25 For more information on CDS indices, please contact the Credit Suisse credit strategy team. 26 QIS5 technical specifications SCR 12.14 27 For more details about CD swaptions, please contact the Credit Suisse credit strategy ream.
17 December 2010
European Credit Views 27
Exhibit 32: Payer swaption: Strike 110bp, 1- year maturity, underlying index: iTraxx Main at 105bp
Exhibit 33: Payer swaption: Strike 170bp, 1- year maturity, underlying index: iTraxx Main at 105bp
-2000000
0
2000000
4000000
6000000
8000000
50 80 110 140 170 200 230 260 290
Option PVIntrinsic PV
-1000000
0
1000000
2000000
3000000
4000000
5000000
6000000
50 80 110 140 170 200 230 260 290
Option PVIntrinsic PV
Source: Credit Suisse Source: Credit Suisse
In addition, similar to interest rate swaptions, CD swaptions also increase in value with higher volatility. As illustrated in Exhibit 34 for iTraxx Main, the implied volatility of a swaption is likely to increase if the spread of the underlying widens. This further increases the efficiency of a portfolio hedge via payer swaptions, as these increase in value not only due to wider spreads in the underlying but also due to higher volatility.
For a buy-and-hold investor the risk premium embedded in CD swaptions, however, has a negative side effect. When buying (OTM) payer swaptions to hedge against a severe credit spread widening of the market, investors are paying a premium; however, by the time of maturity it will have vanished together with the time value of the option. All that will be left will be the intrinsic value, i.e., the pay-off at expiry. As we will show in a later section, this will result in a higher cost per capital relief of hedges via payer swaptions vs. outright indices. In our opinion a very efficient way of turning the loss of the risk premium into an advantage would be to sell receiver swaptions (selling receiver low strike and buying high strike payer swaptions together is known as a bear spread) and therefore monetizing the risk premium inherent in these. Because selling receiver swaptions ATM or slightly OTM hardly affects the 99.5% worst case (in a widening scenario these will expire worthless), the cost-to-capital-relief ratio for bear spread hedges will look a lot more attractive than just via payer swaptions or indices.
Exhibit 34: Implied option volatility vs. spread of iTraxx Main
020406080
100120140160
Sep-
06
Dec
-06
Mar
-07
Jun-
07
Sep-
07
Dec-
07
Mar
-08
Jun-
08
Sep-
08
Dec
-08
Mar
-09
Jun-
09
Sep-
09
Dec-
09
Mar
-10
Jun-
10
Sep-
10
Dec
-10
0
50
100
150
200
250Implied voliTraxx Main
Source: Credit Suisse

17 December 2010
European Credit Views 28
Tranches Similar to CD swaptions, Tranches of CDOs provide a (levered) exposure to the underlying and therefore can be effective hedging tools. The most liquidly traded tranches are the six tranches on the iTraxx Main Series 9 index for each of the standard maturities: 3-, 5-,7- and 10- years. Prices of senior CDO tranches are quoted in running spread, while the bottom three junior and mezzanine tranches are quoted in an upfront premium plus a running spread. Exhibit 35 illustrates the structure of the iTraxx Main and CDX IG standard tranches.
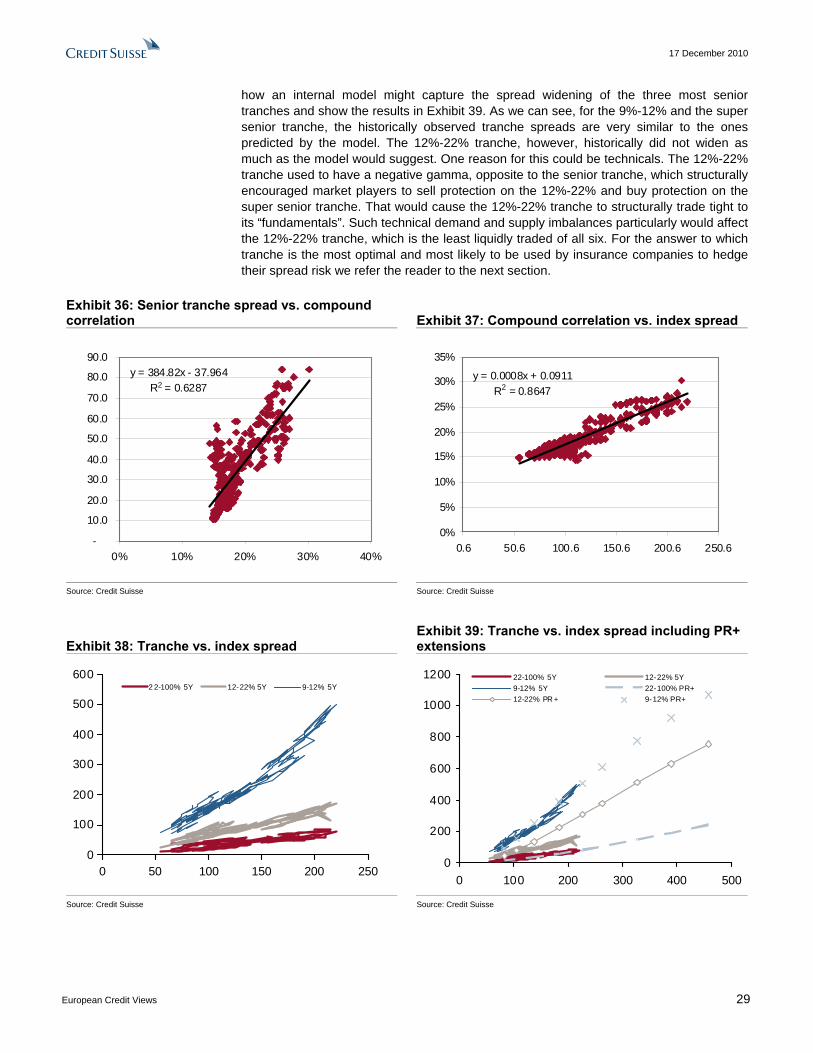
The most impactful driver of the value of a tranche is the spread of the underlying index. The so-called deltas measure how much a tranche spread changes with respect to the underlying index. These deltas do not stay the same and change as the index spread widens or tightens. This second order sensitivity of the tranche spread to the underlying index spread is known as gamma. The most senior tranche is called super senior and usually has positive deltas and gammas, indicating that its tranche spread widens over-proportionally with the index spread. Hence it is very suitable to hedge a systemic widening of spreads. Furthermore, as shown in Exhibits 36 and 37, senior tranche spreads increase with rising correlation in the underlying pool, which is highly correlated with spread levels of the underlying. This makes a senior tranche even more effective to hedge against a macro widening.
Default in the underlying pool reduces the notional, first of the equity (0%-3%) tranche and subsequently of the more senior tranches if all of their subordination has been “eaten away”. For investment grade indices like iTraxx Main, losses are extremely unlikely to accumulate that high that they reduce the notional of the most senior tranches. This is another factor that make them attractive for hedging macro spread risks.
Exhibit 35: iTraxx Main and CDX IG Tranches The attachment point is the lower bound for the tranche, the detachment point is the upper bound for the tranche
Source: Credit Suisse
In Exhibit 38 we highlight the positive dependency of tranche spreads with index spreads and the positive gamma of the 9%-12% tranche, which “happens too early”, i.e., before the fat tail event. We therefore think that the 12%-22% and 22%-100% tranches are more efficient in hedging fat tails and producing capital relief.
Similar to CDS indices and swaptions, spreads on tranches historically have never been wide enough to account for a 99.5% worst case. We therefore use PR+ to demonstrate
17 December 2010
European Credit Views 29
how an internal model might capture the spread widening of the three most senior tranches and show the results in Exhibit 39. As we can see, for the 9%-12% and the super senior tranche, the historically observed tranche spreads are very similar to the ones predicted by the model. The 12%-22% tranche, however, historically did not widen as much as the model would suggest. One reason for this could be technicals. The 12%-22% tranche used to have a negative gamma, opposite to the senior tranche, which structurally encouraged market players to sell protection on the 12%-22% and buy protection on the super senior tranche. That would cause the 12%-22% tranche to structurally trade tight to its “fundamentals”. Such technical demand and supply imbalances particularly would affect the 12%-22% tranche, which is the least liquidly traded of all six. For the answer to which tranche is the most optimal and most likely to be used by insurance companies to hedge their spread risk we refer the reader to the next section.
Exhibit 36: Senior tranche spread vs. compound correlation Exhibit 37: Compound correlation vs. index spread
y = 384.82x - 37.964R2 = 0.6287
-
10.0
20.0
30.0
40.0
50.0
60.0
70.0
80.0
90.0
0% 10% 20% 30% 40%
y = 0.0008x + 0.0911R2 = 0.8647
0%
5%
10%
15%
20%
25%
30%
35%
0.6 50.6 100.6 150.6 200.6 250.6
Source: Credit Suisse Source: Credit Suisse
Exhibit 38: Tranche vs. index spread Exhibit 39: Tranche vs. index spread including PR+ extensions
0
100
200
300
400
500
600
0 50 100 150 200 250
2 2-100% 5Y 12-22% 5Y 9-12% 5Y
0
200
400
600
800
1000
1200
0 100 200 300 400 500
22-100% 5Y 12-22% 5Y9-12% 5Y 22-100% PR+12-22% PR + 9-12% PR+
Source: Credit Suisse Source: Credit Suisse

17 December 2010
European Credit Views 30
Hedging efficiency, cost and liquidity In our opinion, there are three dimensions that we anticipate to be decisive for insurers in their macro hedges.
• Hedging efficiency: How much capital relief does a hedge give rise to
• Cost: How much does it cost per year and how wide is the bid-offer
• Liquidity: How much of a product can be traded at once
In the following table we summarise the hedging efficiency and the upfront plus running cost per year. The top line is the base case with the original bond portfolio that gives rise to a capital charge of 154mn28. Buying 15mn of protection on the highest risk contributor Rabobank reduces the risk by almost 2mn and costs 115K per year. Addressing the concentration in banks by buying protection on iTraxx Financial Senior would reduce the risk by more than 50mn to 98mn and would cost 4.4mn per year. We use this portfolio now as the new base case and illustrate how the use of index, swaption and tranche hedges could reduce the risk.
By adding 250mn of index protection in iTraxx Main for the cost of 105bp the risk can be further reduced to 73mn, resulting in a risk reduction efficiency of 9.329. If instead OTM payer swaptions are bought, the risk can be reduced to almost the same number (77mn, 78mn, 79mn for 140, 160 and 180 payer swaptions), but due to the higher costs associated with these instruments, the risk reduction efficiency is significantly lower than for the outright index. Furthermore, the higher the strike for the respective payer swaptions, the lower the premium will be and so the efficiency of these instruments increases with strike level (7.0, 7.7 and 8.4).
As we explained in the previous section, receiver swaptions with lower strikes can be sold in order to regain some of the premium paid on the payer swaptions, while slightly reducing the worst-case scenario risk because the receiver swaptions expire worthless. We illustrate this by adding receiver swaptions struck at 80bp and 100bp to the portfolio with the 180bp payer swaption. As can be seen, the cost for the payer swaption can be greatly reduced and this effect is higher with increasing strike of the receiver swaptions, resulting in much improved efficiency ratios of 12.7 and 23.4, respectively.
Turning to hedges with index tranches, as we discussed above, the most relevant are the three senior tranches. One can use these to either delta hedge a portfolio or index, which results in higher notionals for the 9%-12% and 12%-22% tranches relative to notional neutral hedges. We include the delta-neutral hedges just for completeness, as the 1y horizon of the Solvency II rules make a notional neutral hedge far more sensible. Because the notionals increase with seniority, it is not surprising that the super senior tranche contributes to the most and the 9%-12% tranche the least risk to the reduction. However taking into account the higher costs for higher notional, it seems like the 12%22% tranche reduces the risk most efficiently. This could be a bit overestimated due to the technicals we mentioned in the previous section keeping spreads structurally tight. We think the actual risk reduction could be a bit less for this tranche. Liquidity concerns which we will address shortly also are not favourable for this tranche. In summary, the most efficient options to hedge the credit portfolio therefore are selling low strike or ATM30 receiver and buying OTM payer swaptions, or buying protection on the 9%-12% or 22%-100% tranches.
28 As discussed in the section about internal models. 29 We measure the risk reduction efficiency by the risk reduction divided by the cost. The higher this ratio, the more efficient the hedge. 30 To determine exactly which (generally OTM) payer swaptions to buy and which receiver swaptions (generally ATM) to sell
depends on the volatility surface, i.e., how steep it is for the respective maturity. If very it is steep, the strikes of both swaptions should be higher, if flat, both strikes should be lower.
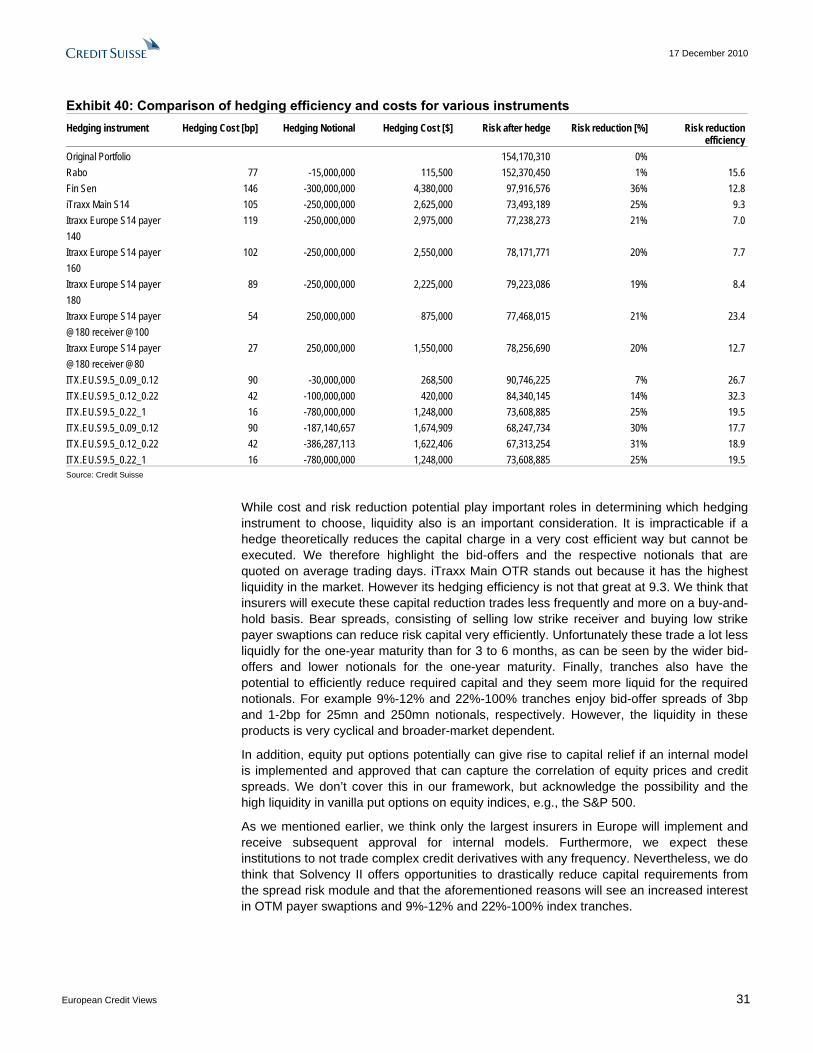
17 December 2010
European Credit Views 31
Exhibit 40: Comparison of hedging efficiency and costs for various instruments
Hedging instrument Hedging Cost [bp] Hedging Notional Hedging Cost [$] Risk after hedge Risk reduction [%] Risk reduction efficiency
Original Portfolio 154,170,310 0% Rabo 77 -15,000,000 115,500 152,370,450 1% 15.6 Fin Sen 146 -300,000,000 4,380,000 97,916,576 36% 12.8 iTraxx Main S14 105 -250,000,000 2,625,000 73,493,189 25% 9.3 Itraxx Europe S14 payer 140
119 -250,000,000 2,975,000 77,238,273 21% 7.0
Itraxx Europe S14 payer 160
102 -250,000,000 2,550,000 78,171,771 20% 7.7
Itraxx Europe S14 payer 180
89 -250,000,000 2,225,000 79,223,086 19% 8.4
Itraxx Europe S14 payer @180 receiver @100
54 250,000,000 875,000 77,468,015 21% 23.4
Itraxx Europe S14 payer @180 receiver @80
27 250,000,000 1,550,000 78,256,690 20% 12.7
ITX.EU.S9.5_0.09_0.12 90 -30,000,000 268,500 90,746,225 7% 26.7 ITX.EU.S9.5_0.12_0.22 42 -100,000,000 420,000 84,340,145 14% 32.3 ITX.EU.S9.5_0.22_1 16 -780,000,000 1,248,000 73,608,885 25% 19.5 ITX.EU.S9.5_0.09_0.12 90 -187,140,657 1,674,909 68,247,734 30% 17.7 ITX.EU.S9.5_0.12_0.22 42 -386,287,113 1,622,406 67,313,254 31% 18.9 ITX.EU.S9.5_0.22_1 16 -780,000,000 1,248,000 73,608,885 25% 19.5 Source: Credit Suisse
While cost and risk reduction potential play important roles in determining which hedging instrument to choose, liquidity also is an important consideration. It is impracticable if a hedge theoretically reduces the capital charge in a very cost efficient way but cannot be executed. We therefore highlight the bid-offers and the respective notionals that are quoted on average trading days. iTraxx Main OTR stands out because it has the highest liquidity in the market. However its hedging efficiency is not that great at 9.3. We think that insurers will execute these capital reduction trades less frequently and more on a buy-and-hold basis. Bear spreads, consisting of selling low strike receiver and buying low strike payer swaptions can reduce risk capital very efficiently. Unfortunately these trade a lot less liquidly for the one-year maturity than for 3 to 6 months, as can be seen by the wider bid-offers and lower notionals for the one-year maturity. Finally, tranches also have the potential to efficiently reduce required capital and they seem more liquid for the required notionals. For example 9%-12% and 22%-100% tranches enjoy bid-offer spreads of 3bp and 1-2bp for 25mn and 250mn notionals, respectively. However, the liquidity in these products is very cyclical and broader-market dependent.
In addition, equity put options potentially can give rise to capital relief if an internal model is implemented and approved that can capture the correlation of equity prices and credit spreads. We don’t cover this in our framework, but acknowledge the possibility and the high liquidity in vanilla put options on equity indices, e.g., the S&P 500.
As we mentioned earlier, we think only the largest insurers in Europe will implement and receive subsequent approval for internal models. Furthermore, we expect these institutions to not trade complex credit derivatives with any frequency. Nevertheless, we do think that Solvency II offers opportunities to drastically reduce capital requirements from the spread risk module and that the aforementioned reasons will see an increased interest in OTM payer swaptions and 9%-12% and 22%-100% index tranches.

17 December 2010
European Credit Views 32
Exhibit 41: Notionals and bid-offer spreads across products
Product Bid - Offer Size €mn ITX.EU.S9.5_0_0.03 0.25pts 20 ITX.EU.S9.5_0.03_0.06 0.25pts 20 ITX.EU.S9.5_0.06_0.09 0.25pts 30 ITX.EU.S9.5_0.09_0.12 3bps 25 ITX.EU.S9.5_0.12_0.22 2bps 100 ITX.EU.S9.5_0.22_1 1-2bps 250 iTraxx Main on the run (OTR) 0.5bps 250 iTraxx Xover on the run (OTR) 2bps 100 3-6 month swaptions 3-4c31 250 1-year swaptions 10c 150 Source: Credit Suisse
Capital efficient investments Covered bonds Collateralized transactions can be tailored in a way that minimizes the Solvency II capital. Various conditions need to be met. One of the most important is that the insurance must be able to take full possession of the collateral or have the right to liquidate it in the case of default of the counterparty. This crucially is not the case for covered bonds, which in most cases are treated in the same way as unsecured bonds due to the fact that the collateral stays with the issuer. There are a few exceptions where covered bonds enjoy a slightly beneficial treatment vs. their unsecured counterparts. For example AAA-rated German Pfandbriefe and Danish mortgage-backed bonds only give rise to a 0.6% “F” factor (as opposed to 0.9% for AAA-rated unsecured bonds).
Negative basis package Under the standard formula, a “perfect” hedge of a bond via a CDS results in a capital charge of 0%. An internal model might give rise to a capital charge if it captures the basis risk. However, a basis package is not free of capital charges, as it gives rise to a counterparty default risk charge. The idea behind this is that an investor is exposed to the risk that the CDS seller defaults and the original bond investment falls in value at the same time.
We demonstrate the counterparty default risk capital charge based on a portfolio of senior unsecured BB bonds with a duration of 5. These would attract a 22.5% (5 x 4.5%) capital charge. Hedging these with a CDS would reduce the spread risk charge to zero. The counterparty risk module charge would be 1.36%, i.e., significantly less. We outline the formula for calculating this in the next section.
Secured funding Securities lending or similar transactions are investment alternatives that allow insurers to monetize the dormant liquidity on the balance sheet. The transfer of liquidity is done via a term securities lending transaction in which a bank borrows liquid securities (most likely government bonds) from the insurance in return for less liquid but high credit quality collateral. In turn the insurance is rewarded by receiving a running spread, which represents a yield enhancement based on the liquidity premium of the government bonds versus the liquidity premium of the less liquid collateral. The spread that can be earned via this structure depends on several factors, like term of the transaction, the nature if
31 The quoting convention for swaptions is in cent. Buying EUR100mn of an option costing 100c would cost EUR1mn.

17 December 2010
European Credit Views 33
collateral (IG, HY, ABS etc) and the applicable haircut. There are several vehicles that have the potential to convey the same economic benefit under different (legal) structures:
• Reverse Repo: documented under GMRA32/CSA33
• Securities lending: documented under GMRA/CSA
• Total return swap: documented under ISDA34/CSA
As mentioned above, the risk-mitigating impact of the collateral is only fully recognised if the transaction gives the insurance the right to liquidate or take full possession of the collateral in case of default of either the counterparty or the custodian who holds the collateral.
Assuming an A-rated counterparty, unsecured lending with a duration of five years would give rise to a 7% capital charge. Furthermore, BB-rated senior unsecured bonds with the same duration would suffer a 22.5% capital charge. Hedging these with a CDS could reduce the spread risk charge to zero but would give rise to one under the counterparty risk module of 0.89%, i.e., substantially less.
To calculate this charge, the Loss Given Default (LGD) needs to be computed:
LGD = Max [(1-R).(MV+RM-Collateral); 0]
Where R is the best estimate recovery rate (set to 10%), MV is the market value of the derivative (i.e., the CDS, whose MV is 0 at initiation), RM is the risk-mitigating impact, i.e., the spread risk capital charge for the bonds (22.5%) and collateral is the risk-adjusted value of the collateral (7.75%35).
= (1-10%).(0 + 22.5% - 7.75%) = 13.275%
Furthermore, the default probability p according to QIS5 for an A-rated entity is set to 0.05%. The variance of the loss distribution then is defined as:
V = p x (1-p) x LGD2 =0.0499% x LGD2
There now are two scenarios, if either the square root of V is lower than 5% x LGD (which is the case here) then the capital required is three times the square root of V, which is 6.7% x LGD= 0.89%. In the other case, the capital charge would be the minimum of the LGD and five times the square root of V.
Exhibit 42: Secured funding in comparison
Investment Spread risk Counterparty risk CS Unsecured bond 7.00% - CS Covered bond (treated as a AAA unsecured bond)
4.50% -
CS Negative basis package (BB bond) - 1.36% (0% haircut) CS Secured note (BB collateral) - 0.89% (10% haircut) Source: Credit Suisse
32 Global Master Repurchase Agreement 33 Credit Support Agreement 34 International Swaps and Derivatives Association 35 Assuming over-collateral of 10% (e.g. because of a haircut mechanism), the value placed on this is 10% x (1-collat. spread risk
(=22.5%) ) = 7.75%
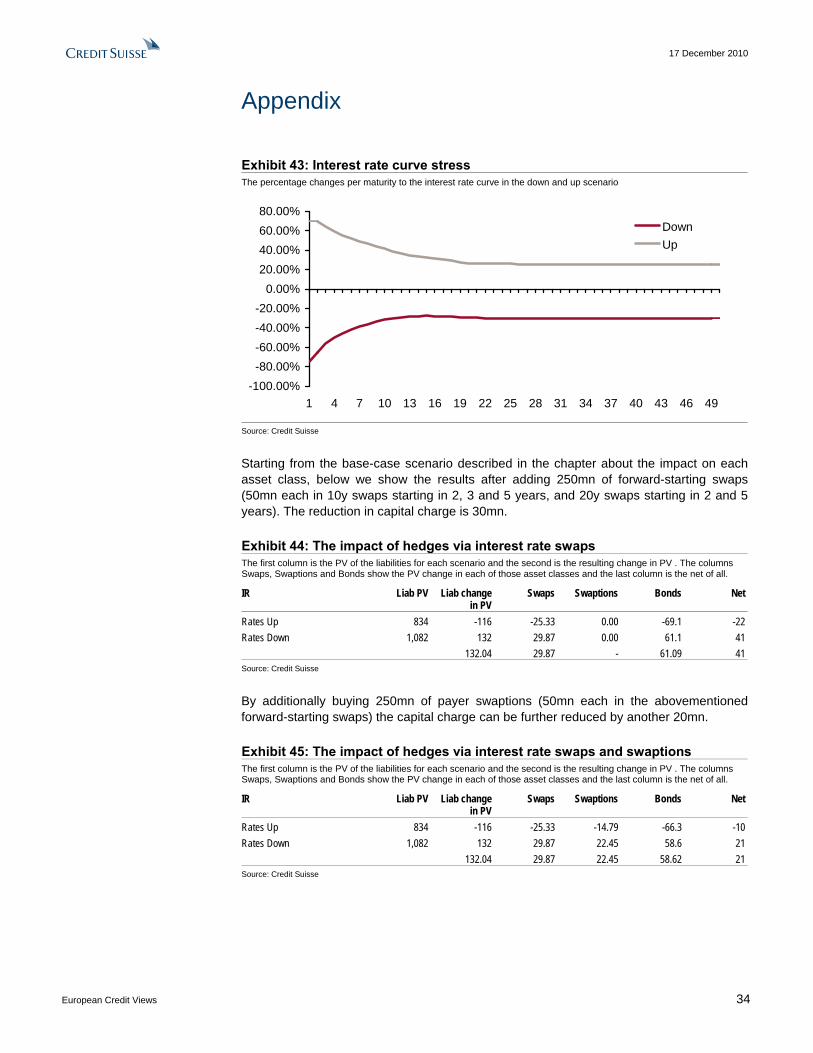
17 December 2010
European Credit Views 34
Appendix
Exhibit 43: Interest rate curve stress The percentage changes per maturity to the interest rate curve in the down and up scenario
-100.00%-80.00%-60.00%-40.00%-20.00%
0.00%20.00%40.00%60.00%80.00%
1 4 7 10 13 16 19 22 25 28 31 34 37 40 43 46 49
DownUp
Source: Credit Suisse
Starting from the base-case scenario described in the chapter about the impact on each asset class, below we show the results after adding 250mn of forward-starting swaps (50mn each in 10y swaps starting in 2, 3 and 5 years, and 20y swaps starting in 2 and 5 years). The reduction in capital charge is 30mn.
Exhibit 44: The impact of hedges via interest rate swaps The first column is the PV of the liabilities for each scenario and the second is the resulting change in PV . The columns Swaps, Swaptions and Bonds show the PV change in each of those asset classes and the last column is the net of all.
IR Liab PV Liab change in PV
Swaps Swaptions Bonds Net
Rates Up 834 -116 -25.33 0.00 -69.1 -22 Rates Down 1,082 132 29.87 0.00 61.1 41 132.04 29.87 - 61.09 41 Source: Credit Suisse
By additionally buying 250mn of payer swaptions (50mn each in the abovementioned forward-starting swaps) the capital charge can be further reduced by another 20mn.
Exhibit 45: The impact of hedges via interest rate swaps and swaptions The first column is the PV of the liabilities for each scenario and the second is the resulting change in PV . The columns Swaps, Swaptions and Bonds show the PV change in each of those asset classes and the last column is the net of all.
IR Liab PV Liab change in PV
Swaps Swaptions Bonds Net
Rates Up 834 -116 -25.33 -14.79 -66.3 -10 Rates Down 1,082 132 29.87 22.45 58.6 21 132.04 29.87 22.45 58.62 21 Source: Credit Suisse

17 December 2010
European Credit Views 35
Exhibit 46: Average market values in % of total notional in the LEI index Sovereigns actually are not part of the index, they are just included here for completeness
Rating 1-3 4-7 7-10 10+ Total Sovereign 32.8% 16.5% 23.0% 27.6% 100.00% AAA Cov 0.0% 0.0% 0.0% 0.0% 0.00% AAA 1.6% 1.1% 0.8% 0.7% 4.24% AA 9.4% 5.4% 3.3% 0.9% 19.08% A 21.4% 17.5% 9.5% 3.4% 51.90% BBB 10.7% 9.0% 3.6% 1.5% 24.78% BB 0.0% 0.0% 0.0% 0.0% 0.00% B 0.0% 0.0% 0.0% 0.0% 0.00% CCC 0.0% 0.0% 0.0% 0.0% 0.00% Unrated 0.0% 0.0% 0.0% 0.0% 0.00% Total 0.76 0.50 0.40 0.34 100.00% Source: Credit Suisse
Exhibit 47: Average duration per rating and maturity bucket in the LEI index Sovereigns actually are not part of the index, they are just included here for completeness
Rating 1-3 4-7 7-10 10+ Sovereign 1.70 5.22 7.00 12.75 AAA Cov 1.70 5.15 6.56 9.45 AAA 2.03 4.22 6.05 8.94 AA 2.18 4.37 6.66 10.26 A 2.28 4.31 6.46 9.64 BBB 2.19 4.21 6.21 9.72 BB 2.19 4.21 6.21 9.72 B 2.19 4.21 6.21 9.72 CCC 2.19 4.21 6.21 9.72 Unrated 2.19 4.21 6.21 9.72 Source: Credit Suisse
Exhibit 48: Rates down correlation matrix
Interest rate Equity Property Credit FX Illiquity Premium
Interest rate 1 0.5 0.5 0.5 0.25 0 Equity 0.5 1 0.75 0.75 0.25 0 Property 0.5 0.75 1 0.5 0.25 0 Credit 0.5 0.75 0.5 1 0.25 -0.5 FX 0.25 0.25 0.25 0.25 1 0 Illiquidity Premium 0 0 0 -0.5 0 1 Source: Credit Suisse
Exhibit 49: Rates up correlation matrix
Interest rate Equity Property Credit FX Illiquidity Premium
Interest rate 1 0 0 0 0.25 0 Equity 0 1 0.75 0.75 0.25 0 Property 0 0.75 1 0.5 0.25 0 Credit 0 0.75 0.5 1 0.25 -0.5 FX 0.25 0.25 0.25 0.25 1 0 Illiquidity Premium 0 0 0 -0.5 0 1 Source: Credit Suisse

LEVERAGED FINANCE - EUROPE
Ben Booth Managing Director (44) 20 7888 1721 Hayley Walker Director (44) 20 7883 5569
Cable, Broadcasting and Telecom
Marco Gironi Director (44) 20 7888 7477 Ben Maurer Vice President (44) 20 7888 5045
Chemicals, Basic Materials, Paper & Packaging
Lisa Barash Director (44) 20 7888 0163 Pieter Fyfer Managing Director (44) 20 7883 4279Stephane Suchet Vice President (44) 20 7883 4278Atif Ali Associate (44) 20 7883 7978
Industrials, Transportation, Services, Technology Telecom, Media, Technology
Alex Field Vice President (44) 20 7888 0940 Madeleine King, CFA Vice President (44) 20 7888 4909
Utilities, Infrastructure, Energy
Tom Gibney Vice President (44) 20 7888 0326 Alex Field Vice President (44) 20 7888 0940
Automotive
Hayley Walker Director (44) 20 7883 5569 Tom Gibney, CFA, Vice President (44) 20 7888 0326
Credit Strategy- Europe
William Porter Managing Director (44) 20 7888 1207
Quantitative Credit Strategy Helen Haworth, CFA Vice President (44) 20 7888 0757Christian Schwarz Vice President (44) 20 7888 3161Chiraag Somaia Associate (44) 20 7888 2776
Industrials, Metals & Mining
Utilities, Infrastructure, Real Estate
Global Credit Products - Credit Research - Europe
William Porter, Managing Director, Head of European Credit Strategy
INVESTMENT GRADE - EUROPE
Gaming, Retail, Consumer Products, Publishing, Healthcare
Ben Booth, Managing Director, Head of European Fundamental Credit Research
Capital Goods, Chemicals, Energy & Pharmaceuticals
Financial Institutions
Consumer Products, Retail, Autos

Disclosure Appendix
Analyst Certification I, Christian Schwarz, certify that (1) the views expressed in this report accurately reflect my personal views about all of the subject companies and securities and (2) no part of my compensation was, is or will be directly or indirectly related to the specific recommendations or views expressed in this report.
CUSP® Certification and Definition With respect to the analysis in this report based on the CUSP® methodology, Credit Suisse certifies that (1) the views expressed in this report accurately reflect the CUSP® methodology and (2) no part of the firm's compensation was, is, or will be directly related to the specific views disclosed in this report. CUSP® is an analytical model that relates an issuer's capital structure, stock price, and equity option-implied volatility to its credit risk. CUSP® can be used for systematic monitoring of credit risk. Details on the CUSP® methodology can be found in the Corporates, Reference, Education tab of Locus (http://locus.fi.csfb.com/) or by contacting the Credit Suisse Quantitative Credit Strategy Group.
Important Disclosures Credit Suisse's policy is only to publish investment research that is impartial, independent, clear, fair and not misleading. For more detail, please refer to Credit Suisse's Policies for Managing Conflicts of Interest in connection with Investment Research: http://www.csfb.com/research-and-analytics/disclaimer/managing_conflicts_disclaimer.html Credit Suisse’s policy is to publish research reports as it deems appropriate, based on developments with the subject issuer, the sector or the market that may have a material impact on the research views or opinions stated herein. The analyst(s) involved in the preparation of this research report received compensation that is based upon various factors, including Credit Suisse's total revenues, a portion of which are generated by Credit Suisse's Investment Banking and Fixed Income Divisions. Credit Suisse may trade as principal in the securities or derivatives of the issuers that are the subject of this report. At any point in time, Credit Suisse is likely to have significant holdings in the securities mentioned in this report. As at the date of this report, Credit Suisse acts as a market maker or liquidity provider in the debt securities of the subject issuer(s) mentioned in this report. For important disclosure information on securities recommended in this report, please visit the website at https://firesearchdisclosure.credit-suisse.com or call +1-212-538-7625. For the history of any relative value trade ideas suggested by the Fixed Income research department as well as fundamental recommendations provided by the Emerging Markets Sovereign Strategy Group over the previous 12 months, please view the document at http://research-and-analytics.csfb.com/docpopup.asp?ctbdocid=330703_1_en. Credit Suisse clients with access to the Locus website may refer to http://www.credit-suisse.com/locus. For the history of recommendations provided by Technical Analysis, please visit the website at http://www.credit-suisse.com/techanalysis. Credit Suisse does not provide any tax advice. Any statement herein regarding any US federal tax is not intended or written to be used, and cannot be used, by any taxpayer for the purposes of avoiding any penalties.
Emerging Markets Bond Recommendation Definitions Buy: Indicates a recommended buy on our expectation that the issue will deliver a return higher than the risk-free rate. Sell: Indicates a recommended sell on our expectation that the issue will deliver a return lower than the risk-free rate.
Corporate Bond Fundamental Recommendation Definitions Buy: Indicates a recommended buy on our expectation that the issue will be a top performer in its sector. Outperform: Indicates an above-average total return performer within its sector. Bonds in this category have stable or improving credit profiles and are undervalued, or they may be weaker credits that, we believe, are cheap relative to the sector and are expected to outperform on a total-return basis. These bonds may possess price risk in a volatile environment. Market Perform: Indicates a bond that is expected to return average performance in its sector. Underperform: Indicates a below-average total-return performer within its sector. Bonds in this category have weak or worsening credit trends, or they may be stable credits that, we believe, are overvalued or rich relative to the sector. Sell: Indicates a recommended sell on the expectation that the issue will be among the poor performers in its sector. Restricted: In certain circumstances, Credit Suisse policy and/or applicable law and regulations preclude certain types of communications, including an investment recommendation, during the course of Credit Suisse's engagement in an investment banking transaction and in certain other circumstances. Not Rated: Credit Suisse Global Credit Research or Global Leveraged Finance Research covers the issuer but currently does not offer an investment view on the subject issue. Not Covered: Neither Credit Suisse Global Credit Research nor Global Leveraged Finance Research covers the issuer or offers an investment view on the issuer or any securities related to it. Any communication from Research on securities or companies that Credit Suisse does not cover is factual or a reasonable, non-material deduction based on an analysis of publicly available information.
Corporate Bond Risk Category Definitions In addition to the recommendation, each issue may have a risk category indicating that it is an appropriate holding for an "average" high yield investor, designated as Market, or that it has a higher or lower risk profile, designated as Speculative and Conservative, respectively.
Credit Suisse Credit Rating Definitions Credit Suisse may assign rating opinions to investment-grade and crossover issuers. Ratings are based on our assessment of a company's creditworthiness and are not recommendations to buy or sell a security. The ratings scale (AAA, AA, A, BBB, BB, B) is dependent on our assessment of an issuer's ability to meet its financial commitments in a timely manner. Within each category, creditworthiness is further detailed with a scale of High, Mid, or Low – with High being the strongest sub-category rating: High AAA, Mid AAA, Low AAA – obligor's capacity to meet its financial commitments is extremely strong; High AA, Mid AA, Low AA – obligor's capacity to meet its financial commitments is very strong; High A, Mid A, Low A – obligor's capacity to meet its financial commitments is strong; High BBB, Mid BBB, Low BBB – obligor's capacity to meet its financial commitments is adequate, but adverse economic/operating/financial circumstances are more likely to lead to a weakened capacity to meet its obligations; High BB, Mid BB, Low BB – obligations have speculative characteristics and are subject to substantial credit risk; High B, Mid B, Low B – obligor's capacity to meet its financial commitments is very weak and highly vulnerable to adverse economic, operating, and financial circumstances; High CCC, Mid CCC, Low CCC – obligor's capacity to meet

its financial commitments is extremely weak and is dependent on favorable economic, operating, and financial circumstances. Credit Suisse's rating opinions do not necessarily correlate with those of the rating agencies.
Credit Suisse’s Distribution of Global Credit Research Recommendations* (and Banking Clients) Global Recommendation Distribution**
Buy 3% (of which 100% are banking clients) Outperform 40% (of which 95% are banking clients) Market Perform 28% (of which 93% are banking clients) Underperform 26% (of which 97% are banking clients) Sell 3% (of which 94% are banking clients) *Data are as at the end of the previous calendar quarter. **Percentages do not include securities on the firm’s Restricted List and might not total 100% as a result of rounding.
Credit Suisse’s Distribution of Global Leveraged Finance Recommendations* (and Banking Clients) Global Recommendation Distribution**
Buy 5% (of which 67% are banking clients) Outperform 51% (of which 78% are banking clients) Market Perform 33% (of which 80% are banking clients) Underperform 7% (of which 69% are banking clients) Sell 3% (of which 100% are banking clients) *Data are as at the end of the previous calendar quarter. **Percentages do not include securities on the firm’s Restricted List and might not total 100% as a result of rounding.
Structured Securities, Derivatives, and Options Disclaimer Structured securities, derivatives, and options (including OTC derivatives and options) are complex instruments that are not suitable for every investor, may involve a high degree of risk, and may be appropriate investments only for sophisticated investors who are capable of understanding and assuming the risks involved. Supporting documentation for any claims, comparisons, recommendations, statistics or other technical data will be supplied upon request. Any trade information is preliminary and not intended as an official transaction confirmation. OTC derivative transactions are not highly liquid investments; before entering into any such transaction you should ensure that you fully understand its potential risks and rewards and independently determine that it is appropriate for you given your objectives, experience, financial and operational resources, and other relevant circumstances. You should consult with such tax, accounting, legal or other advisors as you deem necessary to assist you in making these determinations. In discussions of OTC options and other strategies, the results and risks are based solely on the hypothetical examples cited; actual results and risks will vary depending on specific circumstances. Investors are urged to consider carefully whether OTC options or option-related products, as well as the products or strategies discussed herein, are suitable to their needs. CS does not offer tax or accounting advice or act as a financial advisor or fiduciary (unless it has agreed specifically in writing to do so). Because of the importance of tax considerations to many option transactions, the investor considering options should consult with his/her tax advisor as to how taxes affect the outcome of contemplated options transactions. Use the following link to read the Options Clearing Corporation's disclosure document: http://www.theocc.com/publications/risks/riskstoc.pdf Transaction costs may be significant in option strategies calling for multiple purchases and sales of options, such as spreads and straddles. Commissions and transaction costs may be a factor in actual returns realized by the investor and should be taken into consideration.

References in this report to Credit Suisse include all of the subsidiaries and affiliates of Credit Suisse AG operating under its investment banking division. For more information on our structure, please use the following link: https://www.credit-suisse.com/who_we_are/en/. This report is not directed to, or intended for distribution to or use by, any person or entity who is a citizen or resident of or located in any locality, state, country or other jurisdiction where such distribution, publication, availability or use would be contrary to law or regulation or which would subject Credit Suisse AG or its affiliates (“CS”) to any registration or licensing requirement within such jurisdiction. All material presented in this report, unless specifically indicated otherwise, is under copyright to CS. None of the material, nor its content, nor any copy of it, may be altered in any way, transmitted to, copied or distributed to any other party, without the prior express written permission of CS. All trademarks, service marks and logos used in this report are trademarks or service marks or registered trademarks or service marks of CS or its affiliates. The information, tools and material presented in this report are provided to you for information purposes only and are not to be used or considered as an offer or the solicitation of an offer to sell or to buy or subscribe for securities or other financial instruments. CS may not have taken any steps to ensure that the securities referred to in this report are suitable for any particular investor. CS will not treat recipients of this report as its customers by virtue of their receiving this report. The investments and services contained or referred to in this report may not be suitable for you and it is recommended that you consult an independent investment advisor if you are in doubt about such investments or investment services. Nothing in this report constitutes investment, legal, accounting or tax advice, or a representation that any investment or strategy is suitable or appropriate to your individual circumstances, or otherwise constitutes a personal recommendation to you. CS does not advise on the tax consequences of investments and you are advised to contact an independent tax adviser. Please note in particular that the bases and levels of taxation may change. Information and opinions presented in this report have been obtained or derived from sources believed by CS to be reliable, but CS makes no representation as to their accuracy or completeness. CS accepts no liability for loss arising from the use of the material presented in this report, except that this exclusion of liability does not apply to the extent that such liability arises under specific statutes or regulations applicable to CS. This report is not to be relied upon in substitution for the exercise of independent judgment. CS may have issued, and may in the future issue, other reports that are inconsistent with, and reach different conclusions from, the information presented in this report. Those reports reflect the different assumptions, views and analytical methods of the analysts who prepared them and CS is under no obligation to ensure that such other reports are brought to the attention of any recipient of this report. CS may, to the extent permitted by law, participate or invest in financing transactions with the issuer(s) of the securities referred to in this report, perform services for or solicit business from such issuers, and/or have a position or holding, or other material interest, or effect transactions, in such securities or options thereon, or other investments related thereto. In addition, it may make markets in the securities mentioned in the material presented in this report. CS may have, within the last three years, served as manager or co-manager of a public offering of securities for, or currently may make a primary market in issues of, any or all of the entities mentioned in this report or may be providing, or have provided within the previous 12 months, significant advice or investment services in relation to the investment concerned or a related investment. Additional information is, subject to duties of confidentiality, available on request. Some investments referred to in this report will be offered solely by a single entity and in the case of some investments solely by CS, or an associate of CS or CS may be the only market maker in such investments. Past performance should not be taken as an indication or guarantee of future performance, and no representation or warranty, express or implied, is made regarding future performance. Information, opinions and estimates contained in this report reflect a judgement at its original date of publication by CS and are subject to change without notice. The price, value of and income from any of the securities or financial instruments mentioned in this report can fall as well as rise. The value of securities and financial instruments is subject to exchange rate fluctuation that may have a positive or adverse effect on the price or income of such securities or financial instruments. Investors in securities such as ADR’s, the values of which are influenced by currency volatility, effectively assume this risk. Structured securities are complex instruments, typically involve a high degree of risk and are intended for sale only to sophisticated investors who are capable of understanding and assuming the risks involved. The market value of any structured security may be affected by changes in economic, financial and political factors (including, but not limited to, spot and forward interest and exchange rates), time to maturity, market conditions and volatility, and the credit quality of any issuer or reference issuer. Any investor interested in purchasing a structured product should conduct their own investigation and analysis of the product and consult with their own professional advisers as to the risks involved in making such a purchase. Some investments discussed in this report may have a high level of volatility. High volatility investments may experience sudden and large falls in their value causing losses when that investment is realised. Those losses may equal your original investment. Indeed, in the case of some investments the potential losses may exceed the amount of initial investment and, in such circumstances, you may be required to pay more money to support those losses. Income yields from investments may fluctuate and, in consequence, initial capital paid to make the investment may be used as part of that income yield. Some investments may not be readily realisable and it may be difficult to sell or realise those investments, similarly it may prove difficult for you to obtain reliable information about the value, or risks, to which such an investment is exposed. This report may provide the addresses of, or contain hyperlinks to, websites. Except to the extent to which the report refers to website material of CS, CS has not reviewed any such site and takes no responsibility for the content contained therein. Such address or hyperlink (including addresses or hyperlinks to CS’s own website material) is provided solely for your convenience and information and the content of any such website does not in any way form part of this document. Accessing such website or following such link through this report or CS’s website shall be at your own risk. This report is issued and distributed in Europe (except Switzerland) by Credit Suisse Securities (Europe) Limited, One Cabot Square, London E14 4QJ, England, which is regulated in the United Kingdom by The Financial Services Authority (“FSA”). This report is being distributed in Germany by Credit Suisse Securities (Europe) Limited Niederlassung Frankfurt am Main regulated by the Bundesanstalt fuer Finanzdienstleistungsaufsicht ("BaFin"). This report is being distributed in the United States and Canada by Credit Suisse Securities (USA) LLC; in Switzerland by Credit Suisse AG; in Brazil by Banco de Investimentos Credit Suisse (Brasil) S.A; in Mexico by Banco Credit Suisse (México), S.A. (transactions related to the securities mentioned in this report will only be effected in compliance with applicable regulation); in Japan by Credit Suisse Securities (Japan) Limited, Financial Instruments Firm, Director-General of Kanto Local Finance Bureau (Kinsho) No. 66, a member of Japan Securities Dealers Association, The Financial Futures Association of Japan, Japan Securities Investment Advisers Association; elsewhere in Asia/ Pacific by whichever of the following is the appropriately authorised entity in the relevant jurisdiction: Credit Suisse (Hong Kong) Limited, Credit Suisse Equities (Australia) Limited, Credit Suisse Securities (Thailand) Limited, Credit Suisse Securities (Malaysia) Sdn Bhd, Credit Suisse AG, Singapore Branch, and elsewhere in the world by the relevant authorised affiliate of the above. Research on Taiwanese securities produced by Credit Suisse AG, Taipei Branch has been prepared by a registered Senior Business Person. Research provided to residents of Malaysia is authorised by the Head of Research for Credit Suisse Securities (Malaysia) Sdn Bhd, to whom they should direct any queries on +603 2723 2020. This research may not conform to Canadian disclosure requirements. In jurisdictions where CS is not already registered or licensed to trade in securities, transactions will only be effected in accordance with applicable securities legislation, which will vary from jurisdiction to jurisdiction and may require that the trade be made in accordance with applicable exemptions from registration or licensing requirements. Non-U.S. customers wishing to effect a transaction should contact a CS entity in their local jurisdiction unless governing law permits otherwise. U.S. customers wishing to effect a transaction should do so only by contacting a representative at Credit Suisse Securities (USA) LLC in the U.S. This material is not for distribution to retail clients and is directed exclusively at Credit Suisse's market professional and institutional clients. Recipients who are not market professional or institutional investor clients of CS should seek the advice of their independent financial advisor prior to taking any investment decision based on this report or for any necessary explanation of its contents. This research may relate to investments or services of a person outside of the UK or to other matters which are not regulated by the FSA or in respect of which the protections of the FSA for private customers and/or the UK compensation scheme may not be available, and further details as to where this may be the case are available upon request in respect of this report. CS may provide various services to US municipal entities or obligated persons ("municipalities"), including suggesting individual transactions or trades and entering into such transactions. Any services CS provides to municipalities are not viewed as “advice” within the meaning of Section 975 of the Dodd-Frank Wall Street Reform and Consumer Protection Act. CS is providing any such services and related information solely on an arm’s length basis and not as an advisor or fiduciary to the municipality. In connection with the provision of the any such services, there is no agreement, direct or indirect, between any municipality (including the officials, management, employees or agents thereof) and CS for CS to provide advice to the municipality. Municipalities should consult with their financial, accounting and legal advisors regarding any such services provided by CS. In addition, CS is not acting for direct or indirect compensation to solicit the municipality on behalf of an unaffiliated broker, dealer, municipal securities dealer, municipal advisor, or investment adviser for the purpose of obtaining or retaining an engagement by the municipality for or in connection with Municipal Financial Products, the issuance of municipal securities, or of an investment adviser to provide investment advisory services to or on behalf of the municipality. Copyright © 2010 CREDIT SUISSE GROUP AG and/or its affiliates. All rights reserved. Investment principal on bonds can be eroded depending on sale price or market price. In addition, there are bonds on which investment principal can be eroded due to changes in redemption amounts. Care is required when investing in such instruments. When you purchase non-listed Japanese fixed income securities (Japanese government bonds, Japanese municipal bonds, Japanese government guaranteed bonds, Japanese corporate bonds) from CS as a seller, you will be requested to pay purchase price only.