European Contingent Staffing Trends€¦ · 3 bn 2 bn 1 bn 0 1950 2050 15-59 0-14 60+ 2011 ......
37
© 2011 Crain Communications Inc European Contingent Staffing Trends John Nurthen, General Manager, Europe Staffing Industry Analysts Optimum Sponsors: Alexander Mann Solutions | Allegis Group Services | Fieldglass | Gibbs S3 | IQNavigator KellyOCG | Peopleclick Authoria | ProcureStaff Technologies | Volt Consulting Group | WorkforceLogic Pinnacle Sponsors: Monday, 20 June | 12:00 pm| Ballroom I-III
Transcript of European Contingent Staffing Trends€¦ · 3 bn 2 bn 1 bn 0 1950 2050 15-59 0-14 60+ 2011 ......

© 2011 Crain Communications Inc
European Contingent Staffing Trends
John Nurthen, General Manager, Europe
Staffing Industry Analysts
Optimum Sponsors: Alexander Mann Solutions | Allegis Group Services | Fieldglass | Gibbs S3 | IQNavigatorKellyOCG | Peopleclick Authoria | ProcureStaff Technologies | Volt Consulting Group | WorkforceLogic
Pinnacle Sponsors:
Monday, 20 June | 12:00 pm| Ballroom I-III

© 2011 Crain Communications Inc
European and North American Staffing Markets
Source: Staffing Industry Analysts
Size of staffing market 2010 = €91 Billion
Forecast Growth 2011 = 11%
Size of staffing market 2010 = €60 Billion
Forecast Growth 2011 = 12%

© 2011 Crain Communications Inc
European Staffing Market by Sector
Source: Staffing Industry Analysts
23%
50%
12%
4%4%
5%
1% 1%

© 2011 Crain Communications Inc
Agency Temp Employment Has Returned to Growth
Source: Staffing Industry Analysts and US Bureau of Labor Statistics. ABU Netherlands, Pole Emploi France, BAP Germany - Note: Based on change in employment or hours worked as available
Year-Over-Year Change in Temp Employment for Select Countries
US
France
Netherlands
Germany
-40%
-30%
-20%
-10%
0%
10%
20%
30%
40%
50%
Jan-08
Apr-08
Jul-08
Oct-08
Jan-09
Apr-09
Jul-09
Oct-09
Jan-10
Apr-10
Jul-10
Oct-10
Jan-11
Apr-11

© 2011 Crain Communications Inc
Top 10 European Staffing Companies
Rank Company Latest Annual Sales (€m)
Change over prior year
1 Adecco 12,126 +24%2 Randstad 11,343 +10%3 ManpowerGroup 9,281 +17%4 USG People 3,099 +3%5 Hays 1,792 +10%6 Synergie 1,207 +30%7 Groupe CRIT 1,094 +16%8 Trenkwalder 1,000 +27%9 Impellam 983 +13%10 Kelly Services 763 +2%
Source: Company Financials and Staffing Industry Analysts

© 2011 Crain Communications Inc
Staffing Industry Stock Index (SISI) Performance 2009 to 2011
80
90
100
110
120
130
140
150
160
170
180
Apr-09 Jun-09 Aug-09 Oct-09 Dec-09 Feb-10 Apr-10 Jun-10 Aug-10 Oct-10 Dec-10 Feb-11 Apr-11
SISI MSCI
The Stock Market is Bullish on Staffing
Source: Yahoo Finance and Staffing Industry AnalystsNote: SISI is market capitalization weighted and includes a selection of global staffing stocks. Adecco, Randstad, ManpowerGroup and Robert Half make up approximately ¾ of the index value based on market cap.
SISI
MSCI World Index

© 2011 Crain Communications Inc
Temporary Staffing Growth Forecasts
Source: Staffing Industry Analysts’ Forecast
Country Structural Legislative Economic GDP 2011 GrowthRate
Sweden 4.2% 21%
Germany 2.6% 20%
Italy 1.0% 20%
Austria 2.4% 15%
Norway 2.7% 15%
Denmark 1.7% 14%
☺☺
☺
☺ ☺
☺
☺☺☺

© 2011 Crain Communications Inc
Temporary Staffing Growth Forecasts
Source: Staffing Industry Analysts’ Forecast
Country Structural Legislative Economic GDP 2011 GrowthRate
France 1.8% 12%
Finland 3.7% 12%
Belgium 2.4% 12%
Switzerland 1.9% 9%
Netherlands 1.9% 8%
Spain 0.8% 7%
☺
☺
☺
☺☺☺
☺ ☺
☺
© 2011 Crain Communications Inc
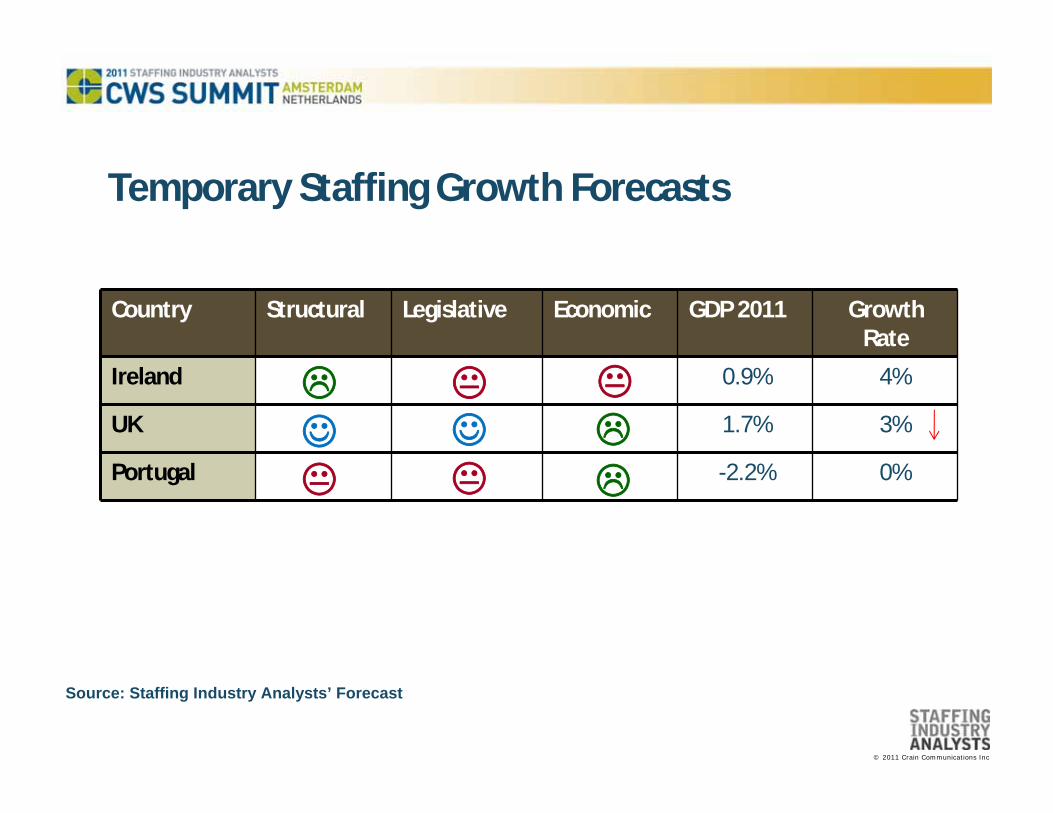
Temporary Staffing Growth Forecasts
Source: Staffing Industry Analysts’ Forecast
Country Structural Legislative Economic GDP 2011 GrowthRate
Ireland 0.9% 4%
UK 1.7% 3%
Portugal -2.2% 0%
☺☺
© 2011 Crain Communications Inc
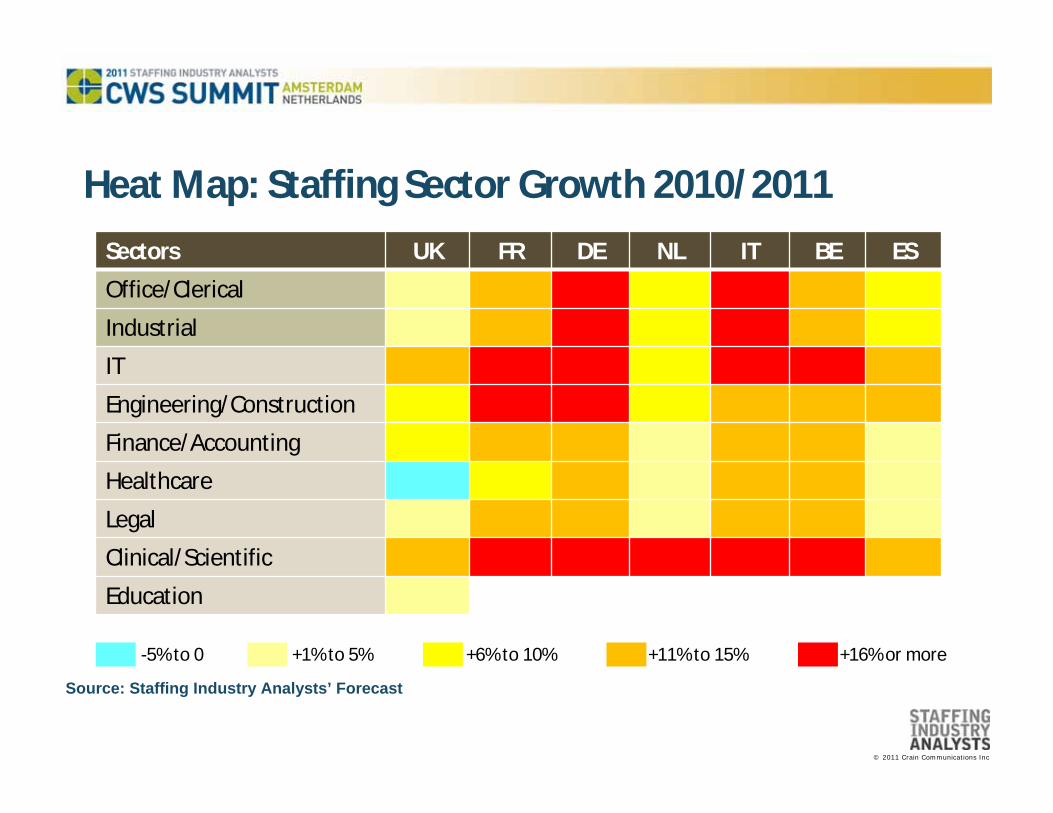
Heat Map: Staffing Sector Growth 2010/2011
Sectors UK FR DE NL IT BE ES
Office/Clerical
Industrial
IT
Engineering/Construction
Finance/Accounting
Healthcare
Legal
Clinical/Scientific
Education
Source: Staffing Industry Analysts’ Forecast
+16% or more+11% to 15%+6% to 10%+1% to 5%-5% to 0

© 2011 Crain Communications Inc
EU Agency Workers Directive
• Effective Date: 5 December 2011
• Two main features— Equal treatment for basic working and
employment conditionsMain impact in UK and Ireland
– Agency Workers RegulationsNo impact in Germany and Sweden
— Review of existing staffing legislation— Remove or justify

© 2011 Crain Communications Inc
Restrictions Still in Place

© 2011 Crain Communications Inc
Staffing Company Gross Margin Trends
Average Latest Period Year on Year Comparison
Change
All Companies 24.33% 23.39% +0.94
Very Large Companies* 24.62% 23.80% +0.82
Large Companies* 29.00% 27.29% +1.71
Medium Companies* 18.54% 18.81% -0.27
Small Companies* 33.58% 30.40% +3.18
Highest 55.04% 43.13% +11.91
Lowest 7.60% 7.96% -0.36
Source: Staffing Industry Analysts
*Determined by Annual Revenue: Very Large = over €500m, Large= €50m-€500m, Medium = €5m-€50m, Small = less than €5m
© 2011 Crain Communications Inc
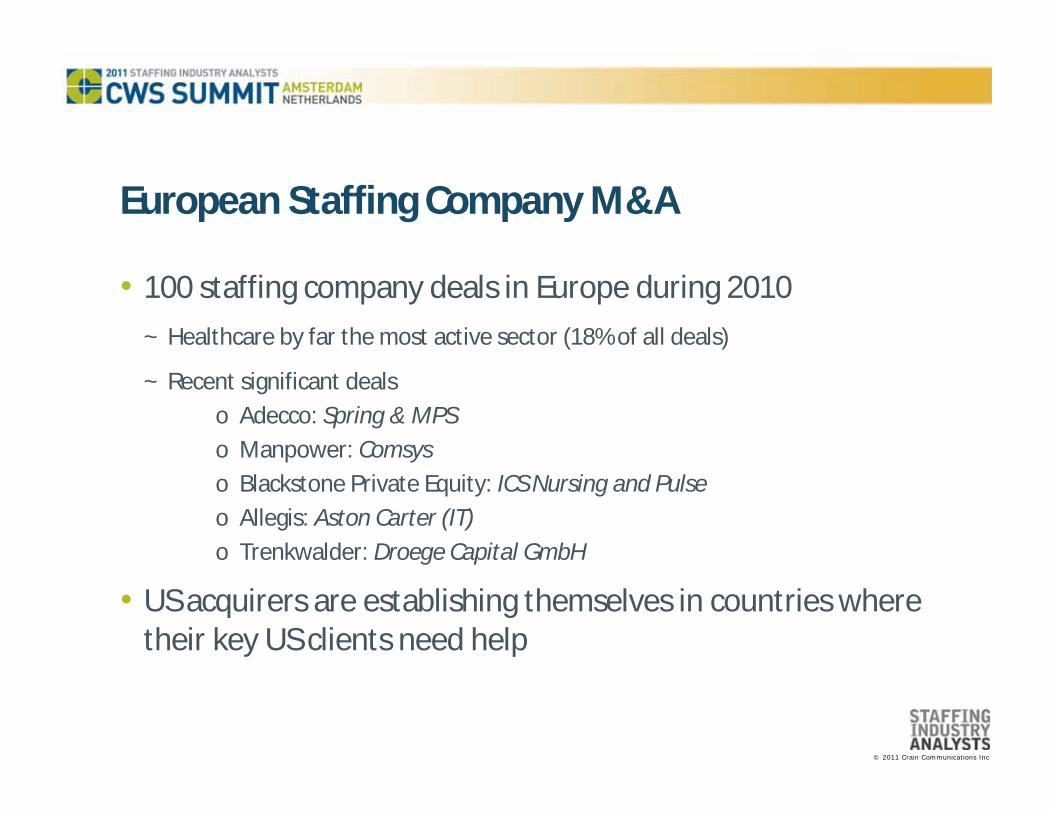
European Staffing Company M&A
• 100 staffing company deals in Europe during 2010
~ Healthcare by far the most active sector (18% of all deals)
~ Recent significant dealso Adecco: Spring & MPS o Manpower: Comsyso Blackstone Private Equity: ICS Nursing and Pulseo Allegis: Aston Carter (IT)o Trenkwalder: Droege Capital GmbH
• US acquirers are establishing themselves in countries where their key US clients need help
© 2011 Crain Communications Inc
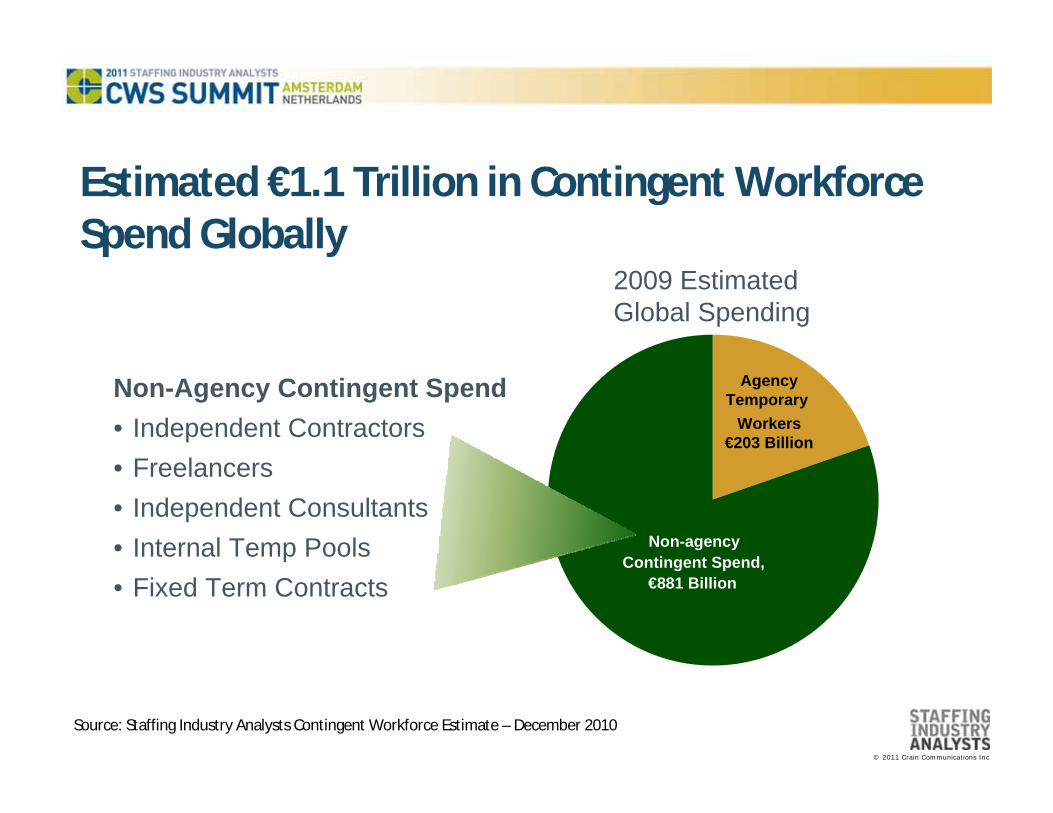
Estimated €1.1 Trillion in Contingent Workforce Spend Globally
Source: Staffing Industry Analysts Contingent Workforce Estimate – December 2010
2009 EstimatedGlobal Spending
AgencyTemporary
Workers€203 Billion
Non-agency Contingent Spend,
€881 Billion
Non-Agency Contingent Spend• Independent Contractors• Freelancers• Independent Consultants• Internal Temp Pools• Fixed Term Contracts

© 2011 Crain Communications Inc
AgencyTemps
Non-Agency Contingent Workers

© 2011 Crain Communications Inc
AgencyTemps
Non-Agency Contingent
WorkersTraditional Workers

© 2011 Crain Communications Inc
The Demographic Crisis: It’s Back!
Source: UN Department of Economic & Social Affairs
World Population by Age Group
6 bn
5 bn
4 bn
3 bn
2 bn
1 bn
01950 2050
15-59
0-14
60+
2011
Europe Population by Age Group
1950 2050
500m
400m
300m
200m
100m
0
15-59
0-14
60+
2011

© 2011 Crain Communications Inc
Contingent Workforce Buyer Survey 2011

© 2011 Crain Communications Inc
Contingent Workforce Buyer Survey
gggg
<€50 million
€50 million -€99 million
€100 million -€199 million
€200 million -€399 million
€400 million -€699 million
>€700 million
Survey Composition Europe: Estimated Annual Spend on Contingent Work
Source: 2011 Contingent Workforce Buyer Survey
31%
25%
19%
10%
10%
4%

© 2011 Crain Communications Inc
Question:What do you think is the “right” or “healthy” proportion of contingent
workers for your organisation today?
Source: 2011 Contingent Workforce Buyer Survey

© 2011 Crain Communications Inc
Source: 2011 Contingent Workforce Buyer Survey

© 2011 Crain Communications Inc
Question:What do you think is the “right” or “healthy” proportion of contingent
workers for your organisation ideally?
Source: 2011 Contingent Workforce Buyer Survey
© 2011 Crain Communications Inc
Source: 2011 Contingent Workforce Buyer Survey
© 2011 Crain Communications Inc
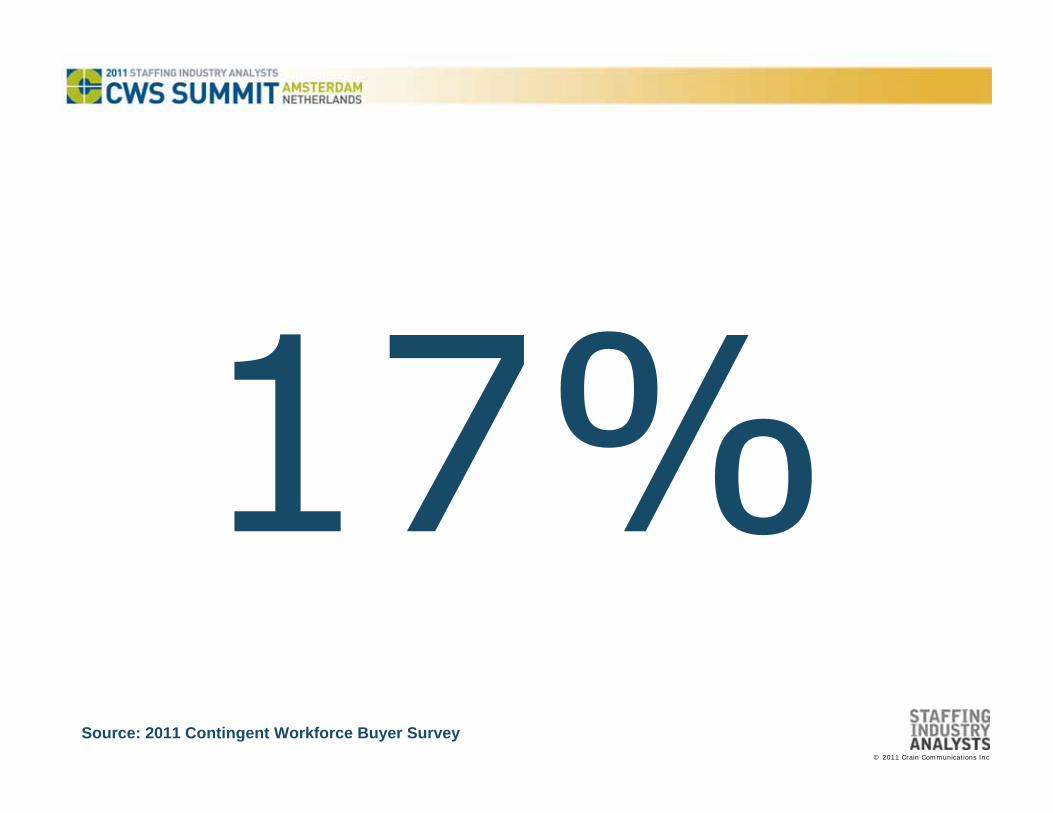
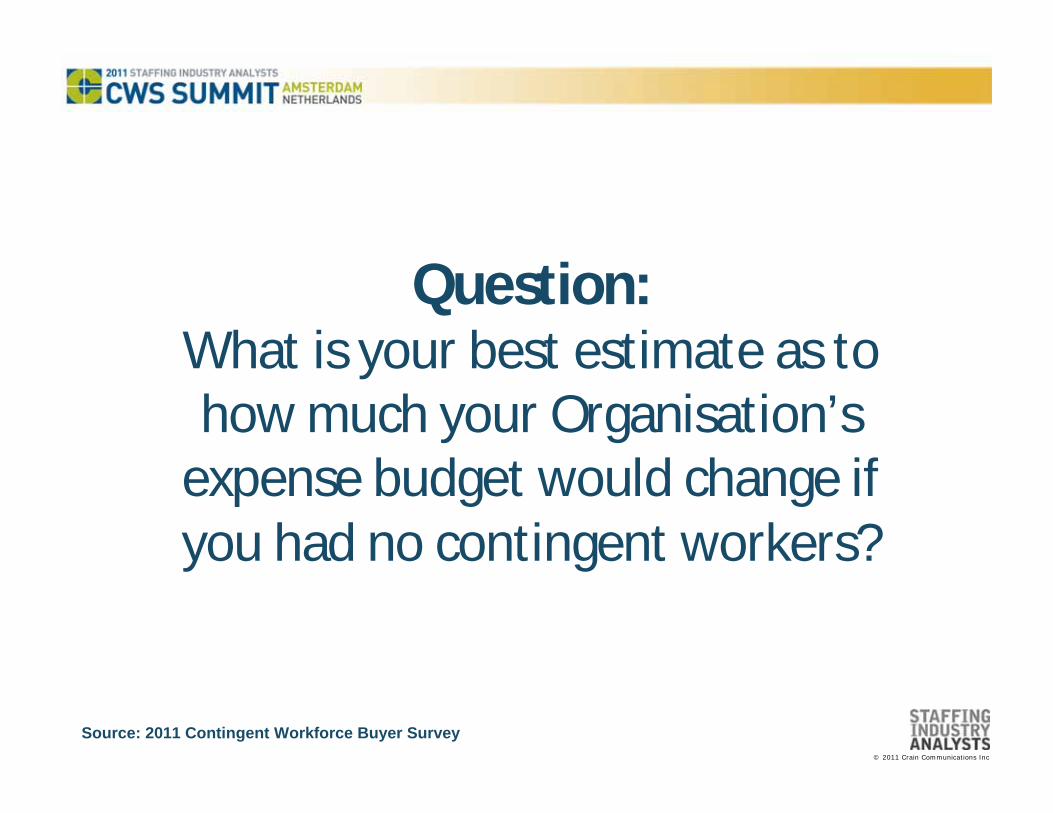
Question:What is your best estimate as to how much your Organisation’s
expense budget would change if you had no contingent workers?
Source: 2011 Contingent Workforce Buyer Survey
© 2011 Crain Communications Inc
Source: 2011 Contingent Workforce Buyer Survey

© 2011 Crain Communications Inc
Supplier Report Card
• How would you rate the overall performance of your primary staffing supplier? B
0%5%
10%15%20%25%
0 1 2 3 4 5 6 7 8 9 10
Detractors Promoters
ExtremelyLikely
ExtremelyUnlikely
Passives
• How likely are you to recommend them to a friend?• Net promoter score: Europe = -8, North America = +26

© 2011 Crain Communications Inc
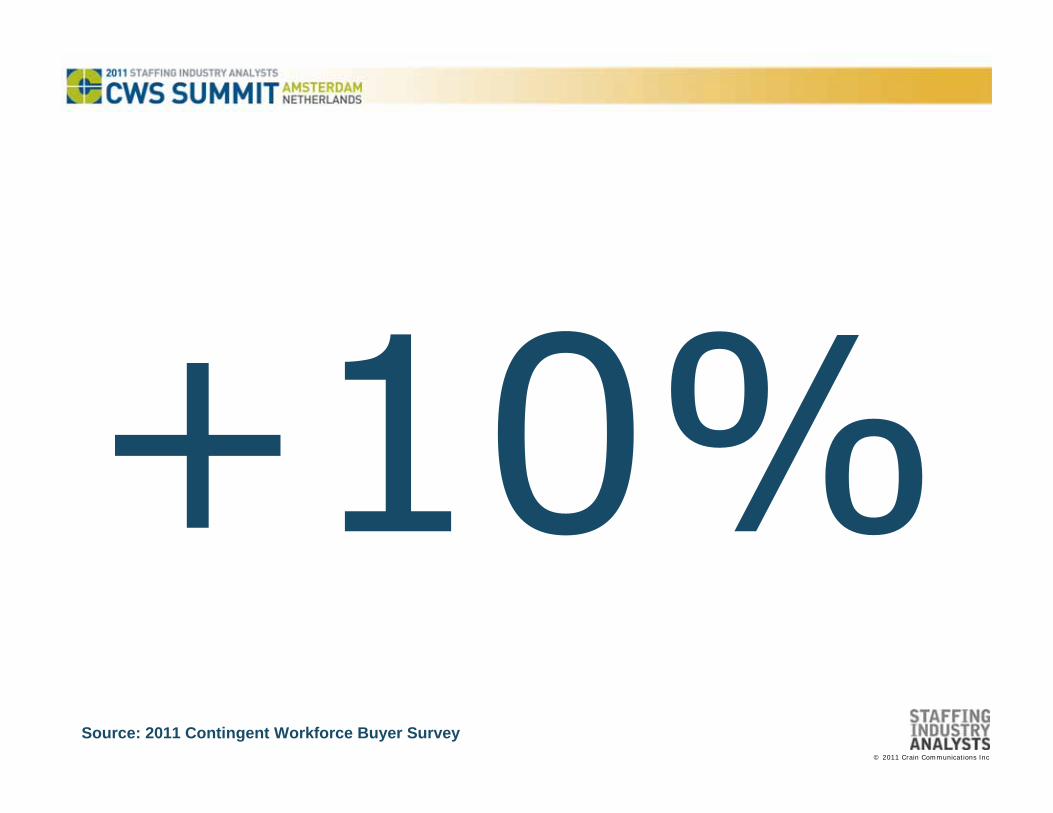
Buyers Plan Increased Use of Contingent Work
Source: 2008-2011 Contingent Workforce Buyer Survey
Median estimate of Percent of CW
0%
2%
4%
6%
8%
10%
12%
14%
16%
2008 2009 2010 2011 2013 (P)
NA
WE

© 2011 Crain Communications Inc
Source: 2004-2011 Contingent Workforce Buyer Survey
0%
10%
20%
30%
40%
50%
60%
70%
80%
2004 2005 2006 2007 2008 2009 2010 2011
NA
WE
Buyers More Focused on Contingent Work
Per Cent of Buyers who spent more than 50% of time on CW Issues

© 2011 Crain Communications Inc
Source: 2008-2011 Contingent Workforce Buyer Survey
Growing Interest in Global Contingent Workforce Programme Management
Per Cent of Buyers who manage CW on a global basis
0%
10%
20%
30%
40%
50%
60%
70%
2008 2009 2010 2011 2013 (P)
NA
WE

© 2011 Crain Communications Inc
Procurement in Lead
Source: 2005-2011 Contingent Workforce Buyer Survey
Per Cent of Buyers with Procurement taking lead in Staffing Supplier selection
0%
10%
20%
30%
40%
50%
60%
70%
80%
2005 2006 2007 2008 2009 2010 2011
NA
WE
© 2011 Crain Communications Inc
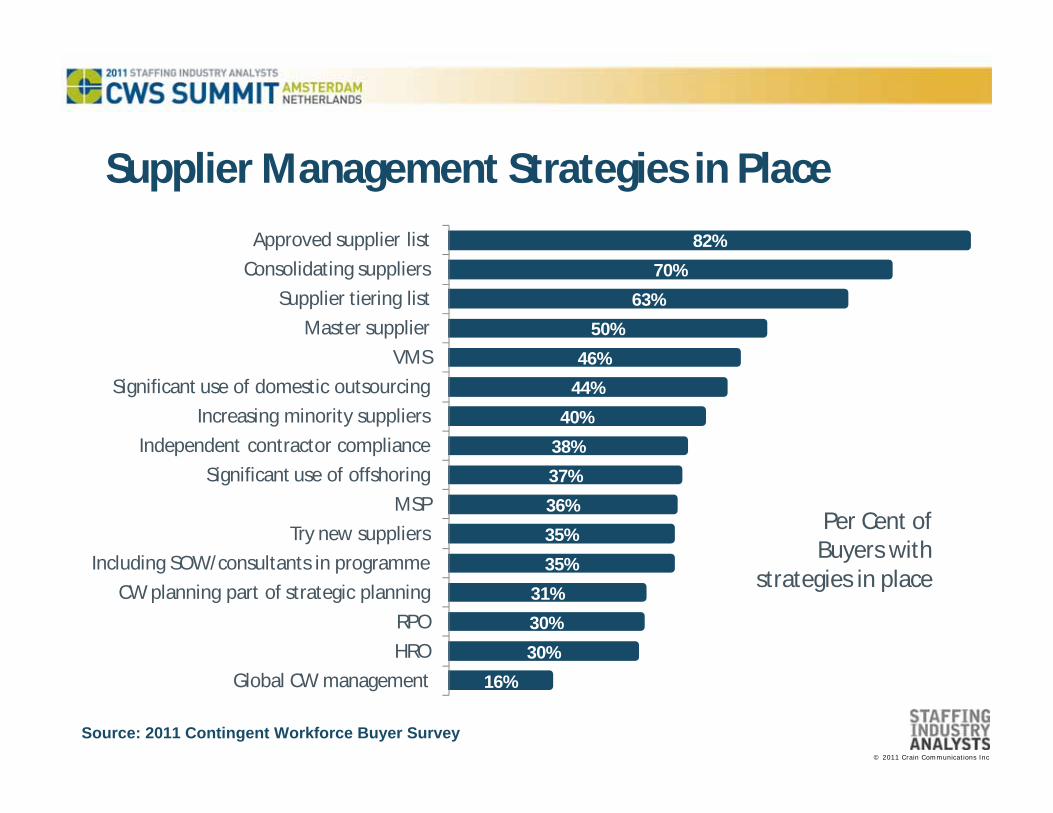
Supplier Management Strategies in Place
Source: 2011 Contingent Workforce Buyer Survey
Per Cent of Buyers with
strategies in place
82%
70%
63%
50%
46%
44%
40%
38%
37%
36%
35%
35%
31%
30%
30%
16%
Approved supplier list
Consolidating suppliers
Supplier tiering list
Master supplier
VMS
Significant use of domestic outsourcing
Increasing minority suppliers
Independent contractor compliance
Significant use of offshoring
MSP
Try new suppliers
Including SOW/consultants in programme
CW planning part of strategic planning
RPO
HRO
Global CW management

© 2011 Crain Communications Inc
Source: 2011 Contingent Workforce Buyer Survey
Per Cent of Buyers with
strategies planned over
next two years
Supplier Management Strategies Planned 9%
18%
23%
18%
39%
21%
24%
26%
23%
35%
30%
48%
56%
28%
26%
40%
Approved supplier list
Consolidating suppliers
Supplier tiering list
Master supplier
VMS
Significant use of domestic outsourcing
Increasing minority suppliers
Independent contractor compliance
Significant use of offshoring
MSP
Try new suppliers
Including SOW/consultants in programme
CW planning part of strategic planning
RPO
HRO
Global CW management

© 2011 Crain Communications Inc
Contingent Workforce Buyer Compensation
Source: 2011 Contingent Workforce Buyer Survey
<€49k
€50-74k
€75-99k
€100-149k
>€150k
Annual Base Salary 2010
Average Annual Base Salary 2010 = €88,200
Average Annual Increase 2009/2010 = 3.7%
13%
26%
26%
27%
8%

© 2011 Crain Communications Inc
Contingent Workforce Buyer Compensation
Source: 2011 Contingent Workforce Buyer Survey
None<€10k€10-19k€20-29k€30-39k>€40k
Annual Bonus (or other compensation ) 2010
Average Annual Bonus 2010 = €15,279
Median 2010= €10,000
11%
36%
22%
13%
9%
9%

© 2011 Crain Communications Inc
Any Questions?
20 June | 12:45 pm | Foyer Okura, Amstel, Heian I, White Leeuw
Optimum Sponsors: Alexander Mann Solutions | Allegis Group Services | Fieldglass | Gibbs S3 | IQNavigatorKellyOCG | Peopleclick Authoria | ProcureStaff Technologies | Volt Consulting Group | WorkforceLogic
Pinnacle Sponsors:

© 2011 Crain Communications Inc
Networking Lunch and Exhibit Time
Sponsored by:
20 June | 12:45 pm | Foyer Okura, Amstel, Heian I, White Leeuw