European Commission - January 2010 European Commission – January 2010.


European Commission
Abrasive water-jet cutting technique from the laboratory stage into real application
1995
G. Meier\ H. Louis\ G. Pilot2
1 Universitat Hannover IW AppelstraBe 11 A
D-30167 Hanover
2 CEA, DPEI/SERAC CEN Saclay, Bat. 389
F-91191 Gif-sur-Yvette Cedex
Contract No F12D-0009
This work was performed in the framework of the European Communities' research programme on the decommissioning of nuclear installations (1989-93)
Section C: Alternative tests
Directorate-General Science, Research and Development
I
EUR 15241 ~~

Published by the EUROPEAN COMMISSION
Directorate-General XIII Telecommunications, Information Market and Exploitation of Research
L-2920 Luxembourg
LEGAL NOTICE
Neither the European Commission nor any person acting on behalf of the Commission is responsible for the use which might be made of the
following information
Cataloguing data can be found at the end of this publication
Luxembourg: Office for Official Publications of the European Communities, 1995
ISBN 92-827-0222-7
© ECSC-EC-EAEC, Brussels • Luxembourg, 1995
Printed in Luxembourg

Table of Content
Summary 1
Introduction 2 Abrasive Jet Generation 2 Pressure generation 2 Jet generation 3
Experimental Work and Results 5
B.1 Definition of cutting parameters 5
Minimisation of consumed water 10 Minimisation of used abrasives 12
B.2 Development of control systems 15
B.2.1 Preparation of the test equipment 16
B.2.2 Tool control 17
B.2.3 Control of the cutting result 22
B.3 Methods to replace worn parts of the cutting head 28
B.4 Characterisation and handling of secondary waste 30
B.4.1 Preparation of the test facility 30
B.4.2 Measurement and characterisation of the sec.emmissions 35 Balance of the secondary emissions 35 Size distribution of abrasives and sedimented dross 39 Characterisation of the aerosols in the exhaust duct 42 Gas 44
Kerf appearance 44
B.4.3 Methods to lower the spreading out of the emissions 46 Cutting through 46 Kerfing 49
Ill

B.4.4 Determination of the efficiency of different methods Balance of the secondary emissions
Size distribution of abrasives and sedimented dross Characterisation of the aerosols in the exhaust duct
Conclusions and Outlook
References
Annexes
IV
52 54 56 63
65
67

Summary
The aim of the project was to qualify the abrasive water jet cutting technique for application in nuclear decommissioning. First, the cutting parameters which are known from industrial application had to be adapted to the special conditions of dismantling contaminated or activated material. Mainly, the minimisation of the secondary waste was of importance. Therefore tests were carried out to reduce the amount of abrasives as well as the consumption of water by optimising the cutting parameters. The efficiency of the abrasives was increased by reducing the abrasive flow rate and by increasing the working pressure. The minimisation of the water consumption can be realised by using a high working pressure and a small nozzle diameter. The operation during dismantling work has to be remote controlled. Therefore, methods are required to control the state of the wear of the cutting tool as well as the cutting result. The tool control can be realised by measuring the sucked-in air flow rate. By this technique the state of wear as well as the conditions of abrasive transport can be supervised. Experiments have shown, that sound analysis are no sufficient method to check the cutting result (cutting through or kerfing only). But in case of kerfing the reflected jet can be detected by a deflector plate and an adapted accelerometer. Different tests have been carried out to quantify the secondary waste. Abrasive water jet cutting produces a small amount of aerosols, especially when cutting under water. Most of the waste is sedimented dross. During the cutting process the abrasive particles disintegrate, so the mean diameter of the particles is less than 150 !lfi1 in most cases. When kerfing the use of a suction hood can lower the spreading out of the secondary waste. The adaptation of a separation unit like a hydrocyclone can help to clean the water of the cutting basin. During the tests about 70 % of the solid waste was caught and separated by the cyclone. Using optimised cutting parameters to minimise the consumption of water and abrasives and separating the waste from the water by using a cyclone can lead to an important reduction of waste. In addition methods have to be investigated in future to recycle the separated abrasives. First tests point out that a recycling of 80-90 % of the abrasives is within reach.
1
Introduction
An increasing number of technical installations are hazardous by themselves (like nuclear installations) or they have taken place in inaccessible environment (like offshore structures). When finishing lifetime all these facilities have to be removed without exposing the operation staff to danger and without contaminating the environment.
Conventional tools to do these jobs are percussive hammers, different kinds of saws, blasting techniques and thermal cutting methods like plasma cutting /1/. But unfortunately all cutting techniques have specific disadvantages: They produce a lot of dust and mechanical load (hammer, blasting, saw), the weight of the tools is quite high (saw, hammer) and it is difficult to use them remote-controlled (hammer). Plasma cutting technique is applicable to dismantle nuclear installations, but the tool produces diffi
cult-to-handle aerosols even when working under water /2/.
An alternative non-thermal method is the abrasive water jet cutting technique: Small mineral particles accelerated by a high speed water jet, are able to cut any kind of material. Advantages of this technique are I 1,3/:
- non-contacting process -small cutting forces (for the manipulator) - small and lightweight cutting head - non-thermal cutting process, no fire risk - no chemical reaction products -small kerfs (small amount of radioactive waste when cutting activated structures) - all kinds of material can be cut
The main disadvantage is the great amount of secondary waste produced during operation. Therefore, it is necessary in case of dismantling operations in nuclear environment to reduce the added abrasives and to reach a high cutting performance with respect to the minimisation of secondary waste. Additionally the generation of aerosols has to be investigated. For using this cutting technique remote controlled it is necessary to adapt controlling devices to check the reliability of the tool as well as the cutting result during operation.
ABRASIVE JET GENERATION
Pressure generation
For pressurising the water slowly working pressure intensifiers are used. These intensi-
2

fier pumps are normally double-ended pistons utilising differential areas to multiply pressure provided by a standard variable displacement hydraulic pump (fig. 1). With a commercial available intensifier pump pressures up to 4000 bar are achievable, but at a comparatively low level of flow rate of 2 to 41/min. Up to three intensifiers are mounted in one pumping set.
water to cutting head
water motor oilpump inlet ....._ _____ ___,
intensifier pump
Jet generation
pressure antensifier
Figure 1 Draft of an intensifier pump
The abrasive water jet is formed in a special mixing head. First a plain water jet is produced and the abrasives are added afterwards in a hard metal or ceramic mixing nozzle. The mixing head works according to the principle of waterjet pump, what means that the high speed water jet generates a suction pressure in the suction port, which produces a pneumatic transport of the abrasives into the mixing head.
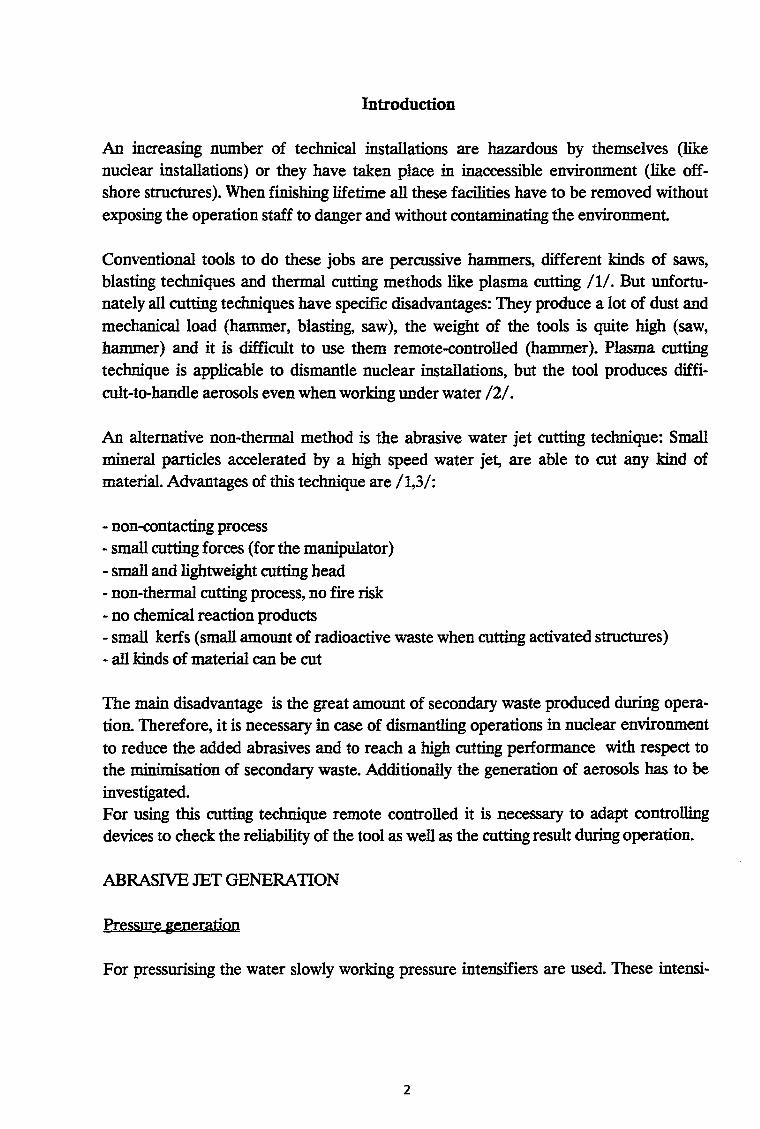
For all the cutting tests a self-designed abrasive cutting head was used /3,4/. To adjust the axis of the focusing nozzle on the high speed water jet a ball-and-socket joint was created (fig. 2). So the focusing nozzle is movable around the water jet nozzle within small angles. In case of not adjusting the cutting head the irregular wear in the focusing nozzle increases rapidly and cutting efficiency decreases because of friction loss. After adjusting, the movable part of the cutting head is fixed by adjusting screws.
3
high pressure water
•
water jet
focusing nozzle ----
Figure2 Abrasive cutting head
ball-and
socket joint
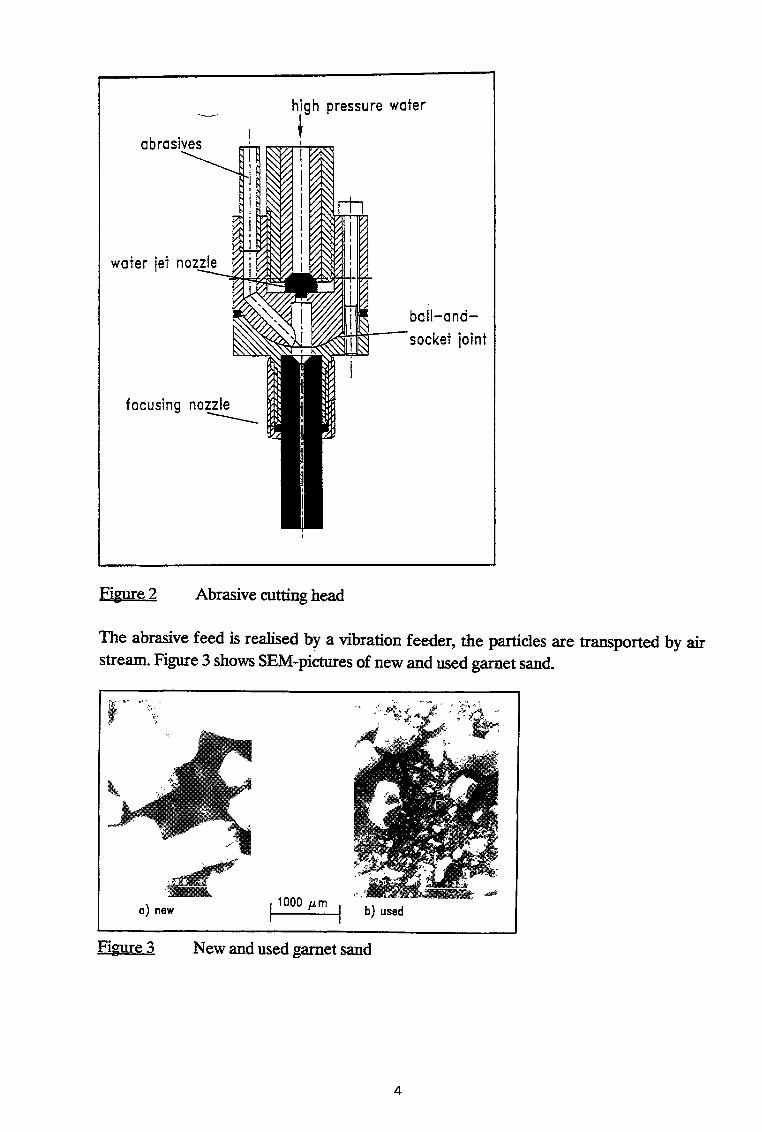
The abrasive feed is realised by a vibration feeder, the particles are transported by air stream. Figure 3 shows SEM-pictures of new and used garnet sand.
a) new 1
1000 JLm I b) . . used
Figure3 New and used garnet sand
4

Obviously there is a disintegration of the particles during the cutting process. For the cutting experiments samples of austenitic steel X2 CrNi18 8 (1.4301)) and
aluminium alloy (AIMgSi 0.5) have been used. All the samples were not cut through but kerfed to measure and compare the depth of kerf. For measuring aerosols also samples made out of copper have been used
Figure 4 gives an overview of an abrasive water jet cutting system. In addition to the equipment mentioned before a handling system is necessary as well as a catcher unit to protect the environment from the hazardous jet.
water inlet
Figure4
p
catcher
flexible high
pressure tubing
Abrasive water jet cutting system
handling system
The reported tests were carried out in a water basin with a numerical-controlled 2-dimensional traverse mechanism. All tests took place under water.
Experimental Work and Results
B.l. Definition of cutting parameters
For the application of abrasive water jets in case of decommissioning nuclear facilities it
is necessary to reduce the abrasive flow rate as well as the amount of used water to minimum values due to the problems of handling the secondary waste. Up to now there is no recycling technique available to reuse the abrasives several times.
The used abrasives are mixed with removed workpiece material - so they have to be treated as radioactive waste in case of cutting contaminated or activated material. Also
the handling of the water is quite difficult because it has to be cleaned very carefully.
5
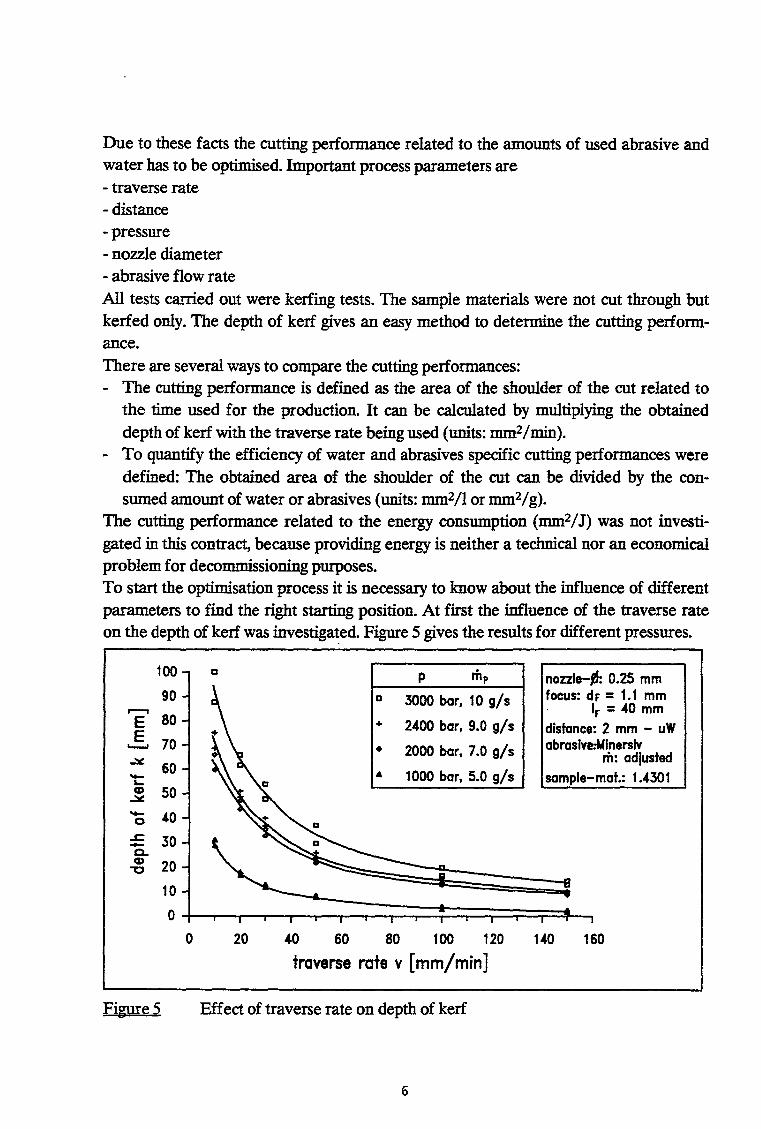
Due to these facts the cutting performance related to the amounts of used abrasive and water has to be optimised. Important process parameters are - traverse rate -distance -pressure - nozzle diameter - abrasive flow rate All tests ca_rried out were kerfing tests. The sample materials were not cut through but kerfed only. The depth of kerf gives an easy method to determine the cutting performance. There are several ways to compare the cutting performances: - The cutting performance is defined as the area of the shoulder of the cut related to
the time used for the production. It can be calculated by multiplying the obtained depth of kerf with the traverse rate being used (units: mm2/min).
- To quantify the efficiency of water and abrasives specific cutting performances were defined: The obtained area of the shoulder of the cut can be divided by the consumed amount of water or abrasives (units: mm2/l or mm2/g).
The cutting performance related to the energy consumption (mm2/J) was not investigated in this contract, because providing energy is neither a technical nor an economical problem for decommissioning purposes. To start the optimisation process it is necessary to know about the influence of different parameters to find the right starting position. At first the influence of the traverse rate on the depth of kerf was investiga~ed. Figure 5 gives the results for different pressures.
100 a p rilp nozzle-IJ: 0.25 mm 90
,...-,
E 80 E 70 ........ ~
60 -.._
D 3000 bar, 1 0 g/ s focus: dF = 1.1 mm IF= 40 mm
+ 2400 bar, 9.0 g/s distance: 2 mm - uW
• 2000 bar, 7.0 g/s abrasive:Minersiv m: adjusted
A 1000 bar, 5.0 g/s sample-mat.: 1.4301 CD 50 ~ - 40 0
-'= 30 -c.. CD 20 ""0
10
0
0 20 40 60 80 100 120 140 160
traverse rate v [mm/min]
FigureS Effect of traverse rate on depth of kerf
6

The relation appears approximately inverse proportional: Increasing the traverse rate causes a decrease in depth of kerf by the same factor. Figure 6 shows the attainable cutting performance for the variation of the traverse rate.
'Cij' 50 ~ E E M> .......
c.."' CD 30 (,)
c:: 0
E 2.0 ._ 0
"t: CD a.. 10 C)
.5 -
nozzle-jf: 0.2.5 mm distance: 2. mm - uW focus: d F = 0.95 mm abrasive: Mlnerslv
lr = M> mm sample-mat.: 1.4301 a
3000 bar, 10.0 g/s
----~·----:·---=- 2.M>O bar, 9.0 g/s • 2000 bar, 7.0 g/s
1000 bar, 5.0 g/s
-::l o~~~~.-~~~~~~~-r~-r~~ (,)
0 .c.o 80 120 160 2.00 240
traverse rate v [mm/min]
Figure 6 Effect of traverse rate on cutting performance
When reaching a specific traverse rate for all pressures the cutting performance is not affected by increasing traverse rates. For these traverse rates the depth of kerf is inverse proportional to the traverse rate. For any lower traverse rate the obtained kerfing depth increases not as much as predicted. The reason can be found in figure 5. For example when using 3000 bar at a traverse rate of 20 mm./min a depth of kerf of more than 60 mm can be reached in austenitic steel. For a further reduction of cutting speed the depth of kerf will grow further on, but the friction between abrasive water jet and the shoulder of the cut and the increasing distance between cutting head and the bottom of the kerf will cause a loss of hydraulic power. So for kerfs deeper than about 30 mm (calculated from fig. 6) the cutting process is not as effective as for less deep kerfs. The conclusions of these tests are: - To compare the cutting performances for different parameters it is useful to take
traverse rates which allow to kerf less than 30 mm deep. For these conditions the product of traverse rate and depth of kerf is nearly constant, so the results for different traverse rates are comparable.
- For real cutting jobs which make it necessary to cut deeper than 30 mm the decrease in cutting efficiency has to be taken into account.
According to figure 7 the best cutting performance resp. depth of kerf is attainable for small working distances. Increasing the distance causes a decrease in depth of kerf for
7
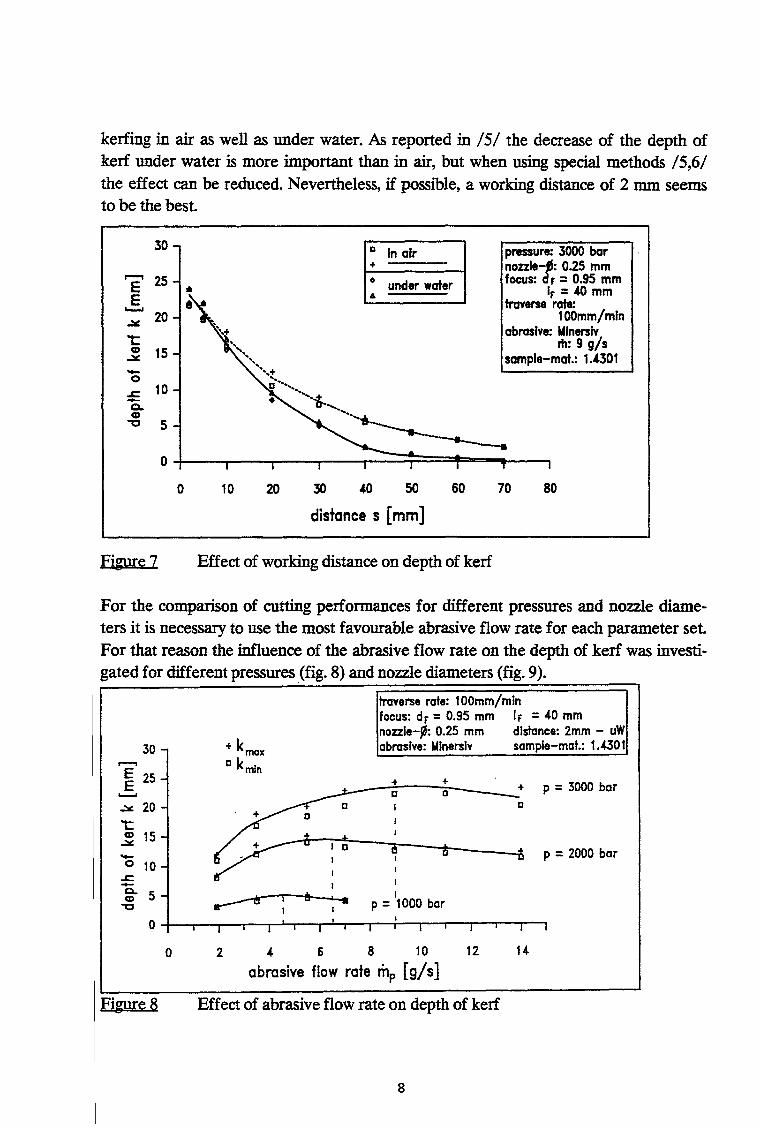
kerfing in air as well as under water. As reported in /5/ the decrease of the depth of kerf under water is more important than in air, but when using special methods /5,6/ the effect can be reduced. Nevertheless, if possible, a working distance of 2 mm seems to be the best.
30
,....., 25 E
E ........ ..:.: 20
't: CD 15 ..:.: -0
J.: 10 -c.. CD
"'t:J 5
0
0
Figure 7
10 20
a In air +
• under water 6
30 40 so 60
distance s [mm]
Effect of working distance on depth of kerf
pressure: 3000 bar nozzle-fJ: 0.25 mm focus: d r = 0.95 mm
lr = .40 mm traverse rate:
100mm/min abrasive: Mlnersiv
rh: 9 g/s sample-mat.: 1.4301
70 80
For the comparison of cutting performances for different pressures and nozzle diameters it is necessary to use the most favourable abrasive flow rate for each parameter set.
For that reason the influence of the abrasive flow rate on the depth of kerf was investigated for different pressures _(fig. 8) and nozzle diameters (fig. 9).
30 ....-. E 25 E ........
..:.: 20 't:
CD 15 ...::.:: -0 10 J.: -c.. 5 CD "'t:J
0
0
Figure B
+ kmax 0 kmln
I D
I
I
~
traverse rate: 100mm/min focus: dr = 0.95 mm lr = 40 mm nozzle-~: 0.25 mm distance: 2mm - uW abrasive: Mlnerslv sample-mat.: 1..(301
+ D
I
I
I
+ D
p = 1000 bar
+ p = 3000 bar D
p = 2000 bar
2 4 6 8 10 12
abrasive flow rate mp [g/ s]
Effect of abrasive flow rate on depth of kerf
8

40
35 ..---, E 30 E ..__, ~ 25
"t: 20 CD ~ - 15· 0
.s::. - 10 c.. CD
""C 5
0
Figure 9
0
. I
i !
• do= 0.25 mm dr = 0.95 mm
do= 0.15 mm dF = 0.50 mm
do= 0.30 mm dr = 1.10 mm
d0 = 0.40 mm dr = 1.50 mm
pressure: 3000 bar
focus: I r = 40 mm traverse rate:
100mm/mln distance: 2 mm - uW abrasive: Wlnerslv sample-mat.: 1.4301
5 1 0 15 20 25 30
abrasive flow rate rhp [g/ s]
Effect of abrasive flow rate on depth of kerf ( dn: nozzle diameter; dF: focus diameter)
For all pressures and nozzle diameters being used there is an optimal abrasive flow rate existing. Lower as well as higher flow rates lead to a decrease in depth of kerf. The optimal flow rates are corresponding very good to the water flow rates, as figure 10 shows. The water mass flow can be calculated by the first equation of figure 11.
'E E ........ c
"'0 ~
-! E
..!:! "'0
CD "N N g
0.15
0.20
0.25
0.30
0.40
Figure 10
pressure p [bar]
1000 2000 2400 3000 1000 2000 2400 3000 1000 2000 2400 3000
5.2 7.3 7.8 9.2 2.6 3.0 0.33 0.33
10.0 14.0 15.5 17.5 5.1 5.8 0.33 0.33
15.0 20.8 24.0 26.7 4.5 6.5 8.0 9.0 0.30 0.31 0.33 0.34
21.7 30.0 33.4 38.3 6.5 9.3 11.0 13.0 0.30 0.31 0.33 0.34
36.6 52.0 59.1 64.9 20.0 22.0 0.34 0.34
water flow rate ritw [g/s] lopt. abrasive flow rate rilp [g/ s] opt. mass ratio R (rilp /mw) measured c11lculated
Water flow rates Optimal abrasive flow rates Abrasive mass ratio R
9

v=v~·p·
water flow rate: 0
jet velocity: v
nozzle diameter. d0
pressure: p
density of water: p
Figure 11 Calculation of the water flow rate
According to the results in figure 10 for all tests a mass ratio R of about 0.33 has been used to reach the optimal cutting performance.
Minimisation of consumed water
As shown in figure 11 the water flow rate is influenced by the pressure and the nozzle
diameter. The effect of both parameters on the specific cutting performance will be described in the following figures. Figure 12 gives the effect of the pressure on the cutting performance as well as on the
specific cutting performance related to the water consumption.
,....., 80 tn
:>.... N 70
E ~ 60
en c.:. 50 Q) u c= 40 c E ~ 30
"t: :g_ 20 C)
c 10 :;: - /
cutting performance
specific cutting performance
/
AIMgSiO.S
nozzle-.fJ: 0.25 mm focus: d r = 0.95 mm
lr = 4-0 mm distance: 2 mm - uW abrasive: Minersiv
rit: adjusted
3000
g 0;---~~--~--~----~--~----~----T 0
3500 0 500 1 000 1500 2000 2500 3000
pressure p [bar]
Figure 12 Effect of pressure on cutting performance
10

An increasing pressure causes a linear increase in cutting performance and also a better specific cutting performance. For the highest pressure the exploitation of the water is
the best. So it is useful to increase the pressure to values above 3000 bar, but in that case the tool life of the pressure pump (sealing) and the nozzles will be decreasing rapidly. For the tests the abrasive flow rate was adjusted to the water flow rate according to figure 10 (R = 033). The results of a variation of the nozzle diameter are given in figure 13.
,......, "' ~ 60 E E 50 .._..
~ 40
~ u c:
30 c E .... 0 20 't: ~ c.. C) 10 c:
:;::: - 0 :l u
Figure 13
0
cutting performance
spec. cutting performance
1.4301
0.1 0.2 0.3 0.4 0.5
nozzle diameter d0 [mm]
Effect of nozzle diameter on cutting performance
pressure: 3000 bar focus: d r adjusted
lr = ~0 mm distance: 2 mm - uW abrasive: Minerslv
2000
m: adjusted
•en CL.
Although the cutting performance is increasing for bigger nozzles the specific performance has an optimum for medium sized nozzles because of the rapid increase of the
water flow rate for bigger nozzles. The abrasive flow rate was adjusted in the way already mentioned. To reach the optimal efficiency related to the water consumption a
nozzle with a diameter of 020-0.25 mm should be used. Summing up for an optimal exploitation of the water the pressure should be as high as possible using a medium sized nozzle. The abrasive flow rate should be fixed to a mass
ratio of about 033 according to figure 10. In addition it has to be mentioned that for these chosen parameters the machining time for a given job is not minimal, because the cutting performance (related to the time) is not maximal (see fig. 13) because of the
smaller nozzle size.
11

Minimisation of used abrasives
To find parameters for the best exploitation of the abrasives two strategies can be used. On one hand the best values regarding pressure and nozzle diameter can be determined for the optimal abrasive flow rate (fig. 10), on the other hand the abrasive flow rate can be lowered to values smaller than mentioned in figure 10. In that case the cutting performance related to the cutting time will be decreased (see fig. 8, 9), but the exploita
tion of the abrasives will be better as shown later in the report. Figure 14 gives the effect of the abrasive flow rate on the specific cutting performance (related to the abrasive flow rate) for different pressures.
r--'1 10 nozzle-!: 0.25 mm g) pressure p focus: F = 0.95 mm ~ a 1000 bar IF= 40 mm
E distance: 2 mm uW E 8 + 2000 bar abrasive: Winersiv ~
• 3000 bar sample-mat.: 1.4301 . "' CL
6 CD c r:: c E ~
4 0 "t:
CD c. 2 0 r::
:;:: -:::1 0 c c3 0 2 4 6 8 10 12 14 CD
abrasive flow rate mp [g/ s] c. (I)
Figure 14 Effect of abrasive flow rate on specific cutting performance
The increase of pressure causes a better exploitation of the abrasives. Additionally the smaller flow rates result in a better specific cutting performance. The smallest flow rate causes the best exploitation regarding the abrasives. But, to fulfil a given cutting job, for smaller flow rates the time which is necessary to do the job will increase and so does
the consumption of water and energy. For using different nozzle sizes the effect is is given in figure 15.
12

rc; 10
~ E E .._.. 8
• ~
6 CD u c c E 4 0 't:
CD c.. 2 C) c
:;:: -~ 0 u . u CD c.. en
Figure 15
0
nozzle-{~
a 0.15 mm
• 0.25 mm
+ 0.30 mm
• 0.40 mm
5 10 15 20
abrasive flow rate mp [g/s]
Effect of abrasive flow rate on specific cutting performance
25
pressure: 3000 bar focus: dF adjusted
IF= 40 mm distance: 2 mm uW abrasive: Mlnerslv
ril: adjusted sample-mat.: 1.4301
30
Smaller abrasive flow rates cause a better exploitation of the abrasives. For high flow rates bigger nozzle are being more useful, but a decrease of the abrasive flow rate for smaller nozzle diameters leads to a faster increase of the specific cutting performance. Again it has to be mentioned that using smaller nozzles and lower abrasive flow rates help to save abrasives but leads to an increasing machining time, energy and water consumption. Figure 16 gives an example for this effect.
13

t [min]
mA [g]
Vw [I]
E [kJ]
ll m [g]
t [min]
mA [g]
Vw [I]
E [kJ]
ll m [g]
pressure [bar]
2000 2400
abrasive flow rate [g/ s]
I 10 ! i
I i
2 I 20 2• l 10 20 2 I I I
I
33.3 25.0 33.3 1 28.6 1 20.0 25.0 25.0 I
4000 ! 150001 40000 3430 1 12ooo 30000 3000 ! I
I 41.5 ! 31.2 I 41.6 41.2 1 28.8 36.0 40.0 i
i
8300 ! 6240 !
0.40
2 110
25.0 9.1
3000 5460
i
8320 989o 1 6912 8640 12oooj :
160
nozzle diameter: 0.25 mm material: austenitic steel, 20 mm thickness cutting length: 1 m
nozzle diameter [mm]
0.30
abrasive flow rate [g/s]
i I I I
I 20 2 I 10 I 20 2 I i I
7.7 25.0 10.0 11.1 25.0 l I I
3000 i !
9240 6000 13320 3ooo 1
3000
10
12.5
7500 I
20.0
6000
0.25
10
12.5 1 I
7500
97.5 35.5 1 30.0 57.5 23.0 25.5 I 40.0 i 20.0
292501 I
106501 9000 17250 I 69oo I 7650 12ooo 1 6ooo 1
250 200
pressure: 3000 bar material: austenitic steel, 20 mm thickness cutting length: 1 m
160
Figure 16 Cutting of steel, 20 mm thickness
14
20
16.7
20000
26.8
8040
20
16.7
20000
26.8
8040

The upper part gives the results for a variation of pressure and abrasive flow rate using a fixed nozzle diameter, the lower part shows the effect of different nozzle diameters. The increasing pressure (upper part) leads to a decrease in used machining time (1. line). The consumption of abrasive, water and energy decreases, too (line 2, 3, 4 ). The smallest abrasive flow rate causes the best abrasive efficiency per meter of cut, but leads to a high energy and water consumption compared to higher flow rates of abrasive. An increasing nozzle diameter (lower part of fig. 16) causes a better exploitation of the abrasive (line 2) but also an increase of the water and energy consumption (line 3 and 4). In general smaller abrasive flow rates effect a better exploitation of the abrasives, but lead to a much higher consumption of water. So it is necessary to find a compromise between the amount of abrasives and the amount of water and the cutting time.
B.2. Development of control systems
For remote controlled operation of abrasive water jets it is necessary to control the state of the tool as well as the cutting process (cutting result) /7 I. Controlling the state of the tool means both supervising the geometry inside the cutting head (water nozzle and abrasive mixing nozzle) and monitoring the operation conditions of the cutting tool like the generation of the water jet or the abrasive transport (broken or clogged transport hose) (fig. 17).
t water
Figure 17
transJ?ort of abrasive
state of nozzle r------- state of focus and alignment
abrasive water Jet
Aspects of tool control
15

Controlling the cutting result means the detection if cutting through or kerfing only. Additionally it would be helpful to supervise the quality of the shoulder of the cut during operation.
B.2.1. Preparation of the test equipment
To develop useful sensor systems tests were carried out in a water basin (fig. 18).
tn 1\J -~
Figure 18
1200
Water basin
[IN 1/2~ X
ISOO
]tl I' • 3000 A (J MO::l.Y = 4500 Uh )1'
),
~--------~~--------~~~ 1921) ..J
For controlling the tool different measuring devices were installed (fig. 19). The supervision of the state of the water jet nozzle can be realised by measuring the water flow rate passing the pressure pump ( # 1)
To supervise the conditions of the abrasive transport tests were carried out to use sound analysis. For this purpose a hydrophone (bruel & kjaer 8103) was installed near the cutting head(# 2). For the supervision of the state of the cutting head a system to measure the sucked-in air flow rate was adapted /4/ (# 3).
Additionally it has been tried to detect the pressure loss in a special part of the transport hose (hose length Lh) and to correlate this with the air flow rate(# 4). For both measuring methods it has been tried to correlate the measuring results with the diameter of the focusing nozzle.
16

\ abrasiv.es @ and a1r ~
water basin
Figure 19· Experimental setup
high pressure water
-water
frequency analysis
The hydrophone was used also for the detection of the cutting result ( # 2). The frequencies of the sound pressure were analysed by Fourier-Transformation. Sound frequencies were measured for cutting through and kerfing a standard workpiece (austenitic steel). In addition it has been tried to use the reflected abrasive water jet in case of kerfing the workpiece to detect this fact. On the cutting head a deflector with an accelerometer was installed ( # 5) to measure signals produced by the deflected jet.
B.2.2. Tool control
The reliability of the cutting tool mostly depends on the conditions of the feeding (water and abrasives) and the state of the water jet nozzle and the focus. The state of the water nozzle can be supervised by measuring the water flow rate. In case of broken nozzle plate or water hose leakage the flow rate will increase rapidly, in case of a clogged nozzle the flow rate decreases. The flow rate can be measured at the
17

water inlet of the pump which means that the measurement system can be adapted at the low pressure side of the pump (pressure level of drinking water).
One possibility to supervise the conditions of the abrasive transport is measuring the sound pressure produced by the cutting head. Figure 20 shows the results of the sound measurements.
CD .... ::I en en CD .... 0..
-c c ::I 0 en
CD .... ::I en (I) CD .... 0..
-c c ::I 0 (I)
CD .... ::I (I) (I)
CD .... 0..
-c c ::I 0 en
0
Figure 20
·r ~· -,,..
I
2
normal working water jet, sucking in air
water jet, sucking in ambient water (broken abrasive reed hose)
water jet, producing vacuum im the mixing chamber (clogged abrasive reed hose)
4 time in s
Control of the abrasive transport by sound analysis
For normal conditions (abrasives sucked in by air) the sound pressure is very low. In case of sucked-in water (broken transport hose) the sound level increases rapidly. Also when the transport hose is clogged (in that case the cutting head produces a vacuum) the sound level is very high because of cavitation effects.
The focusing nozzle can be controlled by measuring the flow rate of the sucked-in air. Figure 21 gives the results of some tests for different pressures.
18

...--, 40 c -E ~ .._.
...J 30 0
CD -c .... ~ 20
..2 -.... -c "'C 10
CD -E Q.. en
0 c
0.8
Figure21
1.0 1.2 1.4 1.6 1.8
focus diameter d F [mm]
3000 bar 2400 bar 2000 bar ~ ., ., 1000 bar f Cl.
500 bar
nozzle-Sf: 0.25 mm focus: lr = 40 mm hose length: 4 m hose diameter: 6 mm without abrasive
2.0
Effect of focus diameter on sucked-in air flow rate
The air flow rate is nearly linear with the diameter of the focusing nozzle for a constant diameter of the water jet nozzle. An increasing water pressure causes an increase in air flow.
For different nozzle diameter the results are given in figure 22.
...--, 50 nozzle diameter d0 [mm] pressure: 3000 bar c -E 0.40 focus: IF = 40 mm ........... 0.30 ~ 40 hose length: 4 m
...J 0.25 hose diameter: 6 mm 0 0.20 without abrasive CD - 30 c 0.15 ....
~ ..2 20 -.... c "'C 10
CD -c .... ·c_
0 en c
0.8 1.0 1.2 1.4 1.6 1.8 2.0
focus diameter d F [mm]
Figure22 Effect of focus diameter on sucked-in air flow rate
19

Bigger water jet nozzles cause a higher air flow rate. The results of the nozzles 0.25 and 0.40 mm are not in the usual range of air flow, because for these tests nozzles with a changed inlet geometry were used. This changed geometry effects a better jet stability and so the efficiency of the water jet pump (abrasive cutting head) decreases. All the tests were carried out without feeding abrasives into the air flow because of the prevention of wear of the measurement device and the focusing nozzle. Figure 23 gives a comparison of results obtained with and without abrasives.
c: 24 e :::::: 20 _, 0
Q) 16 -~ ~ 12
..2 -.!:: 8 0
'"'0 Q)
"E 4 "5. fn
without abrasive ,..-
_a ___ - - -- - -- D
_____ .....
with abrasive (9 g/s)
nozzle-Sf: 0.25 mm focus: IF = 40 mm abrasive: Minersiv cut under water
--- 2000 bar
---2400 bar
- - - - 3000 bar
0 0~--~----~--~----~--~----r----r--~
0.8 0.9 1 1.1 1.2 1.3 1.4 1.5 1.6
focus diameter d r [ mm]
Figure23 Effect of focus diameter on sucked-in air flow rate
Feeding abrasives into the air flow causes a decrease in flow rate due to friction and momentum loss. But the results show the same dependence of flow rate and focus diameter for both with and without abrasives. As mentioned before the problem of measuring the flow rate during cutting is the flow of abrasives. To measure the flow rate of air two possibilities are practicable (fig. 24). On one hand the flow rate has to be measured in the hose between abrasive feed mechanism and cutting head (1). In that case the abrasives pass the measurement device, too, and cause wear. On the other hand the abrasive feed unit has to be encapsulated to measure the ingoing air flow rate (2). Both methods are difficult to handle and not useful for practical application.
20

abrasive cutting head
Figure24
flow meter 2 (for sealed feeder)
flow meter 1 (air and abrasives)
Methods for controlling the air flow rate
abrasive feed mechanism
So, according to #4 in figure 19 the pressure drop in a specific length of the transport hose was measured. The relation between this pressure difference (p1 - Pz) and the air flow rate is as follows:
p1; p2: pressure c: constant 1: hose length Q: air flow rate
Figure 25 gives the results of detailed tests for different nozzle diameters. The cutting parameters are the same as in figure 22. An increasing nozzle diameter causes an increase in air flow rate and therefore an increase in pressure loss. The pressure loss of the nozzles with a diameter of 0.25 and 0.40 mm again indicates a smaller air flow rate compared to the other nozzles. Nevertheless, the pressure loss can be correlated with the focus diameter. For fixed cutting parameters like pressure, abrasive flow rate and water nozzle diameter it is necessary to prepare calibration curves at first with different focusing nozzles of known diameters. After this, the change in diameter during operation can be calculated from the measured pressure loss by using the calibration curves.
21

100 nozzle diameter do [mm]
.--. 0.40 pressure: 3000 bar lo.. c 80 0.30 focus: IF = 40 mm .£:I E hose length: 4 m ...._.
0.25 ::3 hose diameter: 6 mm N c.. 60 0.20 without abrasive Q) lo.. ::l 0.15 en 40 en e c.. c:: 20 0
:0:: (,) ::l en
0
0.8 1.0 1.2 1.4 1.6 1.8 2.0
focus diameter d F' [mm]
Figure25 Effect of focus diameter on pressure loss
Additionally rapid changes of the pressure loss indicate irregular changes in tool behaviour. The reasons could be changes in the condition of transport, damages of the water jet nozzle or changes in alignment of water jet and focusing tube due to a collision with
the workpiece. Measuring the air flow rate or, better, the pressure loss gives the opportunity to detect such defect.
B.2.3. Control of the cutting result
For remote controlled operation of the abrasive cutting process a special method is necessary to detect the cutting result. In case of using abrasive water jets optical and
mechanical sensor systems are difficult to apply. Because of the suspended particles the optical conditions in the water are very bad, additionally optical parts and mechanical
systems can be destroyed by reflected abrasives. The produced kerf is very small so there is no possibility to bring in sensor systems. Additionally when cutting irregular structures (offshore structures with marine growth)
all contacting sensor systems are not applicable because of the risk of sticking. So the measurement of the sound pressure (according to #2 of fig. 19) seemed to be one useful method to detect the cutting result, because it is a non-contacting system which
also is not sensitive against the particle load. To distinguish between cutting through and kerfing sound frequencies were analysed.
Figure 26 gives the typical analysis of cutting through.
22

"' s:::: Q)
s::::
0
Figure26
500 1000 0 frequency in Hz
0
Sound analysis of cutting through
500
time in s
8
1000
frequency in Hz
frequency in Hz
1000
The upper part of the figure gives the sound intensity, the lower part gives the frequency analysis.
This analysis shows a significant maximum between 400 and 500 Hz. The signals were analysed up to frequencies of 1000Hz. Higher levels show no significant intensity. The position of the hydrophone was fixed by carrying out different preliminary tests. The
optimal position for a good sound pressure input seems to be quite close to the surface of the workpiece upside (close to the cutting head). The instrument should not be fixed in the reflection zone of particles but perpendicular to the feed direction of the cutting
head. All tests were carried out with this measurement geometry. Figure 27 gives the results for the kerfing tests. The magnification of the sound intensity
signal (upper part of the figure) is the same as in figure 26.
23

CD .... ;::, en en ~ a..
"'0 c: ;::, 0 en
0
~ FFT en c: CD -c: · ~--------~------~ 250 625
frequency in Hz
>== en
1000
~ FFT UJ c: CD
time 8 in s
s= ~wan• · ~------~~------~ 250 625
frequency in Hz
1000
~ ~~r~~~~~~~~ -.E ~--------~------~ frequency 1000 in Hz 250 625
Figure27 Sound analysis of kerfing
The measured value for the sound pressure in case of kerfing is not as constant as for cutting through. For this reason, also frequency analysis are different at different times.
0
····················~~~1~~·························· u,.~~~i
500 frequency in Hz
1000 0
~~~t~~~~~~~~~~ . ~
500 frequency in Hz
1000
Figure28 Frequency analysis for kerfing and cutting through
24

Unfortunately for a number of kerfing and cutting tests different results were obtained. Also cutting through causes different frequency maxima for constant cutting parameters. Figure 28 gives different frequency analysis of cutting through and kerfing. There is no significant difference to distinguish kerfing and cutting through.
All the tests were carried out on standard samples (size, material) under similar conditions (cutting parameters, position in the water basin). So, there should be no influence of these parameters on the results. But, unfortunately, the frequency analysis does not seem to be a reliable method to detect the cutting result, because besides the results of figures 26 and 27 different analysis are occurring often, too. Up to now there isn't found out any reason for this scattering of the occurring frequencies.
Also differences in the sound intensity have not been reproducable. So they can't be used for the detection of the cutting result, either. Finally, there are differences in the sound pressure signal for kerfing and cutting through (cutting through: constant intensity - kerfing: changing intensity like in fig. 27) but to use these differences for controlling the cutting result during cutting a specialised equipment is necessary.
For this reason another method to detect the case of kerfing has been tested /8/. A deflector plate was fixed at the cutting head (see #5 in fig. 19) and an accelerometer was adapted. During kerfing the reflected jet hits the plate and the accelerometer can detect the excitation of the plate. When cutting through there is no excitation of the plate. During preliminary tests the optimal position and size of the plate was tested. It is necessary to take care about the wear of the deflector plate due to the reflected particles. On the other hand the measuring position has to be close enough to the kerf to receive signals which are significant for kerfing. Especially for deep kerfing the reflected particles are slowed down by the friction at the shoulder of the cut. To reach a sufficient impact on the deflector plate the distance to the surface of the sample has to be 10 mm or less. Due to this small distance there is a high rate of wear on the plate for kerfing not as deep as mentioned. Figure 29 gives the comparison of the signals for cutting through and kerfing.
25

0.0
start of the jet
--+cuHinll direchon
IJ
start of kerfing
SEC
start of cuHing through
free jet In water
300.000 time
W!!I/LJ}jJ!JJfJfl DflJVJJJfA sample of steel, ~ ~ '\: max. 20 mm thickness
..;L
Figure29 Signals for cutting through and kerfing, measured by deflector plate and accelerometer
The first peak is caused by opening the water jet valve. When kerfing there is a signal produced by the reflected particles (left side of the sample). In case of cutting through
there is no excitation of the deflector. When the abrasive water jet runs in water without cutting bubbles hit the deflector (right side of fig. 29); when cutting through the work
piece it is like a shield - no bubbles can reach the deflector. During a series of tests sometimes a time delay was measured regarding the signal when changing from kerfing to cutting through. This effect is caused by particles, which are reflected from the shoulder of the kerfed workpiece. Because of the track of striation the particles hit the part of the sample which was already cut (see fig. 30).
abrasive cutting
head m . .
deflector~~~
Figure30 Reflection of particles in case of cutting through after kerfing
26

Changing from cutting to kerfing causes a significant signal in time. For normal application this is the more interesting situation because in cause of kerfing only the traverse speed has to be lowered immediately.
To make the method of detection more reliable it can be combined with a suction device as shown in figure 31.
abrasive water jet high pressure water
t accelerometer abrasives
workpiece hood
reflected jet abrasive water jet
workpiece
Different reflection conditions Accelerometer and hood
Figure 31 Deflector plate and suction hood
During kerfing the angle of reflection changes periodically due to the machining process. Also when producing very deep kerfs or very small kerfs the detection of the re
flected particles is difficult because the friction between the reflected jet and the shoulder of the cut is quite high. So the kinetic energy of the particles reaching the deflector plate is low. This facts might cause problems in measuring the impact of the reflected
particles by the deflector plate. In addition it seems to be useful to reduce the spreading of the secondary waste. To protect the environment from reflected particles a suction device can be used during kerfing. Inside of this device, as shown in figure 31, the deflector plate can be adapted. Additionally the flow of water, air and abrasives, which is sucked away, can be con
trolled regarding the particle load of this flow. For cutting through the loading rate has to be very small because the particles pass the gap to the opposite side of the workpiece. For kerfing the particle loading will be increased as well as the amount of air in the
flow, because the air as well as the particles are not able to move through the finished cut. For controlling purposes the amount of air or abrasives in the aspirated flow gives an information about kerfing or cutting through. Using an air separator to measure the
27

air or adapting a cyclone to separate the solid particles can give this additional information. When cutting through often it is not possible to fix a suction device at the cutting head to move it during cutting on the backside of the workpiece to suck away the used abrasives. The reason is that in most cases the backside is not accessible or structures are too big to move a suction hood parallel. But when kerfing 90 % of the thickness of the workpiece during a first pass and cutting through the remnant with a much higher traverse rate in a second pass it can be a useful method to catch as much waste as possible.
Summing up only the analysis of changes of sound intensity during cutting resp. kerfing has the potential to be a method to control the cutting result when research work will be done in future. Measuring the present intensity of the sound only or analysing the frequency of the sound signal are no sufficient methods for supervising the cutting process.
The method of using the reflected jet to excite an accelerometer gives sufficient results. It is possible to distinguish between cutting through and kerfing by measuring the intensity of the excitation of the plate. This measuring method is also non-contacting and easy to apply. The reliability of this technique can be increased by combining it with the detection of the air or particle amount in the flow sucked away by a special hood.
B.3. Methods to replace worn parts of the cutting head
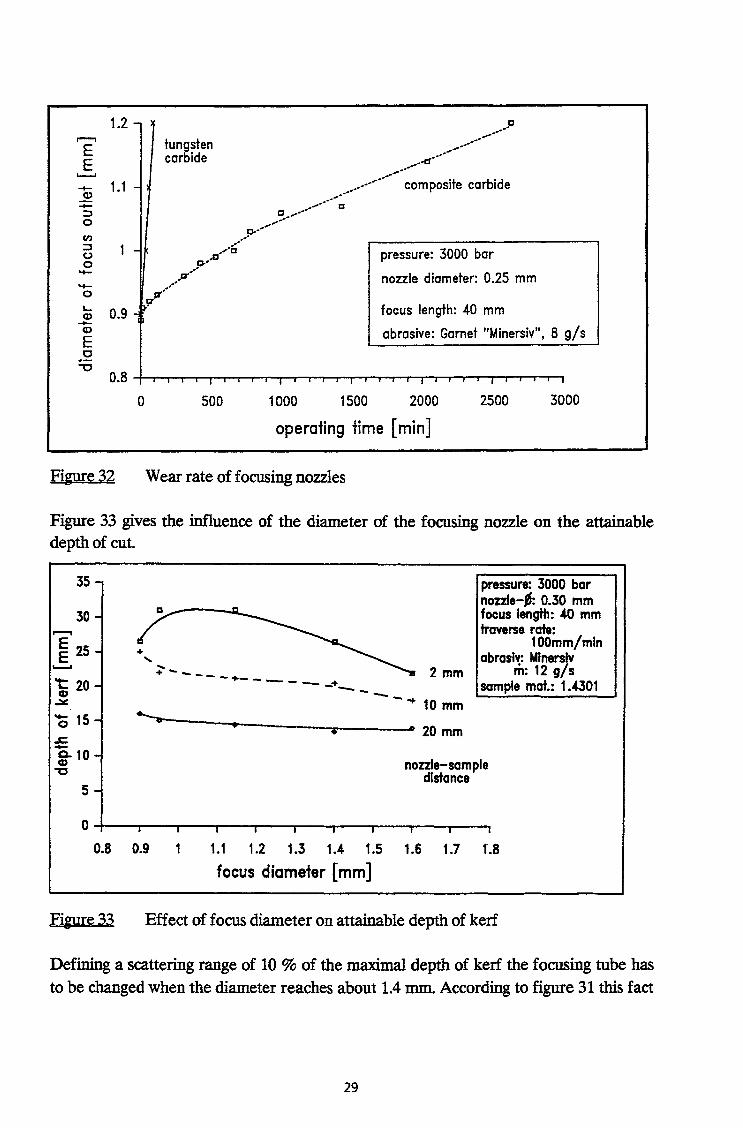
When cutting large structures remote controlled under water it can be necessary to replace worn parts of the tool by handling systems. In case of abrasive water jet cutting mainly the focusing nozzle has to be changed. The tool life for a normal tungsten carbide nozzle (as used as state of the art up to 1991) is about 5- 10 hours, however these values depend on the chosen cutting parameters. But new developments in material science result in more resistant materials for these nozzles. Since 1991 a substitute of the Dow Chemical Company in USA sells focusing tubes out of composite carbides, which have a highly increased tool life /9/. Figure 32 gives the comparison of both kind of nozzles. For the given parameters the tool life of composite carbide tubes is increased by the factor of more than 30. The prize of such nozzles is about 250 US-$.
28
........, E E
....... Cl) -::I 0
"' ::I 0 0 --0
1.2-
1.1-
1 -
tungsten carbide
o-··EJ .P.-·· ..
rzrr ...
______ c
, ............ ---,. _.-cr····
_ .• ------'-----··;om posite carbide ................ 'a
c , ........ o----------... --......... c pressure: 3000 bar
nozzle diameter: 0.25 mm
~ 0.9 - t;• focus length: 40 mm -Cl)
E abrasive: Garnet "Minersiv", 8 g/s
0 -o
0.8~~~~~.~~~.~-r~~-r,-~-~,-r,-r~,~~TJ.r~,
0 500 1 000 1500 2000 2500 3000
operating time [min]
Figure32 Wear rate of focusing nozzles
Figure 33 gives the influence of the diameter of the focusing nozzle on the attainable depth of cut.
35
30 ,.......,
~ 25 ...__,
't: 20 CD
-¥.
0 15 .s::. -g-10 -o
5
... + -------·- -----·---- 2 mm
--+ 10 mm
pressure: 3000 bar nozzle--: 0.30 mm focus length: .W mm traverse rate:
100mm/mln abraslv: Mlnerslv
m: 12 g/s sample mat.: 1 • .4301
'-----------------------• • • 20 mm
nozzle-sample distance
0~--~---r--~---T--~--~~--r---T---~--~
0.8 0.9 1 1.1 1.2 1.3 1.4 1.5 1.6 1.7 1.8
focus diameter [mm]
Figure33 Effect of focus diameter on attainable depth of kerf
Defining a scattering range of 10 % of the maximal depth of kerf the focusing tube has
to be changed when the diameter reaches about 1.4 mm. According to figure 31 this fact
29

enables to cut up to 100 h without changing the focusing nozzle for the given conditions. Especially the kind of abrasive has an important effect on the wear rate. For corundum the tool life is less than 10 % of the tool life for garnet sand. But for normal cutting jobs (steel, aluminium, concrete) the properties of garnet sand are a good compromise between wear of the tool and cutting efficiency. So, for the given cutting conditions, the tool life of the focusing nozzle has reached the same level as the life time of the water jet nozzle. Due to this fact it does not seem to be useful to adapt a handling system, which is able to replace the focusing nozzle remote controlled. For maintenance work the whole tool (water nozzle, focusing tube, alignment, condition of the mixing chamber, status of the abrasive feed hose) has to be checked; for that purpose the tool has to be removed from the cutting job to a job shop anyway.
4. Characterisation and handling of secondary waste
To reduce the waste produced by cutting with abrasive water jets at first cutting parameters have to be optimised. This is done under B.l. On the other hand for the treatment of the remaining waste it is necessary to quantify and analyse the sedimented waste as well as the aerosols. Results of doing so are given in the following.
B.4.1. Preparation of the test facility
To characterise the produced waste tests were carried out in cooperation of IW and CEA. In a hermetically sealed water basin steel and copper samples were cut and kerfed. Particles suspended in water as well as aerosols were measured and analysed. Figure 34 shows the setup of the test equipment.
air inlet
Figure34 Water basin
basin
30
air qu tlet
cul!ing head

The top of the basin was covered by a plate. The traverse mechanism of the cutting head was sealed against this plate. All the water used for cutting as well as the suspended particles remained in the basin. After settlement the sediments were removed and analysed. Water samples were taken to quantify suspended particles a certain time after finishing cutting.
The plates to be cut were either placed underwater (for cutting and kerfing underwater) or the water level is lowered to cut in air. However water is kept in the tank in order to absorb the water jet. The experimental device with the associated samplings is schematised on the figure 35 (comparable to the tests described in /10/); a view of the exhaust duct with some samplings and the cutting basin is given in figure 36.
TANK
Figure35
ABRASIVE WATER JET
TOOL
Driers Pump
Schematic drawing of the ventilation system and the associated samplings
31
Flowmeler

Figure 36 View on the exhaust duct with associated samplings (right) and the cutting basin with the water jet valve (left)
The ventilation circuit is composed of an inlet HEP A filter (in order to filtrate the air entering into the tank), an integral filter of 160 mm diameter (in order to collect all the aerosols drawn into the exhaust duct), an orifice plate (which has been calibrated and allows to know the flow rate) and a fan. The ventilation flow rate is set up to 24 m3 .h -1. Nozzles are installed in the exhaust duct to allow isokinetic sampling into: - a filter of 130 mm diameter - a filter of 4 7 mm diameter - an Andersen impactor Total aerosol mass concentrations are measured by filtration and weighing. The fibre glass filters are 130 mm and 47 mm in diameter. They have a collection efficiency of more than 99.99% for particles of size superior to 0.3 micrometer. The Andersen impactor in which the collection of particles is made on 8 stages allows to determine the aerosol size distribution between 0.35 and 15 micrometers. The exhaust duct and the pipes until the sampling filters are heated with a regulated heating cable in order to avoid any condensation. The three dryers put in series after the sampling filters enable to know the quantity of vapour water drawn into the exhaust duct. Dryers are also put between the impactor and the pump for its protection. The sedimented drosses are collected manually at the bottom of the tank and their size distribution is determined with the use of several sieves which openings are respectively 0.032, 0.063, 0.125, 0.250 and 0.500 mm. The mass concentration of particles remaining in suspension after a cut was measured
32

by filtration and weighing. The samples of water (11) were taken 5 minutes after the end of cutting or kerfing.
When the cut took place under water, an hydrogen analyser was being used which sampled the air after the integral filter in the exhaust duct. About 80 samples (suspended particles in water, abrasives, and mainly deposits on filters) have been analysed by ICP (Inert Coupled Plasma) in order to measure the proportion of several elements (Cu, Fe, Mg, Ni, Cr).
Figure 37 gives a diagram of the investigated masses and their abbreviations used in this report.
w: water
a: a brasive
emoved m: r m at erial
w a, m aerosol s
water su~en pa icl
ded es
II abrasive
workpiece
at ria I loss on t-45: m e focusing tube
cutting process a, m
a, m sedime
II dross
Figure37 Diagram of material flow
The common operating conditions were as follows:
-volume of the tank: - pressure of water: -nozzle: - focus diameter:
length:
-abrasive: - size distribution of abrasive: - water flow rate:
1.140m3 3.000bar 0.25mm lmm 40mm Garnet Minersiv see figure 38
1.631/min
33
II
nted

- standoff distance: - air ventilation flow rate:
- air flow rate cutting bead:
80
70
2mm 24m3/h 2m3/h
63.15% unused abrasives ..--. 60 ~ .........
(I] 50 (I]
c E 40 CD > ·c;:; 30 c L..
..0 20 c
10
0
Figure38
0 100 200 300 400 500
particle size [JL m]
Size distribution of unused Garnet "Minersiv"
2.27% 0.07%
600 700 BOO
The used copper plates were out of Cu 99.9 %; the steel and abrasive compositions are indicated in the tables I to IT.
Duplex steel: 60 % ferritic, 40 % austenitic
c Si Mn p s Cr Mo
min(%) - - - - - 21.0 2.5
max(%) 0.03 1.0 2.0 0.03 0.02 23.0 3.5
Table I Steel composition
Co~position of abrasives (Garnet)
Table II
Al20 3 FeO Si02 MnO CaO MgO
20 % 30 % 36% 1 % 2% 6%
Composition of abrasive garnet "Minersiv"
34
Ni N Fe
4.5 0.08 63.7
6.5 0.20 72.0

Copper was chosen as material to be cut in order to distinguish by chemical analyses the secondary emissions coming from the cut plate on one part and from the abrasives on the other part (Garnet contains an important proportion of FeO). The duplex (austenitic/ferritic) steel was chosen to find cut material by magnetism.
B.4.2. Measurement and characterisation of the secondary emissions
Eight experiments were carried out in a first series as indicated in table ill.
No. of Material Material Abrasive
Operation Place thickness flow rate experiment nature
(mm) (g/s)
1 cutting underwater copper 10 7.2 2 cutting a1r copper 10 6.8 3 cutting air steel 10 6.8 5 kerfing air copper 20 6.3
6n kerfing underwater copper 20 5.9 8 kerfing air steel 20 7.1 9 cutting air copper 10 3.4 10 cutting air copper 10 1.8
Table ill Main features of the experiments
The total secondary emissions were evaluated for all the experiments (see fig. 37). The sedimentation times were very different, so suspended particles for some experiments had no time to sediment. The sedimented dross on the walls and on the bottom of the tank were collected after 16 hours (a night) for the experiments No. 1 and No.2. The sedimentation behaviour for test No. 1 is shown in B.4.4 together with other results (fig. 53).
The thickness of the plates of copper and steel was 10 mm for cutting and the depth of kerfing was 15-18 mm (experiments No.5 and No. 6/7) and 17-19 mm (experiment No. 8).
A) Balance of secondary emissions
Solid emissions
The results of weight analyses are given in table IV.
35

Sedimented Suspended Water in
Aerosols Cut Material Operation Cut length
Workpiece Used dross
particles Aerosols Used exhaust duct
No. thickness place mass loss abrasive g.m·• " g.m·• " water g.m·• " g.m·> mm g.m·• g.m·• g.m·• " TC g.m·• of used
TC TC water
of cut edge
I copper cutting 6 528 99.6 3 074.4 3 003.5 97.5 77 2.4 1.210~ II 688 4.7 1.2 l!t2
IOmm underwater 3.6 10 .. 0.04
2 copper cutting 6 528 110.1 2 914 2 819.2 . 0.027 II 688 19.5 2.7 IOmm in air 9.71~ 0.17
3 steel cutting 3672 80.3 3704 3 464.9 - 0.035 14 788 23.6 3.5 IOmm in air 9.8 10~ 0.16
5 copper kerfing 3612 158.5 2693 2 674.6 - 0.136 11 683 194.9 8.2 20mm in air 5 l!t' 1.7
617 copper kerfing 6 533 152.9 2 532 2 324 98.7 31.5 1.3 71~ 11 619 5.5 4.2 l!t2
20mm underwater 3.1!t' 0.05
8 steel kerfing 3672 143.5 3 860 3 196.3 - 0.211 14 788 268 11.7 20mm in air 6.5 l!t' 1.8
9 copper cutting 6 528 100.3 1 862 I 419.1 - 0.0165 14 813 40.4 1.65 IOmm in air 1.1 l!t' 0.27
10 copper cutting 6 528 98.0 I 534 I 515.5 - 0.0136 23 284 71.1 1.36 IOmm in air 8.81~ 0.30
TC = total solid mass collected
Table IV Recapitulative secondary emissions results
For the given working conditions following results can be given: - 4.10-6% to 7.10-3% of the total solid mass is drawn into the exhaust duct (M4). - When the cutting or the kerfing takes place underwater (depth= 100 to 200 mm), the
quantity of aerosols is divided by about 200 (comparison between experiments No. 1 and 2 and experiments 5 and 6/7).
- The amount of aerosols increase linearly with the amount of used abrasives (fig. 39).
,...-,
~ 0.030-C) • d·
. ..........
0.025-.-·
E . ,.,,~ .. . -~ .-·· Q) .-0.. 0.020- ,., .. '' en •' pressure: 3000 bar en .-· nozzle-¢: 0.25 mm 0 J!J.-
E 0.015- .. .. focus: dr = 1.0 mm -· - ~--· lr = 40 mm 0 -· distance: 2 mm-in air en 0 0.010- abrasive: Minersiv ~ Q) sample mat.: 1.4301 0
-o 0.05-Q) -0 ~ Q)
0 c I I ' I Q) C) 0 500 1000 1500 2000 2500 3000
used abrasive mass per m [g/ m]
Figure39 Effect of amount of used abrasives on the production of aerosols
36

- The kerfing produces three to four times more aerosols than the cutting as indicated in the table V.
Aerosols Aerosols
g/m'-g/m1"/kg Aerosols bv kerfing
of cut edge of used abrasives Aerosols by cutting
per meter
Copper kerfing underwater 4.2 10"2 1.7 10"2 4.3 Copper cutting underwater 1.2 1()•2 0.39 10"2
Copper kerfmg in air 8.2 3.0 3.2 Copper cutting in air 2.7 0.93
Steel kerfing in air 11.7 3.0 3.2 Steel cutting in air 3.5 0.94
TableV Comparison of aerosol production by kerfing and cutting
There is no significant difference between copper and steel. The water placed beneath the plate when the cutting takes place in air probably minimises the amount of aerosols. - 1 to 3 % of the total solid mass is composed by suspended particles (M3) when the
operation takes place under water. The kerfing induces less suspended particles (754 g/(m2*kg/m)- mass of suspended particles per m2 of shoulder of the cut and per kg of used abrasive per meter) than the cutting (2505 g/(m2*kg/m)).
By chemical analyses of the water of experiments No.2 and No. 6/7 (annex 3) it can be noted:
- taking into account the composition of the abrasives there is a good agreement between the chemical results and the mass M3 of suspended particles indicated in the sheets of annex 1 (within 13 % ),
- the proportion of copper and abrasives in solution in the sampling bottles three months after the experiments is in the range 1 to 3% for copper, inferior to 0.1% for particles of abrasives,
- the ratio of
mass of particles of copper mass of particles of abrasives + mass of particles of copper
in the suspended particles five minutes after the cut is comprised between 7 and 9 %.
37

This seems to indicate that the particles of copper suspended in the water after an operation underwater (kerfing and cutting) have a smaller diameter than the particles of abrasives because the ratio mentioned above is higher than the same ratio in sedimented dross (3 to 5.7 %) for the two concerned experiments, and this whereas the density of copper is higher than the density of abrasives. The sedimentation of copper needs more time. - The remainder of the solid emissions is composed by dross sedimented in the tank
(Ml). The proportion of abrasives in the sedimented dross is dependent on the type of operation (cutting or kerfing), the nature of the material and of course the flow rate of abrasives as indicated in the table VI. As sedimented dross represents almost all the solid secondary emissions especially when the operation takes place under water, the ratio
used abrasives used abrasives + workpiece mass loss
can be considered coarsely as a representative of the proportion of abrasives in the sedimented dross.
Operation Abrasive % of abrasives
Cut Material flow rate in the sedimented
No. place gls dross
1 copper cutting underwater 7.2 97.0
2 copper cutting in air 6.8 96.4
3 steel cutting in air 6.8 97.9
5 copper kerfing air 6.3 94.4
617 copper kerfmg underwater 5.9 94.3
8 steel kerfing in air 7.1 96.4
9 copper cutting in air 3.4 94.9
10 copper cutting in air 1.8 94.0
Table VI Proportion of abrasives in the sedimented dross
The proportion of abrasives in the sedimented dross increases for cutting (compared to kerfing), for steel (compared to copper) and there is no difference for operation in air or under water.
38

LiQ.Uid emissions ( vapours)
Between 0.15 to 2 %of the used mass of water is drawn into the exhaust duct (M2), mainly in the vapour phase. The kerfing induces 10 times more water in the exhaust duct than the cutting in air. Underwater operation decreases the amount of water in the exhaust duct compared to operation in air (divided by 4 for cutting and 35 for kerfing).
B) Size distribution of abrasives and sedimented dross
The size distributions of abrasives are illustrated by the figures 40 to 43.
The analysed samples are a mixture of samples taken at different places in the basin. According to the location of sampling a wide spread of results regarding the size distribution occurs. Figures 40 and 41 give the comparison of cutting and kerfing for application in air (right) and under water (left).
40
35
30 g "' 25 "' ~ 20
~ 15 ;;; ~ 10 ~
0 5
0
40
35
~ 30 ~ "' 25 "' ~ 20
~ 15 ;;; ~ 10 0 5
0
0
0
cutting copper under wafer 7.2g/s
( mixture )
24.4
0.2
100 200 300 400 500 500 particle size (JLm)
kerfing copper under water 5.9 g/S
( mixture )
0.02
100 200 300 400 500 600 particle size (JLm)
pressure: 3000 bar focus: dr=1mm/~=40mm nozzle: 0.25 mm abrasive: Garnet "Minersiv"
40
35
30 E .. 25 ., ~ 20
: 15 ·u; ~ 10 ~
0 5
40
35
~ 30 ~ "' 25 "' ~ 20
~ 15 ;;; e 10 ~
0 5
34.3 cutting copper in air 6.8 g/s {mixture)
21.7
0.08
1 00 200 300 400 500 600 particle size (JL m)
kerfing copper in air 6.3 g/s
( mixture )
0.06 0~~~~~~~~~~~~~~
0 100 200" 300 400 500 600 particle size (JL m)
pressure: 3000 bar focus: dr=1 mm/lr=40mm
nozzle: 0.25 mm abrasive: Garnet "Minersiv"
Figure 40. 41 Size distribution of used abrasives
39

Kerfing produces a bigger amount of smaller particles than cutting through. This effect is the same for machining steel as well as copper.
40
35
~ 30 ~ 25 "' "' ~ 20
~ 15 .. ~ 10 c 5
0
40
35
,......, 30
~ 25 "' .. ~ 20
.~ 15 .. E 10 ~
c 5
0
34.3 cutting copper in air 6.8 g/s (mixture)
21.7
0.08
100 200 300 400 500 600 particle size (JL m)
33.1 cutting steel in air 6.8 g/s (mixture)
21.1
0.1
tOO 200 300 400 500 600 particle size (JL m)
pressure: 3000 bar focus: dr=1mm/lr=40mm
nozzle: 0.25 mm obrasive: Garnet "!.linersiv"
40 - 35 ~ 30 ::: 25 ~ 20 ., 15 -5 10 ~ 5 c 0
40 ~ 35 !:!. 30
::l 25 ~ 20 ., 15
-5i 10 ~ 5 c 0
40 - 35 ~ 30 ::: 25 ~ 20 ., 15 ~ 10 ~ 5 c 0
Figures 42. 43 Size distribution of used abrasives
0
0
0 ...i
20.6
100
34.3 cutting copper in air
200 particle
I 36.1
21.7
25.7
200. I .300(p. )400 partie e s1ze m
40.2
21.9
6.8 g/s
0.08
500 600
3.4 g/s
0.09
500
1.8 g/s
0.04
200 300 400 500 600 particle size (JLm)
pressure: 30~0 bar focus: dr= 1 mm/11=40mm
nozzle: 0.25 mm abrasive: Gamet "Minersiv"
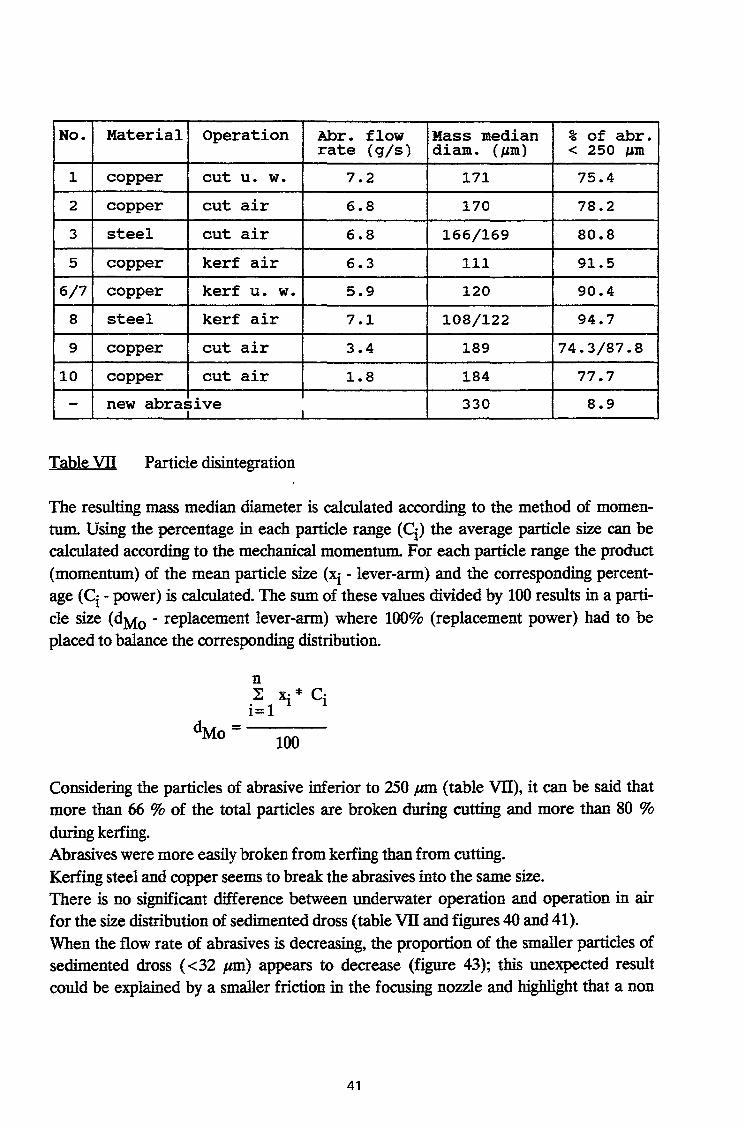
Figure 42 shows that there is no big difference between machining copper and steel. For both materials nearly the same size distribution is given for cutting in air. Using different abrasive flow rates (figure 43) has nearly no influence on the size distribution of the used abrasives. For lower abrasive flow rates the mass mean diameter is a little bit bigger than for higher flow rates. As indicated in table VII, the mass mean diameter (see next page) of the abrasives which value is between 250 and 350 pm when unused, becomes comprised between 125 and 250 p.m. after cutting and between 65-125 pm after kerfing. For some experiments samples were taken in the bottom of the tank and on the top (along the walls of the tank) and obviously the mass mean diameter is bigger for the bottom samples.
40
No. Material Operation Abr. flow Mass median % of abr. rate (g/s) diam. (~-&m) < 250 ~-&m
1 copper cut u. w. 7.2 171 75.4
2 copper cut air 6.8 170 78.2
3 steel cut air 6.8 166/169 80.8
5 copper kerf air 6.3 111 91.5
6/7 copper kerf u. w. 5.9 120 90.4
8 steel kerf air 7.1 108/122 94.7
9 copper cut air 3.4 189 74.3/87.8
10 copper cut air 1.8 184 77.7
- new abralfive 330 8.9 I
Table Vll Particle disintegration
The resulting mass median diameter is calculated according to the method of momentum. Using the percentage in each particle range (q) the average particle size can be calculated according to the mechanical momentum. For each particle range the product
(momentum) of the mean particle size (xi -lever-arm) and the corresponding percentage ( Ci - power) is calculated. The sum of these values divided by 100 results in a particle size (dMo- replacement lever-arm) where 100% (replacement power) had to be placed to balance the corresponding distribution.
n l: ~ * C· . 1-l 1
1=
dMo=----100
Considering the particles of abrasive inferior to 250 J-lM (table Vll), it can be said that more than 66 % of the total particles are broken during cutting and more than 80 %
during kerfing. Abrasives were more easily broken from kerfing than from cutting. Kerfing steel and copper seems to break the abrasives into the same size. There is no significant difference between underwater operation and operation in air for the size distribution of sedimented dross (table vn and figures 40 and 41 ).
When the flow rate of abrasives is decreasing, the proportion of the smaller particles of sedimented dross ( <32 .urn) appears to decrease (figure 43); this unexpected result could be explained by a smaller friction in the focusing nozzle and highlight that a non
41

negligible proportion of abrasives is broken before reaching the plate when the flow rate of abrasives is high.
C. Characterisation of the aerosols in the exhaust duct
The concentration of aerosols in the exhaust duct has varied from 0.04 mgJr:rr' to 58.7 mg/m3 depending on the place of operation (under water or in air), on the nature of operation (cutting of kerfing) and on the abrasive flow rate of abrasives ( 1.8 to 7 2 g/ s ). By calculating the aerosol material mass and the total aerosol mass (aerosol material mass + aerosol abrasive mass) from the chemical analyses (annex 2) or by calculating the aerosol material mass and by taking the total aerosol mass from the weighing of sampling filters (sheets of annex 1), the ratio can be estimated as
aerosol material mass loss total aerosol mass
The value of this ratio is roughly the same as the value of the ratio
material mass loss used abrasives + material mass loss
Cut Operation aerosol material mass material mass loss No. Material place total aerosol mass used abrasives + material mass loss
(in %) (in %)
1 copper cutting underwater 0.7-9.9 3.1
2 copper cutting in air 4.0-4.8 3.6
3 steel cutting in air 1.4-2.1 2.1
5 copper kerfing air 5.0- 10.0 5.6
617 copper kerfing underwater 4.4- 5.6 5.7
8 steel kerfing in air 4.3-4.8 3.6
9 copper cutting in air 3.2-4.8 5.1
10 copper cutting in air 3.1-5.3 6.0
Table VIII Aerosol calculation
Considering the very small masses collected on each stage of the impactor Andersen during the underwater operations (experiments No. 1 and 6/7), the size distribution
42
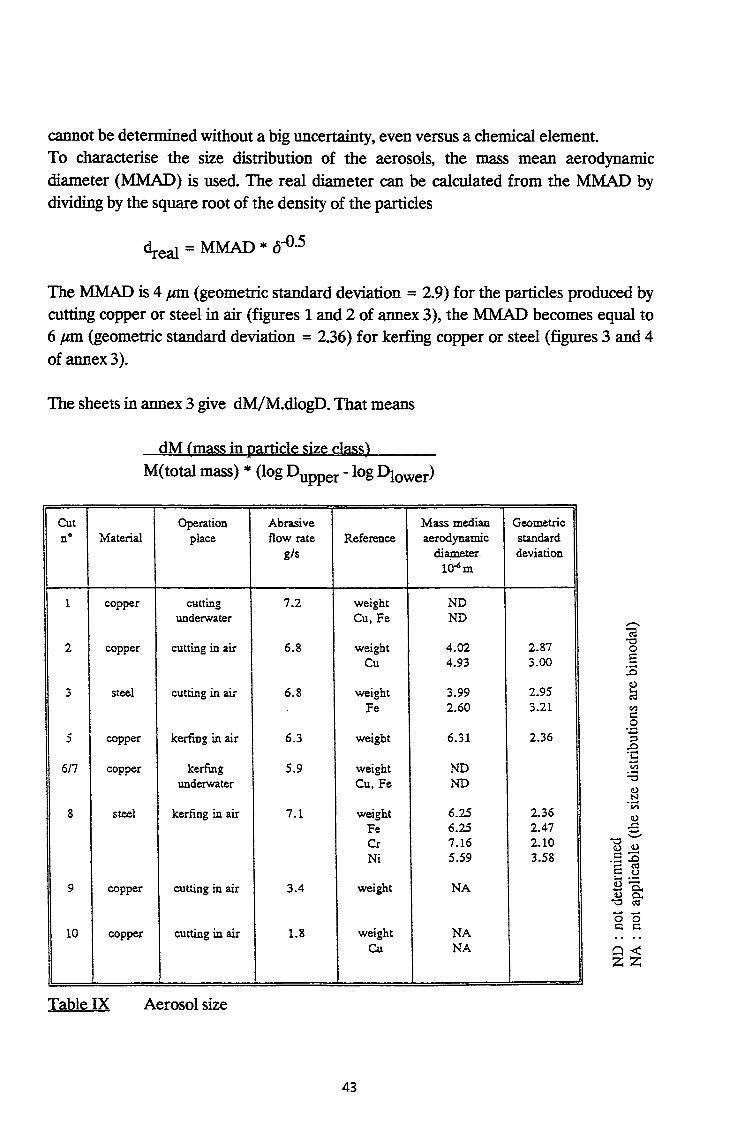
cannot be determined without a big uncertainty, even versus a chemical element. To characterise the size distribution of the aerosols, the mass mean aerodynamic diameter (MMAD) is used. The real diameter can be calculated from the MMAD by dividing by the square root of the density of the particles
d al - MMAD * o-O.S re -
The MMAD is 4 f-CID (geometric standard deviation = 2.9) for the particles produced by cutting copper or steel in air (figures 1 and 2 of annex 3 ), the MMAD becomes equal to 6 f-CID (geometric standard deviation = 2.36) for kerfing copper or steel (figures 3 and 4 ofannex3).
The sheets in annex 3 give dM/M.dlogD. That means
dM (mass in particle size class)
M( total mass) * (log Dupper - log Dlower)
Cut Operation Abrasive Mass median no Material place flow rate Reference aerodynamic
g/s dia,meter. 1Q-6m
1 copper CYtting 7.2 weight ND underwater Cu,Fe ND
2 copper cutting in air 6.8 weight 4.02 Cu 4.93
3 steel cutting in air 6.8 weight 3.99 Fe 2.60
I 5 copper kerfmg in air 6.3 weight 6.31
617 copper kerfmg 5.9 weight ND underwater Cu,Fe ND
8 steel kerfing in air 7.1 weight 6.25 Fe 6.25 Cr 7.16 Ni 5.59
9 copper cutting in air 3.4 weight NA
10 copper cutting in air 1.8 weight NA Cu NA
Table IX Aerosol size
43
Geometric standard deviation
2.87 3.00
2.95 3.21
2.36
2.36 2.47 2.10 3.58
.......... 0 0 c c
Cl< zz

The size distribution becomes more and more bimodal when the flow rate of abrasives decreases (figures 5 and 6 of annex 3) with one mode around 6 fJ-ID and another around 1.5 fJ-ID. The aerosol size distributions obtained from weight and from chemical analyses (figures 7 to 12) are relatively similar. The mass mean aerodynamic diameter based on weight and on chemical elements ( Cu for the plates of copper, Fe, Cr and Ni for the steel plates) have similar values (table IX).
D) Gas
During the operations under water we have used the hydrogen analyser. There is no discernible production of hydrogen ( <0.05l.min-1).
E) Kerf appearance
The bottom and top widths of the kerfs are resumed in the table X.
Cut Operation Abrasive Bottom Top
No. Material
place flow rate kerf width kerf width
g/s mm mm
1 copper cutting underwater 7.2 0.9 1.2 I 2 copper cutting in air 6.8 1.0 1.3
3 steel cutting in air 6.8 1.0 1.3
5 copper kerling in air 6.3 0.9 1.2
617 copper kerfing underwater 5.9 0.9 1.2
8 steel kerfmg in air 7.1 1.1 1.4
9 copper cutting in air 3.4 1.0 1.3
10 copper cutting in air 1.8 1.0 1.3
Table X Kerf widths
The top kerf width is always larger than the bottom kerf width (by about 30 % ). There are no significant differences between underwater operation and operation in air and between kerfing and cutting. There is no influence of the abrasive flow rate in the studied range.
44

As an example the kerfs of experiments No.1 are shown in figure 44. Figure 45 gives a view of a cross-section of a kerfing test in copper (thickness 20 mm).
Figure 44 Front and rear view of test plate 1 (cutting through of 10 mm copper)
Figure 45 Cross-section of a kerfed test plate (kerfing of copper - 20 mm thickness)
45

B.4.3. Methods to lower the spreading out of the emissions
The expense of handling the secondary waste is mostly influenced by the spreading out of the abrasives after machining. A reduction of the spreading out causes a decrease of mass of material which has to be treated to separate all the waste from the environment. In order to find a way to lower the spreading out the two methods of abrasive machining - cutting through and kerfing- have to be investigated separately.
Cutting through
In case of cutting through the abrasive water jet is passing the workpiece producing the cut. A reduction of the spreading out of the used particles can be realised by using a catcher system on the opposite side of the workpiece. The passing jet enters this catcher system and the remaining kinetic energy of the jet is changed into heat by friction of the catcher material. The abrasive can be sucked out of the catcher and has to be treated for disposal in case of cutting radioactive components.
connection
filling of the catcner
outlet
Figure 46 Catcher system for cutting through
Such systems are working in manufacturing industry sufficiently because of the small size of the workpieces. During cutting operation the catcher system has to be moved in the same manner as the abrasive cutting head. Therefore either a connection of the cutting head and the catcher is necessary (see fig. 46) or a second handling system has to be installed to move the catcher. The use of such systems for cutting large structures is nearly impossible because of the size of the workpieces. A connection of cutting head and catcher can't be realised; a second handling system needs a sophisticated controlling unit to follow the jet on the rear side of the workpiece. In many cases the rear side is not
46

accessible (tubes, housing of machines and pumps). So for decommissioning purposes a general solution of the problem in case of cutting through is not possible. For most applications the only way seems to be to filter the water of the basin in which the cutting takes place. To reduce the amount of water which has to be filtered the size of such a basin has to be as small as possible. To separate the particles from the water different techniques can be used. With regard to the reduction of "tertiary" waste such as filters the use of a hydrocyclone for separation seems to be a sufficient solution. The working principle of a hydrocyclone is given in figure 4 7.
water inlet
outlet downstream
outlet upstream
Figure47 Working principle of a hydrocyclone
The tangential inlet of the suspension flow causes a vortex inside the cylindrical part of the cyclone. The flow runs downwards according to the effect of gravity. When reaching the conical part a second vortex is being created. Because of the decreasing diameter of
47

the cyclone the whole suspension flow is not able to pass the conical part, so the inner vortex runs upwards. Using the effect of inertia the solid particles remain in the downward flow while the water flow leaves the cyclone through the upper outlet. The solid particles are gathered in a hopper at the bottom. The geometry of the conical part and the size of the cyclone effects the cut-off-diameter. Because of the disintegration of the abrasive particles during the cutting process the size of some particles to be separated is very small. Hydrocyclones in general are able to separate particles starting at a size of a few JC!D.. In addition the use of a filter seems to be useful to gather the smallestsized particles, too. A hydrocyclone which is designed for cleaning applications in nuclear power plants was tested during the reported research work. The results of the tests are given in B.4.4. The system has been lend to the project by the company GRADEL. The technical details are given in annex 4. Another possibility to lower the spreading out in case of cutting through is the method of multiple-pass cutting. During a first pass the workpiece is kerfed as deep as possible. The remaining thickness is only a few mm. A second pass is used for cutting through the workpiece.
c
c )( -o E E.::.::
.::.::
kmox- kmin = 0.1 * kmox
kmax= a- 3 mm
remaining thickness: 0.1 kmox + 3 mm
= c * v 1
1. pass: kerfing v 1
traverse direction
abrasive water jet
2. pass: cutting v 2 traverse direction
Figure48 Multiple-pass cutting
48

Because of the small remaining thickness the traverse rate can be very high. A calculation is given in figure 48. The waviness of the ground of the kerf is about 10 % of the maximum kerfing depth. Additionally there has to be a remaining thickness of the workpiece of about 3 mm to be sure to kerf only. Both together- remaining thickness and waviness of the ground of the kerf - effect the traverse speed of the second pass for cutting through. The speed can be calculated according to the figures of B.l. (fig. 5 and 6). For material thicker than 20 mm the traverse speed of the second pass can be more than 5 times higher than the first pass. This fact causes a reduction of spread out abrasives by the factor of 5, too, in case the reflected particles during kerfing are caught in total by a hood. During kerfing the particles are reflected by the ground of the kerf and can be sucked away by a hood which is adapted at the cutting head. In this case there are no problems regarding the connection and movement of the hood; access to the rear side of the workpiece is not necessary. The application of such a hood is tested during the contract. The results are reported in the following.
Kerfing
hood under water
Figure49
suction
duct + water
Suction hood
49
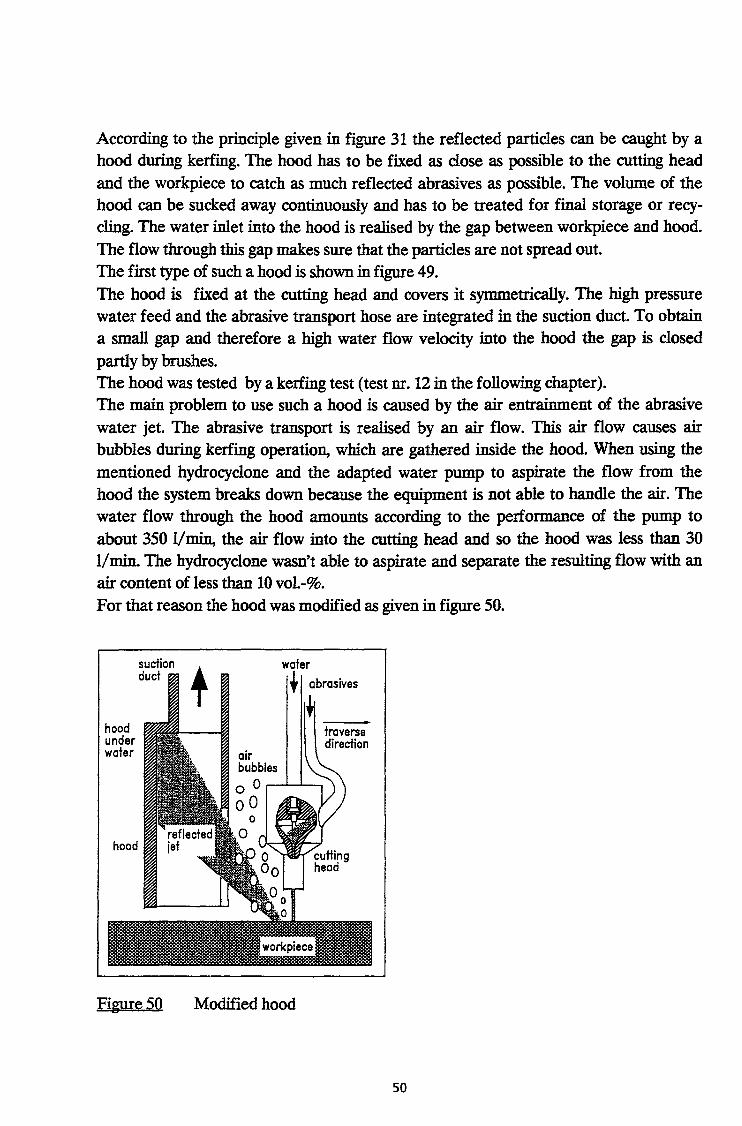
According to the principle given in figure 31 the reflected particles can be caught by a hood during kerfing. The hood has to be fixed as close as possible to the cutting head
and the workpiece to catch as much reflected abrasives as possible. The volume of the hood can be sucked away continuously and has to be treated for final storage or recycling. The water inlet into the hood is realised by the gap between workpiece and hood.
The flow through this gap makes sure that the particles are not spread out. The first type of such a hood is shown in figure 49. The hood is fixed at the cutting head and covers it symmetrically. The high pressure water feed and the abrasive transport hose are integrated in the suction duct. To obtain a small gap and therefore a high water flow velocity into the hood the gap is closed
partly by brushes. The hood was tested by a kerfing test (test nr. 12 in the following chapter). The main problem to use such a hood is caused by the air entrainment of the abrasive
water jet. The abrasive transport is realised by an air flow. This air flow causes air bubbles during kerfing operation, which are gathered inside the hood. When using the
mentioned hydrocyclone and the adapted water pump to aspirate the flow from the hood the system breaks down because the equipment is not able to handle the air. The water flow through the hood amounts according to the performance of the pump to
about 350 1/min, the air flow into the cutting head and so the hood was less than 30 1/min. The hydrocyclone wasn't able to aspirate and separate the resulting flow with an air content of less than 10 vol.-%. For that reason the hood was modified as given in figure 50.
hood under water
hood
suction ! duct T
water
Figure 50 Modified hood
50

The hood was adapted in the zone of jet reflection but not covering the cutting head. This geometry allows most of the air bubbles to rise in the water according to the effect of buoyancy. Because of the low density they are rising very fast and close to the cutting head while the reflected particles are reflected in a certain angle. By this effect the bubbles and the reflected particles can be separated by finding an adequate position for the hood as shown in figure 50. The flow which can be sucked away from the hood includes only a small amount of air which can be handled by the hydrocyclone. A view of the hood is given in figure 51. The total setup including the vacuum cleaner (hydrocyclone) and the cartridge filter system is shown in figure 52.
Figure 51 Suction hood
cartridge filter
u : 1:: .. ·.···.·.·.·.·.·.· .. · .. ·.-:=
hydrocyclone .. · .... · .. ·.·n
\I hopper
water ~ ~ abrasives
-
Setup of basin, cyclone and cardridge filter
51


The detailed worksheets are given in annex 1. To compare the results from both series of tests a comparison test was carried out (nr.
11). The results of this test has to be compared with nr. 6/7 in B.42 (table XII).
Sedimented Suspended Water in
dross particles Aerosols exhaust
Cut Workpiece Used Used duct Aerosols
length mass loss abrasive water g.m·2
mm g.m·' g.m·' g.m·' g.m·' % of cut
g.m·' % g.m·' % g.m·' % edge TC TC TC of used
water
Exp 6/7 6 533 152.9 2 532 2 324 31.5 7.10-4 11 679 5.5 4.2.10"2
Phase 1 98.7 1.3 3.10"5 0.05
Exp 11 21 252 144.2 2 612 2 644 17.7 1.10-4 11 669 8.1 6.10-3 Phase 2 99.3 0.7 4.10-6 0.07
Table XII Comparison of 1. and 2. test series
The results obtained in the two experiments are in the same order of magnitude. The quantity of aerosols is divided by 7 in the second experimental phase but the aerosol collected mass is very small because operation takes place under water; so the uncer
tainty is important.
Experiment 12 was carried out with the vacuum cleaner (B.4.3.) and the directly work
ing hood (fig. 49). In this configuration~ the vacuum cleaner was not operating correctly because the system was sucking air coming from the cutting hood. In fact, the abrasive transport is realised by an air flow. This air causes bubbles inside the hood during kerfing. The bubbles were sucked into the cyclone, the pump cannot work with air. The air flow rate into the cutting head was less than 30 1/min and the water flow was about 350 1/min but the system was not able to handle this proportion of air. Furthermore the abrasive focusing nozzle was disconnected after 18 min of kerfing and
the test was stopped after another 15 min. Experiment 13 was carried out with the vacuum cleaner associated with the cartridge filter. The suction point was positioned at the side of the basin. A hood closed by a rubber membrane was placed directly at the cutting head. The membrane was inflating during the kerfing due to the bubbles of air coming from the cutting head. Compared to
test 11 the quantity of aerosols is divided by almost 5, probably due to the trapping
effect of the hood.
Test 14 concerned the kerfing of a bigger plate (thickness: 100 mm, depth of kerf: 70 mm).
53

Following the poor collection of the waste when filtering the whole basin (test 13) by cyclone and cartridge filter and the impossibility of using the direct hood (test 12) experiments 15 and 16 were carried out with an indirect hood (see fig. 50) and without cartridge filters because of their high pressure drop. With this hood arrangement the bubbles are not caught by the hood contrarily to the solid waste which is reflected during kerfing.
The data for the sedimentation process in the basin after finishing kerfing are given in figure 53. Also the result for the experiment nr. 1 is shown there.
1800 t
1600 ~ ~ ~ 1400- i ~ \ .., 1200- i E I
~ 1000- ~ Q. . :
, j
~ 800- \
~ 600- \ =f : i &. 400- i \
2an e of suspended
cles for different sts
c test nr. 11 +test nr. 13 o test nr. 15
• experiment nr. 1
i \ 200-~ "--.:--:-:-·----o+-~==~~~~==~=?~~~--=--~-~~ I I I I 1
0 1 00 200 300 400 500 600 700 800 900 1 000
sedimentation time [min]
Figure 53 Sedimentation process
The quantity of suspended particles is extremely dependent upon the sedimentation time. A difference of a few minutes just after kerfing can induce a decrease factor of 2.
A) Balance of secondary emissions
Solid emissions
- 6.10-6 % to 2.10-3 % of the total solid mass is drawn into the exhaust duct (M4 ). - 0.5 to 2.8 % of the total solid mass is composed by suspended particles (M3 ).
54

By chemical analyses of the water (annex 3) it can be noted:
- the proportion of copper and abrasives in solution in the sampling bottles three months after the experiments is in the range 1 to 3% for copper, inferior to 0.1% for particles of abrasives,
- the ratio of mass of particles of copper
mass of particles of abrasives + mass of particles of copper
in the suspended particles five minutes after the cut is comprised between 5 and 12
%. These values are in agreement with the first test series.
- The remainder of the solid emissions is composed by dross sedimented in the tank
(M1). As sedimented dross represents almost all the solid secondary emissions especially
when the operation takes place under water, the ratio
used abrasives used abrasives + workpiece mass loss
can be considered coarsely as a representative of the proportion of abrasives in the
sedimented dross.
Exp. Material
Operation thickness
No. place mm
11 20 Underwater
12 20 Underwater
13 20 Underwater
14 100 Underwater
15 20 Underwater
16 20 Underwater
TC = Total solid mass collected
NM = not measured
NS • not srgnificative
Cut length Workpiece mass loss
mm g.m·'-
21 252 144.2
2 500 15.6
21 252 152.8
3 036 729.2
21 252 126.4
21 252 117.7
Sedimented
Used dross
abrasive Suspended
particles g.m·• g.m·• "' TC
2 612 2 644 17.7 99.3 0.7
4 200 NM NM
2 922 3 051 88.2 97.2 2.8
19 779 19 679 105.2 99.5 0.5
2 580 2 312 13.8 99.4 0.6
1 704 1700 12.5 99.3 0.7
TableXIll Recapitulative secondary emissions results
55
Aerosols Water in
exhaust duct Aerosols Used water % g.m·> g.m·' g.m·• g.m·1 "' of cut edge
TC of used water
1.10~ 11 669 8.1 6.10"' 4.10 .. 0.07
1.8.10 .. 21 600 NS 6.10"2
2.2.10 .. 11 669 11.7 1.J.1o·• 7.10"' 0.10
4.2.10 .. 81 686 81.9 6.10"' 2.10 .. 0.10
8.10 .. 11 905 15.1 4.7.10 .. 3.10"7 0.13
1.10 .. 22 586 73.6 5.6.10 .. 6.10 .. 0.33

No. of experiment Depth of kerf Abrasive flow rate % of abrasives in the
{mm) {g/s) sedimented dross
11 17 6.1 94.8
13 17 6.8 95.0
14 70 6.6. 96.4
15 17 6.2 95.3
16 17 2.05 93.5
Table XIV Proportion of abrasives in the sedimented dross
The proportion of abrasives in the sedimented dross is in agreement with previous experiments. It increases with the kerling depth (test 14) and with the abrasive flow rate
(compared to test 16).
Uquid emissions (vapours)
Between 0.07 to 0.4 % of the used mass of water is drawn into the exhaust duct (M2).
B) Size distribution of abrasives and sedimented dross
Regarding the handling and the recycling capacity of the secondary waste it is useful to get knowledge about the proportion of eroded material in the sedimented dross depending on the size. Therefore for the tests 1 and 2 of the first series chemical analysis were
carried out to determine the proportion of copper in the waste.
56

Dimensions of the particles Proportion of copper in % on each sieve
in micrometers Experiment 1 Expe•il\'lent 2
< 37 11.0 12.2
37-63 9.8 E_).7
63-125 5.2 2
125-250 0.17 0.09
250-500 0.02 0.02
> 500 N.D. N.D.
N.D. = not detectable
Table XV Proportion of copper in the sedimented dross according to the size distribution
The particles of copper are more concentrated in the finest particles. The quantity of copper is more important in particles which dimensions are inferior to 125 J1Ifl for experiment 1 (mean proportion of copper: 3 %) and to 63 J1If1 for experiment 2 (mean proportion: 3.6 % ).
.......
40
35
30
~ 25 "' ~ 20 E "' 15 >
~ 10 .&l 0 5
26.1
13.0
0.11 0~~~~~~~~~~~~~~~~
40
35
....... 30 ~ "' 25 "' e 20
~ 15 ;;; E: 10
.&l 0 5
0
0
0
roo 200 3oo 400 particle size {.am)
29.6
14.5
100 200 300· 400 particle size (p. m)
500 600
0.06
500 600
kerfing copper under water pressure: 3000 bar
traverse rate: 140 mm/min focus: dr=1.1 mm/lr=40mm abrasive: Gamet "Minersiv" nozzle: 0.25 mm
Figure 54 Size distribution of used abrasives
57
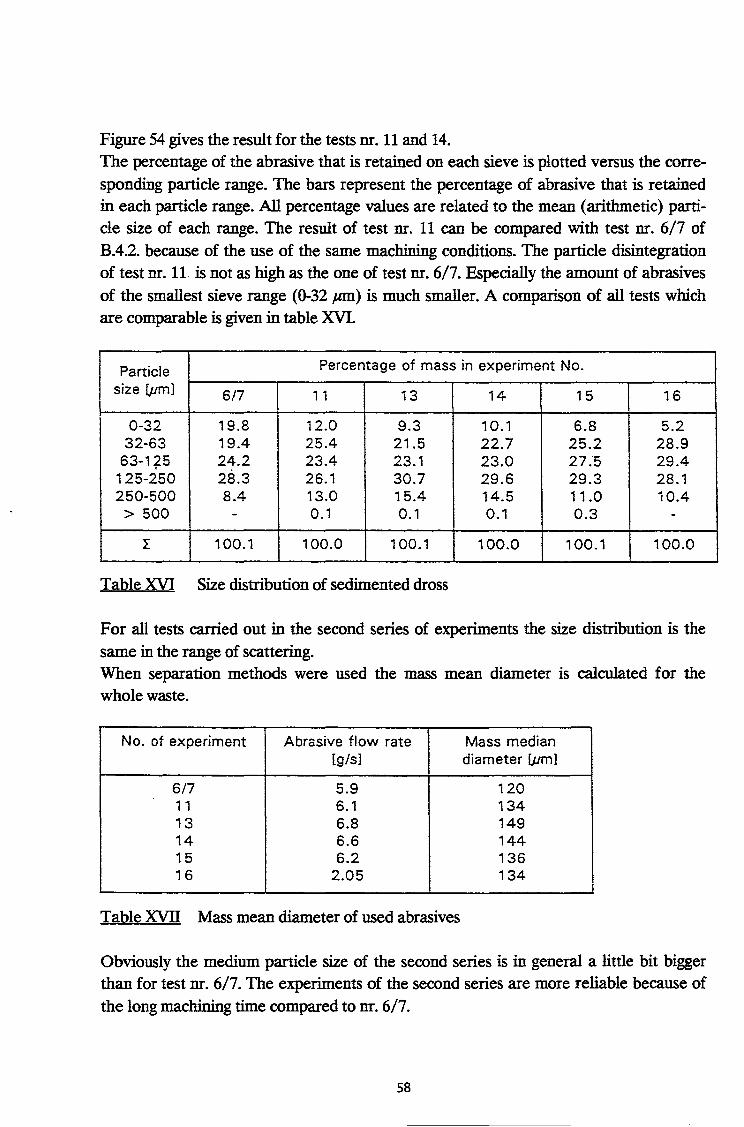
Figure 54 gives the result for the tests nr. 11 and 14. The percentage of the abrasive that is retained on each sieve is plotted versus the corresponding particle range. The bars represent the percentage of abrasive that is retained in each particle range. All percentage values are related to the mean (arithmetic) particle size of each range. The result of test nr. 11 can be compared with test nr. 6/7 of B.42. because of the use of the same machining conditions. The particle disintegration of test nr. ll is not as high as the one of test nr. 6/7. Especially the amount of abrasives of the smallest sieve range (0-32 ,urn) is much smaller. A comparison of all tests which are comparable is given in table XVI.
Particle Percentage of mass in experiment No.
size [Jim] 6/7 11 13 14 15 16
0-32 19.8 12.0 9.3 10.1 6.8 5.2 32-63 19.4 25.4 21.5 22.7 25.2 28.9
63-175 24.2 23.4 23.1 23.0 27:5 29.4 125-250 28.3 26.1 30.7 29.6 29.3 28.1 250-500 8.4 13.0 15.4 14.5 11.0 10.4 > 500 - 0.1 0.1 0.1 0.3 -
! 100.1 100.0 100.1 100.0 100.1 100.0
Table XVI Size distribution of sedimented dross
For all tests carried out in the second series of experiments the size distribution is the same in the range of scattering. When separation methods were used the mass mean diameter is calculated for the whole waste.
No. of experiment Abrasive flow rate Mass median [g/s] diameter [pm]
6/7 5.9 120 1 1 6.1 134 13 6.8 149 14 6.6 144 15 6.2 136 16 2.05 134
Table XVll Mass mean diameter of used abrasives
Obviously the medium particle size of the second series is in general a little bit bigger than for test nr. 6/7. The experiments of the second series are more reliable because of the long machining time compared to nr. 6/7.
58

Comparing the results of test nr. 11 and 14 there seems to be no influence of the kerfing depth on the particle disintegration. The size distribution (fig. 54) as well as the median
diameter (table XVII) are nearly not affected. The kerf of test nr. 14 was produced by using only 20 % of the traverse speed of the other test. As the result the kerfing depth was increased by the factor of 4, but not by a factor of 5 as expected. So for deep kerfing the efficiency of the abrasive water jet decreases according to the increased friction of the jet with the shoulder of the deep kerf. As mentioned before test nr. 12 wasn't successful. Using the direct hood the aspirated air causes problems with the suction pump and the hydrocyclone for separation.
Additionally the use of the cartridge filters (Type U2-20Z, 2 .urn) lead to problems regarding the circulated water flow rate. Although 10 filters were used parallel the pressure drop after few minutes of filtering was very high. The total capacity of each cartridge filter is between 200 and 2000 g (according to the manufacturer) depending on the conditions and especially on the formation of the cake but the suction system was not able to overcome the pressure drop of the wet and dirty filters. This effect was verified in test nr. 13. To simulate an operation without any hood (simulation of kerfing as well as cutting through) it has been tried to filter the basin in total. For this test the hydrocyclone as well as the cartridge filters were used. Starting with a water flow rate of 350 1/min through the filtration system the pressure drop increased very fast. After a few minutes the flow was decreased to 90 1/min water. One used cartridge filter is shown in figure 55. The filtering paper is clogged by particles from the cutting process. According to this effect the pressure drop has been increased.
Figure 55 Used cartridge filter (filter length 250 mm)
59


mean diameter of 152 fm!. Tests nr. 15 and 16 point out the effect of the abrasive flow rate on the cutting efficiency (see experiments 2,9 and 10 of first series). According to table XVIT the mass mean diameter is not affected by the abrasive flow rate. The cutting efficiency related to the abrasive flow is increased by using smaller abrasive flow rates. This is in accordance with the results presented in B.l. The size distributions of the used particles for tests nr. 15 and 16 are given in figure 57 and 58. Both tests were carried out with the indirect hood (see B.4.3.), the hydrocyclone for separation but without the cartridge filter system.
45 40
35
30 ~ 25 "' :; 20 E .. 15 > ;;; 10 E "8 5
40
35
....... 30 ~ 25 .. :; 20 E .. 15 >
;;; 10 E "8 5
17.3
5.1
0.36
100 200 300 400 500 600 particle size (.um)
13.6
0.24
100 200 300 400 500 600 particle size (.um)
kerfing copper under water pressure:· 3000 bor
traverse rate: 140 mm/ min focus: dF=1.1mm/lr=40mm o brasive: Gamet ")iinersiv" nozzle: 0.25 mm
Figure 57.58 Size distribution of used abrasives
61
50
45 40
35 ....... 30 ~ .. 25 .. ~ 20 ~ 15 ;;; E 10
.J:J 0 5
40
35
g 30 .. 25 "' ~ 20 ~ 15 ;;; E 10
.J:J 0 5
16.6
5.4
1 00 200 300 400 particle size (.um)
31.4
13.2
500
1 00 200 300 400 500 particle size (.um)
O.Q2
600
0.02
600
kerfing copper under water pressure: 3000 bar
traverse rate: 70 mm/ min focus: df=1.1mm/!r=40mm abrasive: Gamet "lolinersiv" nozzle: 0.25 mm

The mean diameter of the particles which are remaining in the basin is of smaller size than the particles gathered by the cyclone. The mass-% of the abrasives is related to the
total amount of abrasives remaining in the basin (upper part of fig. 57, 58) resp. the hopper (lower part), but not related to the total mass of waste. This is given in figure 59.
100
en en o· E 50 Q)
> ·u; E
...c 0 25
0
Figure 59
0
test 15; 6.2 g/ s
test 16; 2.05 g/s
. ....... 0 . co ......
.......
100
81.9
71.7
200 particle size (tLm)
Size distribution of used abrasives • gathered by the hydrocyclone - related to the total mass of waste
% of mass of waste which is separated by the cyclone and gathered in the hopper related to total mass of waste
85.7 81.2
300 400 500
For both tests the mass-% of the particles gathered in the hopper of the hydrocyclone are given related to the total mass of solid waste. For bigger particles the efficiency of the cyclone is quite good. For particles bigger than about 100 pm for both tests more than 80% of the mass was filtered by the cyclone. For smaller particles the efficiency decreases. According to figure 54 (result test nr. 11) 30- 40% of the total mass of solid waste consists out of particles smaller than 100 pm when kerfing copper under water (assumption: same size distribution of solid waste of test 11 and 15 I 16). With respect
to this fact it is necessary to increase the efficiency of the hydrocyclone regarding parti-
62

des smaller than 100 p.m to gather more mass in the filtration system.
Nevertheless, the use of a hydrocyclone seems to be a useful technique to separate solid
and liquid waste produced during abrasive water jet cutting. For the tests nr. 15 and 16 an indirect hood without optimisation has been used. 64.1 resp. 69.4 mass-% of the solid waste were separated by the cyclone (table XVIII).
Mass of waste [g] % of total mass [-]
Experiment No. Basin Hopper of Cartridge filters
cyclone
13 59 235 756 4 844 91.4 1.2 7.4
15 15 022 34 106 -30.6 69.4
16 12 972 23 146 -35.9 64.1
Table xvm Separation efficiency of hydrocyclone and filter
The use of cartridge filters is no sufficient way because of the high amount of smallest particles which clog the filters very fast. Only when using a hydrocyclone which is able
to separate a much higher percentage of particle mass even for particles smaller than 100 p.m the additional use of a cartridge filter can be a good method to separate the
remaining small amount of particles from the water.
C) Characterisation of the aerosols in the exhaust duct
The concentration of aerosols in the exhaust duct in all experiments of the second series
is inferior to 0.05 mg/m3. this concentration is low and the masses collected in the filters are small, so the figures obtained have to be considered as an order of magnitude.
As in previous experiments, taking into consideration the very small masses collected on each stage of the Andersen impactor during kerfing under water, the size distribution
cannot be detennined in mass. On the stages of the impactor cellulose filters were used
instead of fibre glass because they have a lower background for the researched elements (factor of 30 for Fe and Mg). Therefore, it was necessary to use a fibre glass filter as final filter because the cellulose filter has a poorer collection efficiency.
By the chemical analysis (annex 2) it can be deduced the size distribution of the particles of Cu, Fe and Mg. For each experiment, the size distribution is bimodal (and some
times trimodal) with one mode below 03 p.m and another mode mainly between 1 and 4
63

.um (annex 3). For the experiments where the size distribution is almost unimodal, the mass mean aerodynamic diameter (MMAD; see B.4.2) is indicated (table XIX). Compared to the previous results (B.4.2.), the particles collected in the exhaust duct for underwater operations are smaller than for operations in air.
Mass mean Geometric
Exp n° Abrasive flow rate
Reference aerodynamic
standard g/s diameter 10-a m deviation
11 6.1 Cu NA Fe NA Mg NA
13 6.8 Cu NA Fe NA
14 6.6 Cu NA Fe NA
15 6.2 Cu 2.06 3.07 Fe NA
16 2.05 Cu 1.72 2.86 Fe 1.61 3.01
NA: not applicable (the size distributions are multimodal)
Table XIX Aerosol size (MMAD)
64

Conclusions and Outlook
In the reported project different aspects have been investigated regarding the application of abrasive water jets in nuclear decommissioning. Especially the minimisation of secondary waste, the handling of aerosols and the control of the tool during operation are of interest. It was shown that abrasive water jets are able to cut steel up to more than 100 mm thickness. To do so the consumption of abrasives can be reduced by special measures. In detail the use of medium sized nozzles (0.25 mm) and the reduction of the abrasive flow rate as well as the increase of the pressure as high as possible are methods to reduce the abrasive consumption related to the produced area of cut. This fact can reduce the amount of secondary waste, too. In addition to these methods for reducing the consumption of water and abrasives it seems to be necessary to find ways to recycle the used abrasives. The cutting has to be operated remote controlled. Therefore methods to control the tool as well as the cutting result are necessary to ensure the reliability. Various techniques are applicable: - Measuring the pressure loss of the sucked-in air in the transport hose is a method to
calculate the diameter of the focusing nozzle during operation. - Sound analysis are not reliable to detect the result of machining. - The application of an accelerometer to detect the state of kerfing seems to be useful. Regarding the wear of the focusing nozzle the standing time was increased by the factor of 10 - 50 by the use of composite carbide nozzles. Therefore no special methods to replace worn parts are necessary because the operation time of one nozzle reaches about 100 h. In the reported project the secondary waste was quantified and analysed. This was done for kerfing and cutting through for application in air as well as under water. Only a very small amount of the waste is spread into the air as aerosols, most of the waste are sedimented particles. Analysing these particles it can be said that the particles are destroyed during the cutting process. To reduce the waste which has to be conditioned for final storage recycling seems to be a possible route. Although the particles disintegrate during cutting recycling can be realised I 11/: Even particles, which have been broken during previous cutting processes, are able to remove material. Particles with a diameter of about 50 !Iffi are able to reach the same efficiency as the same particle mass consisting out of particles with 500 !Iffi diameter. This fact indicates that it can be possible to reuse most of the abrasives. But it was shown that there is an enrichment of cut material in smaller particle sizes so that special treatment is necessary to separate these material from the abrasives. Further investigations have to be carried out to develop an efficient method of recycling. Regarding the aerosols working under water reduces the amount by the factor of 200
65

compared to application in air. In addition the use of a suction hood near the cutting head lowers the spreading of the particles. A cyclone seems to be useful to separate the particles from the water. Summing up the abrasive water jet technique is able to work reliable in the field of nuclear decommissioning. To find real applications methods of recycling the abrasive particles have to be investigated to reduce the amount of secondary waste. First tests have pointed out that it could be possible to reuse about 80 - 90 % of the abrasives.
66

References
Ill Abudak-a, M. and P.SJ. Crofton "Abrasive water jets for controlled demolition and dismantling" In: Proc. of the 1. Intern. Conf. on Offshore, Onshore and Nuclear Works (Manchester, England, 1988), UMIST, Manchester, England, 1988
121 Bach, F.-W.; Steiner, H.; Pilot, G. and E. Skupinski "Analysis of results obtained with different cutting techniques and associated filtration systems" Decommissioning of Nuclear Installations Ed.: Pflugrad, Bisci, Huber, Skupinski Elsevier Science Publishers Ltd.; Essex, England, 1990
131 Haferkamp, H.; Louis, H. and G. Meier "Submerged cutting of steel by abrasive water jets" Decommissioning of Nuclear Installations Ed.: Pflugrad, Bisci, Huber, Skupinski Elsevier Science Publishers Ltd.; Essex, England, 1990
141 Haferkamp, H.; Louis, H. and G. Meier "Submerged cutting of contaminated material by abrasive water jets under the protection of water shield". In: Proc. of the 9th International Symposium on Jet Cutting Technology (Sendai, Japan, Oct.1988) BHRA, The Fluid Engineering Centre, Cranfield, U.K., 1988
151 Haferkamp, H.; Louis, H. and G. Meier ''W eiterentwicklung des Abrasivstrahl-Schneidverfahrens zum Trennen ferritischer und austenitischer Stahle unter Wasser" Final Report Contract FI1D-0069, BUR 12684 DE Commission of the European Communities, Luxembourg, 1990
161 Meier, G.: "Unterwassereinsatz von Wasserabrasivstrahlen" VDI-Fortschrittbericht, Reihe 2 (Fertigungstechnik) VDI-Verlag, DUsseldorf, 1993
11 I Louis, H. and G. Meier ''Process Control for Submerged Cutting by Abrasive water Jets" In: Proceeding of the 3. Intern. Symposium on Underwater Technology, GKSS Forschungszentrum, Geesthacht, Germany, 1991
181 Louis, H. and G. Meier "Methods of Process Control for of Abrasive Water Jets" In: Proc. of the 6th American Water Jet Technology Conference (Houston, USA, Aug. 1991) Water Jet Technology Association, St. Louis, USA, 1991
67

/9/ GA.Mort ''Long Life Abrasive Water Jet Nozzles and Their Effect on AWJ Cutting" In: Proc. of the 6th American Water Jet Technology Conference (Houston, USA, Aug. 1991) Water Jet Technology Association, St. Louis, USA, 1991
/10/ Rouviere, R.; Pinault, M.; Gasc, B.; Guiadeur, R. and G. Pilot "Adaptation des jets d' eau haute pression avec abrasif au demantelement des installations nucleaires" Final Report Contract FI1D-0067, EUR 12490 FR Commission of the European Communities, Luxembourg, 1989
/11/ Guo, N.S.; Louis, H.; Meier, G. and J. Ohlsen "Recycling Capacity of Abrasives in Abrasive Water Jet Cutting" Jet Cutting Technology Ed.: A. Lichtarowicz Kluwer Academic Press; Dordrecht, Netherlan~s, 1992
68

ANNEX 1
Sheets of results


EXPERIMENT No. I (CUTTING) Dale: 26111191
PLACE: UNDERWATER TOOL: WATER JET
MATERIAL NATURE: COPPER WATER DEPTH: AIR VOLUME OF BASIN:
THICKNESS: IOmm WATER VOLUME OF BASIN:
CUTLENOTH: 6$28 mm VENTILATION FLOW RATE:
WATER PRESSURE: 3000 bar ABRASIVE NATURE: WATER FLOW RATE: 1.63 1/min ABRASIVE FLOW RATE:
TOOL
OPERATION ABRASIVE WATER FOCUSING NOZZLE
MODE M6 M'6 M7 M'1 M5 M'S AND mus used man used mass lou
POSmON lei (glm) lei (glm) (g) (glm)
AUTOMATIC 20070 3 074.4 76300 II 688 0.0112 0.0017 GRAVITY
~
SECONDARY EMISSIONS
MATERIAL WEIGHT (I) SEDIMENTED DROSS EXHAUST WATER
Before MO M'O Ml M'l MlfTC M2 Removed
after lei I elm) lei (glm) ,,.., (C)
4083 650 99.6 19607
3 433 3 003.5 97.5 30.8
•• l mm 11 er cuuang
AEROSOLS
FILTER SAMPLED SAMPLED Cl crou co MASS VOLUME background
0mm (mel (m'J (mglm1) (mg/m1)
0 47 0.06 0.4452 0.13 0.06 0 130 O.lO 1.033 0.19 0.08
lnaegral 1.53 0160
16.1 0.095 0.055
TC s TOTAL SOLID MASS COLLECTED • Ml + M3 + M4 TIC I • TOTAL SOLID MASS REMOVED = MO + M6
NOTES·
M'2
(g/m)
4.7
Cl nel
(mglm1)
O.Gl 0.11
0.04
a20111g
- 20720&
Ml/M7
(!'i)
0.04
M4 (g)
aerosol ma.ss
0.00075
IOOmm 0.360m1
0.780 m1
24 m'.h'1
GARNET 1.2 g/1
OPERATION
CUTTING TIME SPEED
(mmlmin) (min)
140 46 9
SUSPENDED PARTICLES
M3 M'3 M3fTC
(g) (glm) (II)
S04 .. 11 '2.4••
M4 M4fTC
(glm) (II)
0.00012 3 6.1o·•
TC TICI • 97.0 Ill.
I KERF WIDTH I TOP: 1.2 mm I BOTTOM: 0.9 mm
EXPERIMENT No. 2 (CUTTING) Date: 27/11191
PLACE: IN AIR TOOL: WATER JET
MATERIAL NATURE: COPPER WATER DEPTH: AIR VOLUME OF BASIN:
THICKNESS: IOmm WATER VOLUME OF BASIN:
CUTLBNOTH: 6528 mm VENTILATION FLOW RATE:
WATER PRESSURE: 3000 bar ABRASIVE NATURE: WATER FLOW RATE: 1.63 1/min ABRASIVE FLOW RATE:
TOOL
OPERATION ABRASIVE WATER FOCUSING NOZZLE
MODE M6 M'6
M7 M'7
M5 M'5 AND man used
m:au mus POSITION (g) (g/m) used
(g/m) loss (glm) lei (B)
AUTOMATIC 19020 2 914 76 300 II 688 0.0112 0.0017 GRAVITY
SECONDARY EMISSIONS
MATERIAL WEIGHT (c) SEDIMENTED DROSS EXHAUST WATER
Defore MO M'O Ml M'l MlfTC M2 M'2
after Removed
(g) (glm) (g) (g/m) (1'1) (g) (g/m)
4 086 719 110.1 18 404 2 819.2 99 3 127.2 19.5 3 367
• water un er m&lenal
AEROSOLS
FILTER SAMPLED SAMPLED Cl gross co Cl nel MASS VOLUME background
0mm (mg) (m') (mclm1) (mglm1) (mglm1)
0 47 3.69 0.4680 7.88 0.05 7.83 0130 8.72 0.8610 10.13 0.08 10.05
lnlegral U6.37 16.31 9 59 0.055 9.54 0160
TC a TOTAL SOLID MASS COLLECTED a Ml + M3 + M4 - 18 532 g • 19 739 g TIC I • TOTAL SOLID MASS REMOVED • MO + M6
NOTES:
M21M7
(!'i)
0.17
M4 (g)
aerosol mass
0.179
0.650 m1
0.490 m1
24m1.h"1
GARNET 6.8 g/s
OPERATION
CUTTING TIME SPEED
(mmlmin) (min)
140 46.9
SUSPENDED PARTICLES
M3 M'3 M3fTC
<a> (glm) (!'i)
J28.J• 19.6• 0.7•
M4 M4fTC
(g/m) (!'i)
0.021 9.7.10~
TC -TiCT • 93.9 "
I KERF WIDTH I TOP. 1.3 mm I BOTTOM: I mm

£XF£RIMI!NT No. 3 (CUTIING) D>tc: 28111/91
PLACE: IN AIR TOOL: WATER JET
MATERIAL NATURE· STEEL WATER DEPTH: AIR VOLUME OF BASIN:
THICKNESS: IOmm WATER VOLUME OF BASIN:
CUT LENGTH: 3 612 mm VENTILATION FLOW RATE:
WATER PRESSURE: 3 000 bar ABRASIVE NATURE: WATER FLOW RATE: 1.63 1/min ABRASIVE FLOW RATE:
TOOL
OPERATION ABRASIVE WATER FOCUSING NOZZLE
MODE M7 M'1 M5 M'5 M6 M'6
AND mass used mus mass POSITION (g/m)
used (g/m) loss (g/m) (g)
(g) (g)
AUTOMATIC 13 602 3 704 54 300 14 788 00093 0.0025
GRAVITY
SECONDARY EMISSIONS
MATERIAL WEIGHT lcl SEDIMENTED DROSS EXHAUST WATER
MO M'O Ml M'l MlffC M2 Before Removed after
(g) (lim) (g) (glm) ('!I) (g)
3 552 295 80.3 12723 3 464.9 98 6 86.6
3 057
water un er matena
AEROSOLS
FILTER SAMPLED SAMPLED Claron co MASS VOLUME b:u:kground
lllmm (me) (m') (mglm'l (mllm')
0 47 2.41 0.3019 7.98 0.06 0 130 10.79 0.7842 13.76 0.08
lntearal 111.81 11.67 9.58 0.055 0160
TC o TOTAL SOLID MASS COLLECTED • Ml + M3 + M4 TICI m TOTAL SOLID MASS REMOVED • MO + M6
NOTES:
M'2
(aim)
:!3.6
Cl net
(mctm'l
7.9l 13.68
9.53
- 12 905 c • 13 8971
M2/M7
('ll)
0.16
M4 lcl
aerosol mass
0.127
0 650 m' 0.490 m' 24m,.h.1
GARNET 6.8 ,,,
OPERATION
CUTTINO TIME SPEED
(mmlmin) (min)
110 33.3
SUSPENDED PARTICLES
M3 M'3 M3ffC
(C) (glm) ('!I)
181.9• 49.6° 1.4
M4 M4ffC
(lim) ('!I)
0.035 9.8.10~
TC · 'i'iCT • 92.9 ll
IKERFWlDTII I TOP: 1.3 mm I BOTTOM: I mm
EXPERIMENT No. 5 (KI!RFINGl D•lc: 27111191
PLACE: IN AIR TOOL: WATER JET
MATERIAL NATURE· COPPER WATER DEPTH: AIR VOLUME OF BASIN·
THICKNESS: 20 mm WATER VOLUME OF BASIN:
CUT LENGTH: 3672mm VENTILATION FLOW RATE:
WATER PRESSURE: 3 000 bar ABRASIVE NATURE: WATER FLOW RATE: 1.63 1/min ABRASIVE FLO~V RA Til:
TOOL
OPERATION ABRASIVE WATER FOCUSING NOZZLE
MODE M6 M'6 M7
M'7 MS M'5 AND mass used m:ass mass
POSITION I elm)
used (glm) lou (g/m) lcl (g) (g)
AUTOMATIC 9 980 2 693 42 900 II 683 0.0063 0.0017 GRAVITY
SECONDARY EMISSIONS
MATERIAL WEIGHT (g) SEDIMENTED DROSS EXHAUST WATER
MO M'O Ml M'l MlffC Ml M'2 Bdorc Removed after (g) (g/m) (C) (glm) ('!I) (g) (g/m)
4 736 58l U8.5 982.1 2 674.6 99.1 715.6 194.9 4 154
water un crmatcna
AEROSOLS
FILTER SAMPLED SAMPLED Cl arou co MASS VOLUME background
0mm (mal (m'l (mgtm') (mgtm')
0 47 12.33 0.2418 51.0 0.06
"' 130 34.5 0.5637 6l.:! 0.08
Integral 428.8 9.03 47.49 0.055
0160
TC o TOTAL SOLID MASS COLLECTED= Ml + M3 + M4 TICI o TOTAL SOLID MASS REMOVED • MO + M6
I NOTES: KERFINO DEPTH: 15·18 mm
Cl net
(mllm'l
50.9 61.1
47.4
= 9 913.8 1 0 10 4711
M2/M7
('!I)
1.7
M4
Ia> aerosol man
0.499
0.600 ml 0.540m' 24 m1.h"1
GARNET
6.3 "'
OPERATION
CUTTINO TIME SPEED
(mm/min) (min)
140 26 3
SUSPENDED PARTICLES
M3 M'3 M3ffC
lcl (glm) (!I)
92.3• 25.1• 0.9
M4 M4ffC
(g/m) ('!I)
0.136 5.10'
TC 'i'iCi • 94.7 ll
I KERF WIDTH ITOP· l.:!mm I BOTTOM: 0.9 mm
I
I I

EXPERIM.EJ'(I' N" 11 (KERFlNG) DATE: 0210611992
PLACE: UNDERWATER TOOL: WATER JET
MATERIAL NATURE: COPPER WATER DEPTH: 180 mm AIR VOLUME OF BASIN: 0.27 m1
TIUCKNLlS! 20 mm WATER VOLUME OF BASIN: 0.8S m1 + 0.2S m'"· :
CUT LENGTH: 21 2S2 mm VENTILATION FLOW RATE: 24 m11b
WATER PRESSURE: 3000 bar ABRASIVE NATURE: GARNET WATER FLOW RATE: 1.63 1/mia ABRASIVE FLOW RATE: 6.1 g/o
TOOL
OPERATION ABRASIVE WATER FOCUSING NOZZLE OPERATION
MODE AND M6 M'6 M7 M'7 MS M'S CUTTINO TIME
POSITION mass used (&/m)
mass ustd (g/m) maJ.S loss (&/m)
SPEED (min) (&) (g) (&) (mm/osio)
AUTOMATIC SS SIO 2 612 248 000 II 669 0.03S 0.0016 140 IS2 GRAVITY
SECONDARY EMISSIONS
MATERIAL WEIGHT (0) SI!DIMENTED DROSS EXHAUST WATER SUSPENDED PARTICLES
Before MO M'O Ml M'l MIITC M2 M'2 M2/M7 M3 M'3 M3/TC Removed
after (&)
(&/m) (&) (&/m) (~) (&)
16 619 3 06S 144.2 S6 184 2 644 99.3 172.7 13 SS4
AEROSOLS
FILTI!R SAMPLED SAMPLED
Cl gross co
MASS VOLUMI! (mg/m1)
background mm (mg) (m') (mglm1)
0 47 NS 0130 NS
Jntearal 0160 2.8 SI.S O.OS4 0.010
TC a TOTAL SOLID MASS COLLECTED= Ml + M3 + M4 TIC I a TOTAL SOLID MASS REMOVED = MO + M6
I NOTES: KERF DEPTH: 17 mm
I KERF WIDTH
NS a NOT SIGNIFICATIVE
(&/m)
8.1
Cl NET (mglm'J
0.044
= S6S61.2 = sa s1s
(~) (&)
0,07 377.2
M4 (&)
aerosol mass
2.3 10 1
I BOTTOM:
(&/m) (~)
11.1 0.7
M4 M4ffC (glm) <">
1.10~ 4.10'
....!£.. • 96.6% T1C1
EXPEIUII1EJ'(I' N" ll (KERFlNG) OATH: 03106/1992
PLACB: UNDBRWATER TOOL: WATER JET
MATERIAL NATURE: COPPER WATER DEPTH: 180 mm AIR VOLUME OF BASIN: 0.27 m'
TIUCKNESS: 20 mm r:, WATER VOLUME OF BASIN: 0.8S m'
CUT LENGTH: 2 SOO mm VENTILATION FLOW RATE: 24 m11b
WATER PRESSURE: 3000 bar ABRASIVE NATURE: GARNET WATER FLOW RATE: 1.63 1/min ABRASIVE FLOW RATE: 9.7 g/s
TOOL
OPERATION ABRASIVE WATER FOCUSING NOZZLil OPERATION
MODE AND M6 M'6 M7 M'7 MS M'S CUTTINO TIME
POSITION mass used (glm) mass used (&/m) mass loss
(gfm) SPEED (min) (&) (&) (&) (mm/mln)
AUTOMATIC 10 soo 4 200 S4 000 21600 0.004 0.0016 140 18' GRAVITY
• + IS min without abrasivc!s
SECONDARY EMISSIONS
MATERIAL WEIGHT (0) SEDIMENTED DROSS EXHAUST WATER SUSPENDED PARTICLES
Before MO M'O Ml M'l MIITC M2
Removed after (&)
(&/m) (&) (glm) <"l (&)
16 633 39 IS.6 NS 16 S94
AEROSOLS
FILTER SAMPLED SAMPLED
Cl gross co
MASS VOLUME (mg/m1)
background mm (mg) (m') (mg/m1)
0 47 NS 0 IJO NS
Integral 0 160 0.6 13.97 0.043 0.010
TC • TOTAL SOLID MASS COLLECTED a Ml + M3 + M4 TIC I =TOTAL SOLID MASS REMOVED = MO + M6
NOTES: I) Vaouum cleaner + cartridges + direct hood with sue lion
M'2 M21M7 MJ (&/m) (~) (&)
Cl NET M4
(mglm'J (&) aerosol mass
0.033 4.6 10"'
M'J (&/m)
M4 (glm)
1.8 10~
....!£.. • T1C1
MJffC
<">
M4ffC (%)
2) The vacuum cleaner was not operating conectly because the pump was lUcking air coming from the cutting head 3) The abrasive cube was disconnecced after 18 minuces
I KERF WIDTH I ToP: I BOTTOM:
NS = NOT SIONIFICATIVB

EXPERIJIIENT N" 13 (KERFING) DATE: 0310611992
PLACE: UNDERWATER TOOL: WATER JET
MATERIAL NATURE: COPPER WATilR DEPTH: 180 mm AIR VOLUME OF BASIN: 0.27 m'
TIUCKNESS: 20 mm WATER VOLUME OF BASIN: O.SS m1 + 0.2S m1
Ctrf LENGTH: 21 2S2 mm VENTILATION FLOW RATE: 24 m1/h
WATER PRilSSURE: 3000 bar ABRASIVE NATURE: GARNET WATER FLOW RATE: 1.63 1/mio ABRASIVE FLOW RATE: 6.8 gls
TOOL
OPERATION ABRASIVE WATER FOCUSING NOZZLE OPERATION
MODE AND M6 M'6
M7 M'7
MS M'S
CUTTINO TIME
POSITION mass used (&/m)
mass used (glm) mass loss (glm)
SPEED (mio)
(g) (g) (g) (mmlmin)
AITrOMATIC 62 090 2922 248 000 II 669 0.035 0.0016 140 IS2 GRAVITY
SECONDARY EMISSIONS
MATERIAL WEIGHT (0) SEDIMENTED DROSS EXHAUST WATER SUSPENDED PARTICLES
Beroro MO
M'O Ml M'l Mtrrc Ml M'2 after
Removed (glm) (g) (glm) (I\) (g) (glm)
(g)
16 611 J 247 1$2.8 64 SJS J OSI 97.2 249.3 11.7 13 364
AEROSOLS
FILTER SAMPLED SAMPLED
Claross co
Cl NET MASS VOLUME background
mm (mal (m1)
(malm1) (mc/m1)
(mglm')
"'47 NS
"' 130 NS
Integral "'160 1.0 S3.1S 0.019 0.010 0.009
TC =TOTAL SOLID MASS COLLECTED = Ml + M3 + M4 = 66 709.4 TIC I a TOTAL SOLID MASS REMOVED = MO + M6 = 65 337
NOTES: 1) Vacuum cleaner + cutrid&es + suction at basin side
I KERF WIDTH
2) Hood at the cuuing head 3) Ml: 4 844 a in cartridgei7S6 8 in hopper I 59 235 1 io basin 4) Vacuum cleaner flow rate: Stan: 4SO 1/mio, End: 90 t/mio S) Kerr depth : 17 mm
I TOP:
NS a NOT SIGNIFICATIVE
M21M7 M3 M'3 (I\) (g) (&/m)
0.1 I 874.4 88.2
M4 (g)
aerosol mass
4.7 10•
I BOTTOM:
M4 (&/m)
2.2 10 1
_.!Q_ • 102% T1C1
M3ffC (I\)
2.8
M4ffC (I\)
7.10 1
EXPERIMENT N" 14 (KERFING)
PLACE: UNDERWATER
MATERIAL NATURE: COPPER
TffiCKNESS: 100 mm CITr LENGTH: 3 036 mm
WATER PRESSURE: 3000 bar WATER FLOW RATE: 1.63 1/min
OPERATION ABRASIVE
MODB AND M6 M'6 mass used POSITION (glm)
(g)
AITrOMATIC 600$0 19 779 GRAVITY
DATE: 04106/1992
TOOL: WATER JET
WATER DEPTH: 180 mm AIR VOLUME OF BASIN: 0.27 m1
·- WATER VOLUME OF BASIN: 0.8$ m' + 0.2S m1
VENTILATION FLOW RATE: 24 m'lh
TOOL
ABRASIVE NATURE: GARNET ABRASIVE FLOW RATE: 6.6 cis
WATER FOCUSING NOZZLB OPERATION
M7 M'7 MS
M'S CUTTINO mass used muslos.s SPEED
TIME (&/m) (&/m) (g) (g) (mmlmin)
(min)
248 000 81 686 0.028 0.0092 20 152
SECONDARY EMISSIONS
MATERIAL WEIGHT (0) SEDIMENTEO DROSS EXHAUST WATilR SUSPENDED PARTICLES
Bororo Re~:ved after
29 171 26 951 2 214
M'O (&/m)
129.2
Ml (g)
59 746
FILTER SAMPLED SAMPLED
mm MASS VOLUME (rna) (m1)
0 47 NS 0 130 NS
Integral "'160 1.8 Sl.7S
M'l (&/m)
MlffC (I\)
M2 (g)
19679
C1 gross (mc/m1)
0.033
99.5 248.7
AEROSOLS
co background
(mglm1)
0.010
M'2 (glm)
81.9
C1 NET (mglm')
0.023
TC =TOTAL SOLID MASS COLLECTED= Ml + M3 + M4 a 6006S.S TIC I • TOTAL SOLID MASS REMOVED = MO + M6 • 62 264.0
I NOTES: KERF DEPTH: 70 mm
IKERPWIDTH
NS a NOT SIGNIFICATIVE
M21M7 (I\)
0.1
M4 (g)
M3 (g)
319.S
M'3 (&/m)
105.2
aerosol ma.s.s
M4 (glm)
1.3 10"1 4.2 10'
TC T1Ct • 96"5%
I BOTTOM:
M3ffC (I\)
0.5
M4ffC (I\)
2.104

EXPERIMENT N' IS (KERFING) DATE: 0410611992
PLACE: IJIIDERWATER TOOL: WATER lET
MATERIAL NATURE: COPPER WATER DEPTH: 180 rom AIR VOLUME OF BASIN: 0.27 m1
TIUCKNESS: 20 mm WATER VOLUME OF BASIN: O.SSJn1 + 0.25 m1
CUT LENGTH: 21 252 mm VENTILATION FLOW RATE: 24 m1tb
IV ATER PRESSURE: 3000 bar ABRASIVI! NATURE: GARNET IV ATER FLO IV RATE: 1.63 1/mio ABRASIVI! FLOW RATE: 6.2 Jl•
TOOL
OPERATION ABRASIVE WATER FOCUSINO NOZZLE OPERATION
MODI! AND M6 1\1"6 M7 M'7 MS M'S CUTTINO
TIME POSITION mL\S used
(g/m) mass used
(g/m) mi\S.S loss
(g/m) SPEED
(mio) (g) (g) (g) (mmlm•n)
AUTOMATIC S4 840 2 580 ~53 000 II 90S 0.028 O.OOIJ 140 ISS GRAVTCY
SECONDARY EMISSIONS
MATERIAL IVEIOHT (0) SEDIMENTED DROSS EXHAUST WATER SUSPENDED PARTICLES
Before MO M'O Ml M'l MI/TC Ml M'2
Removed after (g)
(g/m) (g) (g/10) (llo) (g) (g/m)
16 61S 2 686 126.4 49 128 2 312 99.4 321.2 IS.I 13 929
AEROSOLS
FILTER SAMPLED SAMPLED
Cl cross co 'ct NET
MASS VOLUME (mg/m')
background (m&fm'> mm (m&) (m') (mc/m1)
f2J 47 NS 0 130 NS
lntearal 0 160 0.7 Sl.7S 0.013 0.010 0.003
TC a TOTAL SOLID MASS COLLECTED • Ml + M3 + M4 a 49 421.9 TIC I • TOTAL SOLID MASS REMOVED a MO + M6 • S7 S26.0
NOTES: I) Vacuum cleaner w1thou1 carlridso, Row race: JSO 1/mia 2) Ml: 34 106 & in hopper, IS 022 & io bMin 3) Suction by hood ruMina: behind culling head 4) Kerf depth: 17 mm
I KERF WIDTH
NS a NOT SIONIFICATIVB
M21M7 MJ M'3
<"> (g) (g/m)
0.13 293.9 13.8
M4 M4 (&)
aerosol mas.s (&/m)
1.1 to•
I BOTTOM:
9. 10'
_!Q_ • 85.9% TIC I
Ml/TC (llo)
0.6
M41TC (Ito)
3.to·•
EXPERIMENT N' 16 (KERFING) DATI!: 0510611992
PLACE: IJIIDI!RIVATI!R TOOL: WATER li!T
MATERIAL NATURE: COPPER WATER DEPTH: 180 mm AIR VOLUME OF BASIN: 0.27 m'
TIUCKNESS: 20 mm ... ·:~ ! WATER VOLUME OF BASIN: 0.85 m' + O.S m1
CUT LENGTH: 21 252 mm VENTILATION FLOW RATE: 24 m1/h
WATER PRESSURE: 3000 bar ABRASIVE NATURE: GARNET WATER FLOW RATE: 1.63 t/mio ABRASIVI! FLOW RATE: 2.0S g/s
TOOL
OPERATION ABRASIVE WATER FOCUSING NOZZLE OPERATION
MODE AND M6 M'6 M7 M'7 MS M'S CUTTINO TIME
POSITION mass used (g/m)
mass used (g/m)
masa loss (g/m)
SPEED (min) (g) (g) (g) (mmlmin)
AUTOMATIC 36 210 I 704 480000 22 S86 0.022 0.0010 70 301 ORAVTTY
SECONDARY EMISSIONS
MATERIAL IVEIOHT (0) SEDIMENTED DROSS EXHAUST WATER SUSPENDED PARTICLES
Before MO M'O Ml M'l MIITC M2 M'2 Removed after (g)
(glm) (g) (g/m) <"> (g) (g/m)
16 S94 2SOI 117.7 36 118 I 700 99.3 I S6S.2 73.6 14 093
AEROSOLS
FILTER SAMPLED SAMPLED Cl gross co Cl NET mm
MASS VOLUME (mc/m1)
background (maim') (m&) (m') (m&fm')
f2J 47 NS 0 130 NS
Integral 0160 1.1 101.8 0.010 0.010 z.to•
TC ~TOTAL SOLID MASS COLLECTED a Ml + M3 + M4 - 36 384.3 TIC I • TOTAL SOLID MASS REMOVED a MO + M6 = 38 711
NOTES: 1) Vacuum cleaner without c:artridae, flow rato: 350 1/min 2) Ml: 2J 146 gin hopper, 12 972 g in basin 3) Suction by hood running behind cuning bead 4) Kerf depth: 17 mm
I KERF WIDTH
NS a NOT SIGNIFICATIVI!
M2/M7 M3 M'l (llo) (g) (g/m)
0.33 266.3 12.S
M4 M4 (g)
aerosol mass (&/ru)
2.210'1
I BOTTOM:
1.101
_!Q_ • 94% T1C1
M31TC (llo)
0.7
M41TC (Ito)
6.10'1


ANNEX 2
Chemical analysis of the waste


Ref. Exp. n° 1 Exp. n° 6n Exp. n° 2 Exp. B 0 10
Microgrammes totaux Microgrammes totaux Microgrammes totaux Microgrammes totaux
No Cu Fe Mg Cu Fe Mg Cu Fe Mg Cu Fe Mg 0 < 1 65 80 7 700 930 110 980 870 73 800 800 1 < 1 65 80 7 820 770 60 865 910 38 700 700 2 < 1 60 80 6 590 820 43 900 1020 25 900 1200 3 < 1 60 89 7 625 900 41 860 960 15 900 900 4 < 1 65 80 ·7 700 950 35 980 860 34 800 1100 5 < 1 75 100 7 740 880 24 750 960 23 800 1000 6 < 1 65 80 6 610 875 20 680 930 11 900 1200 7 < 1 60 75 7 660 880 15 720 1070 11 800 1100
Fin < 1 70 80 7 660 900 14 670 930 3 800 1100 Blanc < 1 10 10 6 650 850 6 650 850 6 650 850
Exp. n° 8 Exp. n° 3 Exp.
Filtres diametre 160 mm Ref.
Microgrammes totaux Microgrammes totaux milligrammes totaux
No Cr Fe Mg Ni Cr Fe Mg Ni No Cr Cu Fe Mg Ni 0 450 5800 1500 230 < 10 100 70 < 10 1 240 3400 1250 110 < 10 95 60 < 10 1 0.01 0.17 6.0 2 170 2600 1100 70 < 10 87 70 < 10 5 44.3 73.3 20.2 3 160 2200 700 33 < 10 84 60 < 10 6n 0.21 0.98 9.4 4 90 1700 1050 40 < 10 96 70 < 10 2 6.2 28.5 11.1 5 45 1100 970 45 < 10 90 so < 10 8 6.50 0.001 164 17.1 3.6 6 20 730 920 25 < 10 60 80 < 10 3 0.37 0.11 19.7 10.3 0.3 7 18 660 880 26 < 10 50 80 < 10 9 '3.05 14.3 9.2
Fin 17 710 540 50 < 10 50 80 < 10 10 2.4 10.1 11.0 Blanc 17 540 730 16 < 10 8 6 < 10 Blanc 0.015 <0.001 0.15 6.1 < 0.01
Reference Cu Fe Mg Unite
Eau propre 26 <5 4.4 Microgrammes/litres
Exp. n° 1 (520 ml)
Sumageant 480 <5 5.8 Microgrammesllitres Depot 25 77 10 Milligrammes
Exp. n° 6n (520 ml)
Sumageant 500 <5 4.8 Microgrammesllitres Depot 8.2 21 3.1 Milligrammes
81

CENTRE D'ETUDES DE SACLAY
D.C.C. I D.P.E. D.C.C.I D.P.E. S.P.E.A I S.A.I.S Saclay, le 3 novembre 1992 S.P.E.A I S.A.l.S R.A. 92-142 Laboratoire d'Analyses Physico-Cbimiques Laboratoire d' Analyses Physico-Chimiques
Analyse de filtres diam~tre 80 mm
R.A. 92-142 S~rle 15 Cu Fe Mg
filtre 0 1,15 1,12 1,55 Analyse de filtres diam~tre 80 mm filtre 1 1,37 1,92 1,62
filtre 2 1,87 2,05 2,00 S~rle 11 Cu Fe Mg filtre 3 2,80 2,42 2,55
filtre 4 3,15 2,67 3,05 filtre 0 1,06 0,60 1,25 filtre 5 1,70 1,42 2,02 filtre 1 1,32 0,60 1,22 filtre 6 1,00 1,47 1,50 filtre 2 1,52 0,77 1,37 filtre 7 0,70 0,62 1,30 filtre 3 2,06 0,80 1,63 Fmillipore 1,62 2,42 2,50 filtre 4 2,49 1,30 1,50 Fpall 0,92 11,4 23,3 filtre 5 2,22 1,12 1,45 filtre 6 2,05 1,62 1,49 filtre 7 1,80 1,12 1,27 S~rle 16 Cu Fe Mg
11 F miUipore 1,85 1,77 1,97 11 F pall 5,35 8,37 16,8 filtre 0 1,40 0,98 1,20
filtre 1 1,50 0,92 1,30 00 filtre 2 2,40 1,50 1,52 IV S~rle 13 Cu Fe Mg filtre 3 4,00 1,87 1,92
filtre 4 5,70 2,45 2,57 Filtre 0 1,12 0,60 1,12 filtre 5 3,87 1,90 1,97 filtre 1 1,30 0,60 1,47 filtre 6 2,40 1,40 1,70 filtre 2 1,32 1,02 1,60 filtre 7 1,45 0,95 1,37 filtre 3 1,55 1,07 1,62 filtre 4 1,47 1,55 1,70 Fmillipore 2,70 1,87 3,25 filtre 5 1,32 1,22 1,87 Fpall 0,85 9,38 25,3 filtre 6 1,40 1,72 1,87 ftltre 7 1,12 2,17 1,77 Analyse de filtres diam~tre 160 mm
Fmillipore 2,05 3,00 3,30 Fplill 0,82 12,5 31,3 R~Mrence Cu Fe Mg
BDFgall 4,45 10,2 23,9 S~rle 14 Cu Fe Mg BDFmi lipore 3,90 12,4 9,50
BDFnuitftall 14,9 47,9 32,4 filtre 0 0,65 1.45 0,95 BDF nuit mi lipore 5,00 10,5 7,20 filtre 1 0,55 0,75 0,75 11 Ftall 4,80 10,2 32,9 filtre 2 0,60 0,87 1,22 11 mi lipore 36,4 20,3 17,9 filtre 3 0,70 1,10 1,42 12 Ftlill 5,40 18,5 35,3 filtre 4 1,00 2,02 2,90 12 mi lipore 7,95 10,9 12,4 filtre 5 0,92 1,60 1,90 13 Ftlill 4,45 9,90 27,5 £iltre 6 0,75 1,62 2,02 13 mi lipore 15,9 15,6 17,0 filtre 7 0,80 1,52 2,05 14 gall 3,40 10,5 25,8
Fmillipore 14 mi lipore 9,40 20,7 25,1
1,00 3,00 4,25 15 can 4,50 9,0 26,6 Fpall 1,22 10,9 27,3 15 mi ipore 20,9 19,9 19,0
16 ftall 7,50 11,8 34,2 16 mi lipore 41,6 31,3 23,7
filtre blanc ftall 1,80 11,4 40,0 filtre blanc mi lipore 1,90 2,70 2,60

00 w
D.C.C. I D.P.E. S.P.E.A I S.A.I.S Laboratoire d' Analyses Physico-Chimiques
Analyse de filtres diametre 47 mm
RU~rence Cuivre
mouvement propre bruit de fond nuit
1,10 11,0
filtre 11 4,22 filtre 12 2,25 filtre 13 3,50 filtre 14 2,12 filtre 15 5,25 filtre 16 10,5
(Pour m6moire:) blanc filtre 0,92
Analyse de filtres diametre 130 mm
RU6rence Cuivre
mouvement propre 1,37 bruit de fond nuit 35,4
filtre 11 16,0 filtre 12 2,40 filtre 13 3,18 filtre 14 1,95 filtre 15 3,33 filtre 16 6,21
Fer
24,2 66,0
24,2 25,0 24,6 27,2 23,9 40,0
21,6
Fer
5,62 85,2
9,65 6,12 5,07 5,37 5,87 8,07
Les r6sultats sont exprimts en microgramrnes recueiiUs sur le filtre.
Limites de confiance (p=0,95): 0,3 mlcrogramrne.
R.A. 92-142 D.C.C. I D.P.E. S.P.E.A I S.A.I.S Labor a to ire d' Analyses Physico-Chimiques
RM6rence
Solution
11 (475 ml) 13 (50~
14 r75 ~ 15 475 m1 16 525 m1
DtpOt
11 13 14 15 16
Analyse de solutions de dtcoupe et de d6p0ts.
Cu Fe
pg/1 pg/1
605 <20 430 l3S 835 <20 600 <20 815 <20
mg mg
20,3 44,9 32,0 130 16,9 41,4 25,4 55,1 17,8 25,6
Ecart-type relatif sur les mesures: 2 %
C. BlAIN Responsable du laboratoire
C.R. N" 92-142
Mg
IJg/1
6620 6880 6720 6480 6560
mg
7,60 20,2 6,80 9,00 4,10

D.C.C. I D.P .E. S.P.E.A I S.A.l.S . Laboratoire d' Analyses Physico-Chimiques
F.A.R, le 18 deccmbre 1992
R.A. No 92-010
Analyse de poudres tamisees
Reference Cu%
lA 12,2 lW 11,0
2A 6,7 2W 9,8
3A 2,0 3W 5,2
4A 0,09 4W 0,17
SA 0,02 5W 0,02
OJivre non dosable dans les echantillons 6 et 7. Presence d'un residu insoluble (proportion >30 %) dans les echantillons 4 w, 5, 6 et 7.
C. BLAIN Responsable du Laboratoire
84

ANNEX 3
Aerosol size distribution


F1gure 1 0 • Aerosol size d1Str1but1on based on chemiCal analYSIS for Fe
2 dM/M.dlogO
Experiment n• 16 (copper underwater kerfing. e = 20 mm, hood running after cutting head. abr8Sive flow rate = 2.05 g/sl
DA.M.M.• 1.61 mic
E.T.~ 3.01
M.TOTALE = .007589 mg
ESSAI No 16
a IIIII .1
2 dM/M.dlogD
0
.1
10
Figure 11 • Aerosol size distribution based on chemical analySIS for Mg Expenment n• 11 (copper underwater kerfing, e = 20 mm)
0 tm1cl
M.TOTALE • .007303 mg
ESSAI No 11
10 D lmicl
87

2
i dM/M.dlogO
t
0
.1
F1gure 8 - Aerosol size d1Str1bution based on chemica_! analysis for Fe Experiment n• 14 (Copper underwater kerflng. e = 100 mml
M.TOTALE •
ESSAI No
10
.008537 mg
14
0 (micl
Figure 9 - Aerosol size d1str1bution based on chemical analysis for Fa Experiment n• 1 5 (Copper underwater kerfing. e = 20 mm. hood running after cutting headl
2 dM/M.dlogO
H.TOTALE • .01129 mg
ESSAI No 15
-r-
+
I ,...---
..---
,.--
f---
f--
0 h .1 10 0 fm1cl
88

0
2 ~
0
2
i t 1 I
.L I
-l-
i l t
.1
1 + + + t +
. 1
aM/M.dlogD
Figure 6- Aerosol size distribution based on chemical analysis for Fe Experiment n• 11 (copper underwater kerfang, e = 20 mm)
M.TOTAWE = .003612 mg
ESSAI No 11
n I I I I
I I ,-1
10 0 Cmicl
Figure 7 - Aerosol size distribution based on chemical analysis for Fe Expe11ment n• 13 (copper underwater kerfing, e -= 20 mm. independent hood at cutting head)
dM/M.dlogD
H. TOT ALE = .009385 mg
ESSAI No 13
10 0 fmicl
89

0
2
I ± + +
.1
.1
Figure 4 - Aerosol size distribution based on ehemocal analysis for Cu Experiment n• 15 1 copper underwater kcrfing. e = 20 mm, hood running after cutting headl
dM/M.dlogO
10
Figure 5 • AerOSol size distribution based on chemical analysis for Cu
OA.M.M.= 2.06 mic
E.T.= 3.068
M.TOTALE = .01134 mg
ESSAI No 15
0 Cm1cl
Experiment n• 16 !copper underwater kerfing, e = 20 mm. hood running after cutting head, abrasive flow rate = 2.05 g!sl
dM/M.dlogO
,--
-
·- ,.---
r---
90
r--
.l.
10
OA.M.M.= 1.72 IDlt
E.T.= 2.861
M.TOTALE = .02135 mg
ESSAI No 16
0 Cmitl

2 OM/M.OlogO
0
.1
2 dWH dlogO
0
.1
Figure 2 - Aerosol size dastributoon based on chemical analysis for Cu Experiment n• 13 (copper underwater kerfing. e = 20 mm. independent hood at cutting head)
M.TOTALE = .008521 mg
ESSAI No 13
10
Fogure 3- Aerosol size distribution based on chemical analysis for Cu Experiment n• 14 (copper underwater kerfing. e = 100 mml
M.TOTALE = .003242 mg
ESSAI No 14
-
1--- - -r--
~1 J. I I
10 0 fmicl
91

Figure 11 - Aerosol size distribution b:ssed on c:l'l.emic::Ll analysis for Ni. Experiment n• 8 {steel kerfing in air, e • 20 mm)
' f
I -1-l
+
I i 1 I
-1-
dH/r~. d 1 ogD
0 t---·-·-·
0
.1
I
+ + I
.1
dM/M.dlogO
n I --
r-~
l-:-:-1-7-.1. ·- -
~
I I I
i
OA.M.M.= 5.59 m1c
E.T.= 3.576
M.TOTALE = .4852 mg
ESSAI No 8
f.--- ···-·-----··-l i I I : I
I i
10 D fm1cl
Figure 1 - Aerosol SIZe disuibution based on chemical analysis for Cu Experiment n • 11 (copper underwater kerfong. e = 20 mml
M.TOTALE • .01677 mg
ESSAI No 11
r--f---
!
Q--, 10 0 lmcl
92

Figure 9 - Aerosol size distribution based on chemical analysis for Fe. Experiment n• 8 (steel kerfing in air, p • 20 mm)
2
I t
I
dM/M.dlogD
0 -F= .1
~
- -d
~
I
f-
-
10
OA.M.M.: 6.25 mlC
E.T.: 2.468
M.TOTALE = 14.04 mg
ESSAI No 8
I 1
0 Cm1cl
Figure 10 - Aerosol size distribution based on chemical analysis for Cr. Experiment n• 8 (steel kerfing in air, e • 20 mm)
0
I
+ + j_ I
J.. I
+ I
t I
+ I
...j... I
+ + I ..J..
i .l
dM/M.dlogD
:--
r--
r--
.I
93
1--
10
OA.M.M.= 7.16 mic
E.T.= 2.104
M.TOTALE = 1.057 mg
ESSAI No B
D Cmicl

2
Figure 7 - Aerosol size distribution based on ehemie"'l 3nalysis for Cu. Exl)eriment n• 2 (eonper cutting in air, e • 10 mm)
T .L
! + l .j_
~ +
I
+ I
+ ..i.. !
t l.
~
dM/M.dlogO
ll I
OA.M.M.= 4.93 mic
E.T.= 3.005
M.TOTALE = .308 mg
ESSAI No 2
+ l ~-- 1l --- --- --~ + i + I !
0 +:·~-~~-:-_-:-_-i--=="+=l+--1--4-fl+-lHI-----''---+-If--+-YI-+-Ij-f-lt+'----+--+-'-' +-1-t--H-t-f
.1 10 D lmicl
Figure 8 - Aerosol size distribution ba•ed on chemical analysis fa:: Fe. Experiment n• 3 (steel cutting in air, e • 10 an)
2 T di~/M.dlogD
n ' I I I I I I I I I
I I
r·-- i i
I' ! I
r--
r---
--~-·
.l
94
-, I
n i
1 10
DA.M.M.= 2.6 mic
E.T.= 3.214
M.TOTALE a .6401 mg
ESSAI No 3
l D fmicl

2
0
0
Figure 5 -Aerosol si:.e distribution in oass for experiment n• 9 (copper cutting in :tir, c • tO mm, abrasive flow r~te • 3.4 g/s)
T dM/M.dlogO DA.M.M.• 3.34
E.T.• 3.05
mic
! M.TOTALE • 6.96 mg
ESSAI No !J
1
n i "!
+ jl f + t ~
I I
r--
_r- I I I .1 1 10
Figure 6 - Aerosnl si:e distribution in oass for experiment n• 10 (copper cutting in air, e • 10 t~~D, abrasive flow rate • 1.8 g/s)
dM/M.dlogO
D lmicl
M.TOTALE = 7.48 mg
± I
. i
I ~-l I 1 i r-1
--~-~ --l I I
95
ESSAI No '10
--------, I
10 D (micl

0
2
Figure 3 - Aerosol size distribution in 1113SS for experiment n• 5 (copper kerfing in 'ir. e • 20 ..,)
dM/M.dlogD
n .
I I I
I
-
I . 1
-
1 I
I I
10
DA.M.M.a 6.31 mic
E.T.• 2.358
M.TOTALE • 33.87 mg
ESSAI No 5
D (micl
Figure 4 - Aerosol size distribution in mas for experiment n• 8 (steel kerfing in air, e • 20 am}
I dM/M.dlogD
r
I
I
n , I I I
! I I I
I ' I I
--n I I I I I
DA.M.M.• 6.25 mic
E.T.• 2.362
M. TOT ALE • 53.53 mg
ESSAI No B
--
.L l ,----
I I
.---- I
-.1 10 D lmicl
96

Figure 1 - Aerosol siz~ distribution in ruas~ fot experiment n• 2 (copper cutting in :1ir, P. • 10 mm)
2 dM/M dlogO DA M M • 4 02 mic .. E. T.• 2.866
H.TOTALE • 8.77 mg
ESSAI No 2..
r--
I--
n r---
I _r-
r l. .I 0
.1 10 0 lmicl
Fi~ure 2 - Aerosol size distribution in mass for experiment n• 3 (steel cutting in air~ e • 10 aaa)
2 ~
+ + + t
!
0
.1
d!oo!/H.dlogO
n
n I I :h
-----1 I I I l I
j
j
~
97
10
DA.H.M.• 3.99 mic
E.T.• 2.954
M.TOTALE • 6.51 mg
ESSAI No 3
-------, ! I
o lmicl
> ID "! 0 rn 0 .... rn ..... N ID
c. ..... rn rt "! ..... g rt ..... 0 ::s

Figure 12 - Aerosol size distribution based on chemical analysis for Cu. Experiment n• 10 (copper cutting in air, e • 10 mm, abrasive flow rate = 1.8 g/s)
2 dM/M dlogO
M.TOTALE = .1822 mg
ESSAI No 10
n I : I I
i I f--I
I !"""-"
I I
I I I I I ! I I I
I I ! i I I
0 1 ] J . 1 10 0 lmicl
98

ANNEX 4
Data of cyclone
99


ASPIRATEUR SOUS EAU UNDERWATER-VACUUMCLEANER UNTERWASSER-ABSAUGGERAT
Caracteristiques techniques Technical characteristics Technische Daten
Puissance Courant Debit Depression Dimensions de particules Densite de particules EHicacite du cyclone
Poids total
Power Current Flow Under pressure Part1cle sizes Dens1ty of particles Efficiency of cyclone
Total weight
Leis tung AnschluB Fordermenge Saugdruck Part1kel: GroBe
Dichte Absche1dungswirkungsgrad
Gesamtgewicht
:2 cv : 220 V ou 360 V alternatif - 50 periodes : 400 ltmin (7 m tuyau d"aspiration) : 0.5 kg/em' :40a5000C"m : 1.5 a 20 kp/cm3
: 95-98%
: 100 kg.
: 2 H. P. : 220 V or 380 V. 50 ph. : 400 Vmin (7 m suction hose) : 0.5 Kg/em' : 40 - 5000 C"' m : 1.5 - 20 gm/cm' : 95-98%
: approx. 100 kg.
: 2 PS : 220 V oder 380 v. 50 Hz : 400 1/min (7 m Ansaugleitung) : 0.5 kp/cm2
: 40 : 5000C" m : 1.5 : 20 kg/dm3
: 95-98%
: za. 100 kp
101
800 L/min.
i--------------- ---------; I I
I
I I I I I I I I
: e !~ I
A
I I
I I L-------------------------
Construction entierement en acier inoxydable All stainless steel structure Sliurebestiindige Stahlkonstruktion


1111111
II 1111111 CORDIS
The Communities research and development information service
CORDIS
A ·vital part of your programme's dissemination strategy
CORDIS is the information service set up under the VALUE programme to give quick and easy access to information on European Community research programmes. It is available free-of-charge online via the European Commission host organization (ECHO), and now also on a newly released CD-ROM.
CORDIS offers the European R&D community:
- a comprehensive up-to-date view of EC R&TD activities, through a set of databases and related services,
- quick and easy access to information on EC research programmes and results,
- a continuously evolving Commission service tailored to the needs of the research community and industry,
- full user support, including documentation, training and the CORDIS help desk.
The CORDIS Databases are:
R&TD-programmes- R&TD-projects- R&TD-partners- R&TD-results R& TO-publications - R& TD-comdocuments - R& TO-acronyms - R& TO-news
Make sure your programme gains the maximum benefit from CORDIS
- Inform the CORDIS unit of your programme initiatives,
- contribute information regularly to CORDIS databases such as R&TD-news, R&TD-publications and R& TO-programmes,
- use CORDIS databases, such as R&TD-partners, in the implementation of your programme,
- consult CORDIS for up-to-date information on other_ programmes relevant to your activities,
- inform your programme participants about CORDIS and the importance of their contribution to the service as well as the benefits which they will derive from it,
- contribute to the evolution of CORDIS by sending your comments on the service to the CORDIS Unit.
For more information about contributing to CORDIS, contact the DG XIII CORDIS Unit
Brussels Ms I. Vounakis
Tel. +(32) 2 299 0464 Fax +(32) 2 299 0467
Luxembourg M. B. Niessen
Tel. +(352) 4301 33638 Fax +(352) 4301 34989
To register for online access to CORDIS, contact:
ECHO Customer Service BP 2373
L -1 023 Luxembourg Tel. +(352) 3498 1240 Fax +(352) 3498 1248
If you are already an ECHO user, please mention your customer number.


European Commission
EUR 15241 - Abrasive water-jet cutting technique from the laboratory stage into real application
G. Meier, H. Louis, G. Pilot
Luxembourg: Office for Official Publications of the European Communities
1995 -IV, 101 pp., num. tab., fig.- 21.0 x 29.7 em
Nuclear science and technology series
ISBN 92-827-0222-7
Price (excluding VAT) in Luxembourg: ECU 11.50
The objective of the project was to adapt and qualify the commercial abrasive water-jet cutting technique for application in nuclear decommissioning.
The cutting has to be remote controlled. Therefore, methods are required to control the state of the wear of the cutting tool as well as the cutting result.
Experiments have shown that sound analysis is not a sufficient method to check the cutting result (cutting through or kerfing only). But in the case of kerfing the reflected jet can be detected by a deflector plate and an adapted accelerometer. Abrasive water-jet cutting produces a small amount of aerosols, especially when cutting under water.
It was shown that using optimized cutting parameters to minimize the consumption of water and abrasives and separating the waste from the water by using a cyclone can considerably reduce the secondary waste generation. More investigation should be done to recycle the separated abrasives. First tests indicate that a recycling of 80 to 90% of the abrasives may be attainable.


Venta • Salg • Verkauf • nwAI'jattc; • Sales • Vente • Vendita • Verkoop • Venda • Myynti • Forsaljning
BELGIQUE I BELGIE IRELAND NORGE ISRAEL
Moniteur beige/ Government Supplies Agency Narvesen Info Center Belgisch Staatsblad 4-5 Harcourt Road Bertrand Narvesens vei 2
ROY International
Rue de Louvain 42/Leuvenseweg 42 Dublin 2 Postboks 6125 Etterstad 31, Habarzel Street B-1 000 Bruxelles/B-1 000 Brussel Tel. (1) 6613111 N-0602 Oslo 6 69710 Tel Aviv Tel. (02) 512 oo 26 Fax (1) 47 80 645 Tel. (22) 57 33 00 Tel. (3) 49 78 02 Fax (02) 511 01 84 Fax (22) 68 19 01 Fax (3) 49 78 12
IT ALIA Jean De Lannoy SCHWEIZ/SUISSE/SVIZZERA Licosa SpA Avenue du Roi 202/Koningslaan 202 EGYPT/ B-1 060 Bruxelles/B-1 060 Brussel Via Duca di Calabria 1/1 OSEC MIDDLE EAST Tel. (02) 538 51 69 Casella postale 552 Stampfenbachstrafle 85 Fax (02) 538 08 41 1-50125 Firenze CH-8035 Zurich Middle East Observer
Tel. (055) 64 54 15 Tel. (01) 365 54 49 Autres distributeurs/ Fax 64 12 57 Fax (01) 365 54 11 41 Sherif Sl.
Overige verkooppunten: Telex 570466 LICOSA I Cairo
BALGARIJA Tel/Fax (2) 393 97 32
Librairie europeenne/ GRAND-DUCHE DE LUXEMBOURG Europese boekhandel Europress Klassica BK Ltd Rue de Ia Loi 244/Wetstraat 244 Messageries du livre
66, bd Vitosha UNITED STATES OF AMERICN
B-1 040 Bruxelles/B-1 040 Brussel 5, rue Railleisen 1463 Sofia CANADA
Tel. (02) 231 o4 35 L-2411 Luxembourg Tei./Fax (2) 52 74 75 Fax (02) 735 08 60 Tel. 40 10 20 UN I PUB
Fax 49 06 61 CESKA REPUBLIKA Document delivery: 4611-F Assembly Drive
NEDERLAND NIS CR Lanham, MD 20706-4391
Credoc Tel. Toll Free (800) 274 48 88
Rue de Ia Montagne 34/Bergstraat 34 SOU Servicecentrum Uitgeverijen Havelkova 22 Fax (301) 459 00 56 130 00 Praha 3
Boite 11/Bus 11 Postbus 20014 T ei./Fax (2) 24 22 94 33 B-1 000 Bruxelles/B-1 000 Brussel 2500 EA 's-Gravenhage Tel. (02) 511 69 41 Tel. (070) 37 89 880 CANADA
Fax (02) 513 31 95 Fax (070) 37 89 783 HRVATSKA (CROATIE)
Mediatrade Subscriptions only
DAN MARK OSTERREICH P. Hatza 1
Uniquement abonnements
J. H. Schultz Information NS Manz'sche Verlags- 4100 Zagreb Renouf Publishing Co. Ltd und Universitiitsbuchhandlung Tel. (041) 43 03 92
Herstedvang 1 0-12 Kohlmarkt 16 Fax (041) 45 45 22 1294 Algoma Road · DK-2620 Albertslund A-1014 Wien
Ottawa, Ontario K1 B 3W8 Til. 43 63 23 00 Tel. (1) 531 610 MAGYARORSZAG
Tel. (613) 741 43 33 Fax (Sales) 43 63 19 69 Telex 112 500 BOX A
Fax (613) 741 54 39 Fax (Management) 43 63 19 49 Fax (1) 531 61-181 Euro-lnfo-Service
Honved Europa Haz AUSTRALIA
DEUTSCHLAND Document delivery: Margitsziget H-1138 Budapest
Bundesanzeiger Verlag Wirtschaflskammer TeL/Fax (1) 1116061, (1) 1116216 Hunter Publications Wiedner Hauptstrafle
Breite Strafle 78-80 A-1045Wien 58A Gipps Street Postfach 1 0 05 34 Tel. (0222) 50105-4356 POLSKA Collingwood D-50445 Koln Fax (0222) 50206-297 Business Foundation
Victoria 3066 Tel. (02 21) 20 29-0 Tel. (3) 417 53 61 Fax (02 21) 2 02 92 78 ul. Krucza 38/42 Fax (3) 419 71 54
PORTUGAL 00-512 Warszawa
lmprensa Nacional Tel. (2) 621 99 93, 628 28 82 GREECE/Ell/lAllA International Fax& Phone (0-39) 12 00 77 JAPAN Casa da Moeda, EP G.C. Eleftheroudakis SA Rua D. Francisco Manuel de Melo, 5
ROMANIA International Bookstore P-1 092 Lisboa Codex Procurement Services Int. (PSI-Japan)
Nikis Street 4 Tel. (01) 387 30 02/385 83 25 Euromedia Koru Dome Postal Code 1 02 GR-1 0563 Athens Fax (01) 384 01 32
65, Strada Dionisie Lupu Tokyo Kojimachi Post Office Tel. (01) 322 63 23 Distribuidora de Livros R0-70184 Bucuresti Tel. (03) 32 34 69 21 Telex 219410 ELEF Bertrand, Ld." TeL/Fax 1-31 29 646 Fax (03) 32 34 69 15 Fax 323 98 21
Grupo Bertrand, SA RUSSIA Sub-agent
ESPANA Rua das Terras dos Vales, 4-A Apartado 37 CCEC Kinokuniya Company Ltd
Boletin Oficial del Estado P-2700 Amadora Codex 9,60-letiya Oktyabrya Avenue Journal Department
Trafalgar, 27-29 Tel. (01) 49 59 050 117312 Moscow PO Box 55 Chitose Telex 15798 BERDIS T ei./Fax (095) 135 52 27 E-28071 Madrid Fax 49 60 255 Tokyo 156
Tel. (91) 538 22 95 Tel. (03) 34 39-0124 Fax (91) 538 23 49
SUOMI/FINLAND SLOVAKIA
Mundi-Prensa Libros, SA Akateeminen Kirjakauppa Slovak Technical SOUTH-EAST ASIA Castello, 37 Keskuskatu 1
library E-28001 Madrid PO Box 218 Nam. slobody 19 Legal Library Services Ltd Tel. (91) 431 33 99 (Libros) FIN-00381 Helsinki 812 23 Bratislava 1
431 32 22 (Suscripciones) Tel. (0) 121 41 Tel. (7) 52 204 52 Orchard 435 36 37 (Direcci6n) Fax (0) 121 44 41 Fax : (7) 52 957 85 PO Box 0523
Telex 49370-MPLI-E Singapore 9123 Fax (91) 575 39 98 CYPRUS Tel. 243 24 98
SVERIGE Fax 243 24 79 Sucursal: BTJAB Cyprus Chamber of Commerce
and Industry Libreria lnternacional AEDOS Traktorvagen 13
Chamber Building SOUTH AFRICA S-22100 Lund Consejo de Ciento, 391 Tel. (046) 18 00 00 38 Grivas Dhigenis Ave E-08009 Barcelona Fax (046) 18 01 25 3 Deligiorgis Street Sa flo Tel. (93) 488 34 92 30 79 47 PO Box 1455 Fax (93) 487 76 59 Nicosia 5th Floor, Export House
Tel. (2) 44 95 00, 46 23 12 Cnr Maude & West Streets Libreria de Ia Generalitat UNITED KINGDOM Fax (2) 45 86 30 Sandton 2146 de Catalunya
HMSO Books (Agency section) Tel. (011) 883-3737
Rambla dels Estudis, 118 (Palau Moja) Fax (011) 883-6569 E-08002 Barcelona HMSO Publications Centre MALTA
Tel. (93) 302 68 35 51 Nine Elms Lane Miller Distributors Ltd London SWB 5DR Tel (93) 302 64 62 Tel. (0171) 873 9090 POBox25 ANDERE lANDER Fax (93) 302 12 99 Fax (0171) 873 8463 Malta International Airvort LOA 05 Ma~a OTHER COUNTRIES Telex 29 71 138 Tel. 66 44 88 AUTRES PAYS
FRANCE Fax 67 67 99
ICELAND Office des publications officielles Journal officiel T0RKIYE Service des publications BOKABUD des Communautes europeennes des Communautes europeennes LARUSAR BLONDAL Pres AS 2, rue Mercier 26, rue Desaix Sk61av6rdustig, 2 lstiklal Caddesi 469 L-2985 Luxembourg F-75727 Paris Cedex 15 IS-101 Reykjavik 80050 Tiinel-lstanbul TeL 29 29-1 Tel. (1) 40 58 77 o1131 Tel 115650 Tel. (1) 520 92 96, 528 55 66 Telex PUBOF LU 1324 b Fax (1) 40 58 77 00 Fax 12 55 60 Fax (1) 520 64 57 Fax 48 85 73, 48 68 17
4/9!

111111111111111111111111 9 789282 702222 >