European Capital of Culture 2008 Socio-Economic Impact...
82
ERM Economics Suite 8.01, 8 Exchange Quay, Manchester, M5 3EJ Telephone 0161 958 8800 Facsimile 0161 958 8888 Email [email protected] http://www.erm.com FINAL REPORT Liverpool City Council European Capital of Culture 2008 Socio-Economic Impact Assessment of Liverpool's Bid May 2003
Transcript of European Capital of Culture 2008 Socio-Economic Impact...
ERM EconomicsSuite 8.01, 8 Exchange Quay,
Manchester, M5 3EJTelephone 0161 958 8800Facsimile 0161 958 8888Email [email protected]://www.erm.com
FINAL REPORT
Liverpool City Council
European Capital of Culture 2008
Socio-Economic Impact Assessment of Liverpool's Bid
May 2003

FINAL REPORT
Liverpool City Council
European Capital of Culture 2008
Socio-Economic Impact Assessment of Liverpool's Bid
May 2003
Reference 0001778
Prepared by: Kram Sadiq, Howard Walker, Steve Hutton, Hannah Artis
For and on behalf of ERM Economics
Approved by: Kram Sadiq
Signed: ______________________________
Position: Technical Director
Date: 14th May 2003
This report has been prepared by ERM Economics, a trading name of Environmental Resources Management Limited, with all reasonable skill, care and diligence within the terms of the Contract with the client, incorporating our General Terms and Conditions of Business and taking account of the resources devoted to it by agreement with the client.
We disclaim any responsibility to the client and others in respect of any matters outside the scope of the above.
This report is confidential to the client and we accept no responsibility of whatsoever nature to third parties to whom this report, or any part thereof, is made known. Any such party relies on the report at their own risk.
CONTENTS
1 INTRODUCTION 1
1.1 TERMS OF REFERENCE 11.2 CITIES, CULTURE AND COMPETITIVENESS 11.3 STUDY APPROACH 31.4 REPORT STRUCTURE 4
2 LIVERPOOL’S CAPITAL OF CULTURE PROGRAMME 5
2.1 CAPITAL OF CULTURE OBJECTIVES 52.2 PROGRAMMING OF EVENTS 52.3 ORGANISATION AND RESOURCES 82.4 SOCIAL INCLUSION STRATEGY 92.5 TARGETS AND OUTCOMES 112.6 CONCLUSIONS 13
3 CULTURAL INDUSTRIES 14
3.1 INTRODUCTION 143.2 ECONOMIC TRENDS 143.3 CULTURAL INDUSTRIES 163.4 CULTURAL INFRASTRUCTURE INVESTMENT 203.5 CONCLUSIONS 25
4 SOCIO-ECONOMIC IMPACTS 26
4.1 INTRODUCTION 264.2 CULTURAL INDUSTRIES 274.3 CREATIVE INDUSTRIES 354.4 PARTICIPATION 374.5 CONCLUSIONS 40
5 EVALAUTION STRATEGY 42
5.1 INTRODUCTION 425.2 FRAMEWORK PRINCIPLES 425.3 EXISTING DATA SOURCES 435.4 METHODOLOGIES 455.5 RECOMMENDED EVALUATION STRATEGY 47
6 CONCLUSIONS 56
6.1 LIVERPOOL’S CAPITAL OF CULTURE PROGRAMME 566.2 BASELINE CONTEXT 566.3 CITY WIDE INVESTMENT STRATEGY 576.4 SOCIO-ECONOMIC IMPACT 576.5 MONITORING AND EVALUATION STRATEGY 58

ERM E CONOMICS FINAL REPORT LIVERPOOL CITY COUNCIL
1
1 INTRODUCTION
1.1 TERMS OF REFERENCE
ERM Economics was commissioned by Liverpool City Council in February 2003 to undertake a socio-economic impact assessment of the European Capital of Culture bid. The terms of reference requested the commission to:
• Establish baselines, indicators and measurement tools for a full scale economic and social impact monitoring programme; and
• Articulate and quantify how the bid submission and programme of events and activities anticipated will contribute to:
• Increased competitiveness and sustainable economic growth;• Social and cultural benefits and increased community cohesion; and• Growth of the creative industries sector.
The primary focus of the commission was on assessing the economic impact that a successful Capital of Culture award could make to the City, Merseyside and the North West region and to outline a monitoring and evaluation framework to assess the socio-economic impacts over time.
1.2 CITIES, CULTURE AND COMPETITIVENESS
There is a developing momentum of research over the relationship between the role of cities, their cultural assets and the prosperity of regions and ultimately, nation states. In the UK the Urban Renaissance agenda as set out in the Urban White Paper, and the development of programmes such as theCore Cities, reflect the new importance attached to our cities. The European Capital of Culture award in many ways brings this together and focuses one on the relationship between culture in its widest sense and successful cities.
Studies point to a strong correlation between good design, quality public realm, investment in iconic buildings, positive image promotion, commerciality mixed with art and heritage and the increasing competitiveness of cities in Europe and beyond(1). Cities that invest in these well and over a sustained period are moving up the league tables for inward investment and business growth. Those that are not are falling behind. In particular a successful city can be seen as:
• A cultural icon and artefact: Successful cities have an unmistakable brand which they have created by understanding and mobilising their unique set of cultural resources and symbolic assets.
(1) Releasing the Potential of Our Core Cities, Comedia, April 2002
ERM E CONOMICS FINAL REPORT LIVERPOOL CITY COUNCIL
2
• A Place of creativity and innovation: The fuel which powers successful cities is talent, and talent is both derived from and drawn to places in which there is a rich environment of cultural creativity and innovation.
• Providing culture as central to quality of life: The range of activities and experiences which raise life above the mundane, which allow self-expression and which help to define and bind a communal identification.
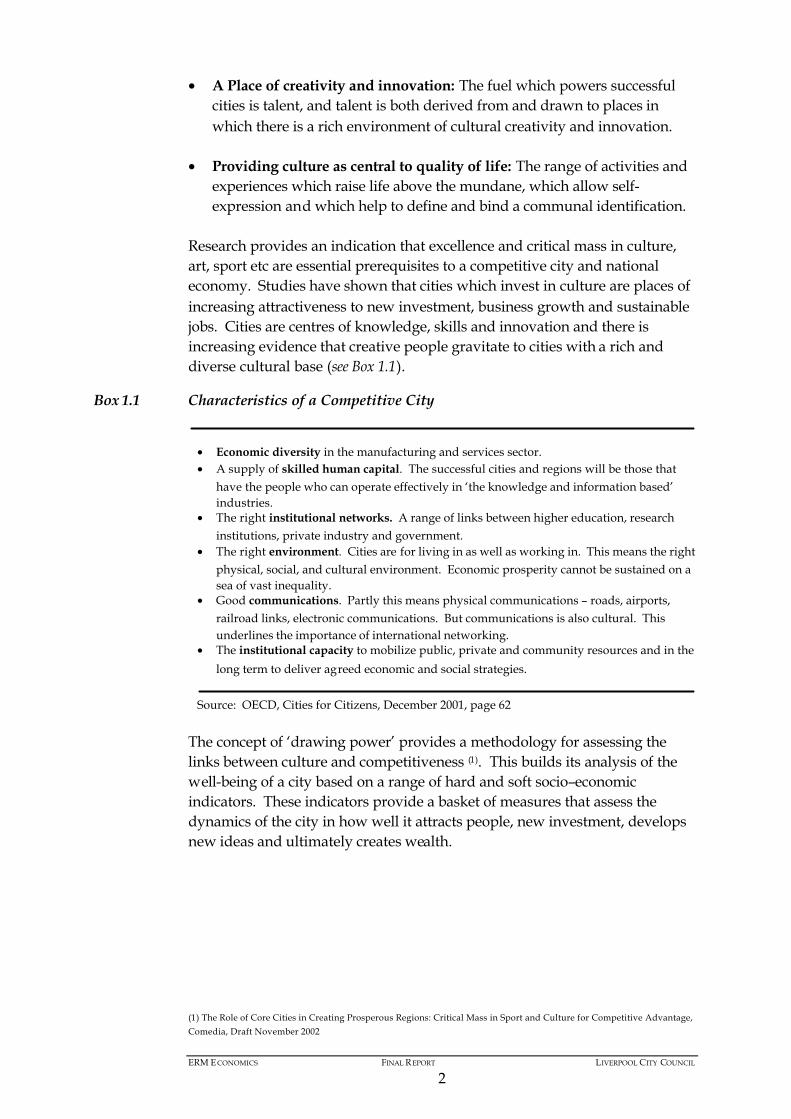
Research provides an indication that excellence and critical mass in culture, art, sport etc are essential prerequisites to a competitive city and national economy. Studies have shown that cities which invest in culture are places of increasing attractiveness to new investment, business growth and sustainable jobs. Cities are centres of knowledge, skills and innovation and there is increasing evidence that creative people gravitate to cities with a rich and diverse cultural base (see Box 1.1).
Box 1.1 Characteristics of a Competitive City
Source: OECD, Cities for Citizens, December 2001, page 62
The concept of ‘drawing power’ provides a methodology for assessing the links between culture and competitiveness (1). This builds its analysis of the well-being of a city based on a range of hard and soft socio–economicindicators. These indicators provide a basket of measures that assess the dynamics of the city in how well it attracts people, new investment, develops new ideas and ultimately creates wealth.
(1) The Role of Core Cities in Creating Prosperous Regions: Critical Mass in Sport and Culture for Competitive Advantage, Comedia, Draft November 2002
• Economic diversity in the manufacturing and services sector.• A supply of skilled human capital. The successful cities and regions will be those that
have the people who can operate effectively in ‘the knowledge and information based’ industries.
• The right institutional networks. A range of links between higher education, research institutions, private industry and government.
• The right environment. Cities are for living in as well as working in. This means the right physical, social, and cultural environment. Economic prosperity cannot be sustained on a sea of vast inequality.
• Good communications. Partly this means physical communications – roads, airports,railroad links, electronic communications. But communications is also cultural. This underlines the importance of international networking.
• The institutional capacity to mobilize public, private and community resources and in the long term to deliver agreed economic and social strategies.

ERM ECONOMICS DRAFT REPORT LIVERPOOL CITY COUNCIL
3
Box 1.2 Cities, New Ideas and Creativity
Source: ‘Building the Region’s Knowledge Economy.’ Centre for Urban and Regional Development Studies. University of Newcastle, May 2001 The conclusion is that cultural investment is not separate or a poor relation to other investments eg transport, public realm or business promotion, but an integral part of a bigger package to enhance economic growth (see Box 1.2). Liverpool has an aim to be recognised the world over as a “city of creativity” and to reap the social and competitive advantages that such recognition will bring. The 2008 bid process itself has provided the opportunity for the City to radically revise and re-examine the way in which culture can be made central to the whole regeneration process and how the inherent creativity of the people of the City can be best harnessed to produce future success(1).
1.3 STUDY APPROACH
Our approach has drawn on methods that have been used to assess the potential impact of major events, such as the Capital of Culture, which are difficult to assess because of their diversity and the fact that the event is some years away. Liverpool has adopted a regeneration strategy that places the cultural industries, the development of its cultural infrastructure and the delivery of the culture strategy at the centre. Therefore, the growth of the cultural industries sector is a key indicator of the success of its regeneration programme. Our study is focused on estimating the potential socio-economic impacts of the expansion of the cultural industries in Liverpool as a result of three effects; trend based growth in the sector, the impact of planned investments in the sector and the impact and contribution of a successful European Capital of Culture award.
(1) Liverpool City Council's DCMS Bid Submission Supplementary Questions 31 March 2003
“The importance of the cosmopolitan city to its region is significant. Such cities are invariably the focus of migrants and the input of new ideas flowing from this tends to make them more creative than their hinterlands. In a region with a cosmopolitan city its effects as an economic motor and centre of innovation will be profound – both in terms of the generation of business and knowledge which can overspill into surrounding towns, but in its effect on the image of the region and the ability of the wider region to attract and successfully absorb mobile investment and skilled labour. The cosmopolitan city, then, attracts knowledge intensive activity, skilled labour, international tourists and business elites, all of which in turn introduce new ideas and creativity and generate a demand for quality and high value added goods and services, which in turn creates a more attractive environment capable of attracting more activity. Such a virtuous cycle of growth creates conditions in which the local population of a city and the wider region can benefit.”
ERM E CONOMICS FINAL REPORT LIVERPOOL CITY COUNCIL
4
We separate out the potential contribution of a successful Capital of Culture bid to show how such an award contributes to the overall thrust of the City’s cultural regeneration strategy. This contribution comes through a number of means, but the most measurable relate to the increase in tourism growth during 2008 and the legacy effect, and the increase in participation in cultural activity that the Capital of Culture strategy could generate. These combined effects effectively increase the utilisation of the City’s cultural assets with a range of associated benefits – in terms of jobs, income, community participation, a more dynamic industrial structure and raised image of the City in Europe.
1.4 REPORT STRUCTURE
This report is structured as follows:
Section 2: sets out Liverpool’s capital of culture programme;
Section 3: examines the socio-economic context and the role of the cultural industry sector within the overall economy of Liverpool;
Section 4: presents the findings of the socio-economic impact analysis;
Section 5: outlines the monitoring and evaluation plan; and
Section 6: contains our conclusions on the potential impact of the Capital of Culture bid.
Annexes:
Annex A: Cultural and Creative Industries
Annex B: Socio-Economic Data
Annex C: Bibliography

ERM E CONOMICS FINAL REPORT LIVERPOOL CITY COUNCIL
5
2 LIVERPOOL’S CAPITAL OF CULTURE PROGRAMME
2.1 CAPITAL OF CULTURE OBJECTIVES
Liverpool’s European Capital of Culture programme is built on its history as a city with world links through trade and transportation. Liverpool’s central theme for 2008 is The World in One City. The outcomes that the City wishes to achieve through a successful Capital of Culture Bid are seen as threefold:
• Sustainable Cultural Infrastructure: To increase and enhance the culturalinfrastructure, encouraging new products, processes and enterprises in the cultural and creative industries sector;
• An Inclusive and Dynamic Community: To increase local participation in cultural activities and increase community cohesiveness; and
• A Premier European City: To improve the range and quality of the City’s infrastructure with City centre and community renewal.
The central theme The World in One City is underpinned by three sub-themesCreate, Participate and Regenerate, which will ensure that all involved in the year will have clear objectives and legacy from the year, illustrating the City’s history, dynamic present, and challenging vision for the future. Figure 2.1provides an overview of the programme and the way in which each element supports the overall aims of the bid.
The 2008 bid is viewed by the City Council and its partners as integral to the overall vision of Liverpool as a City. The vision is ‘For Liverpool City to become a premier European City. Achieved by build ing a more competitive economy, developing healthier, safer, and more inclusive communities and enhancing individual life chances’.
2.2 PROGRAMMING OF EVENTS
The ‘World in One City’ programme starts in 2003 with a `time-line` of themed years which aim to strengthen Liverpool’s ability to stage the Capital of Culture Year. The bid strategy recognises the importance of building up to the main event of 2008. In 2007 the City celebrates its 800th Anniversary since gaining its Royal Charter and the main programme of events planned for 2008 is the start of a process that will take the City forward with an increased level of confidence.

Renewal in local neighbourhoods
Celebrates Diversity. 800 Years of Culture.
A new urban experience
New products, innovations and businesses
New international links and
partnerships
A good place to live, work and
visit
Community involvement in corridor
improvements
Continued improvements to the
city centre offer
Travel, accommodation and service culture
Secure & enhance the cultural infrastructure
A city made whole through
cultural expression
A new expression of 21st Century
British Culture
A culture defined through participation
Inclusion
Diversity
Accessibility
Excellence
PARTICIPATE Include & Engage
CREATE Innovate & Sustain
REGENERATE Improve & Review
An Inclusive & Dynamic
Community
A Premier European City
A Sustainable Cultural Infrastructure
The World in One City
Figure 2.1 World in One City

ERM ECONOMICS FINAL REPORT LIVERPOOL CITY COUNCIL
7
Moreover, for the City it is vital that the legacy impacts are maximised. In order to achieve this after 2008 the City will run with themed years that look to the future. The year themes are:
2003: Celebrating Learning; 2004: Faiths and Community Service; 2005: Celebrating the Arts; 2006: Year of Sport; 2007: Celebrating Heritage; 2008: The World In One City; 2009: Celebrating the Environment; and 2010: Celebrating Innovation.
2.3 ORGANISATION AND RESOURCES
The delivery of the Bid programme will be through the Liverpool Culture Company (‘Culture Co’). See Figure 2.2.
Figure 2.2 The Liverpool Culture Company’s Organisational Structure
Source: Liverpool City Council
The key element of the new structure will be the appointment of a “Creative Director”, who will act as the Assistant Chief Executive of the Liverpool Culture Company and will also have a critical role as an advisor to the City Council. Working closely with the Council’s Chief Executive, the Creative Director will advise the Council’s Senior Management Team on how to
ERM E CONOMICS FINAL REPORT LIVERPOOL CITY COUNCIL
8
develop the creativity agenda within each Service Portfolio. This aims to ensure creativity will become a key crosscutting strand linking mainstream service delivery in the common purpose of making residents and visitors alike recognise Liverpool as an exceptional city in regional, national, European and international terms. This approach will provide added value in areas of city management while at the same time providing integration in policy and action-planning terms. Another key role for the Creative Director will be the development and delivery of events programming.
In support of the Liverpool Culture Company are the following groups:
• The Stakeholders' Group. This is a group of 100 individuals who both represent a wide range of organisations associated with the Bid and/or have a contribution to make to the culturally-driven renaissance of Liverpool;
• The Cultural Diversity Group. The cultural map of Liverpool is grounded in the experiences of traditionally under-represented groups and individuals. This Cultural Diversity Group ensured Liverpool's diverse communities were given a strong voice in the bid planning stages;
• The Regeneration Stakeholders' Group. The bid process has brought together key members of the significant number of Liverpool organisations concerned in regeneration, and
• A Communications Team and a Communications Advisory Group havemanaged the marketing of the bid. It is drawn from the radio, television, press and PR community, in the city and the wider region.
The revenue budget allocated to the Liverpool Culture Company is £54.7m to cover the core areas of administration, programming and marketing. The marketing budget will be approximately £4.3m over the period to 2008.
2.4 SOCIAL INCLUSION STRATEGY
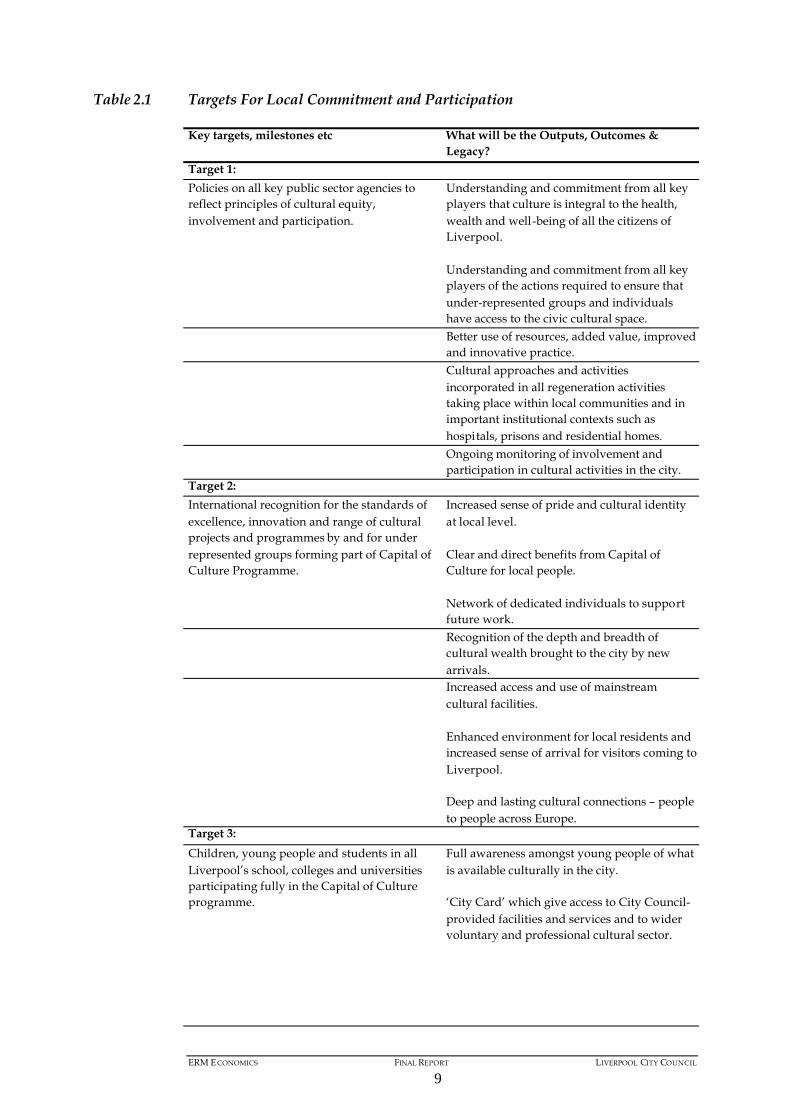
Central to the 2008 programme strategy is the increased participation of local residents cultural activities as users of cultural industry services and benefiting from employment in the sector (from leisure services to the creative industries). These principles are reflected in the bid programme through six targets related to participation and increasing participation of under -represented groups. Table 2.1 details the targets and the expected outcomes.
ERM E CONOMICS FINAL REPORT LIVERPOOL CITY COUNCIL
9
Table 2.1 Targets For Local Commitment and Participation
Key targets, milestones etc What will be the Outputs, Outcomes & Legacy?
Target 1:Policies on all key public sector agencies to reflect principles of cultural equity, involvement and participation.
Understanding and commitment from all key players that culture is integral to the health, wealth and well-being of all the citizens of Liverpool.
Understanding and commitment from all key players of the actions required to ensure that under-represented groups and individuals have access to the civic cultural space.Better use of resources, added value, improved and innovative practice.Cultural approaches and activities incorporated in all regeneration activities taking place within local communities and in important institutional contexts such as hospitals, prisons and residential homes.Ongoing monitoring of involvement and participation in cultural activities in the city.
Target 2:International recognition for the standards of excellence, innovation and range of cultural projects and programmes by and for under represented groups forming part of Capital of Culture Programme.
Increased sense of pride and cultural identity at local level.
Clear and direct benefits from Capital of Culture for local people.
Network of dedicated individuals to supportfuture work.Recognition of the depth and breadth of cultural wealth brought to the city by new arrivals.Increased access and use of mainstream cultural facilities.
Enhanced environment for local residents and increased sense of arrival for visitors coming to Liverpool.
Deep and lasting cultural connections – people to people across Europe.
Target 3:Children, young people and students in all Liverpool’s school, colleges and universities participating fully in the Capital of Culture programme.
Full awareness amongst young people of what is available culturally in the city.
‘City Card’ which give access to City Council-provided facilities and services and to wider voluntary and professional cultural sector.

ERM E CONOMICS FINAL REPORT LIVERPOOL CITY COUNCIL
10
Key targets, milestones etc What will be the Outputs, Outcomes & Legacy?
Target 4:An employment strategy delivering a range of work and training opportunities for local people.
A highly professional cultural and creative industries workforce, capable of leading regional and national as well as city developments.
Target 5:Systematic action to remove barriers to involvement and participation (eg improving disabled access and lowering financial constraints).
Raised levels of mental and physical well-being.
More engaged citizens.Target 6:Formal and informal consultations with stakeholders on Capital of Culture programme and City Cultural Strategy.
A city where the stakeholders have a proper sense of ownership and involvement in its ongoing Cultural Strategies.
Source: Liverpool Capital of Culture
2.5 TARGETS AND OUTCOMES
The bid programme contains 12 overall targets linked to the potential outcomes with a selection based on local, regional, national, European and Worldwide objectives.
Table 2.2 Targets and Outcomes
LOCAL Objectives Targets Outcomes
1. A stakeholding residential base that is proud of its city and committed to the project.
1.1 25 000 ‘champions’ by 2007
A society of stakeholders
2. A culturally aware and active community.
2.1 ‘Cluster’ areas linked together through cultural programmes and events.
2.2 75% of the residential population involved in some cultural activity and attendance figures rise to over 100 on national index.
2.3 One unique, world-classcultural event/year 2005 – 7; 4 in 2008.
More residents involved in all aspects of the cultural life of the city – sense of pride, ownership, personal fulfilment.
Improved attendances at performances, events and exhibitions generating sustainability.
Credibility of City’s cultural claim.
3. Reinforce image as a visitor friendly city
3.1 1000 cabbies trained;
3.2 3000 frontliners trained.
Sustainability of improvement to tourism.

ERM E CONOMICS FINAL REPORT LIVERPOOL CITY COUNCIL
11
REGIONAL Objectives
4. Consolidating Liverpool’s regional role for business and tourism.
4.1 Liverpool as a key destination in the North West for cultural, creative and tourism businesses.
A strong regional position.
Higher levels of inward investment.
5. Enhancing regional partnerships and campaigns.
5. 1A dynamic and fruitful relationship with all marketing partners across the North West.
Best value and maximum impact.
6. Increasing visitor number from rest of region.
6. 1 An increase of 30% above benchmark by 2008.
Significant increase in visitors from the region.
NATIONAL Objectives
7. Re-positioning the city’s national image – to be in top 10 in UK image league.
7. 1 An increase in the propensity to visit Liverpool.
Significant increase in visitor enquiries against benchmark.
8. Increasing numbers and length of stay of visitors from UK – leisure and conference.
8.1 Anticipated 10% growth year on year until 2005 and accelerating to an average of 15% growth until 2010
Significant increase in visitor numbers and length of stay.
EUROPEAN Objectives
9. Reposition with cultural image focusing on strengths, especially in visual arts and popular culture.
9.1 An increase in the propensity to visit Liverpool.
Significant increase in visitor enquiries against benchmark.
10. Increasing numbers andlength of stay of visitors from Europe.
10.1 Anticipated 6 – 7%growth year on year
(3 – 4% above standard).
Significant increase in visitor numbers and lengths of stay.
WORLDWIDE Objectives
11. Building on cultural reputation to promote Liverpool as a world city.
11.1 An increase in the propensity to visit Liverpool.
Significant increase in visitor enquiries against benchmark.
12. Establish as premier ‘must do’ destination on UK itinerary – increasing numbers and length of stay visitors from the rest of the world – particular focus on USA and Japan.
12.1 Increase proportion of overseas visitors to 40% (2000 base = 24%)
Significant increase in visitor numbers and lengths of stay.
Source: Liverpool City Council
The outcomes are to be achieved through the synergy of existing city-wideinvestment programmes and activities with the potential impact that Capital of Culture could realise in the run up to 2008, the year itself and through the legacy effect.
ERM E CONOMICS FINAL REPORT LIVERPOOL CITY COUNCIL
12
2.6 CONCLUSIONS
The Liverpool European Capital of Culture bid is based around a set of themed years that cover the wide spectrum of activity that forms modern culture. These themed years run to 2008 and beyond, reflecting the City’s approach which places emphasis on not just 2008, but the build up and the legacy impact. The programme is supported by 12 targets which identify the areas which the bid programme seeks to influence at the local, regional, national and world level. These targets will form the basis of the monitoring programme.
ERM E CONOMICS FINAL REPORT LIVERPOOL CITY COUNCIL
13
3 CULTURAL INDUSTRIES
3.1 INTRODUCTION
In this section we provide a baseline of the role of the cultural industries in Liverpool. This covers employment and growth of the sector, as well as participation by residents in the services provided by cultural industries.Firstly we recap on recent socio-economic trends in Merseyside and the City.
3.2 ECONOMIC TRENDS
3.2.1 Recent Growth
The Merseyside economy over the late 1990s is a tale of slower than regional and national growth in gross value added (GVA) and faster growth in employment(1). The slower growth in value added is as a result of industry structure and growth biased to lower value added (and therefore lower average wage) sectors. It is interesting to note that if Halton district – heavily affected by the restructuring of the Chemicals sector - is excluded from the analysis then GVA growth over the period 1995 to 2001 was positive at 1 per cent and slightly above the region. Growth in value added has been led by Knowsley (1.8 per cent) and Liverpool (1.0 per cent).
Employment growth was greatest in Knowsley (12.9 per cent), St Helens (7.7 per cent) and Liverpool (2.3 per cent). A third of employment in the conurbation is located in Liverpool. Employment growth has been driven by the health sector, communications, financial and business services, and cultural and leisure services.
The Merseyside Economic Review 2002 points to other key trends including:
• Faster growth in R&D expenditure: since 1995 Merseyside has seen R&D spending grow almost three times as fast as the rest of the UK;
• Increased income: the earning gap between Merseyside and the North West has closed over the period 1999 – 2001;
• Falling unemployment: reflecting the growth in employment, there has been a sharp fall in unemployment between 1999 and 2001 (from 11. 2 per cent to 5.7 per cent);
• Unemployment falling in deprived areas: the fall in unemployment has been felt in the more deprived areas of the conurbation;
(1) Merseyside Economic Review 2002
ERM E CONOMICS FINAL REPORT LIVERPOOL CITY COUNCIL
14
• Increase in Skills and Qualifications: the change in the skills base is mixed, but with a marked improvement in the number of residents with NVQ 3, 4, and 5;
• Slow down in population decline: the population of the conurbation has declined but at a slower rate; and
• City centre expansion: the City centre has acted as a key driver of growth in employment over the past five years.
3.2.2 City Centre Renaissance
The population of Liverpool is 439 473 and it is the fifth largest city in England and Wales. Whilst the City has seen a fall in population over the last 10 years (1991-2001) of 8.2 per cent, there has been slow down in the decline and a change in the location of residents showing signs of an urban renaissance.Research carried out jointly by Liverpool City Council and the University of Liverpool in 1999(1), found that since 1991 the city centre's population has grown by almost 300 per cent - from 2340 in 1991 to approximately 9000 by 1999. The results of a city centre living survey found that new residents moving into the city centre. Car ownership amongst professionals in the city centre is lower than in the city as a whole, and there is a noticeably higher proportion of people who walk to work. The research concluded that in Liverpool, city centre living does appear to promote more sustainable lifestyles. It is having a positive effect on social mix.
The city centre has seen fast employment growth at 7 per cent during the period 2001 to 2006. The city centre is identified as a strategic site for the region and an important contributor to economic and employment growth in the future.
3.2.3 Economic Prospects
The forecast for Merseyside is that, over the medium term, economic growth is expected to increase. It is forecast that growth in value added will accelerate rapidly to 2005 by an average of 1.4 per cent(2). This projection remains slower than the region and the UK, but is expected to be fast enoughto narrow the gap between Merseyside and the region/UK. This growth is expected to be led by the knowledge sectors such as health, education, financial services, communications and cultural and leisure activities.
The 2008 Capital of Culture bid programme and the development of the cultural infrastructure over the next five years will contribute to the expected changes in the economy over the medium to long term. The Merseyside Economic Assessment recognises the importance of the city centre and the
(1) “City Centre Living as the Spring Board for Regeneration? Some lessons from Liverpool” by Moss Madden, Vicki Popplewell and Ian Wray. University of Liverpool Department of Civic Design, Working Paper 59, May 2001.(2) Experien Business Strategies Ltd forecast as part of the Merseyside Economic Review.
ERM E CONOMICS FINAL REPORT LIVERPOOL CITY COUNCIL
15
major cultural investments (such as the FACT centre and Kings Waterfront) in promoting increased growth in the City.
3.3 CULTURAL INDUSTRIES
3.3.1 Introduction
The strategy adopted by Liverpool in its 2008 bid programme and its broader approach to the regeneration of the City is to view the cultural industries in its entirety, recognising the importance of the creative industries for the future of the City. In this report we define the ‘cultural industries’ as the combination of tourism, creative industries, sports and heritage and examine the recent trends in the development of this broad sector, as part of the overall growth of Liverpool. (Annex A provides a summary on the classification of the sector).
In this section we present baseline analysis of the cultural industries sector based on two key sources. The first is the preliminary results of a cultural industries benchmarking study for the North West and Merseyside and the second source uses information from the annual business surveys. The later provides data at the Liverpool as well as other spatial levels, over time.
3.3.2 Regional Benchmarking Study
The North West Benchmarking Study conducted by the Regional Intelligence Unit (March 2003) provides a more up to date and comprehensive overview of the cultural industries sector than national datasets. The study looked at the North West and therefore enables a comparison with the North West using the same methodology.
The analysis shows that there is an estimated 393 000 employees in the cultural industries (defined as including creative industries, tourism and heritage, and sports and leisure) in the North West, of which 61 000 are employed on Merseyside. This scale of employment is higher than that captured by the annual employment surveys and is partly accounted for by including the self-employed.
Of these 61 000 some 10 000 are estimated to be self-employed, the majority of which are in the creative industry sub sector. Over a third of the workforce in the creative industries sub-sector are self-employed, compared to 6 per cent in tourism and 9 per cent in sport. The number of cultural industry enterprises is estimated at 5745 across the conurbation.
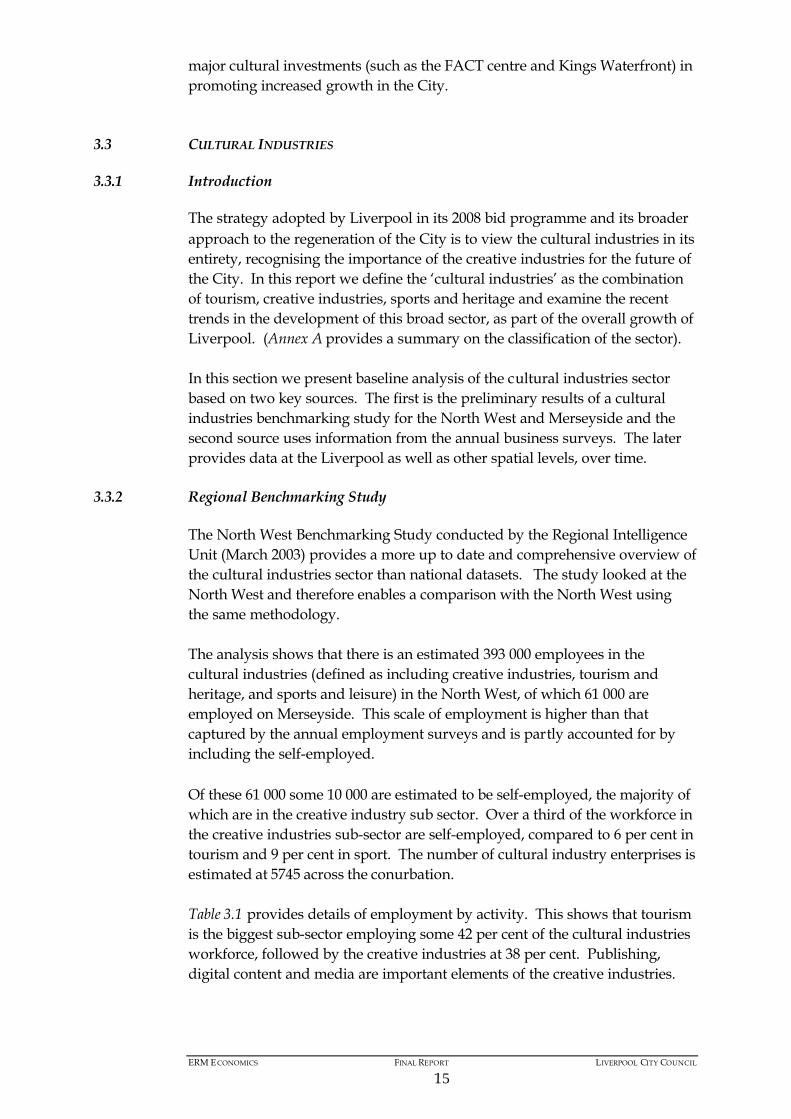
Table 3.1 provides details of employment by activity. This shows that tourism is the biggest sub-sector employing some 42 per cent of the cultural industries workforce, followed by the creative industries at 38 per cent. Publishing, digital content and media are important elements of the creative industries.
ERM E CONOMICS FINAL REPORT LIVERPOOL CITY COUNCIL
16
Table 3.1 Total Employment in the Cultural Industries
Sub-Sector Total Employment % of cultural industriesemployment
% of employment in all sectors
Advertising 894 1.5 0.2Architecture 1641 2.7 0.3Arts & Antiques 428 0.7 0.1Design 1343 2.2 0.3Designer fashion 160 0.3 0.0Music 1422 2.3 0.3Media (Film, video, radio & TV)
2140 3.5 0.4
Visual arts & crafts 1308 2.1 0.3Performing arts 828 1.3 0.2Publishing (including literature)
2545 4.1 0.5
Digital content 2405 3.9 0.5Heritage 1990 3.2 0.4Tourism (excluding heritage & sport)
25 781 42.0 5.2
Sport & Leisure 10 290 16.8 2.1Other (eg support services) 8245 13.4 1.7Total 61 419 100 12.3Source: Regional Intelligence Unit and Impact Research
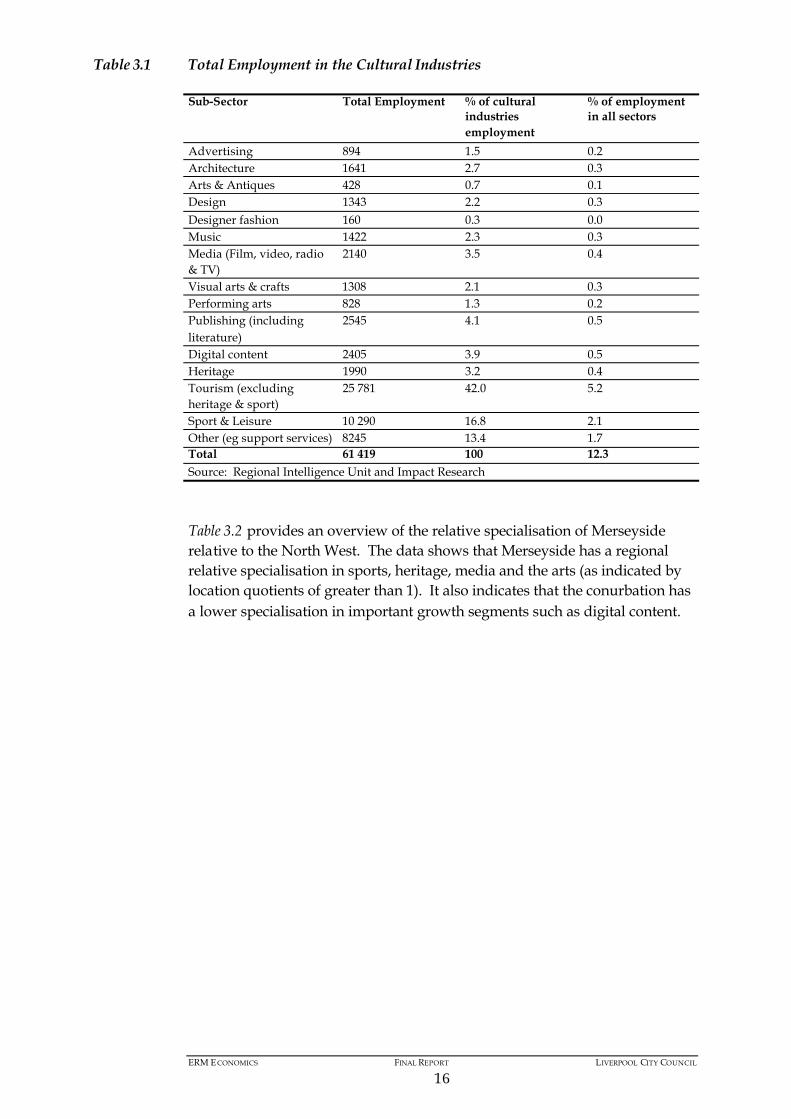
Table 3.2 provides an overview of the relative specialisation of Merseyside relative to the North West. The data shows that Merseyside has a regional relative specialisation in sports, heritage, media and the arts (as indicated by location quotients of greater than 1). It also indicates that the conurbation has a lower specialisation in important growth segments such as digital content.
ERM E CONOMICS FINAL REPORT LIVERPOOL CITY COUNCIL
17
Table 3.2 Merseyside Specialisation in the Cultural Industries
Sub-Sector North West structure of Employment
Merseyside structure of Employment
Location Quotient
Advertising 2.2 1.5 0.7Architecture 3.9 2.7 0.7Arts & Antiques 0.6 0.7 1.2Design 2.1 2.2 1.0Designer fashion 0.5 0.3 0.5Music 2.3 2.3 1.0Media (Film, video, radio & TV)
2.8 3.5 1.3
Visual arts & crafts 1.9 2.1 1.1Performing arts 1.3 1.3 1.0Publishing (including literature)
3.4 4.1 1.2
Digital content 6.0 3.9 0.7Heritage 2.4 3.2 1.3Tourism (excluding heritage & sport)
49.3 42.0 0.9
Sport & Leisure 10.9 16.8 1.5Other (eg support services) 10.4 13.4 1.3Total 100 100 1Source: ERM Economics and Impact Research
3.3.3 Annual Employment Survey Analysis
Employment and Recent Growth
The broad cultural industries in Liverpool employed 29 000 people in 2001 and of this, 5000 were employed in creative industries and 24 000 in cultural industries including tourism, heritage and sports. Over 1000 people were employed in the computer games, software and electronic publishing category with radio and TV employment at 912. Tourism is the biggest employment category with 18 000 people in 2001 in Liverpool, making up the majority ofthe cultural industry employment
The North West, Merseyside and Liverpool have all seen growth in the broad cultural sectors over the last ten years and particularly impressive growth in the creative industries. The creative sector in Liverpool has grown 45 per cent compared to 33 per cent in the North West. The growth of cultural industries has also risen by 19 per cent in Liverpool, which is slightly lower that the North West rate (24 per cent). The combined broad cultural sector has grown in Liverpool by 23 per cent, which is slightly better than the Merseyside figure of 21 per cent.
Overall, growth has mainly taken place in the last five years. With 41 per cent growth in Liverpool for broad cultural industries between 1996 and 2001 compared to a 13 per cent fall between 1991-1996.
ERM E CONOMICS FINAL REPORT LIVERPOOL CITY COUNCIL
18
The creative sector growth was 43 per cent for Liverpool between 1991 and 1996, which was significantly higher than either Merseyside (30 per cent) or the North West (9 per cent). In the same period the level of employment in the cultural sector fell, causing the overall growth in the broad cultural industries to decrease.
The cultural industries grew strongly from 1996 to 2001 in Liverpool, Merseyside and the North West. Liverpool’s cultural industries grew by 55 per cent and Merseyside and the North West by 34 per cent and 25 per cent respectively.
The percentage of the workforce of creative and cultural industries employment compared to total employment has been steadily increasing. In Liverpool the creative industries accounted for 2 per cent of the total workforce in 1991 growing to 3 per cent by 2001. Cultural industries rose from 10 per cent in 1991 to 11 per cent in 2001, with the broad cultural industries accounting for 14 per cent of total workforce in 2001, compared to 12 per cent for Merseyside and the North West.
Sub Sector Analysis
The creative industries break-down to include film, music, architecture, publishing, computer games, software, electronic publishing, radio and TV, advertising, designer fashion and arts/antique trade. As described, Liverpool has seen an overall growth in the last ten years of its creative industries and the leaders in this growth have been radio and TV (183 per cent), designer fashion (191 per cent), and computer games, software and electronic publishing (154 per cent). This compares to the North West leading creative industries being designer fashion (202 per cent) and computer games, software and electronic publishing (165 per cent), with radio and TV growing only 86 per cent in the North West.
Box 3.1 Did you know?
Looking at five year interval growth advertising grew 380 per cent from 1991 to 1996 and computer games, software and electronic publishing 141 per cent.From 1996 to 2001 radio and TV (126 per cent) and designer fashion (176 per cent) had the strongest growth, advertising have a negative growth figure of 85 per cent and computer games, software and electronic publishing slowing to 6 per cent growth.
Mersey Television is the largest regional independent production company in the UK, with a turnover of £3.9 million in 1998/9. New Media, Film and Television employs over 62,000 and the sector has a combined turnover of C£6.45 billion.
Sector profile for ICT/New Media in the North West Region, Amtek, 2000 report estimated that the total value of the sector to the regional economy £6.45 billion, with concentrations of activity in Liverpool (£757 million) and Manchester (£1.26 billion).
ERM E CONOMICS FINAL REPORT LIVERPOOL CITY COUNCIL
19
The cultural industries are heritage, sport, entertainment and tourism and of these tourism is by far the largest. Liverpool experienced a 55 per cent increase in heritage and tourism from 1991 to 2001.
City Comparisons
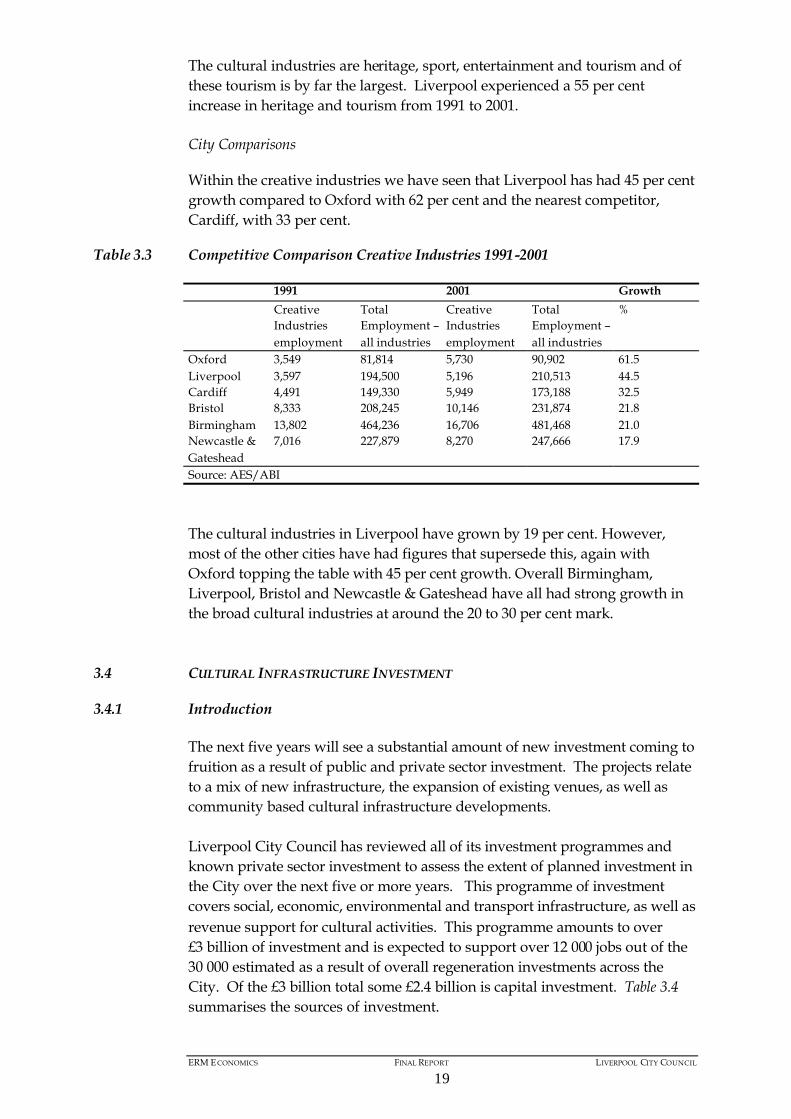
Within the creative industries we have seen that Liverpool has had 45 per cent growth compared to Oxford with 62 per cent and the nearest competitor, Cardiff, with 33 per cent.
Table 3.3 Competitive Comparison Creative Industries 1991-2001
1991 2001 GrowthCreativeIndustriesemployment
TotalEmployment –all industries
CreativeIndustriesemployment
TotalEmployment –all industries
%
Oxford 3,549 81,814 5,730 90,902 61.5Liverpool 3,597 194,500 5,196 210,513 44.5Cardiff 4,491 149,330 5,949 173,188 32.5Bristol 8,333 208,245 10,146 231,874 21.8Birmingham 13,802 464,236 16,706 481,468 21.0Newcastle & Gateshead
7,016 227,879 8,270 247,666 17.9
Source: AES/ABI
The cultural industries in Liverpool have grown by 19 per cent. However, most of the other cities have had figures that supersede this, again with Oxford topping the table with 45 per cent growth. Overall Birmingham, Liverpool, Bristol and Newcastle & Gateshead have all had strong growth in the broad cultural industries at around the 20 to 30 per cent mark.
3.4 CULTURAL INFRASTRUCTURE INVESTMENT
3.4.1 Introduction
The next five years will see a substantial amount of new investment coming to fruition as a result of public and private sector investment. The projects relate to a mix of new infrastructure, the expansion of existing venues, as well as community based cultural infrastructure developments.
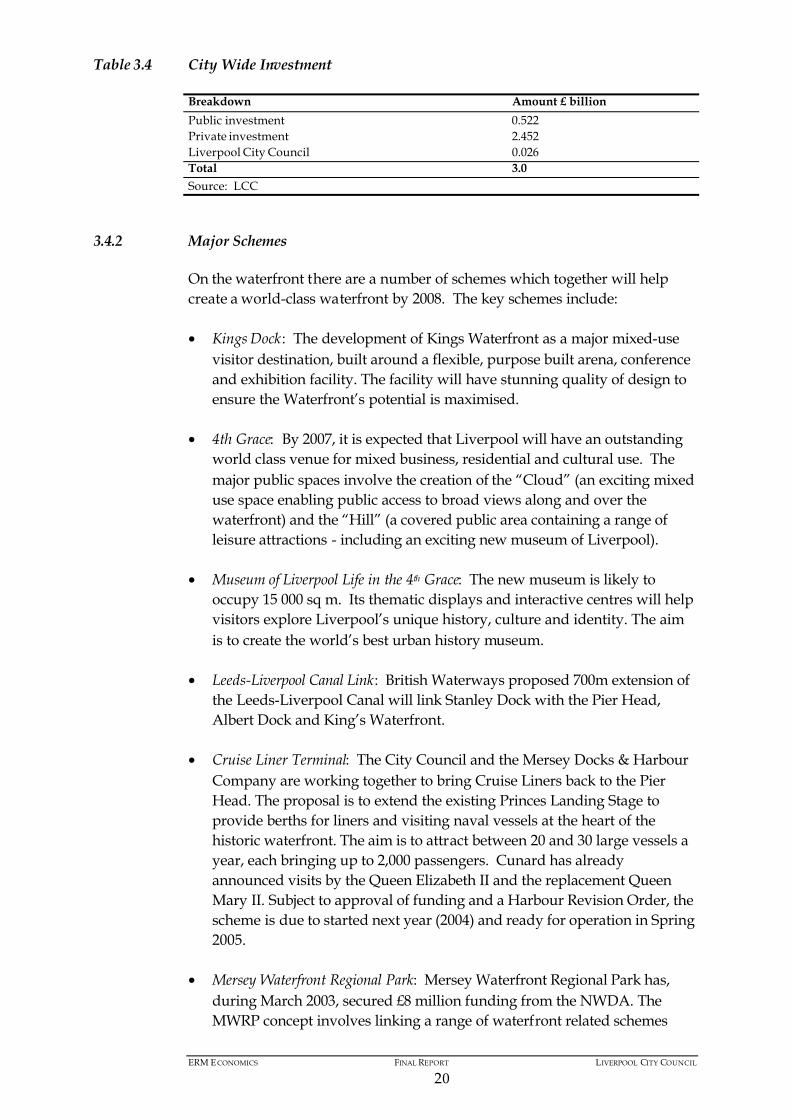
Liverpool City Council has reviewed all of its investment programmes and known private sector investment to assess the extent of planned investment in the City over the next five or more years. This programme of investment covers social, economic, environmental and transport infrastructure, as well as revenue support for cultural activities. This programme amounts to over £3 billion of investment and is expected to support over 12 000 jobs out of the 30 000 estimated as a result of overall regeneration investments across the City. Of the £3 billion total some £2.4 billion is capital investment. Table 3.4summarises the sources of investment.
ERM E CONOMICS FINAL REPORT LIVERPOOL CITY COUNCIL
20
Table 3.4 City Wide Investment
Breakdown Amount £ billionPublic investment 0.522Private investment 2.452Liverpool City Council 0.026Total 3.0Source: LCC
3.4.2 Major Schemes
On the waterfront there are a number of schemes which together will help create a world-class waterfront by 2008. The key schemes include:
• Kings Dock: The development of Kings Waterfront as a major mixed-usevisitor destination, built around a flexible, purpose built arena, conference and exhibition facility. The facility will have stunning quality of design to ensure the Waterfront’s potential is maximised.
• 4th Grace: By 2007, it is expected that Liverpool will have an outstanding world class venue for mixed business, residential and cultural use. The major public spaces involve the creation of the “Cloud” (an exciting mixed use space enabling public access to broad views along and over the waterfront) and the “Hill” (a covered public area containing a range of leisure attractions - including an exciting new museum of Liverpool).
• Museum of Liverpool Life in the 4th Grace: The new museum is likely to occupy 15 000 sq m. Its thematic displays and interactive centres will help visitors explore Liverpool’s unique history, culture and identity. The aim is to create the world’s best urban history museum.
• Leeds-Liverpool Canal Link: British Waterways proposed 700m extension of the Leeds-Liverpool Canal will link Stanley Dock with the Pier Head, Albert Dock and King’s Waterfront.
• Cruise Liner Terminal: The City Council and the Mersey Docks & HarbourCompany are working together to bring Cruise Liners back to the Pier Head. The proposal is to extend the existing Princes Landing Stage to provide berths for liners and visiting naval vessels at the heart of the historic waterfront. The aim is to attract between 20 and 30 large vessels a year, each bringing up to 2,000 passengers. Cunard has already announced visits by the Queen Elizabeth II and the replacement Queen Mary II. Subject to approval of funding and a Harbour Revision Order, the scheme is due to started next year (2004) and ready for operation in Spring 2005.
• Mersey Waterfront Regional Park: Mersey Waterfront Regional Park has, during March 2003, secured £8 million funding from the NWDA. The MWRP concept involves linking a range of waterfront related schemes
ERM E CONOMICS FINAL REPORT LIVERPOOL CITY COUNCIL
21
under one umbrella and adding value to them where appropriate. Mersey Waterfront has been recognised by partners in the Northwest as an asset of international importance.
Other wider developments include:
• The FACT Centre: The £10.5 million Film, Art, Creative Technology (FACT) centre opened in February 2003. Located at the heart of the city centre, it comprises 3 state of the art cinemas, 2 galleries and exhibition and event spaces showcasing an international programme of film, videoand new media projects, alongside resources, spaces, programmes and partnerships dedicated to the development and production of new and emerging forms of creativity using digital media technologies.
• Liverpool Philharmonic Centre: The proposed Liverpool Philharmonic Centre development remains central to the achievement of the Royal Liverpool Philharmonic’s vision. It is expected that significant further work on partnerships, design and fundraising for this project will start in 2004, and that building work is unlikely to commence before 2007, should the Centre’s further development and planning be successfully completed.
• The Bluecoat: Bluecoat Arts Centre is at an advanced stage (RIBA Stage C+) of an £8m project to renovate and extend its beautiful 18th century Grade 1 listed building. The development will restore the historic fabric of this Queen Anne building and construct a new wing that will house a gallery for its award winning exhibition programme and a performance space for dance, music, literature, live art and community projects.
The National Museums and Galleries on Merseyside (NMGM) have a number of project planned including:
• The Walker Art Gallery: A £4.3m scheme to renovate and improve the Walker was re-opened by the Queen in July 2002. In 2004, the final stage of the renovation will be completed with the opening of a Crafts and Design Gallery.
• Sudley House : Conservatory renovation and structural repairs to the conservatory of this Grade II listed house, museum and gallery are planned. The installation of level access from the courtyard is also planned for autumn 2003 costing £58 000. This will greatly improve access to the building.
• Liverpool Museum: A £30m development will be completed in winter 2004/05 and will provide eight new attractions, including a World Cultures Gallery, a new aquarium and the InfoWorld theatre for multi-media presentations and performance. These developments will be complemented by the development of a £1.5m space, ‘Impact’, which will explore the wide range of forces that created the planet and continue to

ERM E CONOMICS FINAL REPORT LIVERPOOL CITY COUNCIL
22
shape its surface. The developments will form a key part of the strategy to double the number of visits to Liverpool Museum by the end of 2005.
• St George’s Hall: Liverpool City Council, with support from the Heritage Lottery Fund and ERDF, is undertaking a major £18m refurbishment project to restore the Hall as Liverpool’s premier cultural venue. Work commenced on site in September 2002 and it is programmed to take 18 months to complete. The Hall will be re-launched in April 2005 as a venue for cultural, community, civic, corporate and performing arts activities.
• Film Studios: The Film Studios, which are five spaces in total, opened in June 2003 at a total cost of £1.5million. The Directors would like to extend the studios for which they need a further £0.5 million. They have applied for a Special Investment Loan. So far many commercials and short films have been shot there, as well as one full-length feature ‘The Virgin of Liverpool’. The lettable parts of the complex, which amount to some 400 units in total, are now 75 per cent let.
• Libraries: The Central Library and Archive will be redeveloped as the £30m “World Discovery Centre”, designed to radically enhance this Grade II* listed building. Visits will increase from 600 000 to 1 million per year with the Liverpool Record Office, the busiest local authority record office outside of Kew, being rebuilt. Now out to tender, interviews for the consortia to develop outline design proposals take place in April, prior to a Heritage Lottery Fund application. DCMS PFI credits for 2005/06 are also being bid for.
• Paradise Street Development Area: The PSDA retail-led mixed use development, due for completion in 2007/08, represents a wholly private sector, £750 million direct capital investment, and is a key element of Liverpool’s wider regeneration strategy. It includes part of the nominated World Heritage site, and will provide for economic and social growth and improvement through a high quality, integrated and fully accessible development. It will benefit not only the continuing physical renaissance of the City Centre, but also the wider area, whilst preserving and enhancing historic fabric of international importance.
• Liverpool Football Club: Liverpool Football Club has announced its intention to build a new 60,000 seat stadium close to its existing home at Anfield. Planning permission will be sought this summer for the £100m development. The new stadium will be a catalyst for the regeneration of the Anfield area. It will include a new Education Innovation Centre; a replacement Vernon Sangster Sports Centre and will also result in a net increase in greenspace for use by the local community.
• Merseytram: On the 10th December 2002, the Government announced the go-ahead for Merseytram by giving outline approval of £170 million towards the £225 million cost of building Line 1 of the proposed 3-line

ERM ECONOMICS FINAL REPORT LIVERPOOL CITY COUNCIL
23
network. Subject to progress Merseytram Line 1 is planned to open in 2006/07.
• Lime Street Station: The station and its surrounding environment will be
dramatically transformed in terms of facilities, access and overall environment in an initiative being developed as a partnership between Liverpool Vision, MerseyTravel and Network Rail. Phase 1 of the scheme is estimated to cost approximately £15 million. One of the most noticeable early outcomes of the scheme will be the return of the entrance façade to its former state.
3.4.3 Summary of Investment
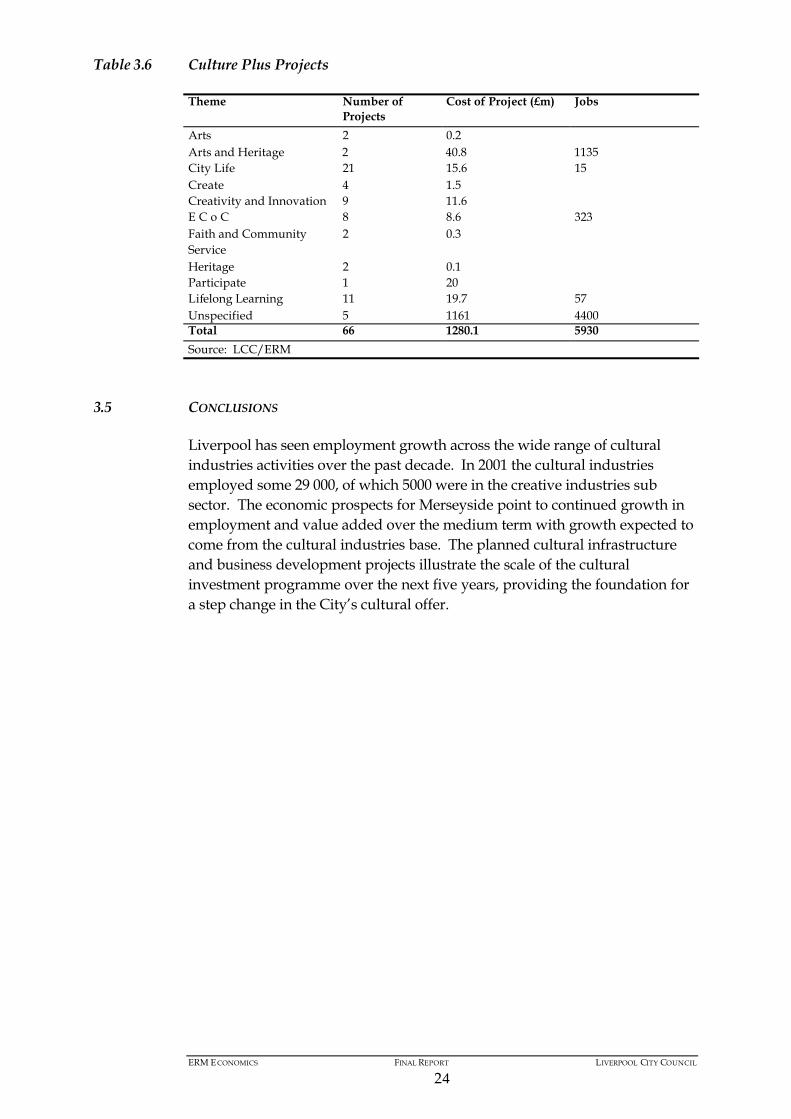
Based on an analysis of the database of project supplied by Liverpool City Council, we have estimated the number of planning projects that will contribute to the broad cultural infrastructure of the City. The infrastructure is broadly spilt between core cultural infrastructure projects and wider investments that will enhance the City and surrounding area – the key projects having been outlined above. These projects have an important impact on the quality of the City and its ability to attract and retain people and businesses. Table 3.5 and 3.6 summarises the details.
Table 3.5 Culture Projects
Theme Number of Projects
Cost of Project (£m) Jobs
Arts 4 5.9 83 Arts and Heritage 3 8.2 City Life 1 0.2 Create 38 132.8 Creativity and Innovation 3 115 3000 E C o C 5 9.5 60 Faith and Community Service
1 4.2 12
Heritage 5 22.7 33 Participate 8 72.6 71 Regenerate 5 393.3 3500 Unspecified 4 116.5 109 Total 83 984 6868 Source: LCC
The investments have been broken down according to the broad categories in terms of how they contribute to the aims of the Capital of Culture bid submission. The number of projects and associated outputs where known are indicated. The total investment outlined amounts to over £2 billion of public and private sector investment.
ERM E CONOMICS FINAL REPORT LIVERPOOL CITY COUNCIL
24
Table 3.6 Culture Plus Projects
Theme Number of Projects
Cost of Project (£m) Jobs
Arts 2 0.2Arts and Heritage 2 40.8 1135City Life 21 15.6 15Create 4 1.5Creativity and Innovation 9 11.6E C o C 8 8.6 323Faith and Community Service
2 0.3
Heritage 2 0.1Participate 1 20Lifelong Learning 11 19.7 57Unspecified 5 1161 4400Total 66 1280.1 5930Source: LCC/ERM
3.5 CONCLUSIONS
Liverpool has seen employment growth across the wide range of cultural industries activities over the past decade. In 2001 the cultural industries employed some 29 000, of which 5000 were in the creative industries sub sector. The economic prospects for Merseyside point to continued growth in employment and value added over the medium term with growth expected to come from the cultural industries base. The planned cultural infrastructure and business development projects illustrate the scale of the cultural investment programme over the next five years, providing the foundation for a step change in the City’s cultural offer.

ERM E CONOMICS FINAL REPORT LIVERPOOL CITY COUNCIL
25
4 SOCIO ECONOMIC IMPACTS
4.1 INTRODUCTION
The European Capital of Culture award was established in 1985 and has a strong profile throughout the continent. Since its launch, the initiative has been more and more successful amongst European citizens and has had a growing cultural and socio-economic impact on the numerous visitors it has attracted. Furthermore, the experience of previous cities suggests that the social and economic impacts of awarding the title ‘Capital of Culture’ is a two-way street, with selected cities experiencing significant economic and social benefits as a consequence. Such benefits have been felt through increased visitor numbers (both during the year itself and thereafter, as a legacy of the title), higher expenditure in the cultural sector, an improved cultural ‘offer’ for tourists and residents alike and improved image domestically and internationally.
The terms of reference for this study asked that we consider the potential impact of a successful Capital of Culture bid on the following three key areas:
• Increased competitiveness and sustainable economic growth;• Social and cultural benefits and increased community cohesion; and• Growth of the creative industries sector.
Based on the bid programme developed to date this section sets out the way in which Liverpool could benefit if the City were to win the award. Given the complex nature of the potential benefits we have adopted an approach that focuses on three key areas. These are:
• Increased competitiveness: The extent to which the tourism product of Liverpool becomes more competitive from the cultural investment taking place;
• Creative industries: The promotion of creative industries within the Capital of Culture bid programme and the supporting wider investment programme; and
• Participation: The proposed range of activities and how the bid programme seeks to increase the involvement of the resident population and under represented groups.
ERM E CONOMICS FINAL REPORT LIVERPOOL CITY COUNCIL
26
4.2 CULTURAL INDUSTRIES
4.2.1 Introduction
This section explores some of the benefits that are forecast for Liverpool,should the city be awarded the European Capital of Culture for 2008.
4.2.2 Existing Visits to Liverpool
The Merseyside 2000 Visitor Survey Report undertaken by North West Tourist Board (NWTB) Research Services (2001) estimated that in 2000, tourism in Merseyside contributed some £604 million to the local economy. This injection into the Merseyside economy is thought to support in the region of 21 000 jobs.
The survey found that tourism in Liverpool contributed the largest proportion of income generated by tourism to the Merseyside economy. This was estimated to be £261 million in 2000. This amount of tourism expenditure in Liverpool was thought to support some 9500 jobs in the city.
The survey found that the city of Liverpool attracted some 7.54 million visits in 2000, of which some 6.69 million (89 per cent) were day trips with the remainder (some 848 000) being staying visits. These figures are consistent with those used elsewhere and were employed as the base year figures on which subsequent forecasts were estimated.
4.2.3 Forecast Visits to Liverpool, 2003 - 2012
Table 4.2 shows forecast visits to Liverpool, for 2003 – 2012. This period includes the Capital of Culture year of 2008 itself, each of the themed years planned in the run up to the Capital of Culture year, starting with the LifetimeLearning theme in 2003, as well as Liverpool’s 800th anniversary year, due to be celebrated in 2007.
Overall estimates of visits comprise three sets of estimates overlaid. These are:
• The trend – the number of visits that are expected to take place regardless of other activities;
• Additional growth associated with new investment in infrastructure and tourist attractions; and
• The specific one-off effect of the Capital of Culture.
Growth Trend
The trend is a reflection of what is likely to happen to the Liverpool tourism market without the Capital of Culture award and without the implementation of new projects planned and underway. The start point for the trend is the
ERM E CONOMICS FINAL REPORT LIVERPOOL CITY COUNCIL
27
baseline year 2000 figures presented above (ie 7.5m visits and an associated spend of £261 million). Thereafter, a year on year growth figure of three per cent per annum up to and including 2008 is applied, with a figure of 1.5 per cent growth per annum being used thereafter. For Merseyside, which has been experiencing relatively strong growth in recent years, such a target is likely to be achievable provided some degree of innovation and successful marketing is realised.
Factoring in these rates of growth implies an expected 9.5 million visits in 2008, of which some 1.5 million would be staying visits. Together, these visits would generate expenditure of some £460 million at the Liverpool level.
Impact of New Projects
A second layer of visits has been estimated to reflect the additionalinfrastructure and tourist attractions that are to be constructed. The rationale for this additional layer of visits is that because of the extraordinary scale of the investment and the iconic nature of some of the projects involved, additional visits beyond those expected as part of the normal growth rate can be expected. The new projects which will generate these additional visits include the Fourth Grace, Kings Dock, the National Museums and Galleries of Merseyside initiatives, St George’s Hall improvements and the newly opened FACT centre.
The impact of these projects begins on a relatively small scale (40 000 net additional visits in 2003), and, as more projects come on stream (including the Fourth Grace and Kings Dock), rises to 1.04 million in 2008. The 2008 visits are associated with expenditure of some £42m.
Capital of Culture Effect
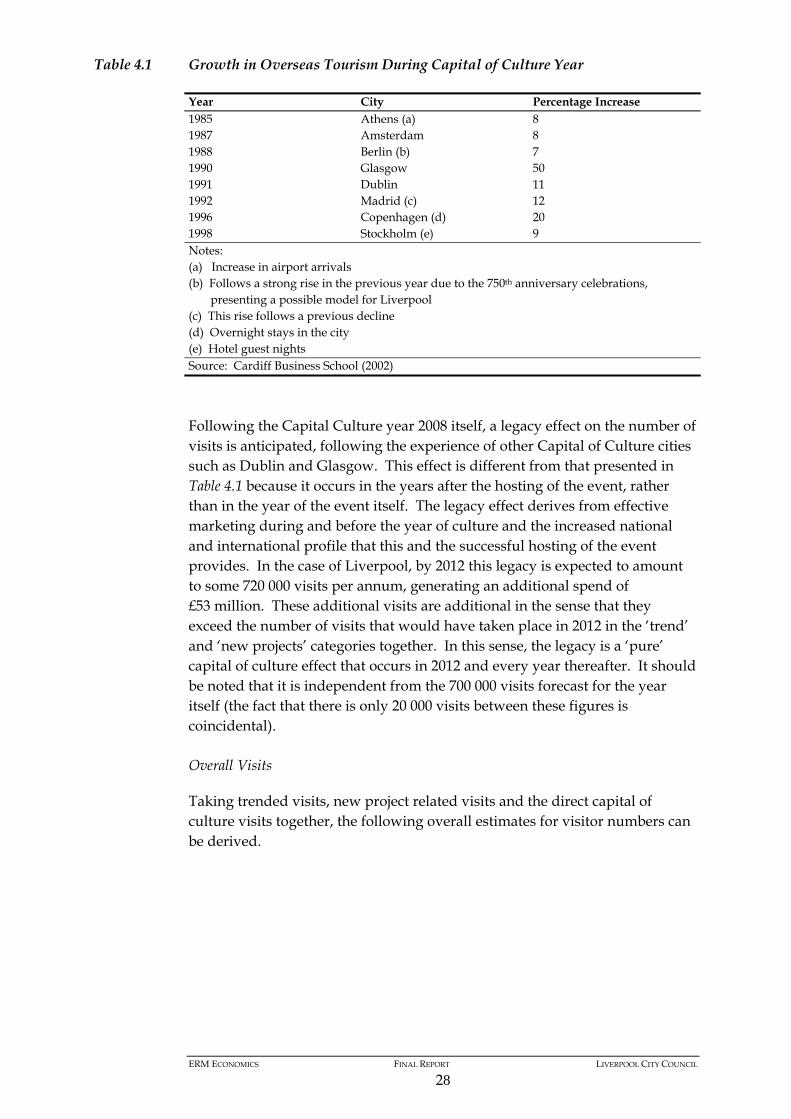
The estimate of an additional 700 000 visits reflecting the Capital of Culture year in 2008 (which represents a rise of some seven per cent relative to the previous year) is reasonably conservative given the experiences of Capital of Culture cities elsewhere. This experience is presented in Table 4.1.
ERM ECONOMICS FINAL REPORT LIVERPOOL CITY COUNCIL
28
Table 4.1 Growth in Overseas Tourism During Capital of Culture Year
Year City Percentage Increase 1985 Athens (a) 8 1987 Amsterdam 8 1988 Berlin (b) 7 1990 Glasgow 50 1991 Dublin 11 1992 Madrid (c) 12 1996 Copenhagen (d) 20 1998 Stockholm (e) 9 Notes: (a) Increase in airport arrivals (b) Follows a strong rise in the previous year due to the 750th anniversary celebrations,
presenting a possible model for Liverpool (c) This rise follows a previous decline (d) Overnight stays in the city (e) Hotel guest nights Source: Cardiff Business School (2002)
Following the Capital Culture year 2008 itself, a legacy effect on the number of visits is anticipated, following the experience of other Capital of Culture cities such as Dublin and Glasgow. This effect is different from that presented in Table 4.1 because it occurs in the years after the hosting of the event, rather than in the year of the event itself. The legacy effect derives from effective marketing during and before the year of culture and the increased national and international profile that this and the successful hosting of the event provides. In the case of Liverpool, by 2012 this legacy is expected to amount to some 720 000 visits per annum, generating an additional spend of £53 million. These additional visits are additional in the sense that they exceed the number of visits that would have taken place in 2012 in the ‘trend’ and ‘new projects’ categories together. In this sense, the legacy is a ‘pure’ capital of culture effect that occurs in 2012 and every year thereafter. It should be noted that it is independent from the 700 000 visits forecast for the year itself (the fact that there is only 20 000 visits between these figures is coincidental). Overall Visits
Taking trended visits, new project related visits and the direct capital of culture visits together, the following overall estimates for visitor numbers can be derived.

ERM E CONOMICS FINAL REPORT LIVERPOOL CITY COUNCIL
29
Table 4.2 Projected Visits to Liverpool, 2003 – 2008 (Thousand visits)
Year Total Visits Trend New Projects One-off2000 7540 7540 - -2001 7766 7766 - -2002 7999 7999 - -2003 8279 8239 40 -2004 8588 8486 102 -2005 8858 8741 117 -2006 9120 9003 117 -2007 9678 9273 405 -2008 11 127 9551 876 700Source: ERM Estimates
By 2012, total visits are estimated to have risen to 11.897 million, which comprises:
• A trend number of visits of 10.14 million;• New projects driven visits of 1.04 million;• A legacy effect of 0.72 million.
Day/Staying Visit Forecasts
The NWTB Research Services (2001) found that there were some 848 000 staying visits in 2000. These visits are of particular interest because they result in a higher spend than do day visits.
Table 4.2 shows that overall, between 2000 and 2008, total visits to Liverpool are forecast to rise by nearly 50 per cent. Staying visits are expected to more than double over the period, to some 1.8 million. The expected split between day, staying, domestic and overseas visits is shown in Table 4.3.
Table 4.3 Actual and Projected Day and Staying Visits to Liverpool, 2002 and 2008
Type of visit Visits in 2000 (thousands) Visits in 2008 (thousands)Day visits 6692 9347Staying visits: 848 1780 of which, UK staying visits 695 1068 and overseas staying visits 153 712Source: ERM estimates
The staying visitors make up a relatively small proportion of the total, initially 11 per cent. This figure is estimated to peak at 16 per cent in the Capital of Culture year itself before dropping to 15 per cent in the following year and 14 per cent by 2012. The majority of staying visitors will be domestic. At the beginning of the period, some 82 per cent of visits are estimated to be made by domestic visitors, with the balance of 18 per cent of staying visits being madeby overseas visitors.

ERM E CONOMICS FINAL REPORT LIVERPOOL CITY COUNCIL
30
The target split between domestic and overseas staying visitors is 60:40.Indeed, there is some evidence (albeit from a relatively small sample) that this target is already being achieved. Consequently, in 2005, 2006 and 2007, the balance between overseas and domestic staying visitors has been increased in favour of domestic visitors. It is assumed that in 2007 (Liverpool’s 800th
anniversary) and thereafter, the 60:40 split is achieved.
Length of Visits
Forecast spend (presented in Section 3.4) is estimated by multiplying average spend per visit by number of visits. This process is done in two stages, firstly for UK residents, and secondly for overseas residents.
Latest data for Liverpool is presented in Table 4.4.
Table 4.4 Length of Visit to Liverpool 2001 (Nights)
Type of visit Domestic visitor Overseas visitor TotalLong holiday 5.5 - -Short holiday 1.9 - -All holidays 2.9 3.8 3.0Business 2.2 2.4 2.2Visiting friends and relatives
2.4 7.9 2.8
Other 2.9 3.6 3.1Overall average 2.6 4.7 2.8Note: For overseas trips, the model does not differentiate between long and short holidaysSource: Economic Impact Model for Liverpool 2001 (NWTB Research Services March 2003)
Hotel Supply
Relatively high growth in the numbers of staying visitors will have implications for the hotel market in Liverpool and beyond.
The number of hotel rooms in Liverpool in 2001, when there were 848 000 staying visits, was estimated at 2307 (Tourism Enterprise and Management/Tourism Solutions, 2003). At the estimated occupancy rate of 66 per cent (which is used in the above report), this implies:
2307 rooms x 365 days x 66 per cent = 555 750 room nights annual capacity.
NWTB Research Services (2001) note that the proportion of staying visitors using hotels for accommodation had dropped off from 50 per cent in 1995. By 2000, 40 per cent of staying visitors were using hotels, with just over half of them staying with friends and relatives, and the remainder making other arrangements such as flat rental. Drawing on this statistic implies that in 2000 there would have been some 340 000 visits to hotels (848 000 x 40 per cent).The ratio of nights to visits was therefore 555 750/340 000 or 1.63, implying that the average stay in a Liverpool hotel that year was 1.63 nights.
ERM E CONOMICS FINAL REPORT LIVERPOOL CITY COUNCIL
31
Looking to 2008, Liverpool’s Capital of Culture year, it is estimated that some 1.8 million staying visits will take place. By 2008, hotel capacity is projected to have risen to 4589 rooms (Tourism Enterprise and Management/ Tourism Solutions, 2003). A rise in the hotel occupancy rate for 2008 has also been projected, from the 66 per cent estimated in 2000 to 70 per cent by 2008 (ibid).This implies that capacity in the city will be:
4589 rooms x 365 days x 70 per cent = 1 172 000 room nights annual capacity.
Assuming 40 per cent of visitors continue to require hotel services, then in 2008 there will be some 720 000 visits to hotels (1.8 million x 40 per cent). The ratio of nights to visits is therefore expected to be 1 172 000/712 000, or 1.63.This ratio is the same as that in 2000, implying that hotel supply is predicted to rise at the same rate as the demand for staying visits.
If these expectations are on target, it is clear that hotel demand and supply will balance. Moreover, not only will the additional demand drive the new hotel capacity development, but it will also drive higher occupancy rates forLiverpool hotels in general (from an estimated 66 per cent in 2000 to 70 per cent in 2008).
Forecast Spend in Liverpool, 2003 - 2012
NWTB Research Services (2001) found that the mean average expenditure for a day trip in Liverpool was £22.79. Average expenditure for staying visits is a function of various determinants including origin of traveller (foreign or domestic) and whether the visitor is staying with friends or relatives or in a hotel. Mean average figures used for staying visits are £103 per trip for domestic visitors and £245 per trip for overseas visits.
These rates (£22.79 for day trip, £103 for domestic staying visits and £245 per trip for overseas visits) are used up until 2008, at which point it is assumed that they rise by 10 per cent. For 2008 and thereafter, spend rates are therefore £22.79, £113.30 and £269 respectively for day visits, domestic and overseas staying visitors.
All expenditure figures are presented in current prices (inflation is not built into the model). These do not change with scenario – ie average spend per visit remains the same for trend visits and for visits driven by new projects, capital of culture, and capital of culture legacy. Total value of expenditure is affected only by the volume of visits and the split between day/staying visits and domestic and overseas staying visits.
Table 4.5 shows forecast spend for Liverpool, for 2003 – 2012.
ERM E CONOMICS FINAL REPORT LIVERPOOL CITY COUNCIL
32
Table 4.5 Projected Spend in Liverpool, 2003 – 2008 (£ millions)
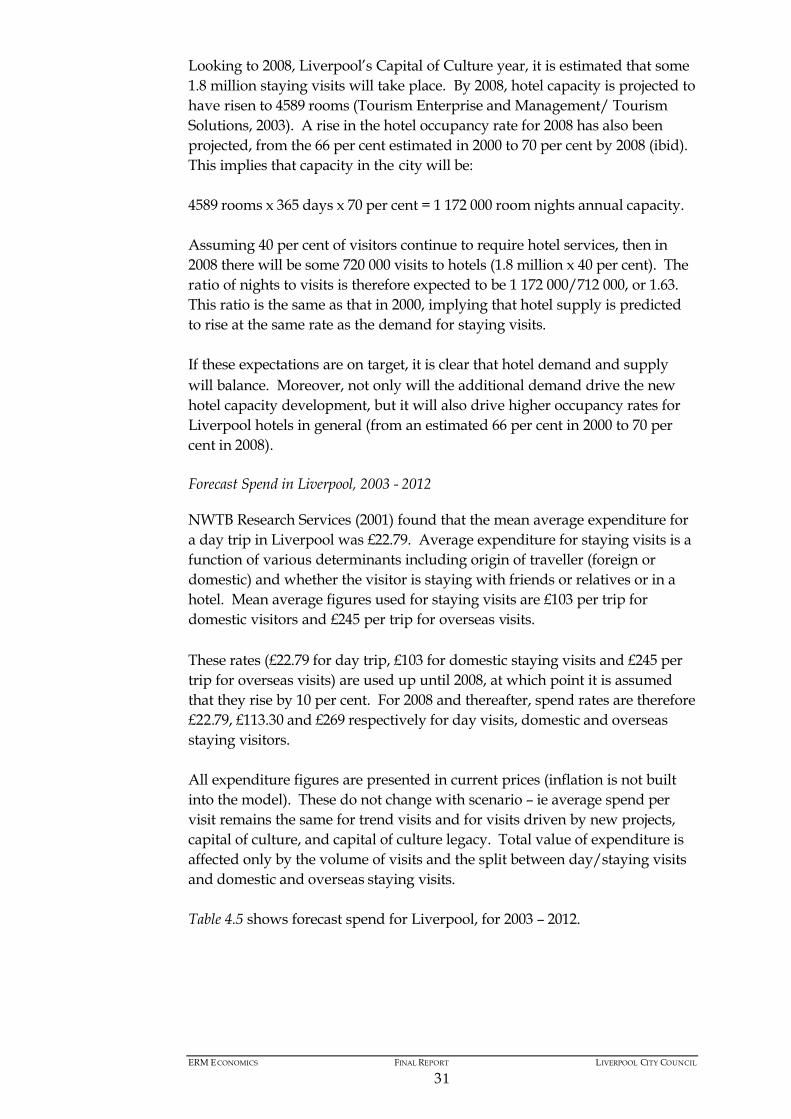
Year Total spend Trend New projects One-off2000 261 261 - -2001 267 267 - -2002 275 275 - -2003 285 284 1 -2004 296 292 3 -2005 323 319 4 -2006 353 349 5 -2007 419 402 18 -2008 547 469 43 34Note: Numbers do not add exactly due to roundingSource: ERM estimates
By 2008, expenditure is estimated to have more than doubled from its 2000 figure of £261m to some £547m. It is projected that this level of expenditure will support some 17 000 direct, indirect and induced jobs in Liverpool’s tourism sector.
Expenditure Split Between Day/Staying Visits
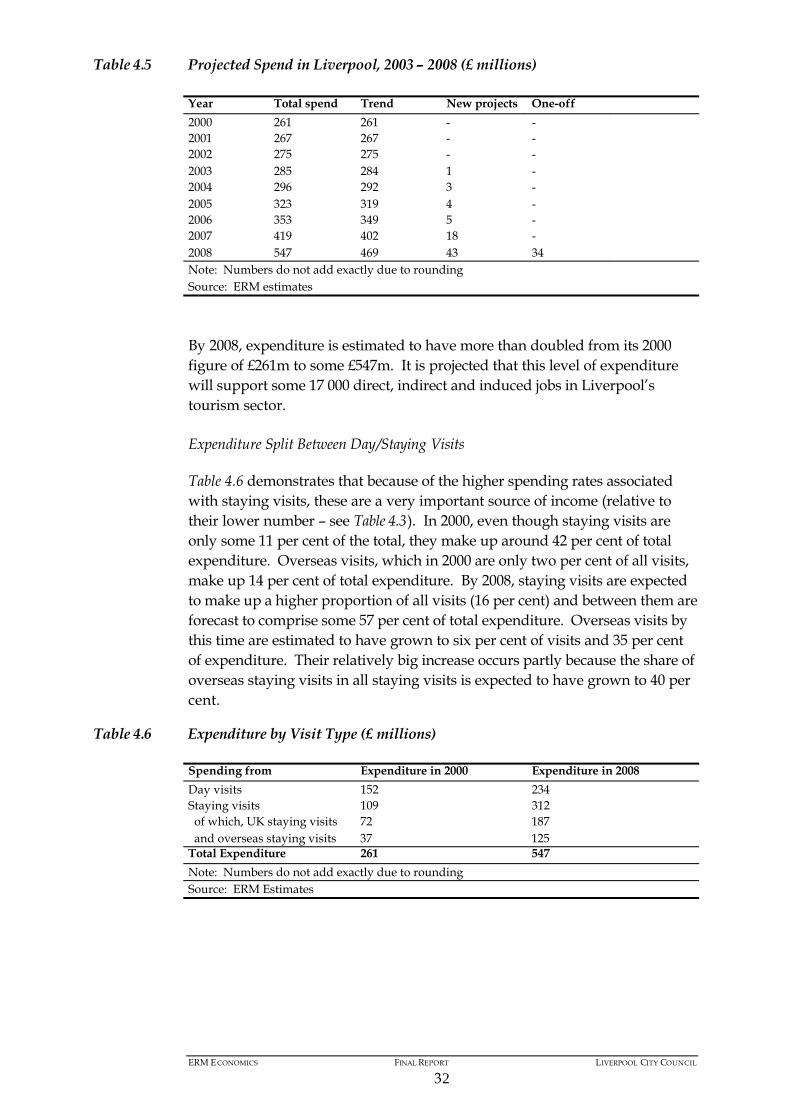
Table 4.6 demonstrates that because of the higher spending rates associated with staying visits, these are a very important source of income (relative to their lower number – see Table 4.3). In 2000, even though staying visits are only some 11 per cent of the total, they make up around 42 per cent of total expenditure. Overseas visits, which in 2000 are only two per cent of all visits, make up 14 per cent of total expenditure. By 2008, staying visits are expected to make up a higher proportion of all visits (16 per cent) and between them are forecast to comprise some 57 per cent of total expenditure. Overseas visits by this time are estimated to have grown to six per cent of visits and 35 per cent of expenditure. Their relatively big increase occurs partly because the share of overseas staying visits in all staying visits is expected to have grown to 40 per cent.
Table 4.6 Expenditure by Visit Type (£ millions)
Spending from Expenditure in 2000 Expenditure in 2008 Day visits 152 234Staying visits 109 312 of which, UK staying visits 72 187 and overseas staying visits 37 125Total Expenditure 261 547Note: Numbers do not add exactly due to roundingSource: ERM Estimates

ERM ECONOMICS FINAL REPORT LIVERPOOL CITY COUNCIL
33
4.2.4 Sensitivity Testing
Analyses were carried out to assess the likely impact of changes in three variables: • Straightforward, proportionate changes in all visit numbers; • Changes in assumptions about trend growth; and • Changes in the numbers of visits attracted by the Capital of Culture and
New Projects. Proportionate Changes in All Visit Numbers
Sensitivity testing was carried out to estimate what might happen if the number of overall visits were to change, and also if the number of staying visits were to change. In each case estimated outputs were tested for a rise in visits of 10 per cent and for falls of 10 and 20 per cent. The estimated impact of these changes is presented in Table 4.7.
Table 4.7 Estimated Impact of Changes in All Visit Numbers
Level Visitor numbers in 2008 (000s)
Expenditure in 2008 (£m)
Reduced by 20 per cent 8928 439 Reduced by 10 per cent 10 029 493 Standard assumptions 11 127 547 Increased by 10 per cent 12 221 601 Source: ERM Estimates
The findings demonstrate that across the board changes simply feed through to overall visits and expenditure in the same proportion (ie changes of 10 per cent in the number of visits lead to changes of approximately 10 per cent in estimated total spend). Changes in Assumptions of Trend Growth
The impact of changes in assumptions of the trend growth was then assessed. The analysis showed that visitor numbers and spend appeared to be fairly sensitive to changes in the assumptions of trend growth. The base case assumption of trend was that visits are expected to grow by three per cent per annum until 2008, and then by 1.5 per cent per annum thereafter. Such an assumption would lead to an estimated 11.1 million visits in 2008, associated with estimated expenditure of £547m. The revised assumption investigated was that trend growth was reduced from 3 per cent per annum to 1.5 per cent per annum throughout the period. The impact of this was to reduce 2008 visitor numbers to 10 088 and to cut estimated expenditure to £496m – a fall of 9 per cent.
ERM ECONOMICS FINAL REPORT LIVERPOOL CITY COUNCIL
34
Changes in Visitor Numbers Attracted by New Projects and Capital of Culture
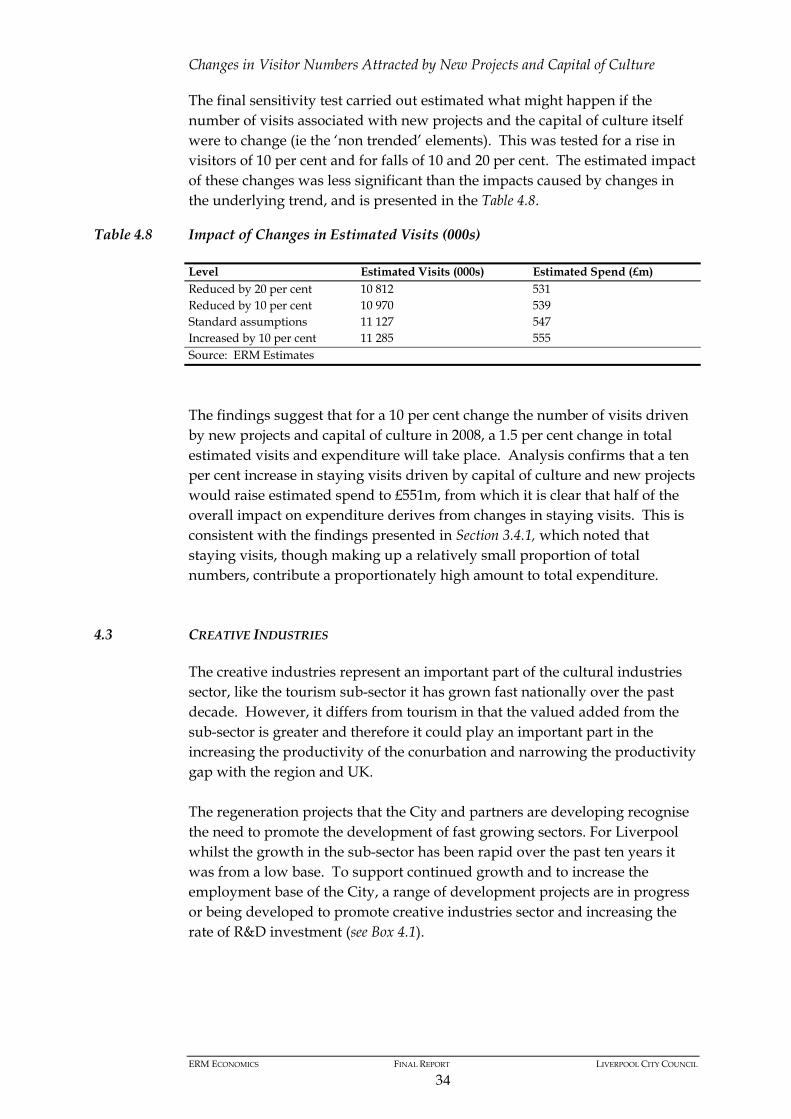
The final sensitivity test carried out estimated what might happen if the number of visits associated with new projects and the capital of culture itself were to change (ie the ‘non trended’ elements). This was tested for a rise in visitors of 10 per cent and for falls of 10 and 20 per cent. The estimated impact of these changes was less significant than the impacts caused by changes in the underlying trend, and is presented in the Table 4.8.
Table 4.8 Impact of Changes in Estimated Visits (000s)
Level Estimated Visits (000s) Estimated Spend (£m) Reduced by 20 per cent 10 812 531 Reduced by 10 per cent 10 970 539 Standard assumptions 11 127 547 Increased by 10 per cent 11 285 555 Source: ERM Estimates
The findings suggest that for a 10 per cent change the number of visits driven by new projects and capital of culture in 2008, a 1.5 per cent change in total estimated visits and expenditure will take place. Analysis confirms that a ten per cent increase in staying visits driven by capital of culture and new projects would raise estimated spend to £551m, from which it is clear that half of the overall impact on expenditure derives from changes in staying visits. This is consistent with the findings presented in Section 3.4.1, which noted that staying visits, though making up a relatively small proportion of total numbers, contribute a proportionately high amount to total expenditure.
4.3 CREATIVE INDUSTRIES
The creative industries represent an important part of the cultural industries sector, like the tourism sub-sector it has grown fast nationally over the past decade. However, it differs from tourism in that the valued added from the sub-sector is greater and therefore it could play an important part in the increasing the productivity of the conurbation and narrowing the productivity gap with the region and UK. The regeneration projects that the City and partners are developing recognise the need to promote the development of fast growing sectors. For Liverpool whilst the growth in the sub-sector has been rapid over the past ten years it was from a low base. To support continued growth and to increase the employment base of the City, a range of development projects are in progress or being developed to promote creative industries sector and increasing the rate of R&D investment (see Box 4.1).
ERM E CONOMICS FINAL REPORT LIVERPOOL CITY COUNCIL
35
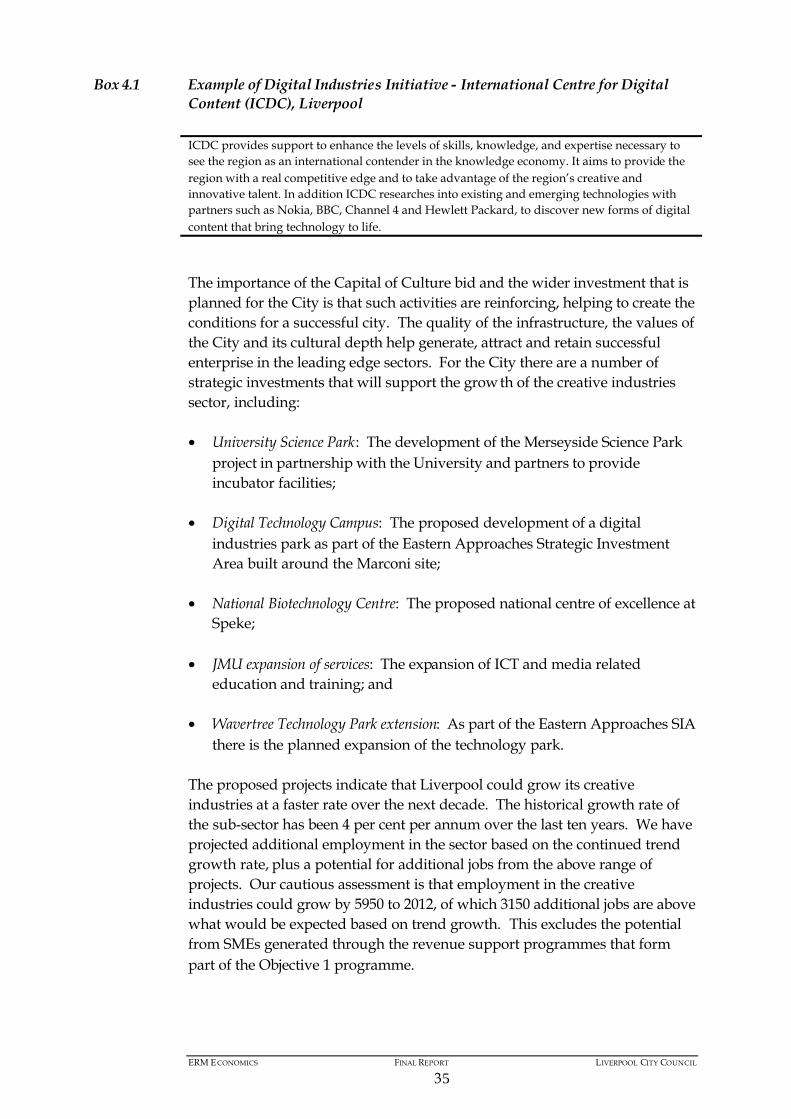
Box 4.1 Example of Digital Industries Initiative - International Centre for Digital Content (ICDC), Liverpool
ICDC provides support to enhance the levels of skills, knowledge, and expertise necessary to see the region as an international contender in the knowledge economy. It aims to provide the region with a real competitive edge and to take advantage of the region’s creative and innovative talent. In addition ICDC researches into existing and emerging technologies with partners such as Nokia, BBC, Channel 4 and Hewlett Packard, to discover new forms of digital content that bring technology to life.
The importance of the Capital of Culture bid and the wider investment that is planned for the City is that such activities are reinforcing, helping to create the conditions for a successful city. The quality of the infrastructure, the values of the City and its cultural depth help generate, attract and retain successful enterprise in the leading edge sectors. For the City there are a number of strategic investments that will support the growth of the creative industries sector, including:
• University Science Park: The development of the Merseyside Science Park project in partnership with the University and partners to provide incubator facilities;
• Digital Technology Campus: The proposed development of a digital industries park as part of the Eastern Approaches Strategic Investment Area built around the Marconi site;
• National Biotechnology Centre: The proposed national centre of excellence at Speke;
• JMU expansion of services: The expansion of ICT and media related education and training; and
• Wavertree Technology Park extension: As part of the Eastern Approaches SIA there is the planned expansion of the technology park.
The proposed projects indicate that Liverpool could grow its creativeindustries at a faster rate over the next decade. The historical growth rate of the sub-sector has been 4 per cent per annum over the last ten years. We have projected additional employment in the sector based on the continued trend growth rate, plus a potential for additional jobs from the above range of projects. Our cautious assessment is that employment in the creative industries could grow by 5950 to 2012, of which 3150 additional jobs are above what would be expected based on trend growth. This excludes the potential from SMEs generated through the revenue support programmes that form part of the Objective 1 programme.
ERM E CONOMICS FINAL REPORT LIVERPOOL CITY COUNCIL
36
4.4 PARTICIPATION
The socio-economic impacts and outcomes of a Capital of Culture award are complex in that that the aim is to promote an inclusive and dynamic community. The means by which this can be achieved is by building within the Capital of Culture programmes the mechanisms to ensure participation by residents of Liverpool and the wider area. Participation means many things, from the planning of the programme, participating in events, being given the opportunity to access employment in the growing cultural industries sector.The outcome of this process will feed into one of the key characteristics of what makes a successful City, a reduction in the inequality of how people participate in cultural activities and benefit from the income generated by the sector (see Box 4.2).
Box 4.2 Raising Aspirations
Source: Giving Voices, Dreaming Dreams Community Planned Projects for the LiverpoolCapital of Culture Bid, February 2002
The Capital of Culture ‘local’ targets include three measures which aim to involve people in the process of building up to and hosting 2008 and involving people in current and future cultural activities. This is most clearlystated through Target 2 which aims for ‘A culturally aware and active community’. The target set is for 75 per cent of the population to be involved in some form a cultural activity and for the national index to rise to over 100.This supported by a range of six targets which define the principles for working toward maximising local community participation (see Box 4.3).
The City of Dreams has been an ambitious partnership between artists, community groups and economic and social agencies. Over 140 people from three neighbouring communities became deeply involved in creating this community music and film project. This project was managed by the Alt Valley Cluster Partnership which works to regenerate the north east district of Liverpool. The Cluster comprises the five wards of Clubmoor, Pirrie, Gillmoss, Fazakerley, and Warbreck and has a population of 80 000. City of Dreams was premiered at a local community centre before being installed in the Bluecoat Art Gallery.
“It was fantastic and I loved it, assisting the cameraman, going out on location, being in the editing room, the whole experience. I have the DVD of the film in my portfolio, references and I’m planning to apply to LIPA (the Liverpool Institute of Performing Arts) to do camerawork, or maybe theatre technology. I know I am going to do well.”
Neil Holloway, aged 15
ERM E CONOMICS FINAL REPORT LIVERPOOL CITY COUNCIL
37
Box 4.3 Liverpool’s 2008 Programme and Local Participation
Key targetsTarget 1:Policies on all key public sector agencies to reflect principles of cultural equity, involvement and participation.Target 2:International recognition for the standards of excellence, innovation and range of cultural projects and programmes by and for under represented groups forming part of Capital of Culture Programme.Target 3:Children, young people and students in all Liverpool’s school, colleges and universities participating fully in the Capital of Culture programme.Target 4:An employment strategy delivering a range of work and training opportunities for local people.Target 5:Systematic action to remove barriers to involvement and participation (eg improving disabled access and lowering financial constraints).Target 6:Formal and informal consultations with stakeholders on Capital of Culture programme and City Cultural Strategy.Source: Liverpool Culture Company
In the development and shaping of the bid programme the City and its partners are working towards endorsing these principles and developing the action plans by which they will be implemented. These principles are embedded in the programmes already active and those being developed. The programme for 2003 and 2008 is an outline, but it provides an illustration of the indicative outputs from the Capital of Culture bid programme. The programmes follow the themed years, with events focused on tackling participation of under represented groups. Table 4.9 illustrates the intermediate outputs from the programmes.
ERM E CONOMICS FINAL REPORT LIVERPOOL CITY COUNCIL
38
Table 4.9 Socio-Economic Impacts – Intermediate Outputs
Year Focus Outputs2003 Celebrating Learning
Learningopportunities for residents
23874 participants in planned programmes of which:100 diverse communities involved450 schools participating
2004 Faith and CommunityService
Engage andcelebrateLiverpool’s diverse communities
Monthly events programme focused on celebrating the main festivals of each world faithParticipation of the 100 communities in the CityVolunteers recruited
2005 Celebrating the Arts
Developingcommunity arts
100 new commissions 1 000 events10 000 community participants100 000 new visitors to venues£4m additional funds attracted to support local art
2006 Year of Sport
Promotion and participation of sports across the City
Sporting passport for all residents (up to 400 000)Mater class programme for schoolsMajor international events calendar (Golf, Gymnastics, Tennis, Boxing, Youth football, Clipper Race) attracting new visitors
2007 Celebrating Heritage
A look back at history and interpreting today
Series of lectures and eventsThe opening of new heritage venues with increased visitors
2008 Capital of Culture Monthly programme of world class events attracting visitors from Europe and across the globe
2009 Celebrating the Environment
Reviewingachievements
Review of the achievements of the past five years investment programme in raising the quality of the environmentDeveloping future partnerships with key waterfront city regions
2010 Celebrating Innovation
Sea port to E port The promotion of the way i n which the City has changed and the development of a modern industrial structureConferences, events and research programme
Source: LCC and CoC
The above table illustrates the way in which the bid programme seeks to bring in community participation through the process and involve a diverse range of people across the many facets of culture. The overall target will be to engage residents in various aspects of the developing programmes to work towards the overall participation target.
Another key aspect of the strategy is the distributional benefits of the employment opportunities being generated in the cultural industries. The principle of Target 4, one of the local participation targets, is about developing an employment strategy to maximise the benefits for local residents. Through the Liverpool Strategic Employment Partnership a skills and employment strategy is being developed to ensure maximum local benefits from these new jobs, including those which will result from the expansion of the creative,media and arts sectors. The strategy will seek to maximise employment across time and the range of business areas; from construction, to tourism to the creative industries.

ERM E CONOMICS FINAL REPORT LIVERPOOL CITY COUNCIL
39
For example, Liverpool City Council and its partners, including major employers and the CITB, are currently completing the design of a major construction initiative. The Merseyside Construction Initiative aims to achieve a significant improvement in local capacity through an integrated package of action which includes more effective work force planning and work-forcedevelopment, strengthening the competitiveness of local construction firms and improving access to construction jobs for the highest unemployment areas in the city and sub-region.
The impact from the range of programmes that encourage participation can only be fully assessed ex post, through monitoring and evaluation. Whilst the outcomes sought in terms of numbers participating is relatively straightforward, the way in which Capital of Culture impacts on increased community cohesion will need to be demonstrated through softer research programmes.
4.5 CONCLUSIONS
The experience of other cities is that the European Capital of Culture award can deliver long-term benefits through the way in which the ‘brand’ promotes a City. For cities that were in the process of restructuring the impact has been to promote what was great about the City and also facilitate reinvention. This has led to positive legacy outcomes. For Liverpool the Capital of Culture is more than promotion of a City for enhanced tourism, it is about enhancing and promoting the City’s creativity and ensuring distributional benefits through how residents participate – in the leisure and employment opportunities from the growing cultural industries.
ERM E CONOMICS FINAL REPORT LIVERPOOL CITY COUNCIL
40
5 EVALAUTION STRATEGY
5.1 INTRODUCTION
The Liverpool Capital of Culture bid programme sets out the 12 targets that provide a means of monitoring the potential impact and verifying, in due course, the extent to which the desired outcomes have been realised. In orderto assess or evaluate the impact of a successful Capital of Culture bid Liverpool partners need an evaluation strategy. This evaluation strategy provides the plan dealing with the how, what and when questions. In this section we outline a suggested evaluation strategy and a road map for moving forward.
The purpose of an evaluation strategy is to design and install a monitoring and evaluation framework for the bid programmes and core projects that will:
• provide timely monitoring data in the run up to 2008, in order that projects and programmes can be designed and managed so as to ensure maximum impact;
• enable policy makers and partners to assess the impact of projects and programmes , in order to guide investment and funding policies;
• enable residents and organisations to participate in the planning and running of projects; and
• contribute robust data and analysis enabling a full contribution tonational and international research and debate on culture, social cohesion and regeneration.
In addition Liverpool Culture Company and its partners intend that the monitoring and evaluation framework is frugal in its use of resources, without making unrealistic inappropriate demands on the time and resources of projects and programme managers. This highlights the need to work within a framework that has the full support of partners, and is integrated into data collection, research, monitoring and evaluation frameworks operating across the region.
5.2 FRAMEWORK PRINCIPLES
The recommended evaluation framework is intended to be an integrated set of indicators, allocated to categories that allow Liverpool Culture Company and its partners to engage in the full cycle of:
Policy formulation > implementation > monitoring > evaluation > policy review and continued development.

ERM E CONOMICS FINAL REPORT LIVERPOOL CITY COUNCIL
41
A key requirement of any monitoring and evaluation framework is that an appropriate hierarchy of indicators is selected such that:
• Appropriate and timely data is available at each level of (i) policy, (ii) programme and (iii) project implementation;
• Data collection is based on realistic assessment of the resources (especially staff) required in its collection;
• Resource frugality is built into the framework such that data is collected in compatible formats, data sets can contribute to multiple indicatorssurveys, questionnaires etc are and that data sources are not repeatedly required to provide similar data at short intervals;
• Statistically significant robust longitudinal and cross-sectional data sets are produced; and
• There is clear responsibility for the collection transmission, collation, analysis of data, and a clear requirement on policy makers, project managers etc to consider the implications of the data. The implication of this is that contracts, job descriptions, service level agreements etc should make explicit reference to the contributions required for monitoring and evaluation.
Where appropriate indicators proposed are sub-sets of higher level indicators, such that the impact of Capital of Culture can clearly be seen to be contributing to wider social, economic, health etc, objectives for the city and the region. The comprehensive categorisation of the framework will enable the culture strategy, including the 2008 Capital of Culture programme to be evaluated from the required range of perspectives, including social inclusion, cohesion and regeneration.
5.3 EXISTING DATA SOURCES
The nature of the potential impacts of the programme envisaged with a successful Capital of Culture bid are wide ranging and cut across a range of social, economic and environmental impacts. The philosophy of the City Council is that the bid is central to the development and regeneration of the City and the concept of strong City regions. The indicators that reflect this broad programme are vast and in many cases are already collected for other purposes (for example tourism statistics, inward investment inquiries, participation in leisure services etc). Moreover, given the current focus on urban renaissance within government and partnerships, such as the CoreCities programme, the development of tracking data to monitor the change in City well-being, is being advanced.
In preparing the outline framework we are highly conscious of a significant number of data sets that directly relate to the proposed Capital of Culture
ERM E CONOMICS FINAL REPORT LIVERPOOL CITY COUNCIL
42
monitoring and evaluation framework. Liverpool is a leading participant in national and European research and debate on the role of culture in creating a cohesive, vibrant, successful and internationally competitive city. For example it participates in Eurocult 21, the UK Core Cities programme and supports independent research in this area as well as playing a full part in national work such as the development of Quality of Life indicators, Safer Cities and community health frameworks.
Key datasets relevant to the 12 programme targets include:
• Specific data sets collected at regional and sub regional levels particularly Liverpool Vision, Liverpool First, the Regional Intelligence Unit (RIU) and the Merseyside Local Authorities for broad socio-economic and sectoral data;
• Tourism and visitor data as well as regular visitor surveys;
• Sector analysis and benchmarking of clusters such as the cultural and creative industries (being led by NWDA and its partners and the RIU);
• Sports England research and monitoring of sports participation - Sport Equity Index; and increasingly, the connections between sport participation and health;
• Merseyside Health Action Zone; ‘Information for Health’;
• European, National Regional and sub regional economic and regeneration data sets, including project and programme monitoring data required by investors and funding agencies eg Objective 1; and
• Education and Lifelong learning data sets.
The review of currently available data sets and framework of indicators shows:
• The vital need to co-ordinate the monitoring and evaluation of the integrated and partnership driven culture strategy for Liverpool, including the co-ordination of data collection, sampling methodology, selection of data sets, etc, to inform research, monitoring, review and policy setting:
• The need for individual organisations to make clear distinctions between the data they and their partners need for:
• Ensuring individual projects, events, achieve their expected goals(project management);
• Identifying and reaching intermediate targets (programmemanagement);

ERM E CONOMICS FINAL REPORT LIVERPOOL CITY COUNCIL
43
• Understanding how their intermediate targets contribute to higher level objectives (strategy management).
• An appropriate hierarchy of data in order to provide information for project managers, programme managers, policy makers as well as investors, funders, and communities.
We have prepared a long list of data sources and their potential application to monitoring the 2008 programme (Annex B).
5.4 METHODOLOGIES
The main types of approaches to assessing the impact of the Capital of Culture bid on the city are outlined in Table 5.1. The table shows a mix of qualitative and quantitative techniques. As many of the outcomes are softer such as perceptions of Liverpool as a place there will be a need to use survey-basedtechniques. However, many quantifiable data sets such as property prices or population change are indicative of how well a location is doing.
Table 5.1 Evaluation Methods
Methods Application Examples of UseAnalysis of programmes or activity data base(s)
Annual take-up and performance of project and programmes
Take up of learning opportunities
Time series analysis Secondary data sources that provide a useful leading indicator or historical impact
Changes in origin of visitors to the City
Cross sectional or cohort analysis
Examining characteristics of a group compared to the population
Looking at the take up and use of the Sports CardLongitudinal analysis of parts of the population
Surveys To examine specific issues across the range of impact areas in the run up to the event or after the event
Visitor perceptionsInward investor perceptions
Face to face interviews Specific issues Barriers to participation and impacts
Focus groups Specific issues Barriers to participation and impacts
Listening to the people As above but can use media or web based technologies
Instant feedback on programme or benefits to the city
Case study approach Specific issues that are complex and dependent on the wider environment
Area based reviews of participation and cohesion in community
Economic modelling Internally consistent means to assess quantifiable impacts
Macro and sector economic changes in City
Source: ERM
ERM E CONOMICS FINAL REPORT LIVERPOOL CITY COUNCIL
44
Any monitoring framework that is to succeed in capturing the range of impacts of cultural strategy must recognise the variety of data sets and analysis techniques that are required. This needs to include discursive yet analytic and robust reports which include insights from participants, communities and organisers as well as programme managers. These can provide cogent insights and assessments of difficult to measure connections and impacts, particularly in the area of social cohesion, inclusion and individual and community confidence, development and aspirations. An excellent example is a review of 24 community driven culture projects supported by The Culture Company - “Giving Voice, Dreaming Dreams”.
The measurement of impact always involves a balance between the desire to capture the whole range of activities and all their potential consequences and the need to maintain an appropriate balance in the allocation of resources between development, delivery and monitoring/evaluation.
The outline framework proposed in this report aims to be the basis for a comprehensive set of indicators. The comprehensiveness is likely to require the introduction of a full framework on a planned, phased basis. A phased introduction will enable testing of estimates of accuracy, reliability and resource implications to be undertaken. Moreover, findings from research in this area are emerging regularly and policy guidance is in a state of flux. The phasing of the establishment of the monitoring framework will enable these developments to be incorporated. The following framework therefore requires a degree of selectivity on the part of programme co-ordinators and project managers and sponsors.
In particular, great care is required in the design of sample surveys. The emphasis has to be on achieving a design ‘fit for purpose’ such that (i) resource requirements are minimised and, vitally, (ii) the minimum number of residents, venues etc are required to participate in surveys, commensurate with obtaining sufficiently robust data. In defining the robustness required, Liverpool Culture Company and its partners must retain a pragmatic approach, and retain a focus on the purpose of the data set. Especially where linkages are indirect and multi faceted, it may be impossible ever to have 100 per cent certainty over the impact of a particular programme, but over time, with selective and effective techniques, obtain sufficient evidence to provide a cogent contribution to policy making and programme design.
Our terms of reference exclude the monitoring arrangements to ensure excellence in delivery of cultural activities. Of course these will be a core element of the quality system operated by Liverpool Culture Company in its management of the Capital of Culture programme and related activities. This immediate, and fundamental impact of the project is of course a vital component of the monitoring of the bid programme. Again a monitoring and evaluation approach which incorporates subjective views, such as “Giving Voice, Dreaming Dreams” will play an important role.

ERM E CONOMICS FINAL REPORT LIVERPOOL CITY COUNCIL
45
5.5 RECOMMENDED EVALUATION STRATEGY
5.5.1 Monitoring and Evaluation Framework
A standard approach to the evaluation of any public sector intervention is to develop a framework that incorporates the following key stages:
• Baseline review and updating: Setting out the baseline indicators and having a plan to update the baseline as required;
• Annual monitoring : A programme that provides an annual report on the intermediate outputs of the process (eg the number of events run, participants or overseas visitors to events);
• Process review(s): A review of how the process of delivery or management of the programme is proceeding and any issues that have arisen (for example is the target group aware of a programme);
• Interim evaluation or review(s): A planned programme of reviews that seek to evaluate the intermediate outputs against the targets and to draw early lessons that can be fed back in the design of programmes and projects in order to ensure the outcomes will be achieved; and
• Final evaluation: An evaluation that seeks to draw all aspects together and assess whether the outcomes have been achieved, the lessons learnt and the value for money indicators of the intervention.
In undertaking any monitoring and evaluation process is important to be very clear about the programme or project that is being monitored. An evaluation of a Liverpool successful Capital of Culture bid should seek to assess to additional contribution that the bid has made to the targeted outcomes. It would be very easy to fall into the trap of seeking to evaluate the impact of all cultural sector public interventions over the period. Such an approach would in effect be evaluating the combined impact of a significant part of public sector regeneration activity. This wider evaluation exercise is already planned within the Objective 1 programme and within other agencies projects and programmes.
The specific evaluation questions for the Capital of Culture are how the bid delivers direct outcomes (eg cross cutting cultural programmes, supporting or encouraging new creative industries, or attracting new visitors through the extra marketing effort), influences other programme (eg through synergies or bending mainstream programmes) enhances the use of existing assets orattracts inward investors (through the brand effect) and encourages participation, through the raised profile that the award brings to cultural activity.

ERM E CONOMICS FINAL REPORT LIVERPOOL CITY COUNCIL
46
Baseline
The impact target area for the European Capital of Culture bid is Liverpool and Merseyside. It is recognised that there are spillover effects for the region and the axis with Manchester but these are secondary effects. There is already an established process that seeks to monitor the changes in the baseline of the conurbation and City across a wider range of indicators through City partners and Liverpool First. This baseline and monitoring system also incorporates the monitoring of ‘culture’ using a basic set of indicators. We recommend that this be developed as the foundation for the baseline and monitoring of secondary data.
In addition to this there will be a need to develop specific baseline information that do not lend themselves to off the shelf secondary data to assess outcomes at a later stage. For example the extent to which under represented groups do indeed participate in cultural activities. These baseline studies need to be managed as part of the overall core programme.
Annual Monitoring Strategy
A key role in the evaluation strategy is the examination of the core programme being delivered by The Liverpool Culture Company and its partners. This monitoring will provide early indicators of the extent to which the intermediate outputs are being achieved (for example the penetration of the marketing effort or the take up of social inclusion programmes). This monitoring process will need to have a clear reporting output and feed into regular review by the management of the programme. We would also recommend a ‘State of the Nation’ type address to citizens outlining progresson delivering the build up to 2008.
Table 5.2 outlines a selection of key indicators against the programme targets.The letter and number reference relates to the data audit tag provided in Annex B. This provides details of the source of the data, its adequacy and the lead agency.
Many of the target areas are already embedded within the wider monitoring programme of social and economic progress of the City. The standard reporting of tourism, leisure services and best value through the City’s Performance Plan provide much of the basic data. In some cases there is a need for specific monitoring where there are new Capital of Culture programmes of the need to enhance or extend existing monitoring activities to enable tracking of progress against the 12 targets. This primarily relates to assessing the impact of Capital of Culture and perceptions, locally, nationally and internationally.

ERM E CONOMICS FINAL REPORT LIVERPOOL CITY COUNCIL
47
Table 5.2 Monitoring Key Performance Indicators
LOCAL Objectives Targets Monitoring KPI1. A stakeholding residential
base that is proud of its city and committed to the project.
1.1 25 000 ‘champions’ by 2007
SC7 Volunteers.
2. A culturally aware and active community
2.1 ‘Cluster’ areas linkedtogether throughcultural programmes and events.
2.2 75% of the residential population involved in some cultural activity and attendance figures rise to over 100 on national index.
2.3 One unique, world-classcultural event a year 2005 – 7; 4 in 2008.
C2 Code of practice.C3 CoC Business Plan.
P5, P6, P7, P8, SH1, SH2, Sh4 -events, attendance, library use, sports and leisure participation.LCC Performance Plan.E6 City Residents Survey.
C4 – Number of events.
3. Reinforce image as a visitor friendly city
3.1 1000 Cabbies trained.
3.2 3000 Frontliners trained.
SC7 – VolunteersSC7 – Volunteers
E1B Bi Annual Benchmarking Survey.E6A/E6D City Centre perceptions survey.
REGIONAL Objectives4. Consolidating Liverpool’s
regional role for business and tourism.
4.1 Liverpool as a key destination in the North West for cultural, creative and tourism businesses.
AP1 Film enquiries.AP3 Investor enquiries.DCI 4 SMEs & micro enterprise.DCI 5 Days filming.E1A Visitor Surveys.E7 Cultural Industries.Benchmarking Study.
5. Enhancing regionalpartnerships and campaigns.
5. 1 A dynamic and fruitful relationship with all marketing partners across the North West.
C2 Code of practice.C3 CoC Business Plan.
6. Increasing visitor number from rest of region.
6. 1 An increase of 30% above benchmark by 2008.
E1A-E Visitor surveys.
NATIONAL Objectives
7. Re-positioning the city’s national image – to be in top 10 in UK image league.
7. 1 An increase in the propensity to visit Liverpool.
AP5 EC business leaders survey.E5A Inward Investment Inquiries.E5B Inward Investment.
8. Increasing numbers and length of stay visitors from UK – leisure and conference.
8.1 Anticipated 10% growth year on year until 2005 and accelerating to an average of 15% growth until 2010.
E1 Visitor survey.
EUROPEAN Objectives9. Reposition with cultural
image focusing on strengths, especially in visual arts and popular culture.
9.1 An increase in the propensity to visit Liverpool.
AP4 EC Culture professionals.E1 Visitor surveys.E7 Cultural Industries.Benchmarking study.

ERM E CONOMICS FINAL REPORT LIVERPOOL CITY COUNCIL
48
10. Increasing numbers and length of stay visitors from Europe
10. 1 Anticipated 6 – 7% growth year on year
(3 – 4% above standard).
E1 Visitor surveys.
WORLDWIDE Objectives11. Building on cultural
reputation to promote Liverpool as a world city.
11.1 An increase in the propensity to visit Liverpool.
E1A Five yearly visitor survey.
12. Establish as premier ‘must do’ destination on UK itinerary – increasing numbers and length of stay visitors from the rest of the world – particular focus on USA and Japan.
12.1 Increase proportion of overseas visitors to 40% (2000 base = 24%).
E1A Five yearly visitor survey
Source: LCC and ERM
Process Review and Interim Evaluations
The use of process and interim reviews provide a more detailed mechanism to investigate aspects of the bid programme that may have an influence on the final outcome. To be effective there is a need for instant response. However, to contribute to an in depth understanding there is a need to develop longer-term research programmes.
At this stage of the bid process we would suggest that The Liverpool Culture Company and its partners look at conducting a process review focused on local participation issues and a series of themed interim evaluations that review and learn from each year of the programme. The process review work will be important to assess how well approaches are working to enable people to engage in the Capital of Culture planning and employment opportunities.Table 5.3 sets out an outline programme.
Table 5.3 Process and Interim Evaluations
Type and year FocusProcess review 2003 - 2007 Examining participation across the range of programmes Interim review 2003 The socio-economic impact of the CoC year of Learning and
maximising local employment opportunitiesInterim review 2004 Contribution of CoC year of Faith to community cohesionInterim review 2005 Impact of CoC year of arts on the development of local capacityInterim review 2006 Wider community benefits of grater participation in sports Interim review 2007 Importance of cultural heritage and socio-economic success Interim review 2008 European experiences of the socio-economic impact of CoC and
Liverpool’s experience Interim review 2009 Contribution of CoC to the City environment Interim review 2010 The linkages between cultural investment and successful cities –
the experience of Liverpool Source: ERM

ERM E CONOMICS FINAL REPORT LIVERPOOL CITY COUNCIL
49
As part of Liverpool’s continuing commitment to this area, it is recommended that Liverpool Culture Company promote a Cultural Strategies and Social Impact Symposium during 2008. The interim reviews would feed in to the final evaluation and also prepare the ground for the 2008 symposium.
Final Evaluation
The final evaluation is all about the legacy of the Capital of Culture award and what has been achieved. This will seek to evaluate the success of the event as a public sector intervention and learn the lessons for the future. To evaluate the impact on the wide range issues that the programme seeks to influence this study should be conducted after the year of Innovation in 2010.
5.5.2 Monitoring Action Plan
Because the framework is comprehensive and some data is currently incomplete, it is desirable that Liverpool Culture Company and its partners decide on the:
• phasing of the introduction of the framework; and
• selection of Leading Indicators, ie those indicators that will provide policy makers and programme directors with data on the overall success of the policy.
The Liverpool Culture Company, Liverpool City Council and Liverpool Partnership Group adopt a clear timetable and action plan for finalising (i) the monitoring framework (ii) the management arrangements (iii) resources required. Outcomes from the action plan will include:
• Selection of key and leading indicators;
• Confirmation of the individual components of the framework and the sources frequency etc of data;
• Written agreements from agencies on their roles and responsibilities;
• Preparation of an annual planning cycle clearly showing key components;
• Timetable for the phasing of the introduction of the framework; and
• Costed plan for preparation of reports, and other costs including surveys.
This could be built up through the business planning process.

ERM E CONOMICS FINAL REPORT LIVERPOOL CITY COUNCIL
50
5.5.3 Timetable
Table 5.4 provides an outline timetable for the monitoring and evaluation plan.
Table 5.4 Timetable
March 2003 The Liverpool Culture Company, Liverpool City Council and Liverpool Partnership Group establish monitoring working group to develop monitoring framework, including identification and sources of resource requirements.
April 2003 Working Group discussions with key partners monitoring, evaluation and research. Workinggroup propose initial phasing of monitoring framework with overall framework.
May 2003 The Liverpool Culture Company, Liverpool City Council and Liverpool Partnership Group agree initial phasing of monitoring framework
The Liverpool Culture Company preparesAction Plan for installing Phase 1 of monitoring framework.
June 2003 - July 2003 Collection and collation of base-line data (informs installation of framework).
June 2003- September 2003 Installation of Phase 1 of monitoring framework.
September 2003 Joint Culture Company and Liverpool Partnership Group report on monitoring framework and initial analysis of baseline data.
October 2003 Phase 1 Monitoring Framework goes live.March 2004 Joint report on performance of Phase 1
implementation and recommendations for Phase 2 of the monitoring framework.
Source: ERM
5.5.4 Gaining Ownership
It is recommended that Liverpool Culture Company organise a number of seminars with participating venues, projects and events, at an early stage so that:
• there is acceptance and understanding of the need for the monitoring and evaluation framework;
• roles and responsibilities are clearly understood; and
• benefits of monitoring to the agencies are clearly spelt out, so that any data collection and transmission requirements are not seen as an unalloyed burden.

ERM E CONOMICS FINAL REPORT LIVERPOOL CITY COUNCIL
51
5.5.5 Monitoring and Evaluation Management Arrangements
Strategy Level
It is recommended that one organisation undertake the function of organising, co-ordinating and undertaking the strategic level review of the leading indicators and the performance of the monitoring framework. Because Liverpool Culture Company will be focused primarily on ensuring successful implementation and on going project monitoring, we consider that Liverpool City Council or Liverpool Partnership Group undertake this role. Both organisations have a systematic approach to targets, milestones and performance indicators, and operate at the strategic level of cultural strategy (amongst others).
Liverpool Partnership Group may be best placed to fulfil this role because it does not itself operate cultural programmes that form part of the Capital of Culture programme, and is therefore able to concentrate solely on this function. Of course Liverpool City Council has considerable experience in strategic management monitoring and evaluation.
Key requirements:
• Able to work across organisational boundaries;
• Liaise effectively with a variety of organisations;
• Expertise and organisational capacity to co-ordinate a variety of data sets; and
• Ability to ensure that research/monitoring and evaluation resources are levered across programmes. For example by co-ordinating annual surveys etc.
Clearly, this function requires the budgeting of adequate resources from strategic partners, specifically allocated to this function.
Where data collection requires sample surveys of project participants, residents, visitors, etc, cross agency liaison and appropriate resource allocation will be of particular importance. In particular it is necessary to ensure adequate planning and co-ordination of surveys to (i) minimise resource use (ii) avoid survey ‘exhaustion‘ on the part of respondents.
Programme Level
The Liverpool Culture Company will be co-ordinating and organising delivery of Capital of Culture. Naturally it will wish to monitor and evaluate its activities on a project by project basis. It is therefore recommended that it is responsible for ensuring that systems for collecting project based data are in

ERM E CONOMICS FINAL REPORT LIVERPOOL CITY COUNCIL
52
place and working effectively. Clearly, close liaison is required between individual projects, venues etc on the one hand, and Liverpool Partnership Group on the other, to avoid duplication, create robust systems, and to promote resource frugality.
Project Level
It is recommended that individual project managers should be responsible for ensuring the recording and collection of routine project specific data, as set out in the agreed monitoring framework.
ERM E CONOMICS FINAL REPORT LIVERPOOL CITY COUNCIL
53
6 CONCLUSIONS
6.1 LIVERPOOL’S CAPITAL OF CULTURE PROGRAMME
Liverpool’s Capital of Culture programme is built on its history as a city with world links through trade and transportation. The ‘World in One City’ bid starts in 2003 with a `time-line` of themed years which aim to strengthen Liverpool’s ability to stage the Capital of Culture Year. The year themes are 2003: Celebrating Learning; 2004: Faiths and Community Service, 2005: Arts; 2006: Sport and 2007: Heritage. In 2007 the City celebrates its 800th
Anniversary since gaining its Royal Charter and the main programme of events planned for 2008 is the start of a process that will take the City forward with an increased level of confidence. The sub themes of Create, Participate and Regenerate, aim to ensure that the impact of the bid programme and associate investment is maximised. This approach involves the nomination of 2009 as the year of Celebrating the Environment, followed by the year of Celebrating Innovation in 2010.
The outcomes that the City wishes to achieve through a successful Capital of Culture Bid are seen as threefold:
• Sustainable Cultural Infrastructure: To increase and enhance the cultural infrastructure, encouraging new products, processes and enterprises in the cultural and creative industries sector;
• An Inclusive and Dynamic Community: To increase local partic ipation in cultural activities and increase community cohesiveness; and
• A Premier European City: To have improved the range and quality of the City’s infrastructure with City centre and community renewal.
The above outcomes are to be achieved through the synergy of existing City-wide investment programmes and activities with the potential impact that Capital of Culture could realise in the run up to 2008, the year itself and through its legacy effect.
6.2 BASELINE CONTEXT
Liverpool’s recent economic performance includes employment growth above the regional average. In the three years to 2001 employment growth in Liverpool averaged 4 per cent, above that of the North West region at 3.5 per cent. Over the past decade the City has seen rapid growth its cultural industries and in particular the expansion of the creative industries and tourism sector. Employment in the cultural industries over the decade to 2001 grew by 23 per cent with creative industries growing by 45 per cent. Liverpool has benefited from increasing its specialisation in the areas of computer games

ERM E CONOMICS FINAL REPORT LIVERPOOL CITY COUNCIL
54
and software, electronic publishing, designer fashion and radio and TV production. At the same time the City centre’s population has grown over the last decade with increased property prices and new housing, an indication of the growing confidence in this European City.
6.3 CITY WIDE INVESTMENT STRATEGY
Over the next five years the City will see the expansion of its cultural sector through the investment of over £2 billion. Public sector partners (including Liverpool Vision, the Urban Regeneration Company, the North West Development Agency, English Partnerships, the EU and Liverpool City Council) are planning cultural investment schemes worth £1 billion with a further £1 billion private sector investment. This investment will bring forward developments in the City and on the Waterfront, as well as a range of projects to increase participation and learning in the cultural industries. This includes landmark buildings such as the 4th Grace, the redevelopment of Kings Waterfront and a Cruise Liner Terminal at Pier Head. The nomination by the Government of UNESCO World Heritage Site Status to the Liverpool Waterfront is in recognition of this asset. Private sector investment will bring forward the redevelopment of the City’s retail heart through the Paradise Street Development Area, as well as new investment in city centre housing and hotels. This investment will reinforce the City’s role as a regional shopping centre, its role as a UK and European tourism destination and its cultural heritage. The City Wide regeneration programmes were supplied by the Liverpool City regeneration team and indicate some 12 000 gross jobs will be supported through these initiatives.
6.4 SOCIO ECONOMIC IMPACT
A successful Liverpool City of Culture 2008 bid provides a unique opportunity for the City, UK and the European Union to leverage the investment that has taken place over the past decade to regenerate the City and in supporting investments planned to 2008. As has been shown in other successful Capital of Culture cities the award provides for an economic legacy through sustained tourist growth, as well as benefits from an increased profile with international investors.
We estimate that employment in the ‘cultural sector’ (defined as tourism, sports, heritage and the creative industries) could grow by some 13 200 direct jobs in Liverpool by 2012 based on trend growth, new cultural investments and a successful Capital of Culture bid.
This growth in cultural industries is underpinned by an additional £ 310m of tourism expenditure by 2012 at a total of £571m, increasing from £261m in 2000. The impact would be spread as overseas visitors take the opportunity to explore the cultural assets of the North West region with an estimated 2900 jobs supported.
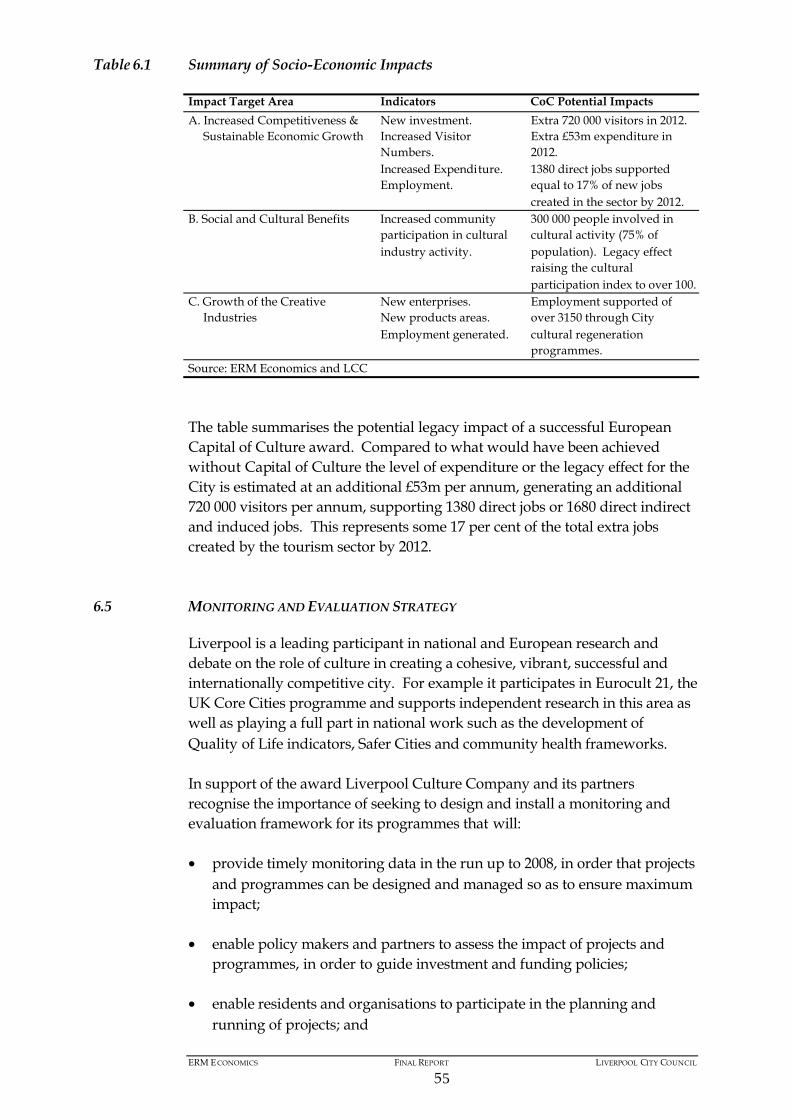
ERM E CONOMICS FINAL REPORT LIVERPOOL CITY COUNCIL
55
Table 6.1 Summary of Socio-Economic Impacts
Impact Target Area Indicators CoC Potential ImpactsA. Increased Competitiveness &
Sustainable Economic GrowthNew investment.Increased Visitor Numbers.Increased Expenditure.Employment.
Extra 720 000 visitors in 2012. Extra £53m expenditure in 2012.1380 direct jobs supported equal to 17% of new jobs created in the sector by 2012.
B. Social and Cultural Benefits Increased community participation in cultural industry activity.
300 000 people involved in cultural activity (75% of population). Legacy effect raising the cultural participation index to over 100.
C. Growth of the Creative Industries
New enterprises.New products areas.Employment generated.
Employment supported of over 3150 through City cultural regeneration programmes.
Source: ERM Economics and LCC
The table summarises the potential legacy impact of a successful European Capital of Culture award. Compared to what would have been achieved without Capital of Culture the level of expenditure or the legacy effect for the City is estimated at an additional £53m per annum, generating an additional 720 000 visitors per annum, supporting 1380 direct jobs or 1680 direct indirect and induced jobs. This represents some 17 per cent of the total extra jobs created by the tourism sector by 2012.
6.5 MONITORING AND EVALUATION STRATEGY
Liverpool is a leading participant in national and European research and debate on the role of culture in creating a cohesive, vibrant, successful and internationally competitive city. For example it participates in Eurocult 21, the UK Core Cities programme and supports independent research in this area as well as playing a full part in national work such as the development of Quality of Life indicators, Safer Cities and community health frameworks.
In support of the award Liverpool Culture Company and its partners recognise the importance of seeking to design and install a monitoring and evaluation framework for its programmes that will:
• provide timely monitoring data in the run up to 2008, in order that projects and programmes can be designed and managed so as to ensure maximum impact;
• enable policy makers and partners to assess the impact of projects and programmes, in order to guide investment and funding policies;
• enable residents and organisations to participate in the planning and running of projects; and
ERM E CONOMICS FINAL REPORT LIVERPOOL CITY COUNCIL
56
• contribute robust data and analysis enabling a full contribution tonational and international research and debate on culture, social cohesion and regeneration.
The monitoring programme aims to track the 12 targets set out in the bid programme covering local, regional, UK level and World Wide indicators of success. The tracking of these indicators along with a programme of interimevaluations built around the bid year themes will enable a final evaluation to be conducted post 2010. The final evaluation will seek to tease out the relationship between a successful Capital of Culture award and the position of Liverpool in Europe, the UK and within the North West region. Specifically the outcomes that need to be tested relate back to the World In One City aims of:
A Sustainable Cultural Infrastructure;An Inclusive and Dynamic Community; and
A Premier European City.
It is recommended that Liverpool Culture Company, Liverpool City Council and Liverpool Partnership Group adopt a clear timetable and action plan for finalising (i) the monitoring framework (ii) the management arrangements (iii) resources required. Outcomes from the action plan will include:
• Selection of monitoring Leading Indicators and confirmation of the individual components of the framework;
• Written agreements from agencies on their roles and responsibilities;
• Preparation of an annual planning cycle clearly showing key components;
• Timetable for the phasing of the introduction of the framework; and
• Costed plan for the framework.
In recognition of the complex nature of the socio-economic impacts it is recommended that Liverpool host a conference in 2008 on Cultural Strategy and Social Impact sharing the lessons learnt in the years leading up to 2008 and drawing together the work of other European and international partners on the value and relevance of culture to urban policy and regeneration strategy. This conference would feed into the post 2010 final evaluation.

Annex A
Cultural and Creative Industries

ERM ECONOMICS FINAL REPORT LIVERPOOL CITY COUNCIL
A1
A1 CULTURAL AND CREATIVE INDUSTRIES
A1.1 CULTURAL AND CREATIVE DEFINITION
The definition of what exactly a ‘cultural’ and ‘creative’ industry is, is something that seems obvious at first when the term is loosely applied to museums, the arts and entertainment. Once there is a need to tie down the definition is becomes more difficult.
The Department of Culture, Media and Sport (DCMS) provide a definition for Creative Industries using the Standard Industrial Classification (SIC) codes in order to provide a means for collecting baseline and comparison data and some papers have tried to add to this creative industry definition to provide a separate definition for cultural industries but these papers are not official definitions for the purpose of data comparison.
A1.1.1 Creative Industries Definition
There is a list of broad categories that cover the creative industry:
Advertising (1); Architecture (2); Art and antiques trade (3); Crafts (4); Design (5); Designer fashion (6); Video, film, music and photography (7); Interactive leisure software (8); Music and the visual and performing arts (9&10); Publishing (11); Computer games, software, electronic publishing (12); and Radio and TV (13).
The concept of ‘creative industries’ can be traced back to the 1997 British General Election however the measurement, monitoring and analysis of these industries and their role in the UK economy is still at an early stage(1). The DCMS Mapping document of 1998 was the first attempt to try and identify and analyse these industries using the SIC codes. There are differences between the definition and sub sectors described in the mapping document and the sub sectors classified for official data collection (ie SIC codes).
(1) Source: Caroline Brown, Stephen Creigh-Tyte and Christiane Radin, June 2002, 'UK Creative Industries: Their Growth During the 1990s and Prospects for the 21st Century', ACEI 2002 Conference: Rotterdam.
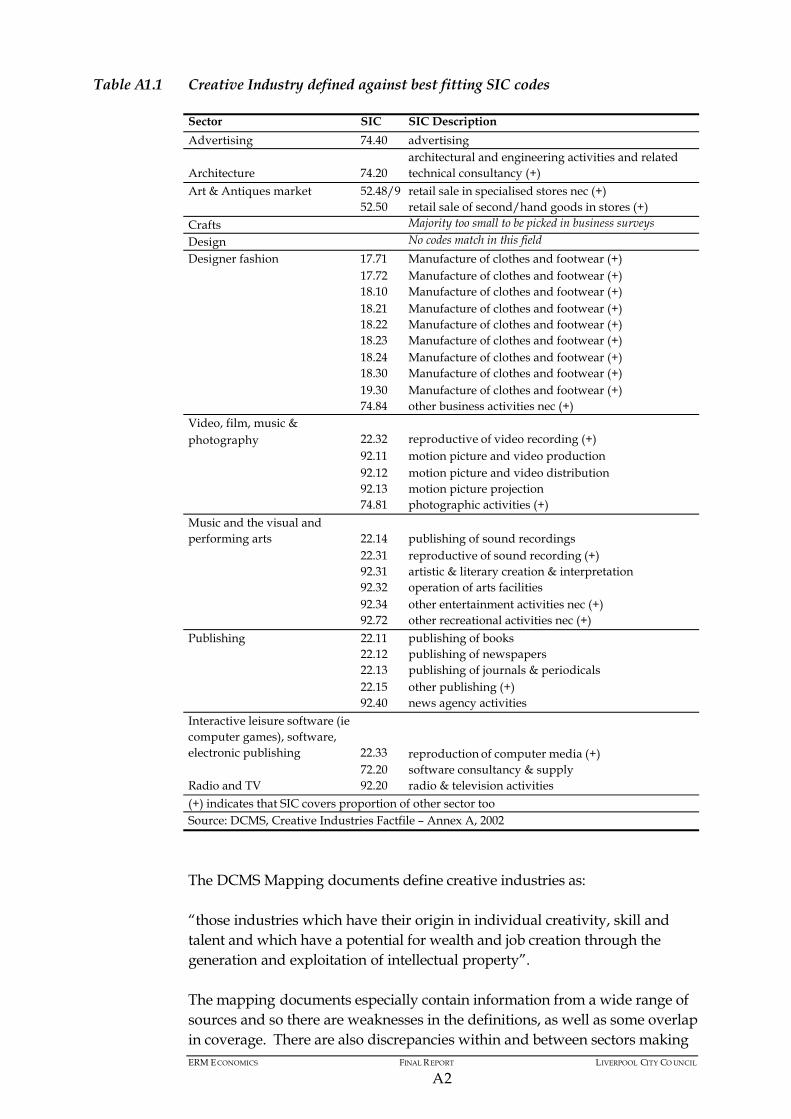
ERM E CONOMICS FINAL REPORT LIVERPOOL CITY CO UNCIL
A2
Table A1.1 Creative Industry defined against best fitting SIC codes
Sector SIC SIC DescriptionAdvertising 74.40 advertising
Architecture 74.20architectural and engineering activities and related technical consultancy (+)
Art & Antiques market 52.48/9 retail sale in specialised stores nec (+)52.50 retail sale of second/hand goods in stores (+)
Crafts Majority too small to be picked in business surveysDesign No codes match in this fieldDesigner fashion 17.71 Manufacture of clothes and footwear (+)
17.72 Manufacture of clothes and footwear (+)18.10 Manufacture of clothes and footwear (+)18.21 Manufacture of clothes and footwear (+)18.22 Manufacture of clothes and footwear (+)18.23 Manufacture of clothes and footwear (+)18.24 Manufacture of clothes and footwear (+)18.30 Manufacture of clothes and footwear (+)19.30 Manufacture of clothes and footwear (+)74.84 other business activities nec (+)
Video, film, music & photography 22.32 reproductive of video recording (+)
92.11 motion picture and video production92.12 motion picture and video distribution92.13 motion picture projection74.81 photographic activities (+)
Music and the visual and performing arts 22.14 publishing of sound recordings
22.31 reproductive of sound recording (+)92.31 artistic & literary creation & interpretation92.32 operation of arts facilities92.34 other entertainment activities nec (+)92.72 other recreational activities nec (+)
Publishing 22.11 publishing of books22.12 publishing of newspapers22.13 publishing of journals & periodicals22.15 other publishing (+)92.40 news agency activities
Interactive leisure software (ie computer games), software, electronic publishing 22.33 reproduction of computer media (+)
72.20 software consultancy & supplyRadio and TV 92.20 radio & television activities(+) indicates that SIC covers proportion of other sector tooSource: DCMS, Creative Industries Factfile – Annex A, 2002
The DCMS Mapping documents define creative industries as:
“those industries which have their origin in individual creativity, skill and talent and which have a potential for wealth and job creation through the generation and exploitation of intellectual property”.
The mapping documents especially contain information from a wide range of sources and so there are weaknesses in the definitions, as well as some overlap in coverage. There are also discrepancies within and between sectors making
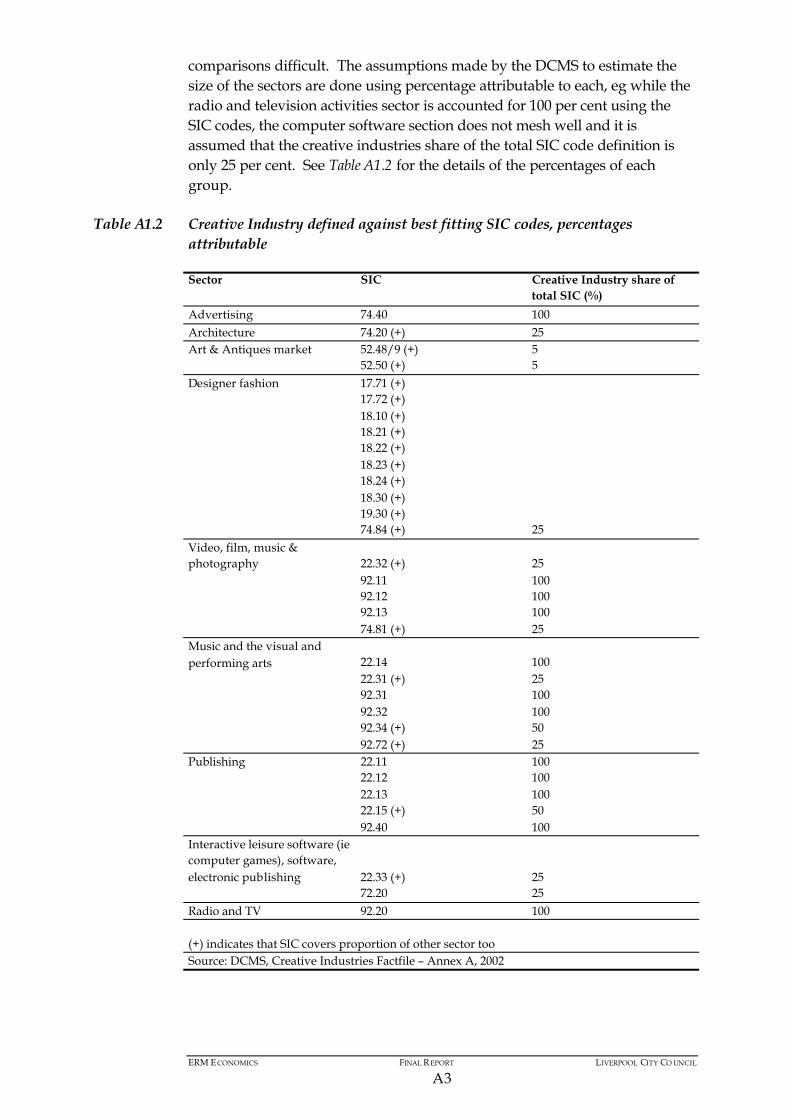
ERM E CONOMICS FINAL REPORT LIVERPOOL CITY CO UNCIL
A3
comparisons difficult. The assumptions made by the DCMS to estimate the size of the sectors are done using percentage attributable to each, eg while the radio and television activities sector is accounted for 100 per cent using the SIC codes, the computer software section does not mesh well and it is assumed that the creative industries share of the total SIC code definition is only 25 per cent. See Table A1.2 for the details of the percentages of each group.
Table A1.2 Creative Industry defined against best fitting SIC codes, percentages attributable
Sector SIC Creative Industry share of total SIC (%)
Advertising 74.40 100Architecture 74.20 (+) 25Art & Antiques market 52.48/9 (+) 5
52.50 (+) 5Designer fashion 17.71 (+)
17.72 (+)18.10 (+)18.21 (+)18.22 (+)18.23 (+)18.24 (+)18.30 (+)19.30 (+)74.84 (+) 25
Video, film, music & photography 22.32 (+) 25
92.11 10092.12 10092.13 10074.81 (+) 25
Music and the visual and performing arts 22.14 100
22.31 (+) 2592.31 10092.32 10092.34 (+) 5092.72 (+) 25
Publishing 22.11 10022.12 10022.13 10022.15 (+) 5092.40 100
Interactive leisure software (ie computer games), software, electronic publishing 22.33 (+) 25
72.20 25Radio and TV 92.20 100
(+) indicates that SIC covers proportion of other sector tooSource: DCMS, Creative Industries Factfile – Annex A, 2002

Annex B
Socio-Economic Data
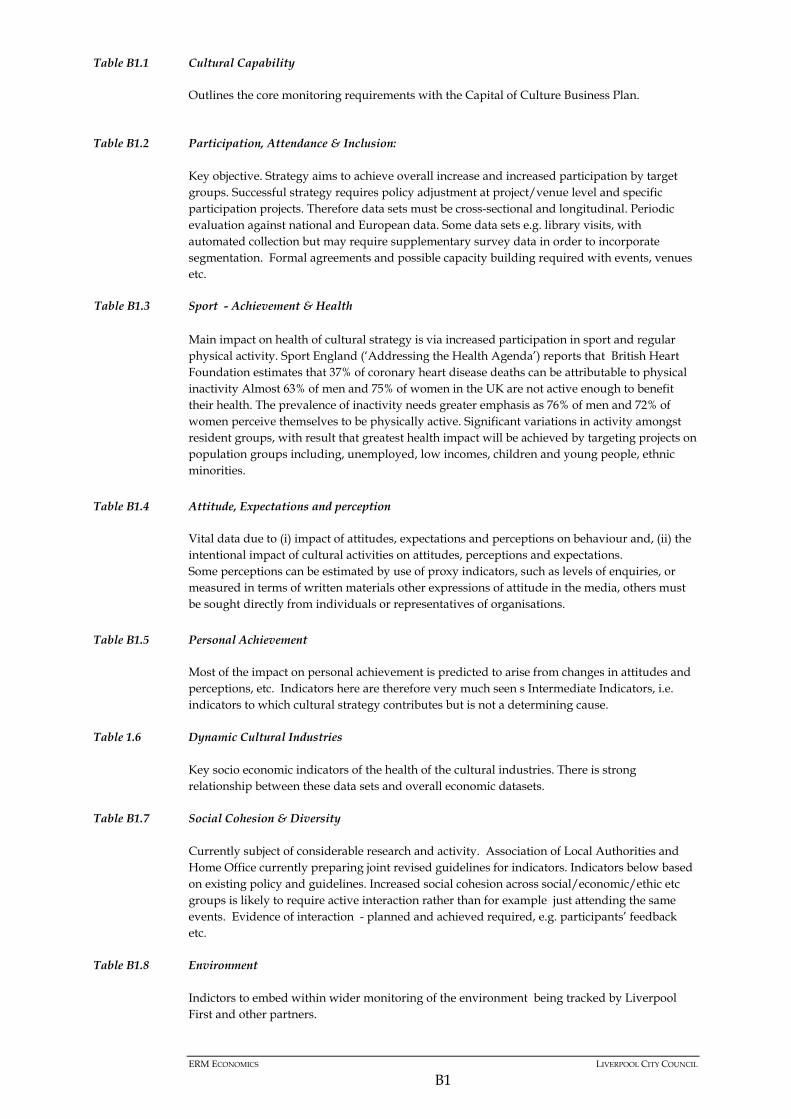
ERM ECONOMICS LIVERPOOL CITY COUNCIL
B1
Table B1.1 Cultural Capability Outlines the core monitoring requirements with the Capital of Culture Business Plan. Table B1.2 Participation, Attendance & Inclusion:
Key objective. Strategy aims to achieve overall increase and increased participation by target groups. Successful strategy requires policy adjustment at project/venue level and specific participation projects. Therefore data sets must be cross-sectional and longitudinal. Periodic evaluation against national and European data. Some data sets e.g. library visits, with automated collection but may require supplementary survey data in order to incorporate segmentation. Formal agreements and possible capacity building required with events, venues etc.
Table B1.3 Sport - Achievement & Health
Main impact on health of cultural strategy is via increased participation in sport and regular physical activity. Sport England (‘Addressing the Health Agenda’) reports that British Heart Foundation estimates that 37% of coronary heart disease deaths can be attributable to physical inactivity Almost 63% of men and 75% of women in the UK are not active enough to benefit their health. The prevalence of inactivity needs greater emphasis as 76% of men and 72% of women perceive themselves to be physically active. Significant variations in activity amongst resident groups, with result that greatest health impact will be achieved by targeting projects on population groups including, unemployed, low incomes, children and young people, ethnic minorities.
Table B1.4 Attitude, Expectations and perception
Vital data due to (i) impact of attitudes, expectations and perceptions on behaviour and, (ii) the intentional impact of cultural activities on attitudes, perceptions and expectations. Some perceptions can be estimated by use of proxy indicators, such as levels of enquiries, or measured in terms of written materials other expressions of attitude in the media, others must be sought directly from individuals or representatives of organisations.
Table B1.5 Personal Achievement
Most of the impact on personal achievement is predicted to arise from changes in attitudes and perceptions, etc. Indicators here are therefore very much seen s Intermediate Indicators, i.e. indicators to which cultural strategy contributes but is not a determining cause.
Table 1.6 Dynamic Cultural Industries Key socio economic indicators of the health of the cultural industries. There is strong
relationship between these data sets and overall economic datasets.
Table B1.7 Social Cohesion & Diversity Currently subject of considerable research and activity. Association of Local Authorities and Home Office currently preparing joint revised guidelines for indicators. Indicators below based on existing policy and guidelines. Increased social cohesion across social/economic/ethic etc groups is likely to require active interaction rather than for example just attending the same events. Evidence of interaction - planned and achieved required, e.g. participants’ feedback etc.
Table B1.8 Environment Indictors to embed within wider monitoring of the environment being tracked by Liverpool First and other partners.

ERM ECONOMICS LIVERPOOL CITY COUNCIL
B2
Table B1.9 Wider economic data Key economic data sources to draw on the main secondary indicators to monitor overall targets.
Also details surveys being conducted for the cultural industries.
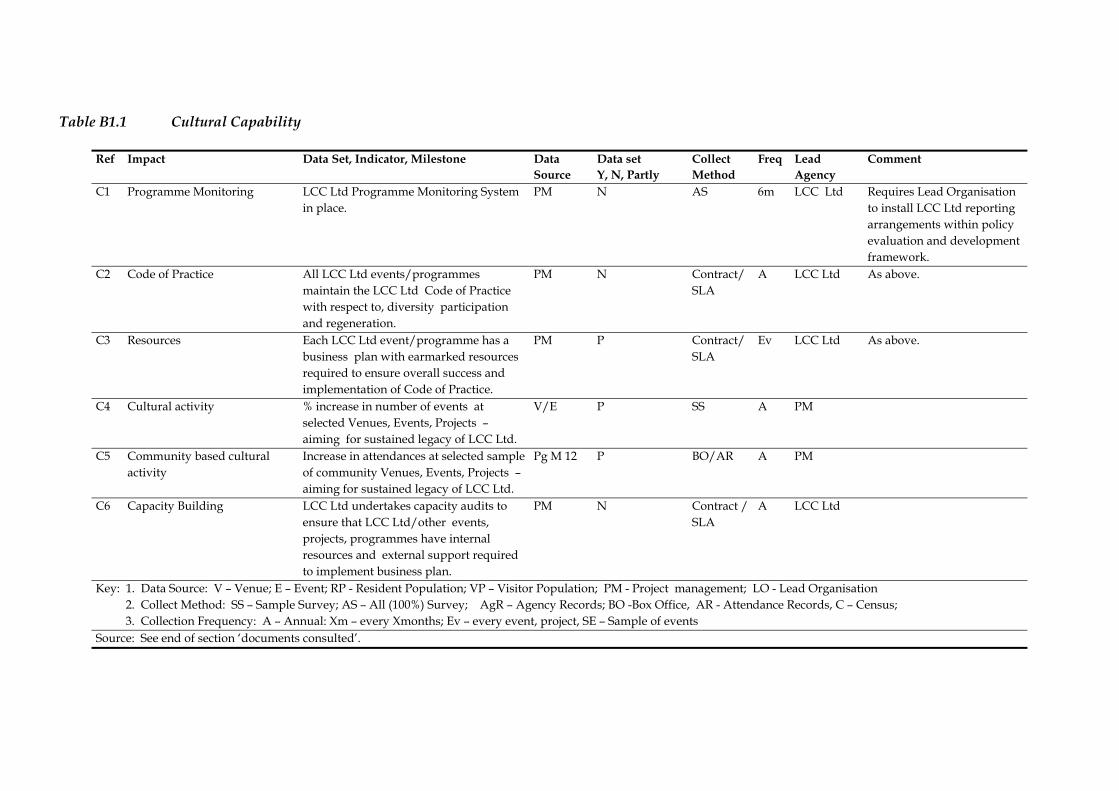
Table B1.1 Cultural Capability
Ref
Impact Data Set, Indicator, Milestone Data Source
Data set Y, N, Partly
Collect Method
Freq Lead Agency
Comment
C1 Programme Monitoring LCC Ltd Programme Monitoring System in place.
PM N AS 6m LCC Ltd Requires Lead Organisation to install LCC Ltd reporting arrangements within policy evaluation and development framework.
C2 Code of Practice All LCC Ltd events/programmes maintain the LCC Ltd Code of Practice with respect to, diversity participation and regeneration.
PM N Contract/ SLA
A LCC Ltd As above.
C3 Resources Each LCC Ltd event/programme has a business plan with earmarked resources required to ensure overall success and implementation of Code of Practice.
PM P Contract/ SLA
Ev LCC Ltd As above.
C4 Cultural activity % increase in number of events at selected Venues, Events, Projects – aiming for sustained legacy of LCC Ltd.
V/E P SS A PM
C5 Community based cultural activity
Increase in attendances at selected sample of community Venues, Events, Projects – aiming for sustained legacy of LCC Ltd.
Pg M 12 P BO/AR A PM
C6 Capacity Building LCC Ltd undertakes capacity audits to ensure that LCC Ltd/other events, projects, programmes have internal resources and external support required to implement business plan.
PM N Contract / SLA
A LCC Ltd
Key: 1. Data Source: V – Venue; E – Event; RP - Resident Population; VP – Visitor Population; PM - Project management; LO - Lead Organisation 2. Collect Method: SS – Sample Survey; AS – All (100%) Survey; AgR – Agency Records; BO -Box Office, AR - Attendance Records, C – Census; 3. Collection Frequency: A – Annual: Xm – every Xmonths; Ev – every event, project, SE – Sample of events Source: See end of section ‘documents consulted’.
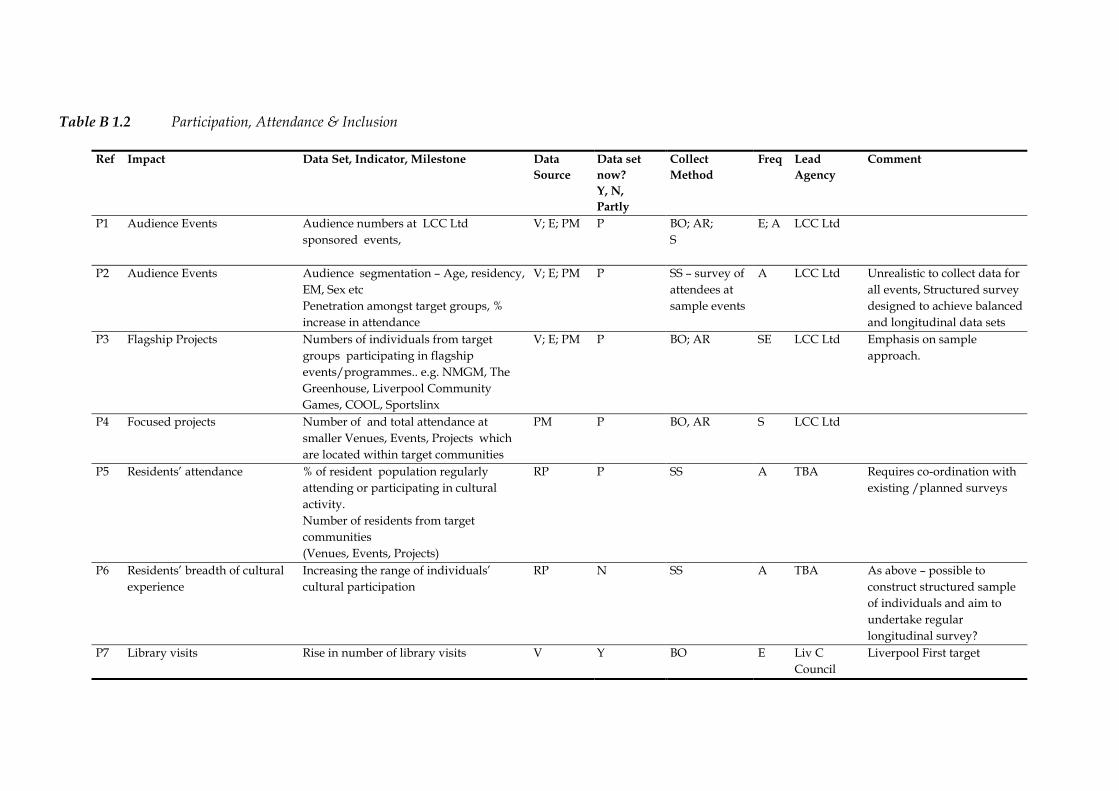
Table B 1.2 Participation, Attendance & Inclusion
Ref
Impact Data Set, Indicator, Milestone Data Source
Data set now? Y, N, Partly
Collect Method
Freq Lead Agency
Comment
P1 Audience Events Audience numbers at LCC Ltd sponsored events,
V; E; PM P BO; AR; S
E; A LCC Ltd
P2 Audience Events Audience segmentation – Age, residency, EM, Sex etc Penetration amongst target groups, % increase in attendance
V; E; PM P SS – survey of attendees at sample events
A LCC Ltd Unrealistic to collect data for all events, Structured survey designed to achieve balanced and longitudinal data sets
P3 Flagship Projects Numbers of individuals from target groups participating in flagship events/programmes.. e.g. NMGM, The Greenhouse, Liverpool Community Games, COOL, Sportslinx
V; E; PM P BO; AR
SE LCC Ltd Emphasis on sample approach.
P4 Focused projects Number of and total attendance at smaller Venues, Events, Projects which are located within target communities
PM P BO, AR
S LCC Ltd
P5 Residents’ attendance % of resident population regularly attending or participating in cultural activity. Number of residents from target communities (Venues, Events, Projects)
RP P SS A
TBA Requires co-ordination with existing /planned surveys
P6 Residents’ breadth of cultural experience
Increasing the range of individuals’ cultural participation
RP N SS A TBA As above – possible to construct structured sample of individuals and aim to undertake regular longitudinal survey?
P7 Library visits Rise in number of library visits V Y BO E Liv C Council
Liverpool First target

P8 Library loans Rise in book issues V Y BO E Liv C Council
Liverpool First target
P9 Musical Participation Sales of musical instruments V N BO E LCC Ltd Participating shops P10 Non attendance
/participation Survey of non/.low no. of attendees/non participants identifying barriers/preferences etc
RP N SS A TBA Requires co-ordination with existing/planned surveys
Source: See end of section ‘documents consulted’.

Table B1.3 Sport - Achievement & Health
Ref
Impact Data Set, Indicator, Milestone Data Source
Data set now? Y, N, Partly
Collect Method
Freq Lead Agency
Comment
SH1 Regular participation in sport Sport England ‘Equity Index’ - reducing differential between high and low participant groups.
V, RP, P BO, SS, AS. A TBA National targets are approx. - Adults – Av. 1/week; Young P – 10/year. Regular participation is basis of increased achievement
SH2 Leisure Centre swimmers Increase in use of Leisure Centre swimming pools.
V Y BO Ev Liv C Council
Liverpool First target
SH3 Resident perception of their activity levels
Reduction in % of residents who overestimate their levels of participation
RP N SS A TBA If mistaken perception is a barrier to increased activity may require change in marketing approach.. Acknowledging inactivity and its risks is first step to change
SH4 Resident activity levels % of all residents and target groups who meet DoH guidelines on physical activity levels
RP ? SS (AS?) A TBA Culture strategy will contribute to Liverpool First target –(deaths from heart disease) Greatest benefit comes from increasing activity amongst the inactive population
Source: See end of section ‘documents consulted’.
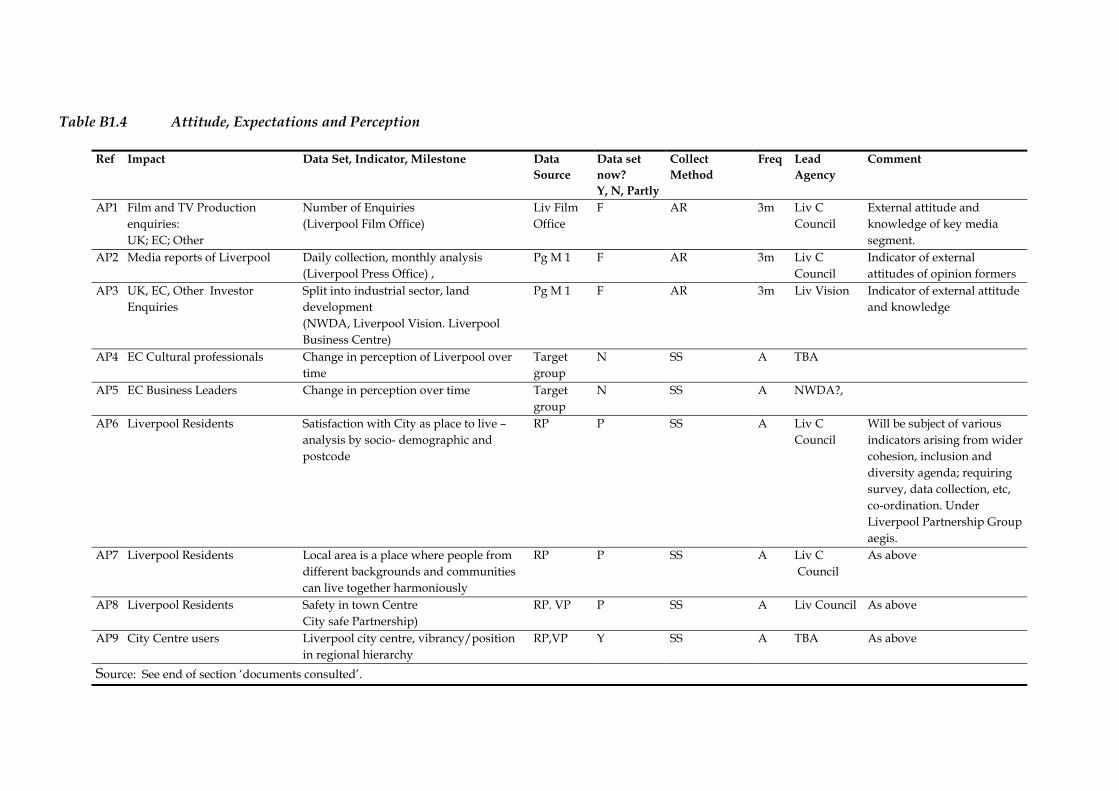
Table B1.4 Attitude, Expectations and Perception
Ref
Impact Data Set, Indicator, Milestone Data Source
Data set now? Y, N, Partly
Collect Method
Freq Lead Agency
Comment
AP1 Film and TV Production enquiries: UK; EC; Other
Number of Enquiries (Liverpool Film Office)
Liv Film Office
F AR 3m Liv C Council
External attitude and knowledge of key media segment.
AP2 Media reports of Liverpool Daily collection, monthly analysis (Liverpool Press Office) ,
Pg M 1 F AR 3m Liv C Council
Indicator of external attitudes of opinion formers
AP3 UK, EC, Other Investor Enquiries
Split into industrial sector, land development (NWDA, Liverpool Vision. Liverpool Business Centre)
Pg M 1 F AR 3m Liv Vision Indicator of external attitude and knowledge
AP4 EC Cultural professionals Change in perception of Liverpool over time
Target group
N SS A TBA
AP5 EC Business Leaders Change in perception over time Target group
N SS A NWDA?,
AP6 Liverpool Residents Satisfaction with City as place to live – analysis by socio- demographic and postcode
RP P SS A Liv C Council
Will be subject of various indicators arising from wider cohesion, inclusion and diversity agenda; requiring survey, data collection, etc, co-ordination. Under Liverpool Partnership Group aegis.
AP7 Liverpool Residents Local area is a place where people from different backgrounds and communities can live together harmoniously
RP P SS A Liv C Council
As above
AP8 Liverpool Residents Safety in town Centre City safe Partnership)
RP. VP P SS A Liv Council As above
AP9 City Centre users Liverpool city centre, vibrancy/position in regional hierarchy
RP,VP Y SS A TBA As above
Source: See end of section ‘documents consulted’.
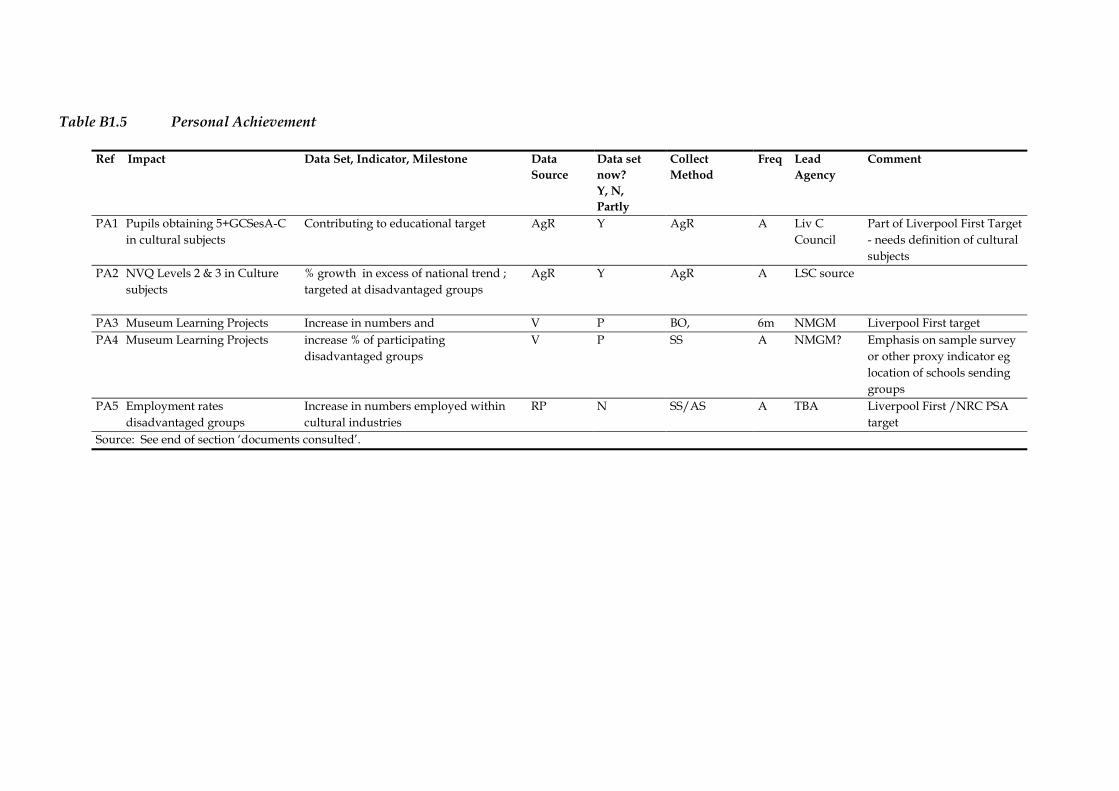
Table B1.5 Personal Achievement
Ref
Impact Data Set, Indicator, Milestone Data Source
Data set now? Y, N, Partly
Collect Method
Freq Lead Agency
Comment
PA1 Pupils obtaining 5+GCSesA-C in cultural subjects
Contributing to educational target AgR Y AgR A Liv C Council
Part of Liverpool First Target - needs definition of cultural subjects
PA2 NVQ Levels 2 & 3 in Culture subjects
% growth in excess of national trend ; targeted at disadvantaged groups
AgR Y AgR A LSC source
PA3 Museum Learning Projects Increase in numbers and V P BO, 6m NMGM Liverpool First target PA4 Museum Learning Projects increase % of participating
disadvantaged groups V P SS A NMGM? Emphasis on sample survey
or other proxy indicator eg location of schools sending groups
PA5 Employment rates disadvantaged groups
Increase in numbers employed within cultural industries
RP N SS/AS A TBA
Liverpool First /NRC PSA target
Source: See end of section ‘documents consulted’.
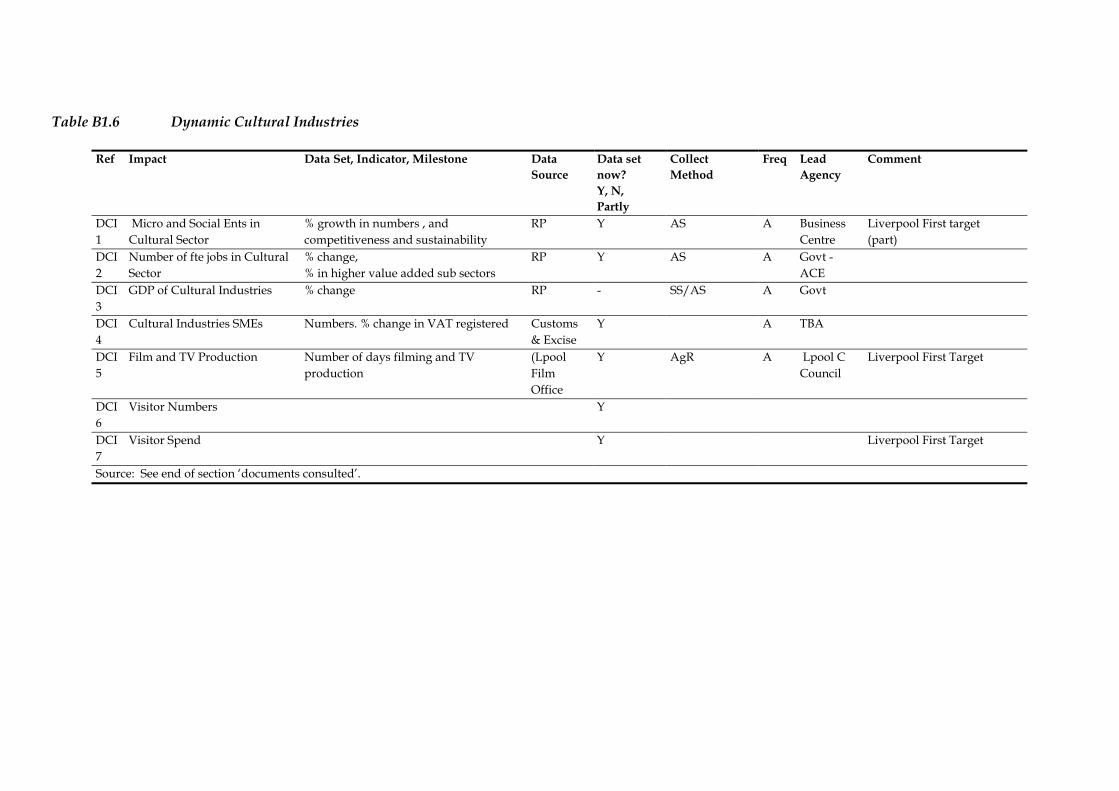
Table B1.6 Dynamic Cultural Industries
Ref
Impact Data Set, Indicator, Milestone Data Source
Data set now? Y, N, Partly
Collect Method
Freq Lead Agency
Comment
DCI1
Micro and Social Ents in Cultural Sector
% growth in numbers , and competitiveness and sustainability
RP Y AS A Business Centre
Liverpool First target (part)
DCI2
Number of fte jobs in Cultural Sector
% change, % in higher value added sub sectors
RP Y AS A Govt - ACE
DCI3
GDP of Cultural Industries % change RP - SS/AS A Govt
DCI4
Cultural Industries SMEs Numbers. % change in VAT registered Customs & Excise
Y A TBA
DCI5
Film and TV Production Number of days filming and TV production
(Lpool Film Office
Y AgR A Lpool C Council
Liverpool First Target
DCI6
Visitor Numbers Y
DCI7
Visitor Spend Y Liverpool First Target
Source: See end of section ‘documents consulted’.
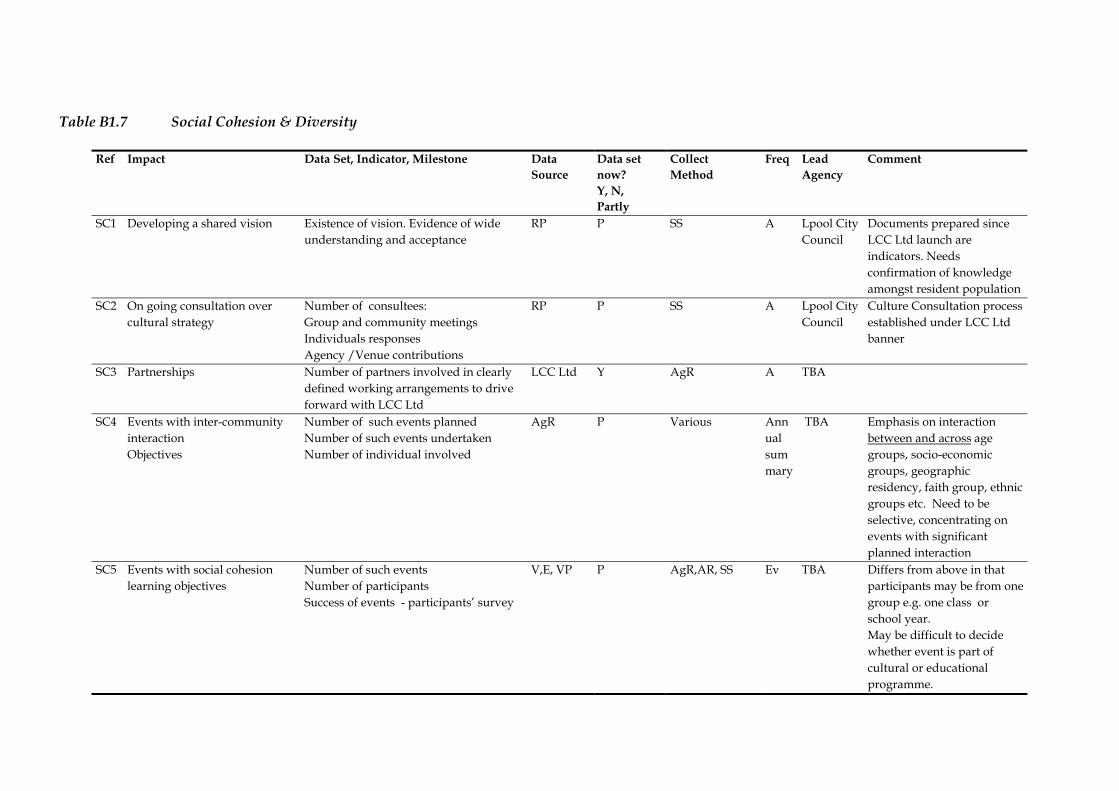
Table B1.7 Social Cohesion & Diversity
Ref
Impact Data Set, Indicator, Milestone Data Source
Data set now? Y, N, Partly
Collect Method
Freq Lead Agency
Comment
SC1 Developing a shared vision Existence of vision. Evidence of wide understanding and acceptance
RP P SS A Lpool City Council
Documents prepared since LCC Ltd launch are indicators. Needs confirmation of knowledge amongst resident population
SC2 On going consultation over cultural strategy
Number of consultees: Group and community meetings Individuals responses Agency /Venue contributions
RP P SS A Lpool City Council
Culture Consultation process established under LCC Ltd banner
SC3 Partnerships Number of partners involved in clearly defined working arrangements to drive forward with LCC Ltd
LCC Ltd Y AgR A TBA
SC4 Events with inter-community interaction Objectives
Number of such events planned Number of such events undertaken Number of individual involved
AgR P Various Annual summary
TBA
Emphasis on interaction between and across age groups, socio-economic groups, geographic residency, faith group, ethnic groups etc. Need to be selective, concentrating on events with significant planned interaction
SC5 Events with social cohesion learning objectives
Number of such events Number of participants Success of events - participants’ survey
V,E, VP P AgR,AR, SS Ev TBA Differs from above in that participants may be from one group e.g. one class or school year. May be difficult to decide whether event is part of cultural or educational programme.
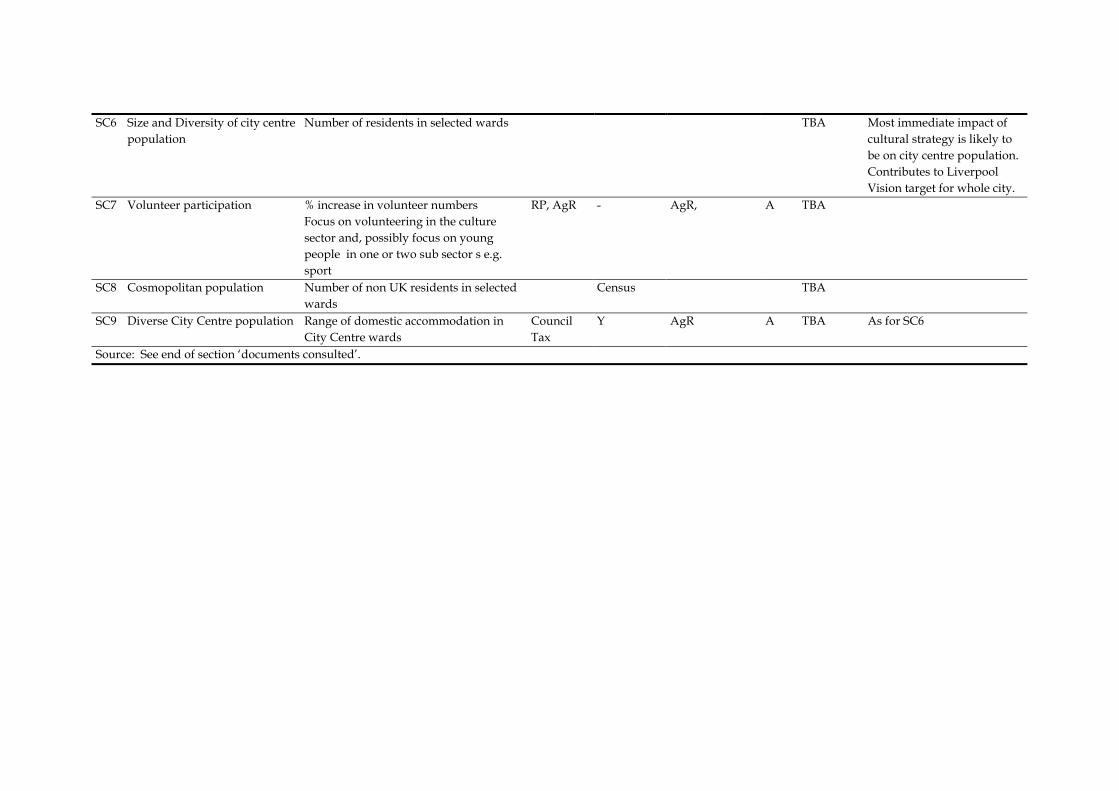
SC6 Size and Diversity of city centre population
Number of residents in selected wards TBA Most immediate impact of cultural strategy is likely to be on city centre population. Contributes to Liverpool Vision target for whole city.
SC7 Volunteer participation % increase in volunteer numbers Focus on volunteering in the culture sector and, possibly focus on young people in one or two sub sector s e.g. sport
RP, AgR - AgR, A TBA
SC8 Cosmopolitan population Number of non UK residents in selected wards
Census TBA
SC9 Diverse City Centre population Range of domestic accommodation in City Centre wards
Council Tax
Y AgR A TBA As for SC6
Source: See end of section ‘documents consulted’.

Table B1.8 Environment
Ref
Impact Data Set, Indicator, Milestone Data Source
Data set now? Y, N, Partly
Collect Method
Freq Lead Agency
Comment
E1 Culture Industries occupying listed buildings
Increase in number of listed buildings with sustained use by cultural industries
Lpool CC Contributes to reduction of listed building at risk - Liverpool First target
E2 Scale & Diversity of city centre dwellings
Total number and % annual rise in number of dwellings in city centre . Targets set for Council Tax bands ( LCC Treasurer) Note – aim is for cultural strategy to increase % of higher banded properties.
Pg M 12 Y
Source: See end of section ‘documents consulted’.
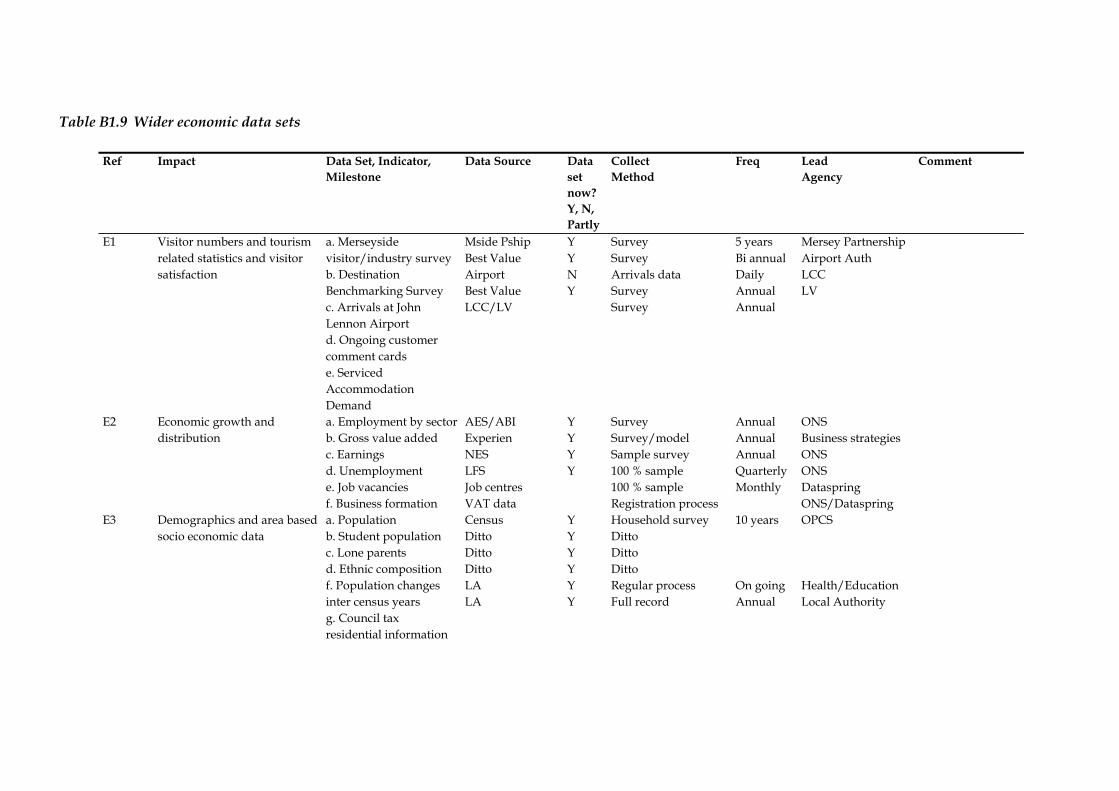
Table B1.9 Wider economic data sets
Ref
Impact Data Set, Indicator, Milestone
Data Source Data set now? Y, N, Partly
Collect Method
Freq Lead Agency
Comment
E1
Visitor numbers and tourism related statistics and visitor satisfaction
a. Merseyside visitor/industry survey b. Destination Benchmarking Survey c. Arrivals at John Lennon Airport d. Ongoing customer comment cards e. Serviced Accommodation Demand
Mside Pship Best Value Airport Best Value LCC/LV
Y Y N Y
Survey Survey Arrivals data Survey Survey
5 years Bi annual Daily Annual Annual
Mersey Partnership Airport Auth LCC LV
E2 Economic growth and distribution
a. Employment by sector b. Gross value added c. Earnings d. Unemployment e. Job vacancies f. Business formation
AES/ABI Experien NES LFS Job centres VAT data
Y Y Y Y
Survey Survey/model Sample survey 100 % sample 100 % sample Registration process
Annual Annual Annual Quarterly Monthly
ONS Business strategies ONS ONS Dataspring ONS/Dataspring
E3 Demographics and area based socio economic data
a. Population b. Student population c. Lone parents d. Ethnic composition f. Population changes inter census years g. Council tax residential information
Census Ditto Ditto Ditto LA LA
Y Y Y Y Y Y
Household survey Ditto Ditto Ditto Regular process Full record
10 years On going Annual
OPCS Health/Education Local Authority
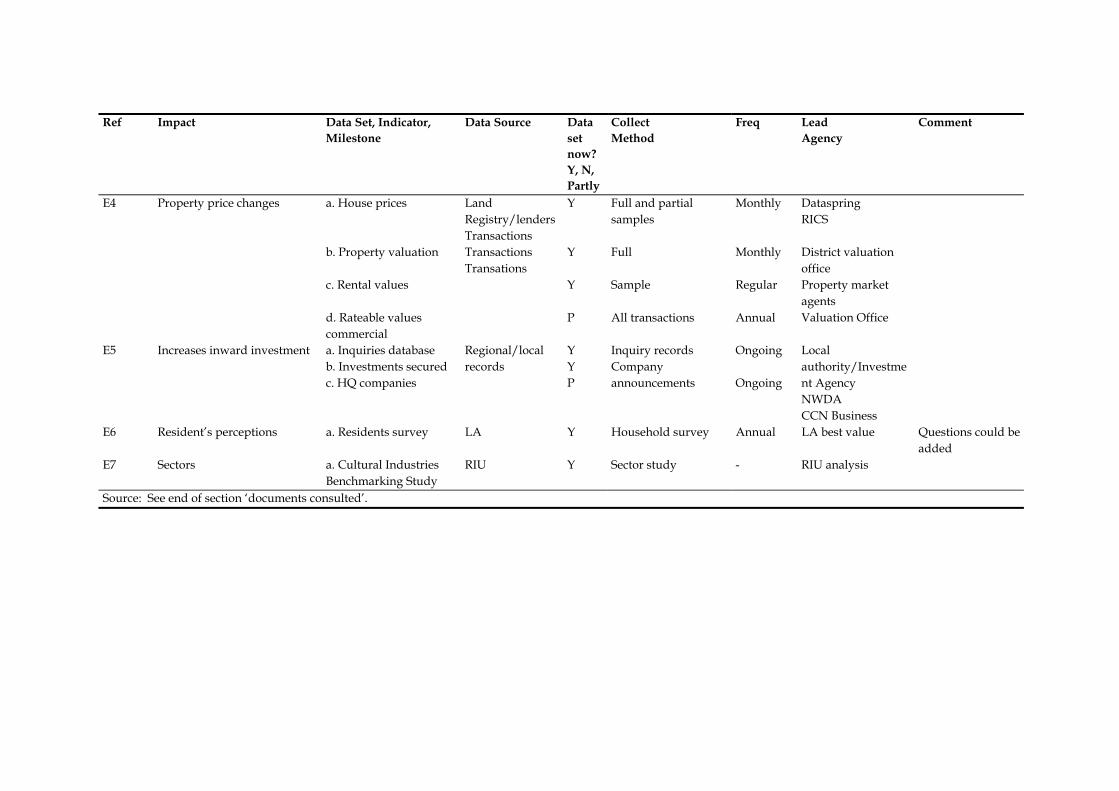
Ref
Impact Data Set, Indicator, Milestone
Data Source Data set now? Y, N, Partly
Collect Method
Freq Lead Agency
Comment
E4 Property price changes
a. House prices b. Property valuation c. Rental values d. Rateable values commercial
Land Registry/lenders Transactions Transactions Transations
Y Y Y P
Full and partial samples Full Sample All transactions
Monthly Monthly Regular Annual
Dataspring RICS District valuation office Property market agents Valuation Office
E5 Increases inward investment a. Inquiries database b. Investments secured c. HQ companies
Regional/local records
Y Y P
Inquiry records Company announcements
Ongoing Ongoing
Local authority/Investment Agency NWDA CCN Business
E6 Resident’s perceptions a. Residents survey LA Y Household survey Annual LA best value Questions could be added
E7 Sectors a. Cultural Industries Benchmarking Study
RIU Y Sector study - RIU analysis
Source: See end of section ‘documents consulted’.

Documents consulted: Community Cohesion – Home Office and ODPM website information Local Government Association - Guidance on Social Cohesion. Audit Commission Consultation draft report Quality of Life indicators . Liverpool Partnership Group (Liverpool First) Community Strategy Workbook Sport England - Addressing the Health Agenda Sport England - Sports Equity Index Liverpool Initial Implementation Strategy for Information for Health Merseyside Health Action Zone – Measuring Quality of Life LSC Greater Merseyside – household survey 2002 DCMS Regional Cultural Data Framework : A user’s Guide for Researchers and Policymakers, November 2002 DCMS (QUEST) Making it Count – The Contribution of Culture and Sport to Social Inclusion
ACE (Helen Jermyn). The Arts and Social Exclusion: A review September 2001 Audit Commission Library of local performance indicators LCC Ltd Bid Document Liverpool Cultural Strategy – March 2002 Comedia Critical Mass in Support and Culture for Competitive Advantage - Core Cities Merseyside ACME “…As broadcast in Beijing Merseyside ACME : a Social Impact Study Merseyside ACME “Giving Voice, Dreaming Dreams”.

Annex C
Bibliography

ERM E CONOMICS FINAL REPORT LIVERPOOL CITY COUNCIL
C1
Department of Culture, Media and Sport (1 January 2003). Visitor numbers Soaring at National Museums. (www.britain-info.org) ERM Economics (February 2002). Strategic and Economic Appraisal of Kings Waterfront. LOCUM Destination Consulting (December 2002). Tourism Strategy for Englandsnorthwest. LOCUM Destination Consulting (March 2002). Tourism Strategy for Liverpool ‘The Creative City’ (draft). LOCUM Destination Consulting (January 2003). A Tourism Vision for England’s Northwest. The Vision and Framework of Nine Strategic Programmes. Merseyside (January 2003). Hotel Futures 2001 – 2006 (May 2002). An Update of the 2001 Liverpool Hotel Market Study. Moss Madden (University of Liverpool), Vicki Popplewell (Liverpool City Council) and Ian Wray (North West Development Agency) (2001). City Centre Living as the Springboard for Regeneration? Some Lessons from Liverpool. Northwest Development Agency (2003). The Tourism Vision for England’s Northwest. NWTB Research Services (April 2001). Merseyside 2000. Visitor Survey Report. Regeneris (January 2003). Merseyside Economic Review 2002. Regional Intelligence Unit (18 March 2003). Benchmarking Employment in the Cultural Industries – Merseyside Bulletin. Small Firms Research Unit, Cardiff Business School. In association with DCA (Cardiff) Ltd (Economic Policy Unit), Cardiff Research Centre, Cardiff County Council (July 2002). The Impact of Cardiff 2008. The European Capital City of 1998 Team, co-ordinated by Carin Fishcher (April 1999). Stockholm ’98. The European Capital City of 1998 - Brief Summary of the Report. ‘Team’, in partnership with Tourism Solutions (2003). A Vision of Tourism in Merseyside, 2015. The Mersey Partnership (April 2002). Digest of Merseyside Tourism.

ERM ECONOMICS FINAL REPORT LIVERPOOL CITY COUNCIL
C2
Tourism Enterprise and Management. Tourism Solutions (14 February 2003). The Liverpool City Region – A Star Brand for Tourism in England’s North West. Merseyside Tourism Futures 2003 – 2015. Tourism Solutions and ACK Tourism Development Services, on behalf of Liverpool Vision, The City of Liverpool, the Mersey Partnership and EU.