Europe Economics - Optimal Integration in the Single - Gov.uk
103
Error! No text of specified style in document. - 1 - A Europe Economics report for BIS April 2013 Optimal Integration in the Single Market: A Synoptic Review
Transcript of Europe Economics - Optimal Integration in the Single - Gov.uk

Error! No text of specified style in document.
- 1 -
A Europe Economics report for BIS
April 2013
Optimal Integration in the
Single Market: A Synoptic
Review

Europe Economics is registered in England No. 3477100. Registered offices at Chancery House, 53-64 Chancery Lane, London WC2A 1QU.
Whilst every effort has been made to ensure the accuracy of the information/material contained in this report, Europe Economics assumes no
responsibility for and gives no guarantees, undertakings or warranties concerning the accuracy, completeness or up to date nature of the
information/analysis provided in the report and does not accept any liability whatsoever arising from any errors or omissions © Europe Economics.
All rights reserved. Except for the quotation of short passages for the purpose of criticism or review, no part may be used or reproduced without
permission.

Contents
Summary .................................................................................................................................................................................... 0
1 Introduction .................................................................................................................................................................... 7
2 What is the Single Market and what Policies are used to Create and Sustain it? ......................................... 8
2.1 Trade and comparative advantage .................................................................................................................... 8
2.2 Barriers to trade ................................................................................................................................................... 8
2.3 International trade agreements ......................................................................................................................... 9
2.4 Non-tariff barriers .............................................................................................................................................. 11
2.5 Customs union vs Single Market ..................................................................................................................... 13
2.6 Mutual Recognition, Harmonisation and Best Practice spreading........................................................... 15
2.7 Alternative goals for the Single Market project and their import for mutual recognition versus
harmonisation ................................................................................................................................................................... 18
3 How to Assess Optimal Integration in a Single Market ..................................................................................... 20
3.1 The Trade-offs in a Single Market ................................................................................................................... 20
3.2 Procedure for Assessing How Optimal Integration is ............................................................................... 27
4 Measuring Economic Integration ............................................................................................................................. 28
4.1 Methodological issues: “Input” vs “Output” Measures of Integration ................................................... 28
4.2 “Input” Measures of Integration ...................................................................................................................... 31
4.3 “Output” Measures of Integration .................................................................................................................. 35
4.4 Effects of Policy Inputs on Output Measures of Integration .................................................................... 49
4.5 So in which Sectors has Integration been Proceeding most? ................................................................... 51
4.6 Summary ............................................................................................................................................................... 53
5 Concrete Benefits from the Single Market ........................................................................................................... 54
5.1 Gains from Trade Creation .............................................................................................................................. 54
5.2 Competition ......................................................................................................................................................... 58
5.3 Efficiency gains ..................................................................................................................................................... 60
5.4 Innovation ............................................................................................................................................................. 63
5.5 Indicative Quantitative Results ........................................................................................................................ 67
6 Concrete Costs of the Single Market .................................................................................................................... 70
6.1 Trade diversion ................................................................................................................................................... 70
6.2 Process costs ....................................................................................................................................................... 73
6.3 Costs of Regulation ............................................................................................................................................ 74
6.4 Conclusion ............................................................................................................................................................ 77
7 Policy Costs and Benefits .......................................................................................................................................... 78
7.1 How can one Measure Sovereignty Costs and Benefits? .......................................................................... 78
7.2 Sovereignty costs dimension 1: Over-rule and dissent ............................................................................. 79

Error! No text of specified style in document.
- 2 -
7.3 Sovereignty costs dimension 2: Changing balance of your influence over others versus their influence over you — Case study: The financial services sector ......................................................................... 82
8 Conclusions .................................................................................................................................................................. 97

Summary
This report was commissioned by BIS from Europe Economics, and is an input to BIS’ synoptic review of
the Single Market. That review has three key objectives:
to consider the broad issues and main debates underlying the Internal Market as a whole, in particular
exploring the level of market integration thought to be necessary for an effective Internal Market, and
the mechanisms (such as harmonisation or mutual recognition) for achieving it;
to explore the interrelationships between the Internal Market and other areas of competence, and to
assess the strength of the arguments that certain other areas of competence are needed to enable the
Internal Market to operate effectively;
as a result, to assess the implications for the UK national interest of the current state of integration and
EU competence in the Internal Market field.
This report has considered the following questions:
What is the Single Market and what are its goals?
The Single Market can be regarded as a trading relationship, extending the European customs union to
encompass the stripping away of non-tariff barriers and free movement in capital and labour as well as
goods and services, and that has been the main basis of our analysis here. However, the promotion of
trade is not the only (or even, arguably, the main) goal of the Single Market — from the beginning its
architects have openly identified other goals for the project such as the deepening of political and social
linkages between the peoples and regions of Europe.
What are the tools by which integration in the Single Market is promoted?
Key tools include
the stripping away of internal tariffs and the imposing of a common external tariff
Treaty commitments by governments to the principles of free movement of goods, services,
capital and labour, to the liberalisation of markets, and to common principles of competition and
the addressing of externalities
mutual recognition of the regulatory and other requirements of other Member States
harmonisation of regulatory and other requirements across the EU
the spreading of best practice
common frameworks for economic regulation (e.g. of utilities)
How should we understand the question of whether integration within the Single Market is
optimal?
Membership and development of the Single Market entails a number of trade-offs, between numerous
benefits and costs of participation. In order to evaluate how optimal Single Market integration is (allowing
consideration of in which sectors integration should go further and in which sectors integration has already
achieved all it can or even, perhaps, gone too far), it is necessary to assess the balance within these trade-
offs.
We identify the following positives of enhancing the Single Market:

Summary
- 1 -
gains from trade — by stripping away tariffs and non-tariff barriers, trade with Single Market
partners increases (the “trade creation” effect of a customs union, amplified by the additional
reduction in barriers in a Single Market), increasing the gains from trade from that source.
gains to competition — increased trade means increased competitive pressure from abroad,
reducing prices for consumers and increasing technical and allocative efficiency within and
between firms and industries.
gains to efficiency from economies of scale and scope — through more straightforward
access to larger markets (the whole Single Market) firms can operate at a larger scale, and the
free movement of capital and labour allows international relocation to where production is most
efficient in scale (bigger often equals cheaper) and scope (the same production inputs might be
used for multiple purposes).
gains to innovation — the deep interchange of ideas and methods across different settings and
cultures facilitated by a Single Market can be a driver of increased creativity in innovation.
policy synergies where effects spill over borders — in areas such an environmental policy
or higher education.
Other positives are more subtle. For example, a key gain from involvement in a Single Market project may
be the opportunity to improve policy-setting in other countries. We explore in some detail the
case of the Markets in Financial Instruments Directive in the Financial Services sector (considered in close
detail in Section 7.3.1.3), whereby, via the EU the UK may have influenced how financial services regulation
is set for, say, Italy. That may not simply be a matter of optimal policy-setting being different if determined
at EU rather than the Italian governmental level. It could be that UK ideas would have been better for Italy
even if simply adopted by the Italian government absent the EU.
We identify four key categories of potential negative from the Single Market:
trade diversion losses — as in any customs union, from the gains from trade created by a
Single Market one must net off the losses from trade diverted inefficiently into the Single Market
from outside.
sovereignty/democracy costs — it was noted above that a positive of the Single Market is that
it allows us to improve policy-setting elsewhere. The flip-side is that we may find our own
policies improved, in ways that clash with our sovereign autonomy and democracy — our ability
to make our own mistakes in our own way
subsidiarity costs — we have understood by “sovereignty costs” the loss of our ability to make
our own mistakes in our own way. Subsidiarity costs are distinct, in being those costs intrinsically
associated with harmonised and centralised policy-setting as opposed to more locally-determined
policy, not because of autonomy of the policy-setting process but because the final policy itself
becomes less close to (locally) optimal.
process costs — the creation and maintenance of the institutions of the EU have to be funded,
the rules and regulations of the EU must be adapted to and complied with, infringement
proceedings must be responded to. Insofar as they are additional to national regulatory process
costs that would be entailed anyway, these are all processes that entail cost.
We represent various options for how benefits and costs evolve graphically, and how they might combine
into net benefits/costs, as per the following graphs (for a fuller explanation of the patterns and their
implications see Section 3).

Summary
- 2 -
Figure 1: Possible benefit curves for four phases of economic integration: customs union (CU),
predominance of non-tariff barriers (NTB), single market (SM) and total harmonisation (TH).
Figure 2: Possible cost curves for four phases of economic integration: customs union (CU),
predominance of non-tariff barriers (NTB), single market (SM) and total harmonisation (TH).
Summary
- 3 -
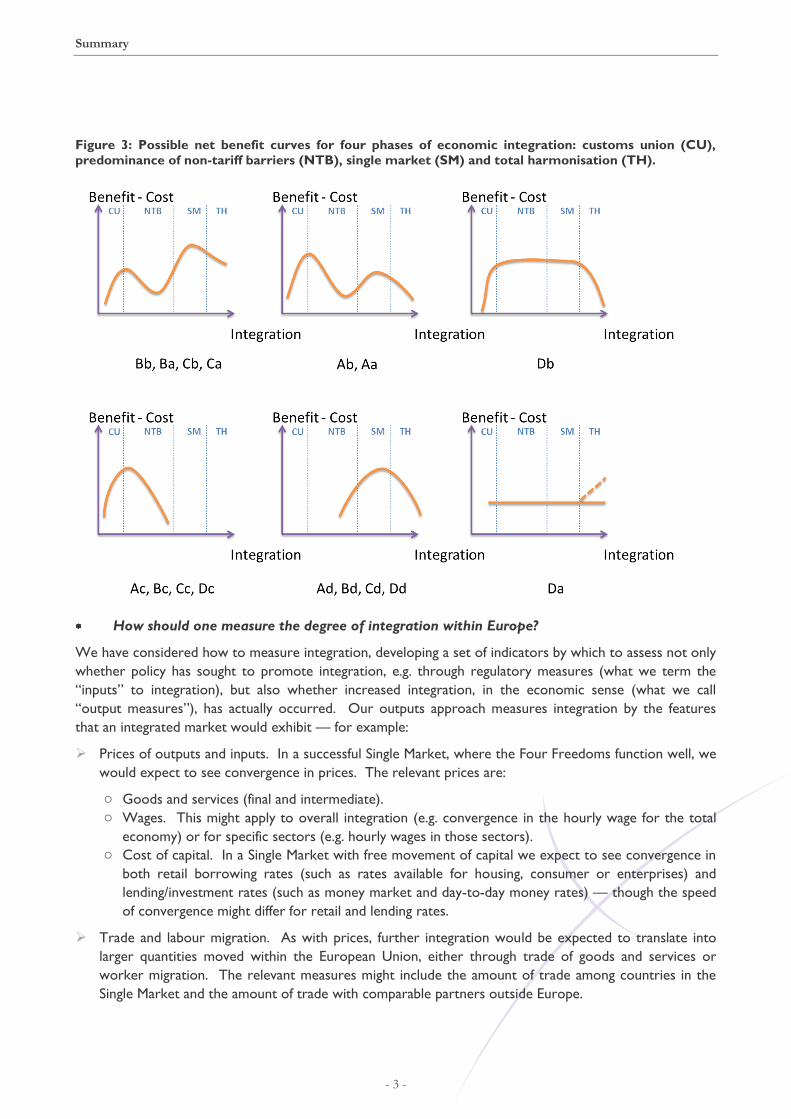
Figure 3: Possible net benefit curves for four phases of economic integration: customs union (CU),
predominance of non-tariff barriers (NTB), single market (SM) and total harmonisation (TH).
How should one measure the degree of integration within Europe?
We have considered how to measure integration, developing a set of indicators by which to assess not only
whether policy has sought to promote integration, e.g. through regulatory measures (what we term the
“inputs” to integration), but also whether increased integration, in the economic sense (what we call
“output measures”), has actually occurred. Our outputs approach measures integration by the features
that an integrated market would exhibit — for example:
Prices of outputs and inputs. In a successful Single Market, where the Four Freedoms function well, we
would expect to see convergence in prices. The relevant prices are:
o Goods and services (final and intermediate).
o Wages. This might apply to overall integration (e.g. convergence in the hourly wage for the total
economy) or for specific sectors (e.g. hourly wages in those sectors).
o Cost of capital. In a Single Market with free movement of capital we expect to see convergence in
both retail borrowing rates (such as rates available for housing, consumer or enterprises) and
lending/investment rates (such as money market and day-to-day money rates) — though the speed
of convergence might differ for retail and lending rates.
Trade and labour migration. As with prices, further integration would be expected to translate into
larger quantities moved within the European Union, either through trade of goods and services or
worker migration. The relevant measures might include the amount of trade among countries in the
Single Market and the amount of trade with comparable partners outside Europe.

Summary
- 4 -
Efficiency. We propose as measures of efficiency the related variables of labour productivity and unit
labour cost. These measures are interesting for two reasons. First, free movement of labour would
imply that in an integrated market the differences in efficiency disappear over time. Second, one of the
expected benefits of the Single Market is a general increase in efficiency.
For these measures, we are primarily concerned with their levels, dispersion across regions and sectors,
volatility over time and the direction in which these variables evolve.
We conduct our analysis at the level of the economy as a whole and also of some particular sectors, as
these offer instructive information. The four main sectors we use here for illustrating our thoughts and
methods are motor vehicles, patented pharmaceuticals, energy and financial services.
The key lessons regarding integration are as follows:
The degree of integration can be measured, especially in respect of “output” measures such as the
degree of price and wage dispersion, and output measures are correlated with input measures
(though not always in the direction policymakers might have expected).
There is evidence of increased integration — in particular in the form of wage convergence in the
1970s and 1980s and labour productivity convergence in the 2000s.
Integration, measured on outputs, is not a one-way process. Integration can reach a plateau (as
with wage dispersion from the 1990s onwards) or even, in some cases, be reversed (as with
pharmaceuticals price dispersion and interest rate dispersion during the 2000s).
In which sectors has integration proceeded least?
We apply our output criteria to consider integration in the twelve largest sectors for the UK, finding the
following. The key salient features are as follows:
In the period since the Accessions of the mid-2000s, there has been convergence in labour
productivity (increased integration in the Single Market) in most main sectors, with the notable
exceptions of manufacturing, wholesale & retail trade and education.
This convergence has been driven overwhelmingly by convergence between the new Member
States and the EU15, rather than amongst EU15 Member States.
For almost all sectors (excepting public administration (etc) and education – both relatively
unaffected by the Single Market), there has either been very little convergence since the early
1980s or what convergence there has been has been less than or entirely explicable in terms of
global convergence.
The four sectors in which EU15 convergence relative to global convergence is least positive / most
negative are: manufacturing, wholesale/retail trade, construction and transport.1
How can the concrete benefits of integration be measured in particular sectors?
Armed with our criteria to assess how much integration has occurred and how much various regulatory
changes have contributed to integration in various dimensions, we move on the concrete fruits of
integration — setting out how to measure the ways in which increased integration contributes to trade
creation, competition, efficiency gains, and innovation.
The first and most direct benefit from a free trade area, customs union or single market is the free
movement of goods and services. Hence we now consider whether UK trade has been increased by its
membership to the European Union’s Customs Union and Single Market. We conclude the following:
1 Again, one might speculate on a number of factors marking out these sectors, such as perhaps their role in
globalisation of supply chains.
Summary
- 5 -
In our estimations, an increase of 1 per cent in foreign GDP translates into an increase of trade
between 1.02 per cent and 1.07 per cent. The elasticity of trade with respect to domestic GDP ranges
between 0.81 per cent and 1.58 per cent. An increase in the distance between the UK and its trading
partner of 1 per cent is associated with a decrease in trade of between 0.56 per cent and 1.03 per cent.
Price dispersion measured at the EU level is negatively correlated with trade, whilst there a positive but
small correlation between trade and bilateral price dispersion. The elasticity of trade with respect to
EU price dispersion is -0.32.
The benefits from trade continue to increase after the introduction of Single Market phase, which
would provide evidence against scenarios in which the optimal level of integration occurs at the
customs union stage.
We cannot exclude our findings as indicative of how important the removal of non-tariff barriers is
relative to tariffs.
One of the expected benefits of the Single Market is an increase in the competitive pressure in domestic
markets reducing prices for consumers and increasing technical and allocative efficiency within and between
firms and industries. Our findings are consistent with the hypothesis that competition increases with
further integration. In sectors where integration has been more successful, as with motor vehicles,
improvements in the Hirschman-Herfindahl index can be seen across the board. In sectors in which there
is only partial integration, such as pharmaceuticals, the benefits from the Single Market might become
tangible only in some regions, such as those with, initially, the lowest levels of competitive pressure.
Other potential benefits of the Single Market include gains in efficiency from sources such as economies of
scale and scope. We measure these efficiency gains using unit labour costs. Unlike the case with labour
productivity in the previous chapter, there seems to be no clear trend in the unit labour costs for the total
economy, energy and financial services sectors.
Higher levels of innovation are among the expected benefits of European integration. We measure
innovation through expenditure in Research and Development (R&D). There are two main conclusions
that can be drawn. First, a significant part of the Member States that joined the EU on or after 2004 have
seen a very substantial increase in their R&D expenditure. This fact is consistent with the benefits of the
Single Market in terms of innovation. Second, a number of established economies in the EU have either
low levels or low growth in their R&D spending. These Member States include France, the Netherlands
and the UK. This fact, however, might not necessarily indicate that those countries do not reap the
benefits from innovation in the Single Market for two reasons. First, integration might lead to specialisation
and those Member States might not have their comparative advantage in sectors that are R&D intensive.
Second, innovation in sectors such as financial services, which represent a significant part of the economies
of some Member States as the UK, might not be best captured through R&D expenditure.
Thus, using a combination of general reflections upon data, econometrics, and analytical judgement, we
have illustrated how one might explore the relationship between integration in the Single Market and trade,
competition, efficiency and innovation for the pharmaceuticals, financial services, motor vehicles and energy
sectors. In general we believe one should be optimistic regarding the scope for drawing fairly objective
quantitative results in respect of these benefits in respect of trade, competition and efficiency. In respect of
innovation, we believe some quantification is worth attempting but the likelihood of producing robust and
definitive results is limited.
How can the concrete costs of integration be measured in particular sectors?
We have explored trade diversion and process costs, including the costs of regulation. Regulatory costs
can be measured quite concretely, but there is an inevitable element of judgement involved in determining
how much additional regulatory costs the EU creates that would not have been incurred anyway through
national regulatory interventions. We also note that the ways regulatory costs are typically analysed in

Summary
- 6 -
regulatory impact assessments is not precisely suited to our purpose here, in that many EU regulations are
intended to be deregulatory or liberalising — the very essence of the stripping away of non-tariff barriers is
that doing so should have the net effect of reducing regulatory costs, not increasing them.
Of the concrete costs, although the rising trend in process costs within the EU should not be ignored and
there does appear to be an accelerating trend in the volume of regulation associated with the EU (a trend
that counterfactual analysis suggests might not be fully duplicated by the UK alone), we consider the most
significant dynamic aspect of recent and forthcoming years has been the shifts in trade diversion. Although
the removal of non-tariff barriers should allow the EU, in principle, to achieve deeper cost reduction than is
feasible under customs union or free trade agreements, in practice the EU has not kept pace with
international competitiveness trends — not necessarily through any failings of its own but perhaps simply
because of successes elsewhere. The implication is that trade diversion is a rapidly increasing cost of EU
membership and could eventually become a threat to its economic efficacy, and thus that the focus upon
EU competitiveness amongst EU-level policymakers is a concern well founded.
The functioning of the Single Market requires dedicated administrative bodies together with utilisation of a
significant part of the EU government. The associated considerable processing cost must be funded by
Member States. We observe that there is a rising trend in gross UK contribution to administrative
expenditure, even relative to GDP. In general, the gross UK contribution would adjust according to the
goals of the EU government and fluctuate between 0.04 and 0.07 per cent to GDP level. After the
introduction of Single Market in 1993, there was a gradual fall in gross UK contribution until the financial
crisis in 2007.
Besides the annual contribution each Member States make, another major component of the cost of EU
membership is the cost of complying with EU regulations. Regulatory costs to businesses could include:
administrative costs, policy costs, financial costs and wider costs on the economy created by regulatory
distortions.
How can policy costs and benefits be assessed?
We consider policy costs and benefits to be potentially as large as or even larger than the concrete costs
and benefits of the Single Market, bearing in mind especially the point that the key goals of the Single
Market project may be political (and hence directly related to policy influence) as much as trade-oriented.
We explore how measures of dissent, such as occasions the UK has been outvoted via QMV, might
supplement more widely-used coarser-grained measures of policy costs, such as the number of “lost
vetoes”. Noting the perils of drawing too firm a conclusion from the scarce data available, our numbers
suggest that not only do brute sovereignty costs rise as harmonisation measures are extended (as is, in a
sense, inevitable) but that over time the costs to the UK have increased faster than those for other
Member States.
In respect of particular sectors, we suggest that detailed reflection upon the dynamic of policy-making can
reveal the UK’s influence or lack thereof and how this changes through time. We explore the specific case
of the Financial Services Sector, showing how the UK’s past influence can be seen through detailed
consideration of the structural similarities between key EU and UK financial regulations and the differences
between these and previous regulation in other Member States. We also argue that once one understands
the factors that drove high UK influence over financial services regulation in the past, it seems likely (in our
judgement — others are invited to draw their own conclusions) that the UK’s policy influence, at EU level,
in this area has recently declined markedly and should be expected to be weak over the next decade —
implying that we are in a phase of relatively high policy costs, especially in terms of the risk of being over-
ruled, in respect of that sector.
In conclusion, the key lessons of this analysis are thus methodological and synoptic — establishing an
overall framework of analysis for the Single Market and showing how it can be applied in other sectors.

Introduction
- 7 -
1 Introduction
This report was commissioned by BIS from Europe Economics, and is an input to BIS’ synoptic review of
the Single Market. That review has three key objectives:
to consider the broad issues and main debates underlying the Internal Market as a whole, in particular
exploring the level of market integration thought to be necessary for an effective Internal Market, and
the mechanisms (such as harmonisation or mutual recognition) for achieving it;
to explore the interrelationships between the Internal Market and other areas of competence, and to
assess the strength of the arguments that certain other areas of competence are needed to enable the
Internal Market to operate effectively;
as a result, to assess the implications for the UK national interest of the current state of integration and
EU competence in the Internal Market field.
In this report we begin with a consideration of what the Single Market is and what its objectives are
(Section 2). We move on to think about the question of what constitutes “optimal” integration in a Single
Market as a whole and within individual sectors, in particularly setting out the trade-offs (costs and benefits)
involved in enhancing market integration (Section 3). We then consider how to measure integration,
developing a set of indicators by which to assess not only whether policy has sought to promote
integration, e.g. through regulatory measures (what we term the “inputs” to integration), but also whether
increased integration, in the economic sense (what we call “output measures”), has actually occurred
(Section 4).
Armed with these criteria to assess how much integration has occurred and how much various regulatory
changes have contributed to integration in various dimensions, we move on the concrete fruits of
integration — setting out how to measure the ways in which increased integration contributes to trade
creation, competition, efficiency gains, and innovation (Section 5). In Section 6, similarly, we consider the
concrete costs of integration, specifically the risk of trade diversion, the costs of the Single Market’s
institutions, and compliance costs.
Whilst Sections 5 and 6 consider the concrete costs and benefits of integration, Section 7 reflects upon the
more intangible, but potentially just as large, “policy” costs and benefits — the ways the EU allows the UK
to influence policy in other EU Member States and the risk that UK preferences are over-ridden or poorly
reflected.
Section 8 concludes.
We understand that BIS intends there to be a number of sector-specific studies in adding to the synoptic
review. Hence, although in this report we do investigate issues concerning the degree and optimality of
integration in particular sectors, our remarks about particular sectors should be interpreted as clarifying
and vivifying our methodological remarks — nothing we write here should be taken as committing BIS to
particular findings in its sectoral studies, nor to be potentially in conflict with those findings.
The four main sectors we use here for illustrating our thoughts and methods are: Motor vehicles; Patented
pharmaceuticals Energy; and Financial services. We also sometimes use other sectors where convenient
and appropriate. However, to repeat, this report is part of a synoptic overview, rather than a sectoral or
multi-sectoral study. In many cases our key objective in quoting results from specific sectors is a “proof of
concept” for a proposed method.

What is the Single Market and what Policies are used to Create and Sustain it?
- 8 -
2 What is the Single Market and what
Policies are used to Create and Sustain
it?
The EU’s Single Market can be regarded as promoting a number of economic and political goals, and we
shall reflect upon some of those alternatives later. But the standard way to analyse the EU Single Market in
economic terms is to treat it as a form of trading relationship.
2.1 Trade and comparative advantage
Trade allows the exploitation of what economists call “comparative advantage”. Comparative advantage
can be thought of as simply the trade version of the division of labour. Suppose everyone required two
vital products: food and football. Is it better if everyone produces her own food and football, or is it better
if some people specialise in producing one or the other? The best footballer in the country might also be
the best farmer. And of course the footballer needs some of the output of farming (e.g. food). But if the
second best farmer’s skills are very specialised (say, she is much less good at football), it will be most
efficient if the best footballer sticks to football and lets the second-best farmer do the food production. In
other words, even though the footballer has an absolute advantage in both farming and football, his
comparative advantage lies in football whilst the second-best farmer’s comparative advantage lies in farming.
Efficiency is increased and everyone is better off if the footballer sells the farmer the chance to view his
skills in exchange for the farmer selling the footballer food.
In much the same way, countries are likely to have a comparative advantage in the production of certain
goods and services and a comparative disadvantage in others. Trading allows countries to specialise in
where their comparative advantage lies, exporting the goods and services in which they have that
comparative advantage and importing others.
2.2 Barriers to trade
However, absent international agreement to promote trade, international markets could potentially be
highly segmented (e.g. there might an effectively different market in each country, rather than, say, one
global market) by many different barriers restricting trade, for example:
tariffs (taxes — “customs duties” — on the import or export of goods or services)
subsidies (favouring domestic businesses over foreign imports)
quotas (maximum amounts of imports or exports)
special regulations (e.g. environmental, health and safety, or labour conditions rules favouring domestic
over foreign production methods).
If each of these individual national markets were reasonably large, competitive, and had the same costs and
methods of production and tastes of consumers, segmentation may be relatively unimportant economically.
But where these national markets differed — where costs or tastes differed, or competition were limited
— or national demand is too small to allow exploitation of economies of scale, segmentation reduces

What is the Single Market and what Policies are used to Create and Sustain it?
- 9 -
efficiency by restricting (damaging) the gains from trade. It will be important to remember this point in
what comes later: trade is most advantageous precisely where there is difference, not homogeneity.
2.3 International trade agreements
International trade agreements can take a number of forms. A simple form is called a “free trade
agreement”. Member countries of a free trade agreement agree to remove or reduce tariffs (usually in
particular sectors — e.g. agriculture or manufactured goods, but it could be across the board) and might
also undertake not to impose quotas on imports from or exports to each other.
In a free trade agreement, member countries may still have different tariffs on imports (say) from third
countries (non-members of the free trade area). That creates the risk that third country exporters send
their products to the country, inside the free trade area, with the lowest external tariffs, and once the
product is inside the free trade area it is traded on to high-external-tariff countries, undermining those
higher tariffs and tending to create a race to the bottom on external tariffs. As an attempt to counter this,
free trade areas often include complex “rules of origin” restricting tariff-free exporting to goods and
services originally produced all or overwhelmingly within the free-trade area rather than imported from
outside. Such rules create considerable complexity and enforcement challenges, and can often be by-
passed or even sometimes openly flouted.
To avoid this scenario, an alternative type of trade agreement specifies that, in addition to having no tariff
on imports from or exports to each other, all members must have the same external tariff (the same tariff
on non-members). Such a trade agreement is called a “customs union”. The European Union is a customs
union. Article 28 of the Treaty on the Functioning of the European Union (TFEU) states that: “The Union
shall comprise a customs union which shall cover all trade in goods and which shall involve the prohibition between
Member States of customs duties on imports and exports and of all charges having equivalent effect, and the
adoption of a common customs tariff in their relations with third countries.”
In the case of a free trade area, the removal of or reduction in tariffs leads (if there are differences or scale
economies to be exploited) to an increase in trade, thereby increasing efficiency by exploiting comparative
advantage. But the efficiency gains from a customs union are more ambiguous. To see why, consider the
following diagram.

What is the Single Market and what Policies are used to Create and Sustain it?
- 10 -
Figure 2.1: Trade creation and trade diversion in a customs union
In Figure 2.1, we imagine that domestic demand is given by the downwards-sloping curve and domestic
supply is the upwards-sloping curve. The product could be imported internationally at a world price of Pw.
But only a modest portion (Q1) of potential domestic supply could compete if the price were Pw. To
partially protect the domestic industry from competition whilst allowing some trade, the government sets a
tariff of t, so the domestic sale price is actually Pw + t and so the amount sold is Q4 of which Q3 is produced
domestically and the rest imported. On those imports (Q4 – Q3) a tariff of t is paid to the government. So
the total value of the tariff is (Q4 – Q3) x t, equivalent to boxes C and E in Figure 2.1.
Next, let us suppose that the country joins a customs union and that the sale price within the customs
union is PM whilst the tariff on non-customs union exports (the external tariff) remains at t, meaning that
the cost of importing from customs union members (PM) is now lower than the post-tariff cost of exporting
from outside (Pw + t) and so all imports are from within the customs union and none from outside. Total
sales rise to Q6, domestic production falls to Q5 and imports rise to Q6 – Q5 on which no tariffs are now
paid. But the rise in total sales comes from two sources. First, there is trade creation — extra trade
occurring at the lower price of PM because of the absence of tariffs against imports from customs union
partners. Domestic consumers gain from this trade creation whilst the previously-protected domestic
producers lose out, but there are trade gains overall. The trade gains are given in the diagram by boxes B,
C and D. On the other hand, the customs union producers are less efficient than those in the rest of the
world (the no-tariffs customs union price is PM which is higher than the no-tariffs world price of Pw). By
introducing a common tariff trade has been diverted away from non-customs-union countries to members
of the customs union. In the diagram, the efficiency cost of this trade diversion is measured in terms of the
foregone tariffs — boxes C and E. Box C also appeared in the trade creation gains, so cancels out, and the
net overall effect — the question of whether the customs union increases or diminishes efficiency — is
given by the comparison of trade creation gains from boxes B and D with trade diversion losses in box E.
Which of these is bigger depends on the slopes of the demand and supply curves, the difference between
the customs union and world import prices, and the tariff. If, for example, PM is close to Pw whilst the

What is the Single Market and what Policies are used to Create and Sustain it?
- 11 -
domestic supply curve is very steep, so box E is very small compared to boxes B and D, trade creation
gains may significantly exceed trade diversion effects.
But overall the key messages to note for later are these:
A customs union is a more credible arrangement than a free trade area when members of a trade
agreement wish to retain some tariffs to protect their producers, because absent a common external
tariff in a free trade area external tariffs will tend to be undermined or, if they are to be protected,
imply complex and expensive rules of origin to be devised, monitored and enforced.
In a customs union, trade is diverted from the rest of the world to the other members of the customs
union. Sometimes those debating the significance of the Single Market report that this or that
percentage of trade is with the EU. But such discussions rarely acknowledge that that is the percentage
of trade after trading has been diverted towards the EU by tariff differentials.
The economic advantages of a customs union will be greatest when:
production within the customs union is nearly as efficient as that in the rest of the world (this is the
issue of maximising “EU competitiveness”) — so trade diversion costs are low. (A corollary of this
is that the economic value of a customs union that was initially beneficial could diminish, or even
become negative, if the competitiveness of the rest of the world rises markedly, relative to that of
the customs union.2)
the gains from trade via comparative advantage are large — so trade creation gains are high
2.4 Non-tariff barriers
Our discussion of the pros and cons of a customs union focused upon tariff barriers to trade. But there
are many other non-tariff factors that might segment markets and restrict trade. Some of these are
“natural” barriers — e.g. oceans; mountain ranges, language differences3. Others are barriers created
consciously or unconsciously as a result of policies in areas such as regulation or state aid (there would, for
example, obviously no more be a Single Market if countries used state aid to subsidize domestic versus
imported production than if imports were subject to tariffs and quotas). Policy-induced barriers to trade
that are not tariffs are called “non-tariff barriers” (NTBs).
The first thing to note about NTBs is that even after tariffs are stripped away, trade may not be free within
a customs union because of these other barriers. A subsidy to a domestic producer will have much the
same effect on trade as a tariff on imported product — it lowers costs for the domestic supplier, relative to
the imported product, protecting the domestic supplier from proper competition. A product standard or
an environmental or health and safety regulation that requires products to be made as they are already
made domestically and bans those made via foreign techniques will effectively forbid trade.
But that is not the end of the story, for NTBs are not simply a passive given. When tariffs are stripped
away, it will become tempting for policymakers to increase non-tariff barriers so as to try to keep in place
that protection of domestic producers that a tariff barrier can no longer provide. This was the experience
within the European Economic Community. After internal tariffs were removed, there was an enormous
growth in non-tariff barriers, maintaining the segmentation of markets. We can see this especially in the
European Commission communication of 6 November 1978, “Safeguarding free trade within the Community”.4
This document noted that “The free movement of goods…has been and continues to be the subject of an ever
increasing number of restrictive measures of all types taken by national public authorities to favour one or another
national industrial sector or to restrain imports coming from other Member States….At present [the Commission] is
2 See Section 6.1 below for more discussion on this point. 3 See below (p7ff) for some further consideration of how “natural” a barrier language differences really are. 4 Brussels, 6.XI.1978, SG(78) D/12882

What is the Single Market and what Policies are used to Create and Sustain it?
- 12 -
investigating more than four hundred dossiers on hindrances to the free movement of goods…This figure which has
more than quadrupled compared to four or five years ago represents a small sample of the reality.”5
This leads us to another important lesson for what comes later. British commentators sometimes find
mysterious the idea, commonly expressed amongst European policymakers, that if the Single Market
project does not keep moving forwards, it will begin to unravel. Obviously the motives behind this idea are
complex and multi-faceted, impinging upon territory that falls outside our scope here, such as the role of
the “ever closer union” commitment. But one reason European policy-makers hold to this idea is their
historical experience. Creating an area without barriers to trade is not a matter of passing certain laws and
then resting on one’s laurels. Without a continuous programme of reform, driving non-tariff barriers out,
new non-tariff barriers will arise and the market will be re-segmented.6
By the time of the 1988 Cecchini Report7 the author described the then-Common Market as one where:
“customs-related costs put a charge on companies equal to a major portion of their profits from intra-EC
trade; first in effect pay a penalty dividend (around 25% of profits in many sectors) to national border
controllers for the privilege of going European;
“industry in areas like motor manufacturing and telecommunications is losing billions of Ecus because of
inefficiencies imposed by divergent product standards or protectionist procurement;
“smaller companies are to a significant extent debarred from transborder business activity by administrative
costs and regulatory hassles;
“a bewildering array of price differences faces consumers of essential services: car insurance may vary by as
much as 300% between high and low price countries; tariffs for telephone services can vary 50% from one
EC country to another; the range of price differences for some key financial services can be even greater;
“the public authorities, year in year out, pay around Ecu 17,500m more than they should in purchasing the
goods and services they need, because of protective procurement systems over which they themselves
preside.”
Cecchini divided non-tariff barriers into three broad types:
Physical barriers — e.g. customs controls
Technical barriers — e.g. differing product standards, or protectionist public procurement policies
Fiscal barriers — specifically, differing rates of VAT and excise duties
5 Amongst the “restrictive measures” identified, the Commission communication noted:
Documents requirements
Technical conditions
National minimum and maximum prices
Frontier checks
Preferential procurement systems favouring national suppliers and more general “Buy national” campaigns
Taxes, and fees for checks
Many of these points were taken up in more detail in the Cecchini Report (see below). 6 On this point, it is also worth noting the many EU institutions that deal with ongoing enforcement of Single Market
rules. The most obvious are the competition authorities (e.g. DGCOMP) and courts (the European Court of
Justice). But many individual Directorates General have the power to hear complaints brought against Member
States by individual companies or other Member States and bring infringement proceedings, and a significant
proportion of DGMARKT staff deal with the processing of infringement allegations rather than the development of
new policy. 7 Cecchini et al (1988), “The European Challenge, 1992 – The Benefits of the Single Market”,
http://ec.europa.eu/economy_finance/emu_history/documentation/chapter12/19880301en127eurochalle
nge92_a.pdf

What is the Single Market and what Policies are used to Create and Sustain it?
- 13 -
The central task of European measures to develop and promote the Single Market has, since that time,
been the breaking down of non-tariff barriers of these kinds. Much the greatest focus has been upon
technical barriers, especially those created by regulation.
2.5 Customs union vs Single Market
In itself, the removal of non-tariff barriers to trade in goods and services could be seen as falling within the
broad ambit of a customs union. But a Single Market is more than a customs union. For in a customs
union there is freedom of movement of the outputs of production — goods and services (often including
intermediate goods and services). But in a Single Market one adds to that the free movement of inputs —
capital and labour. So the Single Market is often defined in terms of its “four freedoms”: the free
movement of goods, services, capital and labour.
Box 1: Some Key Treaty Articles Defining the Single Market
The Treaty on the Functioning of the European Union contains the principles that govern the Single Market.
The key articles are the following
Article 28 states that “The Union shall comprise a
customs union which shall cover all trade in goods and which shall involve the prohibition between
Member States of customs duties on imports and exports and of all charges having equivalent
effect, and the adoption of a common customs tariff in their relations with third countries.”
Articles 34 and 35 prohibit quantitative restrictions
on imports and exports between Member States. Articles 45 and 46 mandate freedom of movement
for workers Article 101 prohibits practices that may affect trade
between Member States or prevent free competition within the internal market.
Article 102 prohibits the abuse of dominant position
from undertakings within the internal market.
Free trade in the Single Market includes practices such as parallel trade and regulates many others, such as
procurement.
Trade allows the efficient re-allocation of the outputs of production, given how they were produced. But if
capital and labour move freely, then they can be located efficiently such that production methods are
optimally efficient.
The precise border between the promotion of certain of these freedoms and others is a little unclear. For
example, to what extent is the promotion of a Single Market in financial services a measure that promotes
the free movement of services, and to what extent is it promoting the free movement of capital? However,
although there is a vagueness here, because the Single Market has a commitment to promoting all four
freedoms, the main significance of this vagueness arises when it comes to questions such as “How should
we measure how much progress has been made in promoting trade in services?” (do the financial services
count as in or out?), rather than in everyday policymaking.
There might be fairly explicit barriers to the movement of capital and labour, such as capital controls or
immigration restrictions, that are close analogues of tariffs or quotas. But, just as there are many non-tariff
barriers to trade, there are also many similar more implicit and complex barriers to the movement of
capital and labour. For example, if pension funds must invest a certain proportion of their resources in
domestic assets, the ability of that capital to be placed abroad is limited. If a worker could not port pension
or benefits entitlements to another country, that constitutes a barrier to the movement of labour.
In this way, the promotion of the Single Market can imply action in a wide range of policy areas not
immediately obviously connected to trade or production. Indeed, carried to its logical limit there is almost

What is the Single Market and what Policies are used to Create and Sustain it?
- 14 -
no policy area that could not be seen as in some way connected with the Single Market. For example, if
labour is allowed to move freely, that might be conceived as implying no border guards checking people
entering or leaving countries, no showing of identity cards or passports, etc.. But that also may mean no
guards preventing criminals skipping outside the reach of the legal authorities where they committed their
crimes. If countries are to be happy not to restrict movement across borders, they may also want to
achieve a high level of agreement about the pursuit and return of criminals that enter other Member States.
In this way, the criminal law, extradition, and policing principles could all in principle be seen as affected by
the Single Market.
Such extensions of the reach of the Single Market lead on to the question of what is a “natural” barrier as
opposed to one that is either the creation of policy or could and should be removed by policy.
Box 2: Example — Natural vs policy-induced barriers in equity markets
Oxelheim (2000) enumerates the following factors that maintain differences between (or within) equity
markets:8
1. “asymmetric information available to investors
resident in different countries. This includes not only financial data on corporations but also the
analytical methods used to evaluate the validity of a security
2. different tax regulations, especially with regard to the
treatment of capital gains and the double taxation of dividends;
3. regulations on security markets;
4. alternative sets of optimal portfolios from the
perspective of investors resident in one equity market compared to investors resident in other
equity markets;
5. different agency costs for firms in bank-dominated
markets compared to firms in the Anglo-American markets;
6. different levels of risk tolerance, such as debt ratios,
in different countries;
7. differences in perceived foreign exchange risk,
especially with respect to operating and transaction exposure;
8. political risk such as unpredictable government
interference in capital markets and arbitrary changes in rules;
9. take-over defenses that differ widely between the
Anglo-American market, characterized by one-share-one-vote, and other markets featuring dual
classes of stock and other take-over barriers; and
10. the level of transaction costs involved in purchasing,
selling and trading securities.”
As Europe Economics argued in another report, “Many of these ten represent differences in natural economic
factors such as costs, preferences or endowments, rather than differences explicitly intended to protect markets. For
example, this will be the case for (1) (information differences — a cost difference); (2) (tax differences — insofar as
these arise from differences in public expenditure preferences they are simply differences in political preferences);
(4) (investment preferences differences); (5) (market structure differences — bald facts, unrelated to barriers); (6)
(differing risk preferences); (8) (political risk — insofar as this simply represents more volatile political
preferences).”9
8 Oxelheim, L., (2000) “Routes To Equity Market Integration — The Interplay Between Politicians, Investors And
Managers”, Forthcoming, Journal of Multinational Financial Management, footnote 2, referring to Oxelheim, L.,
Stonehill, A., Randöy, T., Vikkula, K., Dullum, K.B. and K-M. Modén, (1998) Corporate Strategies to Internationalise
the Cost of Capital (Copenhagen Business School Press, Copenhagen). 9 Financial Services Authority (April 2006) “The Benefits of MiFID”, a report prepared by Europe Economics.

What is the Single Market and what Policies are used to Create and Sustain it?
- 15 -
Whilst some factors segmenting markets appear to be natural characteristics, even then they might be
influenced (and even created) by policy. Hence, it could be debated whether to take them as given when
designing the rules of the Single Market. For example, language differences could be seen as segmenting
certain product markets (e.g. those in which health warnings are required on packets) and in restricting the
movement of labour. Indeed, in many countries the use of the standard national language has been
explicitly encouraged through compulsory teaching and use in schools. So does the pursuit of the Single
Market imply that all children in Europe should be taught one common language? If not, and language
difference is declared to be a “natural” barrier even though it could be changed by policy, why are other
differences not similarly just accepted?
A well-known example illustrating the potential arbitrariness of the “policy-induced”/”natural” barriers
distinction is currency differences. The euro project had many motivations — for some advocates,
creation of a credible fixed exchange rate regime; for others, delivering an improvement in monetary policy
management; for yet others, promoting eventual political union. But there were those that argued that
differences in currencies and in monetary management techniques constituted a non-tariff barrier to trade
and to the free movement of capital. However, it could alternatively be argued that a difference in
currencies is not materially less natural than a difference in languages.
Box 3: The Italian language vs the Italian currency — which is natural and which is policy?
As an example of the discussion above, the Italian lira was introduced in 1861 as a common currency for
the new Italian state, but at that time only 2.5 per cent of the Italian population spoke the Italian
standardized language fluently. The Italian language was diffused more widely, as a matter of policy, via
compulsory use in schools, over subsequent decades.
One implication of the presence of “natural” barriers to integration is that we should be cautious about
assuming that full integration is feasible — or, if it is feasible, that the measures required to achieve it and
then sustain it against its natural tendency to fall back would not themselves be highly artificial, distortionary
and expensive to maintain. For example, some quantitative studies of the potential gains from further
development of the Single Market use estimates of the difference between current and perfect integration
as their measure of the potential for gains, and then arbitrarily assume that some portion of those gains
(say, half or three quarters) could be realised by policy. But insofar as residual barriers to integration are
“natural”, such an approach is subject to the criticism that it may not be feasible to remove natural barriers,
and, if it is, it might be counterproductive. We should not naïvely assume that increased integration is
axiomatically beneficial and in principle achievable.
2.6 Mutual Recognition, Harmonisation and Best Practice spreading
Policymakers have a number of different tools available to strip away non-tariff barriers. The two best-
known are called “mutual recognition” and “harmonisation”.
Under mutual recognition, there is agreement at an EU-wide level that Member States will accept the rules,
definitions, requirements and standards imposed by other countries. The legal principle of mutual
recognition within Europe famously first arose in the Cassis de Dijon case.10 In that case, the company
Rewe-Zentral AG sought to import a liqueur from France into Germany but was forbidden to do so
because of a German law forbidding the sale of spirits with an alcohol content below 32 per cent, whilst
Cassis de Dijon had only 15-20 per cent. The European Court of Justice ruled that barriers to free trade
within the Community included “any national measure capable of hindering, directly or indirectly, actually
or potentially, intra-Community trade” and that this includes technical and commercial rules. As the
10 http://ec.europa.eu/enterprise/policies/single-market-goods/files/goods/docs/mutrec/cassisdijon_en.pdf

What is the Single Market and what Policies are used to Create and Sustain it?
- 16 -
Commission put it11, the principle of mutual recognition meant that “Any product imported from another
Member State must in principle be admitted to the territory of the importing Member State if it has been
lawfully produced, that is, conforms to rules and processes of manufacture that are customarily and
traditionally accepted in the exporting country, and is marketed in the territory of the latter.” So under
mutual recognition, rules could differ across the EU but each Member State would accept imported
products produced under the rules other countries imposed.
Mutual recognition is usually contrasted with “harmonisation”. When rules are harmonised across the EU,
there is some Treaty commitment, EU Directive or EU Regulation that requires all Member States to
implement the same rules.
There are, as one would expect, pros and cons to mutual recognition versus harmonisation. First,
harmonisation of rules risks destroying that difference that is the main basis of mutually advantageous trade.
Mutual recognition, by contrast, allows the setting of rules to occur “locally”, i.e. close to those most
affected by the rules, meaning that rules and enforcement thereof is most aware of specific local
circumstances that might mean a rule set far away for hundreds of millions of people was irrelevant or
disproportionately burdensome. (Recognising the advantage of setting rules closer to those affected by
them is called the principle of “subsidiarity”.)
However, mutual recognition can lead to regulatory competition taking the form of a race to the bottom.
Whichever Member State is willing to impose the laxest rules will attract all the producers to locate their
business there and from there export to the rest of the EU. The consequence could then be that mutual
recognition results in health and safety or environmental or quality standards being unsustainable at any but
the sparsest level. If most citizens of the EU would prefer to have higher standards, it seems paradoxical
that freedom of trade and factor movement should mean an end to high standards. To sustain higher
standards, harmonisation may be the required route. In this sense, mutual recognition can be seen as the
non-tariff-barrier version of a free trade area whilst mutual harmonisation is like a customs union with a
“harmonised” external tariff. Much those same kinds of pressures that lead countries to prefer a customs
union over a free trade area — namely the desire to avoid race-to-the-bottom pressures — will lead them,
within a customs union, to prefer harmonisation over mutual recognition.
Another reason for favouring harmonisation might be that the EU allows harmonised collective action that
creates synergies compared with purely domestic policy. For example, if weather patterns meant that
sulphur or other chemical emissions from French factories tended to blow across borders, being deposited
in the UK or Spain or Italy, French regulations to restrict such emissions might naturally be less restrictive
than if all those chemicals fell in France. Policy seeking to take account of environmental externalities is
affected by where policy is set. The natural first priority of policymakers will be their own citizens, so
there might be two types of externality here: the environmental damage done by the polluter that does not
affect the firm itself; and environmental damage done external to the borders of the policymaker. Similar
considerations might apply to pollution from British or Spanish or Italian companies that affected France.
By acting in a harmonised way, policymakers can internalise (to policymaking) a wider range of cross-
border impacts.
Although we have used environmental impacts to illustrate this point, it is of wider application — for
example, systemic effects of financial crises may apply across borders. Externalities can of course be
positive as well as negative — if some academics trained in the UK go to work in Italy and some trained in
Italy come to work in the UK, although the UK could be said to have “subsidized Italy” by funding academic
training, collectively the effects net out.
Synergies also favour harmonisation, via the Treaty, in areas such as competition policy, merger policy, or
market liberalisation policies. Products imported from elsewhere in a customs union might be a key driver
11 http://eur-lex.europa.eu/LexUriServ/LexUriServ.do?uri=CELEX:31980Y1003(01):EN:HTML

What is the Single Market and what Policies are used to Create and Sustain it?
- 17 -
of competition with a domestic producer. So a merger between that domestic producer and the foreign
supplier might damage domestic competition. But domestically-located competition or merger authorities
may have little influence over or ability to block such a foreign merger. By contrast, for the Single Market
as a whole we can have, established via harmonised Treaty principles and enforced via both national
competition authorities and EU-level authorities (e.g. DGCOMP and the European Court of Justice),
competition and merger policies that take account of competitive pressures within the Single Market
collectively.
Following from this, it may seem inevitable that achieving a high degree of integration in a Single Market will
entail a high degree of harmonisation.
On the other hand, not all regulatory competition is damaging, and not all regulatory competition proceeds
by “less” regulation competing with “more”. Instead, sometimes regulatory competition occurs between
simply “different” regulation that is neither greater nor less. And sometimes such differences in regulation
allow policymakers to observe what works best in practice and then copy that best practice.
This leads us to a third EU-level policy option. Rather than harmonising initially, it could be advantageous
to proceed via mutual recognition for a period until there a policymaker consensus as to what constitutes
best practice, and only then to introduce harmonisation. One example of this might be the Markets in
Financial Instruments Directive (MIFID). The previous regulatory framework (the Investment Services
Directive) had left in place considerable scope for national policymakers to reflect national preferences and
national theories about best practice. This meant, for example, that whilst in some countries (e.g. France,
Italy and Spain) there were “concentration rules” requiring certain sorts of trade to pass through so-called
“regulated markets” (e.g. the main stock exchange), in other countries (e.g. Britain) large investment banks
were permitted to match “buy” and “sell” orders amongst their own customers without proceeding via the
exchange (in the jargon this is called “systematic internalising”). By the time of MIFID, policymakers had
decided that the British practice was the best practice, and the MIFID closely reflected British norms and
policy theories, and so harmonisation occurred by imposing British best practice as the harmonised
requirement across the EU.12
However, even regulatory competition based on difference, rather than quantity, may not be valuable. It
could be, for example, that two different regulatory approaches are simply different but equally good but
that matters will be more efficient if one is chosen from the outset. An example might be some technical
standard in mobile telephony or information technology — there may be lots of different possible
standards that are all fairly similar in their merits. Perhaps a phase of regulatory competition might reveal
that one has some minor advantage over the others, but by that stage there will be considerable
transitional costs involved in forcing others over to a newly-instituted common standard. Establishing a
harmonised way forward from the beginning might avoid such costs.
In summary, such an approach — mutual recognition to permit regulatory competition to identify best
practice, then impose best practice via harmonisation — will work well if (a) the period of competition
proceeds via difference, not simply more versus less; (b) difference entails a difference in quality (something
is better and something else worse as opposed to them being merely different) which cannot be seen (or
not seen decisively) before observing different practical outcomes in different countries and yet can be seen
(or seen more clearly) after observing those practical outcomes; (c) if regulatory best practice and the
context in which regulation is set (e.g. market conditions, tastes) means that best practice is stable once
identified (otherwise ending regulatory competition via harmonisation will forego later gains from
regulatory competition).
12 For much more detail on how MiFID reflected British policy concepts, see later, Section 7.3.1.3.
What is the Single Market and what Policies are used to Create and Sustain it?
- 18 -
2.7 Alternative goals for the Single Market project and their import for
mutual recognition versus harmonisation
Our discussion so far has proceeded as if the only proper goal of the Single Market were the facilitation of
trade between its members. But it is far from clear that this is the only or even the main goal of the
European Single Market, or indeed of other past trading arrangements.
In his Foreword to the famous 1988 Cecchini Report that provided the analytical underpinning for the
Single Market Programme, President of the European Commission Jacques Delors wrote this:
“The countries of the European Community needed a common objective which could raise their sights above daily
routine problems and thereby concentrate their energies. It was for this reason that my colleagues and I in the
Commission proposed…that we should create a truly unified economic area in Europe by 1992….It is
revolutionary, but it will be achieved both because it is absolutely necessary and because it carries with it the goal
of a united and strong Europe.” (Emphasis added)
Many trading arrangements are fundamentally political in purpose. For example, the German Customs
Union of the 19th century was intended to be a building block towards the creation of the state of
Germany. Other trading relationships are intended to divert trading and migratory activity to friendly
powers and away from unfriendly powers. It would be naïve to divorce the development of the EEC
customs union from the geopolitical struggle between the Warsaw Pact and the West. Again, policies such
as the Common Agricultural Policy arose at least partly in response to the famines in Europe of the 1940s13
and had at their core the goal of re-assuring the populations of Western Europe that Western Europe
could feed itself.
The Single Market project may already have anticipated the development of the Single Currency — which
could be understood and defended as a monetary project (e.g. a robust extension of a fixed exchange rate
regime, building upon ERM and earlier ventures, or a means to export monetary policy-making best
practice — often assumed to be that of the Bundesbank14 — to Member States with poor histories of
inflation management). The euro might even have anticipated later fiscal union, and been intended to
enable and prepare the ground for recent developments in that area.
The above points are not of mere historical interest. For in considering whether, for example, mutual
recognition or harmonisation is the best approach in a particular policy area, or whether in some other
area subsidiarity considerations outweigh “level playing field” ambitions, which option is best might depend
on whether the goal is to facilitate the functioning of a single currency, fiscal union, and further political
deepening (which might naturally favour harmonisation over mutual recognition), or whether the goal is to
maximise trade, competition and innovation.
Another weakness of the trade-only approach set out above is that it might fail to recognise dynamic
aspects of policy-setting, having a tendency to treat the policy-making process as given and optimal.
13 During World War II there were occupation-related famines in Greece (1941-44), Poland (1940-43), and the
Netherlands (1944), but after the war Germany came very close to famine and the British instituted two years of
bread rationing from 1946 so as to have grain available to send to the Continent to avert famine there — for an
interesting contemporary perspective see: http://www.britishpathe.com/video/germanys-food-the-truth-aka-germans-
food-the/query/bread+rationing 14 e.g. Consider the following quote from Kaltenthaler, K. (2005) “The Bundesbank and the formation of the ECB's
monetary policy strategy”, German Politics, 14(3): “The ECB is almost a complete copy of the Bundesbank's organization,
having adopted the Bundesbank's definition of price stability and its monetary targeting strategy. But rather than following
simply from coercive power attached to the relative size of the German economy and EU budget contribution, the decision to
emulate the German monetary policy model was the result of the persuasive power of the Bundesbank, the domestic success of
the German model, and the hope held by European central bankers and many European politicians that success could be
replicated on the European level.”

What is the Single Market and what Policies are used to Create and Sustain it?
- 19 -
The above caveats notwithstanding, in the more detailed analysis that follows we shall consider the Single
Market mainly from what we understand as a UK policy perspective — thus focused upon trade,
competition, the diffusion of innovation, and collective action in respect of environmental externalities,
whilst recognising that such objectives may not be the only or even central goals of the institutions of the
European Union themselves. However, where such analysis suggests that policies are not optimal from a
UK policy perspective, it could be important to understand whether that is because they are optimal from
some other perspective, or whether it is simply that they are not optimal at all.

How to Assess Optimal Integration in a Single Market
- 20 -
3 How to Assess Optimal Integration in
a Single Market
In Section 2 we have seen that a Single Market can be treated as a form of trading area, extending the
principles of a customs union from a narrow focus on explicit barriers to trade, such as tariffs, quotas, and
state aid, to more implicit potential barriers such as health and safety rules or product standards, and from
a focus upon the outputs of production (goods and services) to the inputs (capital and labour). We have
also seen that involvement in the development of a Single Market involves compromises and trade-offs.
In this paper we shall analyse the trade-offs involved in a Single Market in more detail, and show how the
presence of such trade-offs implies that, in principle (though it may be challenging to identify empirically
with any indisputable precision), there may exist an “optimal” level of integration that is less than total
integration.
3.1 The Trade-offs in a Single Market
In Section 2 we saw that any customs union involves pros and cons, and qua customs union the Single
Market is no different.
3.1.1 The positives
Certain of the positives of involvement in a Single Market are fairly straightforward to set out. They will
include:
gains from trade — by stripping away tariffs and non-tariff barriers, trade with Single Market
partners increases (the “trade creation” effect of a customs union, amplified by the additional
reduction in barriers in a Single Market), increasing the gains from trade from that source.
gains to competition — increased trade means increased competitive pressure from abroad,
reducing prices for consumers and increasing technical and allocative efficiency within and between
firms and industries.15
gains to efficiency from economies of scale and scope — through more straightforward
access to larger markets (the whole Single Market) firms can operate at a larger scale, and the free
movement of capital and labour allows international relocation to where production is most
efficient in scale (bigger often equals cheaper) and scope (the same production inputs might be used
for multiple purposes).
gains to innovation — the deep interchange of ideas and methods across different settings and
cultures facilitated by a Single Market can be a driver of increased creativity in innovation.
policy synergies where effects spill over borders — in areas such an environmental policy or
higher education.
These are what one might call “final goals” of Single Market development policies. An analogy here might
be drawn with monetary policy. Economists used to believe that although consumers, workers and
investors care about inflation, it was infeasible directly to control inflation. So although controlling inflation
15 As noted in Section 2, in a Single Market competition will be promoted in respect of retail goods and services,
intermediate goods and services, and factors of production.

How to Assess Optimal Integration in a Single Market
- 21 -
was the “final goal”, monetary policy should be directed at the “intermediate goal” of controlling some
measure of the money supply. And that again was distinct from the “instruments” policymakers had
available to control the money supply, such as interest rates or bank capital rules.
In much the same way, although what is of ultimate interest is the gains from trade, gains to competition,
etc., in many practical analyses (e.g. impact assessments conducted for the European Commission or
Parliament) the relevant “intermediate positives” are the four freedoms — free movement of goods,
services, capital and labour. These are distinct from the methods used to promote these positives,
such as mutual recognition, harmonisation, and those in turn distinct from the instruments used to
implement the methods, such as Treaty articles, Competition rules, Directives, Regulations, and
infringement proceedings.
Other positives are more subtle. For example, a key gain from involvement in a Single Market project may
be the opportunity to improve policy-setting in other countries. 16 As explored in Section 2 in the
case of MIFID, via the EU the UK may have influence over how financial services regulation is set for, say,
Italy.17 That may not simply be a matter of optimal policy-setting being different if determined at EU rather
than the Italian governmental level. It could be that UK ideas would have been better for Italy even if
simply adopted by the Italian government absent the EU. But the EU Single Market creates a mechanism
whereby UK policy concepts can be exported to and adopted elsewhere in the EU (and vice versa). As we
shall discuss further below, such influence to improve policy-making elsewhere, mediated via influence over
the European Commission, is an oft-overlooked potential gain of the Single Market. On the other hand,
such influence could also be lost over time — e.g. perhaps as a result of economic events shaking political
confidence in a policy-making paradigm (e.g. perhaps the global financial crisis creating scepticism, amongst
Continental politicians, of “Anglo-Saxon” concepts of financial regulation); or because those that participate
in key EU projects are more influenced by those partners in those projects than by non-partners (e.g. it is
sometimes suggested that euro members may eventually “bloc vote” on Single Market issues18).19
3.1.2 The negatives
We identify four key categories of negative from the Single Market:
trade diversion losses — as explained earlier in our discussion of a customs union, from the
gains from trade created by a Single Market one must net off the losses from trade diverted
inefficiently into the Single Market from outside.
sovereignty/democracy costs — it was noted above that a positive of the Single Market is that
it allows us to improve policy-setting elsewhere. The flip-side is that we may find our own policies
improved, in ways that clash with our sovereign autonomy and democracy — our ability to make
our own mistakes in our own way. Paradoxically, although those acceding to the EU must meet
high democratic standards, a central purpose of the European Union has always been understood
as delivering policies that domestic political systems would be unable to deliver for themselves.20
16 It could be argued that this should not be treated as a separate “positive” here, but instead is implicitly contained
already in other benefits, in that the result of improved policy in other countries ought to be increased UK gains from
trade, enhanced competition, increased gains to efficiency from economies of scale and scope, etc.. 17 For much more detail on how MiFID reflected British policy concepts, see later, Section 7.3.1.3. 18 See, for instance, p4 of Open Europe (2012) “Safeguarding The Single Market: How to achieve a balanced
European Banking Authority”, http://www.openeurope.org.uk/Content/Documents/PDFs/EBAsafeguards.pdf 19 For as much more detailed consideration of influence, see Section 7. 20 EU membership can in this sense be seen as a commitment device to circumvent the problem that voters may will
in general what they oppose in particular — e.g. they may prefer a general system of no non-tariff barriers to a system
of widespread non-tariff barriers, but each particular non-tariff barrier seems attractive to maintain. It is therefore
advantageous, to deliver the voter preference for the general system, to pre-commit to that general principle via the
EU, which then shields policy-makers from the pressure to give way in each and every specific case.
How to Assess Optimal Integration in a Single Market
- 22 -
Trade barriers were removed, competition was introduced, subsidies for businesses were reduced,
regulations were liberalised via the EU in ways that would never have been voted for had they been
proposed domestically. We treat such changes as positives, but their counterpart is the
sovereignty/democracy costs they entail.21
subsidiarity costs — we have understood by “sovereignty costs” the loss of our ability to make
our own mistakes in our own way. Subsidiarity costs are distinct, in being those costs intrinsically
associated with harmonised and centralised policy-setting as opposed to more locally-determined
policy, not because of autonomy of the policy-setting process but because the final policy itself
becomes less close to (locally) optimal. To put the point more simply and concretely, consider a
customs union, in which the external tariff is harmonised and set centrally or collectively. In our
earlier discussion of customs unions we assumed, for simplicity, that the external tariff imposed by
the customs union on imports from non-members would be the same as the tariff set by the
domestic country (us) if it were not in the customs union. But suppose the customs union would
(optimally) set a higher or lower external tariff than we would if left to ourselves, and that the tariff
we would choose for ourselves would in fact be optimal from our point of view. Then one of the
losses of membership of the customs union is that the external tariff that is optimal overall (as it
were, “globally”) is not the same as what is optimal for us (as it were, “locally”). What is true here
of tariffs is also potentially true of levels and natures of regulation, implementation timescales for
regulatory changes, and all the other aspects of non-tariff-barrier tackling.
process costs — the creation and maintenance of the institutions of the EU have to be funded,
the rules and regulations of the EU must be adapted to and complied with, infringement
proceedings must be responded to. Insofar as they are additional to national regulatory process
costs that would be entailed anyway, these are all processes that entail cost.
3.1.3 Stylised graphical presentation of different ways benefits and costs might be
affected by the degree of harmonisation
Let us describe the process of establishing a customs union and then Single Market and then more
harmonised rules within the Single Market as entailing increasing degrees of integration. Let us pack
together the positives of this process, net of trade diversion losses, and term them “benefits”. And let us
pack together the rest of the negatives and term them “costs”. Then we could imagine drawing graphs of
how benefits and costs changed as the degree of integration increased. There are a number of different
possibilities for such evolution, as we explore in Figures 2 and 3. (Note (i) that these four scenarios are
not intended to be comprehensive of all possibilities, but instead to describe four cases of interest; and (ii)
that the four benefits scenarios and the four costs scenarios are independent — benefits scenario (a) could,
in principle, be combined with costs scenario (B) just as much as with cost scenario (A).)
21 In much the same way, a super-independent central bank (e.g. the European Central Bank) might be a commitment
device to deliver low inflation. The low inflation is a positive, but its counterpart is the loss (or “pooling”) of
sovereign control of interest rates entailed.

How to Assess Optimal Integration in a Single Market
- 23 -
Figure 3.1: Possible benefit curves for four phases of economic integration: customs union (CU),
predominance of non-tariff barriers (NTB), single market (SM) and total harmonisation (TH).
In Figure 3.1, we consider four ways benefits might evolve:
a) In this scenario, there is a steep increase in benefits from the gains of trade generated by the
customs union. In the subsequent phases of increased harmonisation, the derived benefits are less
significant, due to the countervailing rise of non-tariff barriers. After considerable progress in the
integration process, a Single Market is created and further benefits are reaped. Total
harmonisation continues to generate benefits, albeit smaller, at the margin, than those generated by
the creation of the single market.
b) This scenario is similar to Panel (a), except that further harmonisation beyond a functioning Single
Market to total harmonisation in this scenario translates into a decrease in benefits due to
excessive regulation and disincentives to innovation. This decrease in benefits might be large
enough to outweigh the gains from a single market.
c) In this scenario there are significant gains from trade as a consequence of the customs union, but
further integration (even the creation of the single market) results in a mild but constant decrease
in benefits.
d) In this scenario there are no significant gains from trade from the customs union itself. This could
be because trade creation and trade diversion compensate each other or because non-tariff
barriers preclude significant trade. Gains from trade are nevertheless realised once the single
market is functioning. As in panel (a), total harmonisation results in a decrease in benefits.
Emphasising again that these are only the benefits — we shall analyse the costs shortly — we could crudely
characterise (a) as the “single state” or “harmonisation optimists’” view, according to which increasing
harmonisation always enhances benefits, even at the point of total harmonisation. Scenario (b) might
How to Assess Optimal Integration in a Single Market
- 24 -
perhaps be called the “status quo view” — that both the customs union and the Single Market have had
benefits, with there being a leap in integration required to overcome non-tariff barriers and move to a
Single Market, but moving beyond them to total harmonisation would eventually entail damaging over-
regulation.22 Scenario (c) might be said to be the “Common Market only” view, according to which
membership of the customs union is beneficial but further integration beyond that is damaging. Case (d) is
of potential interest to advocates of “unilateral free trade” who reject membership of any form of customs
union as damaging, but might concede that the single market entails the stripping away of non-tariff barriers,
eliminating deadweight costs, that the unilateral free trade approach cannot address.23
Next, we consider scenarios for costs. (We emphasize again that these are independent of / orthogonal to
the benefits scenarios — scenario (A) is not intended to be understood as the costs arising in benefits
scenario (a).)
22 Note that we are describing gross benefits here, not net benefits, so the point is not simply that the regulation
required to deliver increased integration is costly to introduce and maintain — that may be true, but if so would
appear in our “Costs” curves. Rather, here the concept is that even if increased integration could be achieved
costlessly in itself, it would still entail disbenefits, perhaps because “natural” barriers to integration would have to be
stripped away and those natural barriers had some efficacy (e.g. they may have protected something else, such as
culture), or because the level of vigilance required to prevent integration from falling back from such a high level might
stifle innovation and/or healthy competition. 23 We observe that it is not uncommon in studies of the comparative advantage of the EU versus alternative trading
relationships to regard the key advantage of the EU over alternatives not to be the presence of a customs union as
such (which, as noted in Section 2 might have cons as well as pros, and alternative customs union or free trade
agreement arrangements could be imagined — e.g. perhaps with NAFTA) but, rather the reduction in non-tariff
barriers under the EU’s Single Market programme. For example, see BIS (February 2011), “The economic
consequences for the UK and the EU of completing the Single Market”,
http://www.bis.gov.uk/assets/BISCore/economics-and-statistics/docs/E/11-517-economic-consequences-of-completing-
single-market.pdf

How to Assess Optimal Integration in a Single Market
- 25 -
Figure 3.2: Possible cost curves for four phases of economic integration: customs union (CU),
predominance of non-tariff barriers (NTB), single market (SM) and total harmonisation (TH).
In Figure 3.2, we consider four ways costs might evolve with integration:
A. It becomes more and more expensive to achieve increased degrees of integration, with each
additional increment to integration being more expensive than the last. (We could imagine, for
example, that “low-hanging fruit” is most naturally dealt with first, then built upon with increasingly
more costly measures.)
B. In this case, the initial costs of integration are considerable, since a significant number of institutions
need to be put in place. But after this stage, although increasing integration is always costly, by
contrast with case (A), each additional increment to integration is less expensive than the last.
C. This case combines cases (A) and (B) in that there are initial set-up costs of achieving any
integration, which are then followed by a flatter phase (we can think of this as a kind of economies
of scale for integration). With the introduction of the single market, marginal costs start to
increase again (the Single Market requires the establishment of additional new institutions and is
more costly to create and enforce). The total harmonisation phase is characterised by increasing
costs (we could interpret these as the costs of over-regulation required to deliver harmonisation).
D. In this case, the first three phases are the same as in panel (C), but marginal costs diminish
considerably in the total harmonisation phase (once the Single Market is sufficiently complete, the
marginal additional costs of achieving total harmonisation are modest).

How to Assess Optimal Integration in a Single Market
- 26 -
The benefits and costs can then be combined, to find a number of stylised possible alternative patterns
relating net benefits (benefits minus costs) from integration, as in Figure 3.3.
Figure 3.3: Possible net benefit curves for four phases of economic integration: customs union (CU),
predominance of non-tariff barriers (NTB), single market (SM) and total harmonisation (TH).
In Figure 3.3 we label our curves according to the combinations of benefits and costs curves they reflect.
So, for example, the basic pattern in the panel marked “Bb, Ba, Cb, Ca” is that obtained if cost curve B
from Figure 3 is combined with benefit curve b to produce a Bb scenario, or cost curve B is combined with
benefit curve a, or cost curve C is combined with benefit curve b, or cost curve C is combined with benefit
curve a.24
These net benefits are instructive, showing how different combinations of costs and benefits can produce
different forms of optimal integration. In the top left panel there are two “local” optima (peaks of the
curves) — net benefits reach a local optimum at the establishment of the customs union, falling away with
the non-tariff-barriers dominance phase, and reach their global optimum (the highest possible point for net
benefits) in the midst of the Single Market phase. That implies that with this combination of costs and
benefits, unless there is sufficient commitment to reach enough integration to make a Single Market work,
it would be better to be content with a customs union, but with enough commitment a Single Market is
beneficial.
24 There would be some potential difference of pattern at the very end of the curve for case Ba — in principle the
net benefit curve here could loop upwards towards the end, if the positive slope from increasing benefits of
harmonisation from a were steeper than the positive slope from increasing costs in B. Similarly, curve Da might curve
upwards at the very end — a point to which we shall return below.

How to Assess Optimal Integration in a Single Market
- 27 -
In the top middle panel, we see a reverse case, in which although there is a local optimum for the Single
Market, it would have been better to be content with a customs union. In the top right panel, from the
establishment of the customs union up to very high levels of integration the additional benefits of
integration are largely balanced by the additional costs.
In the bottom left panel, there is one peak for net benefits, at the establishment of the customs union, and
the attempt to create a Single Market causes benefits to go negative. In the bottom middle panel, the costs
of a customs union outweigh its benefits and it is only once a Single Market is in place that real benefits
start to emerge, but the process of integration eventually entails over-regulation that causes net benefits to
drop.
In the bottom right panel, once the customs union gets going, there are material net benefits, but the
process of increasing integration entails costs that broadly offset benefits, except in the potential case
illustrated with the dotted line, in which total harmonisation implies very high benefits, so that incremental
benefits from further integration eventually outstrip incremental costs, and the optimal policy is to drive on
to total harmonisation, regardless of the apparent lack of net beneficial progress until the very end.
These six net benefit shapes are, like the cost and benefit curves before them, not comprehensive, even as
an expression of combinations of the subset of cost and benefit curves we have exhibited. In particular, the
precise patterns depend to some extent on the relativities between the cost and benefits curves. For
example, in A we exhibit a rising cost curve, but that in itself does not guarantee that, even at its highest
point, the cost curve is not one one thousandth of, or alternatively one thousand times, the amount of the
benefits curve at that point. The patterns we exhibit arise only if costs and benefits are at least of a similar
order of magnitude, with the implication that the decision to proceed with additional integration at at least
some stages of the process entailed a policy judgement, rather than being always an obvious “no-brainer”
(one way or the other).
3.2 Procedure for Assessing How Optimal Integration is
These caveats noted, if we proceed on the assumption that at least some integration decisions required a
policy judgement, our curves in Figure 4 point us to a broad strategy for assessing how close to optimal
integration (i.e. the degree of “harmonisation” in our figures) in a particular sector is, namely:
Estimate broad shape of benefits curves using trade, concentration (i.e. competition/liberalisation),
and unit costs data.
Estimate disbenefits from trade diversion using data on international competitiveness (e.g. unit
labour costs data for EU vs non-EU countries)
Estimate costs of implementing integration (e.g. costs of EU institutions) and costs of regulation to
create integration (e.g. compliance costs)
Proxy for the shape of curves by considering how these costs and benefits obtained above have
changed over time as we moved through customs union to Single Market and beyond.
Cross compare costs and benefits curves to identify which of the above patterns of net benefits we
are in.
Form a judgement as to which “phase” we are in — e.g. are we still in the NTB phase, or have we
reached somewhere in the Single Market, or are we now approaching total harmonisation? 25
25 We observe that this approach does capture policy synergies, if only implicitly, since policy synergies should
typically enhances general welfare and efficiency and thus increase demand and output (and so be reflected in
increased trade) whilst reducing costs. However, it is plausible that policy synergies produce their fruits over much

Measuring Economic Integration
- 28 -
4 Measuring Economic Integration
In the previous section we have discussed potential patterns for how the costs and benefits of integration
might vary with the degree of integration. To convert these thoughts into empirical practice we need some
way to quantify or assess:
The degree of economic integration
How benefits vary with the degree of integration
How costs vary with the degree of integration
In this section we consider the first of these, contrasting integration-promoting policy measures with
economic integration.
4.1 Methodological issues: “Input” vs “Output” Measures of Integration
Much European policy discussion of “integration” treats it as a decision, the product of policy — the
process of “integration” is seen as a series of “integrating” (de-)regulatory decisions. According to this
concept, the degree of integration would be measured by progress in introducing and implementing the
policy measures that create/constitute integration: removal of internal tariffs; removal of non-tariff barriers;
enforcement of liberalisation and competition rules; and so on. Many regulatory programmes are complex
(e.g. the Financial Services Action Plan to introduce a Single Market in financial services was made up of 42
measures introduced and implemented over at least an eight year period), making it complex to measure
how much of the programme has been implemented at any one point in time. Nonetheless, in principle
one approach to measuring the degree of integration is to assess progress in the introduction and
implementation of policy measures. We might term these policy measures the “inputs” to integration.
Another approach would measure integration by its “outputs” — by the features that an integrated market
would exhibit — for example:
Prices of outputs and inputs. In a successful Single Market, where the Four Freedoms function well, we
would expect to see convergence in prices. The relevant prices are:
o Goods and services (final and intermediate).
o Wages. This might apply to overall integration (e.g. convergence in the hourly wage for the total
economy) or for specific sectors (e.g. hourly wages in those sectors).
o Cost of capital. In a Single Market with free movement of capital we expect to see convergence in
both retail borrowing rates (such as rates available for housing, consumer or enterprises) and
lending/investment rates (such as money market and day-to-day money rates) — though the speed
of convergence might differ for retail and lending rates.
Trade and labour migration. As with prices, further integration would be expected to translate into
larger quantities moved within the European Union, either through trade of goods and services or
worker migration. The relevant measures might include the amount of trade among countries in the
longer timescales than we have data available to consider — e.g. higher education synergies might produce new blue
skies ideas that find practical application only in 30 years; environmental policies might affect output in 100 years.
Similarly, dynamic influence on the policy of other Member States should issue in benefits in terms of increased trade,
efficiency, etc.
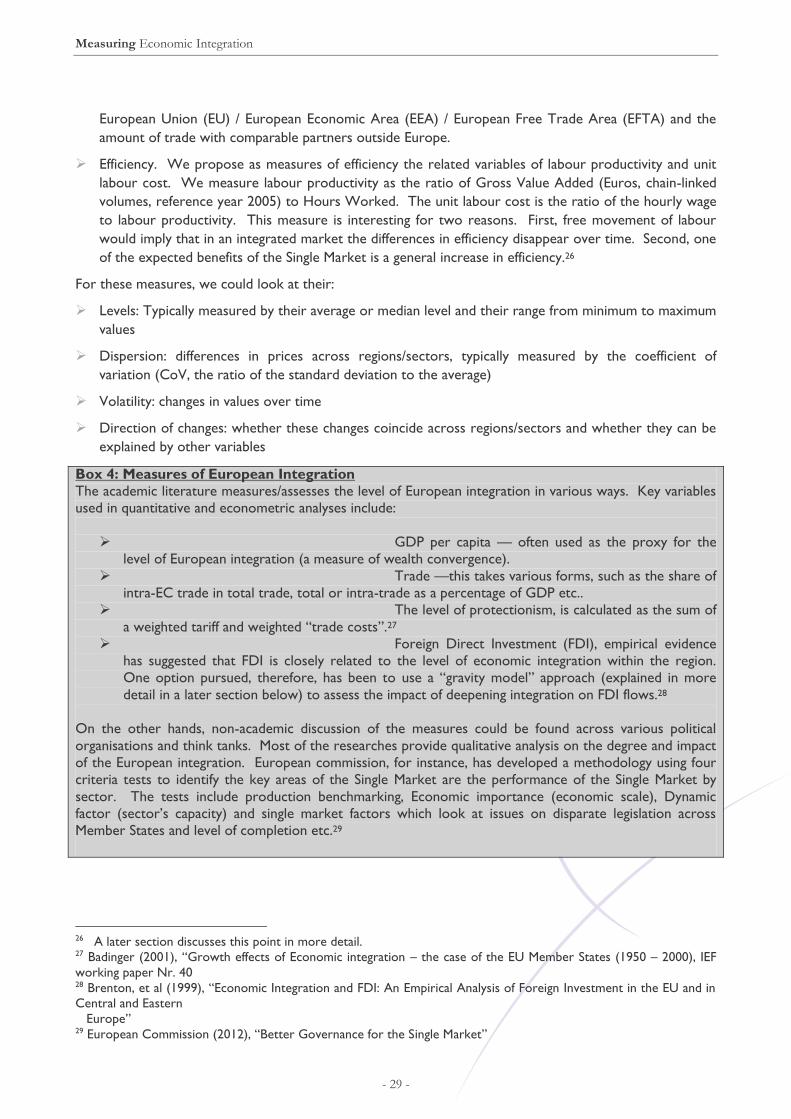
Measuring Economic Integration
- 29 -
European Union (EU) / European Economic Area (EEA) / European Free Trade Area (EFTA) and the
amount of trade with comparable partners outside Europe.
Efficiency. We propose as measures of efficiency the related variables of labour productivity and unit
labour cost. We measure labour productivity as the ratio of Gross Value Added (Euros, chain-linked
volumes, reference year 2005) to Hours Worked. The unit labour cost is the ratio of the hourly wage
to labour productivity. This measure is interesting for two reasons. First, free movement of labour
would imply that in an integrated market the differences in efficiency disappear over time. Second, one
of the expected benefits of the Single Market is a general increase in efficiency.26
For these measures, we could look at their:
Levels: Typically measured by their average or median level and their range from minimum to maximum
values
Dispersion: differences in prices across regions/sectors, typically measured by the coefficient of
variation (CoV, the ratio of the standard deviation to the average)
Volatility: changes in values over time
Direction of changes: whether these changes coincide across regions/sectors and whether they can be
explained by other variables
Box 4: Measures of European Integration
The academic literature measures/assesses the level of European integration in various ways. Key variables
used in quantitative and econometric analyses include:
GDP per capita — often used as the proxy for the
level of European integration (a measure of wealth convergence).
Trade —this takes various forms, such as the share of
intra-EC trade in total trade, total or intra-trade as a percentage of GDP etc..
The level of protectionism, is calculated as the sum of
a weighted tariff and weighted “trade costs”.27
Foreign Direct Investment (FDI), empirical evidence
has suggested that FDI is closely related to the level of economic integration within the region.
One option pursued, therefore, has been to use a “gravity model” approach (explained in more
detail in a later section below) to assess the impact of deepening integration on FDI flows.28
On the other hands, non-academic discussion of the measures could be found across various political
organisations and think tanks. Most of the researches provide qualitative analysis on the degree and impact
of the European integration. European commission, for instance, has developed a methodology using four
criteria tests to identify the key areas of the Single Market are the performance of the Single Market by
sector. The tests include production benchmarking, Economic importance (economic scale), Dynamic
factor (sector’s capacity) and single market factors which look at issues on disparate legislation across
Member States and level of completion etc.29
26 A later section discusses this point in more detail. 27 Badinger (2001), “Growth effects of Economic integration – the case of the EU Member States (1950 – 2000), IEF
working paper Nr. 40 28 Brenton, et al (1999), “Economic Integration and FDI: An Empirical Analysis of Foreign Investment in the EU and in
Central and Eastern
Europe” 29 European Commission (2012), “Better Governance for the Single Market”

Measuring Economic Integration
- 30 -
4.1.1 Causality
Although “output” measures may be much more straightforward to assess in a fine-grained and quasi-
contiguous way (as opposed to the step-change nature of assessing integration via the date of introduction
of regulatory programmes, and the risk of arbitrariness of attaching weightings to different specific
regulatory measures to attempt to achieve more fine-graining), one drawback of the “ouputs” based
approach to integration is that our focus in this report is not simply on the implications of integration in
general — which might be the product of globalisation, sustained peace, technological trends, tastes, or
many other things — but the implications of integration resulting from the Single Market in particular.
Consequently, in using output measures one of the key challenges is to understand whether the trends
observed can be attributed to the European Single Market (SM) / Customs Union (CU). One way to think
about that is to consider the extent to which those trends would have taken place even without a Single
Market — which can be estimated by considering the experience of relevant comparator countries outside
the Single Market. In order to address this issue, in what follows we shall base our judgement on
The trends observed in Member States before they became part of the CU/SM.
The trends observed in comparable countries. We propose as benchmarks non-EU OECD countries
that have been members at least since the 1970s. These include Australia, Canada, Iceland, Japan, New
Zealand, Norway, Switzerland, Turkey and the United States.
The trends observed within Member States at the regional level. For instance, as noted above in our
discussion of “natural barriers”, while price dispersion is expected to diminish with further integration,
it may not disappear altogether. A more appropriate measure of integration would compare price
dispersion across Member States with the existent dispersion within them (e.g. across NUTS 2
regions).
4.1.2 Specific sectors
Integration into the Single Market is likely to affect Member State economies overall. However,
integration-“outputs”-based data will often be more tractable (both conceptually and statistically) at a
sectoral than a whole-economy level. For example, “price dispersion” is much more straightforwardly
measured and interpreted within a particular sector — the dispersion of prices for this or that good.
Our approach below often focuses upon particular sectors or industries for which what are called “event
studies” can be conducted. That is, when studying individual sectors, it is sometimes feasible to identify
particularly relevant events (such as the introduction of Directives or court rulings) that may alter the
functioning of the Single Market, and to assess their corresponding effect.
One should, however, be circumspect in drawing general lessons from experience in particular sectors. To
enable more general lessons to be drawn, we include different sectors of the economy such as
manufactures and services, diverse in their level of integration across the European Union. For example,
we include markets that are widely regarded as already highly integrated (e.g. motor vehicles), as well as
markets that are more partially integrated (e.g. energy and pharmaceuticals).
4.1.3 Countries
Whilst all Member States are in the process of integration into the Single Market, some countries may be at
different stages of this process. These differences must be taken into account to assess the existing level of
integration. One particularly important distinction is that between the EU Member States that joined
before 2004 (the “EU15”) and those that joined at that date or later. There are two reasons to make this
distinction. First, one would naturally expect both the effects and the fruits of economic integration to
become more apparent the longer a country has been a member of the Single Market and, second, the

Measuring Economic Integration
- 31 -
majority of the Member States that joined on or after 2004 had, prior to that, recently gone through a
significant process of economic and political transformation (post-Communist transition), potentially
materially affecting their degrees of internal integration as well as entailing some catch-up with international
norms of economic integration with other countries, quite separately from their involvement in the Single
Market.
4.1.4 Time period
Given the history of the European Union and the availability of relevant data, we identify, when feasible,
three distinct periods in our analysis:30
1968-1994: Covers the period in which the European Union functioned as a Customs Union until the
Single Market was created and it was enlarged to 15 members. From a statistical point of view, 1995 is
also a relevant date because much of the available data becomes comparable starting only from 1995.
1995-2004: Covers the early years of the Single Market up to the enlargement of 2004, which extended
the EU to include ten additional Member States (and two further additional ones in 2007), mostly from
Central and Eastern Europe.
2004-present: Covers the Single Market as EU25 or EU27. Additionally, most detailed data is available
for this period.
4.2 “Input” Measures of Integration
4.2.1 EU Policy Inputs
As noted above, the “degree of integration” could be seen in one sense as a matter of how much progress
the EU has made in regulatory harmonisation. We identify the following key policy inputs.
Trade agreements: Free trade agreements and Customs Union
Timeline of trade agreements:
1968: Formation of Customs Union. Inner six countries: Belgium, France, Germany, Italy,
Luxembourg, Netherlands
1973: Denmark, Ireland and the UK join EC, Switzerland, Norway, Iceland and Liechtenstein FTA
1981: Greece joins EC
1986: Spain and Portugal join EC
1991: Andorra and San Marino members of Customs Union
1992: European Union formed (Maastricht Treaty)
1993: Single Market commences
1994: Hungary joins FTA
1995: Austria, Finland and Sweden join EU. Bulgaria, Czech Republic, Romania, Slovakia join FTA
1996: EU-Turkey Customs Union
1998: Estonia, Latvia, Lithuania, Slovenia, Tunisia join FTA
2000: South Africa, Mexico, Israel, Morocco join FTA
2003: Chile joins FTA
2004: Cyprus, the Czech Republic, Estonia, Hungary, Latvia, Lithuania, Malta, Poland, Slovakia, and
Slovenia join EU, Macedonia SAP (Stabilisation and Association Process), Egypt joins FTA
2005: Croatia SAP, Algeria joins FTA
30 It would also be very useful, if feasible, to analyse a fourth period that includes Member States’ performance before
the European Customs Union that commenced in1968. However, given the lack of data availability for most of the
indicators mentioned here, we have been unable to pursue such an approach within the bounds of the current study.
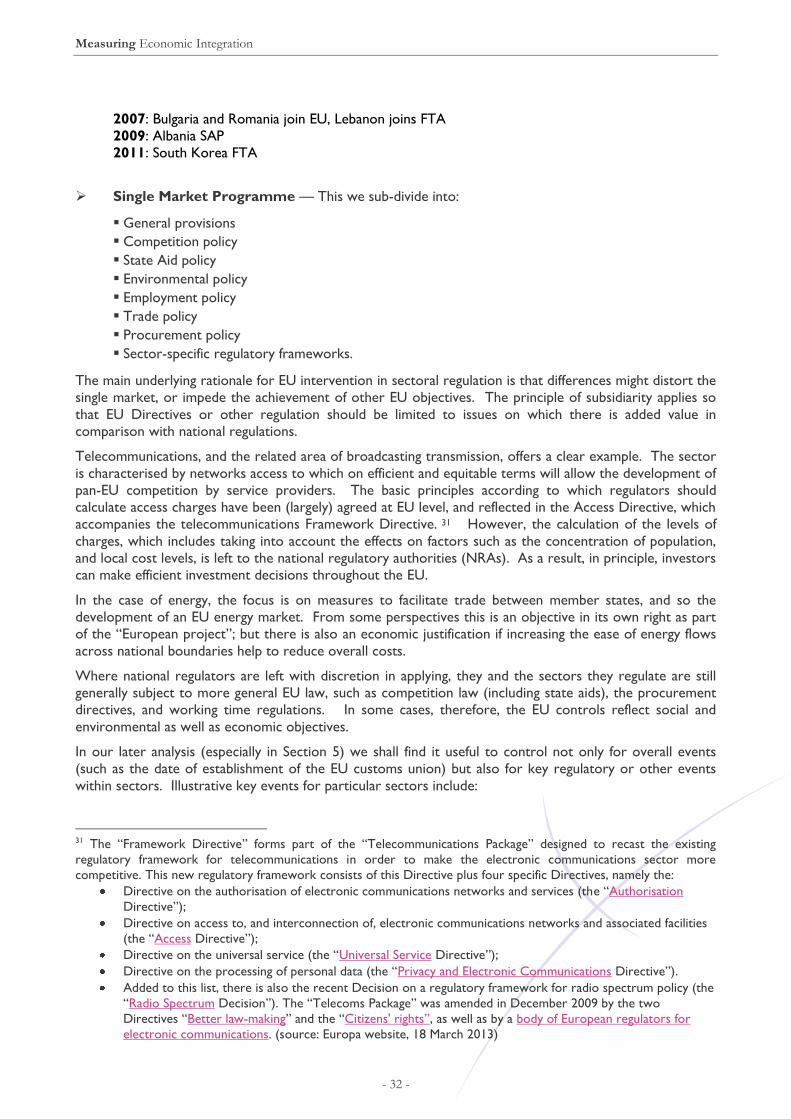
Measuring Economic Integration
- 32 -
2007: Bulgaria and Romania join EU, Lebanon joins FTA
2009: Albania SAP
2011: South Korea FTA
Single Market Programme — This we sub-divide into:
General provisions
Competition policy
State Aid policy
Environmental policy
Employment policy
Trade policy
Procurement policy
Sector-specific regulatory frameworks.
The main underlying rationale for EU intervention in sectoral regulation is that differences might distort the
single market, or impede the achievement of other EU objectives. The principle of subsidiarity applies so
that EU Directives or other regulation should be limited to issues on which there is added value in
comparison with national regulations.
Telecommunications, and the related area of broadcasting transmission, offers a clear example. The sector
is characterised by networks access to which on efficient and equitable terms will allow the development of
pan-EU competition by service providers. The basic principles according to which regulators should
calculate access charges have been (largely) agreed at EU level, and reflected in the Access Directive, which
accompanies the telecommunications Framework Directive. 31 However, the calculation of the levels of
charges, which includes taking into account the effects on factors such as the concentration of population,
and local cost levels, is left to the national regulatory authorities (NRAs). As a result, in principle, investors
can make efficient investment decisions throughout the EU.
In the case of energy, the focus is on measures to facilitate trade between member states, and so the
development of an EU energy market. From some perspectives this is an objective in its own right as part
of the “European project”; but there is also an economic justification if increasing the ease of energy flows
across national boundaries help to reduce overall costs.
Where national regulators are left with discretion in applying, they and the sectors they regulate are still
generally subject to more general EU law, such as competition law (including state aids), the procurement
directives, and working time regulations. In some cases, therefore, the EU controls reflect social and
environmental as well as economic objectives.
In our later analysis (especially in Section 5) we shall find it useful to control not only for overall events
(such as the date of establishment of the EU customs union) but also for key regulatory or other events
within sectors. Illustrative key events for particular sectors include:
31 The “Framework Directive” forms part of the “Telecommunications Package” designed to recast the existing
regulatory framework for telecommunications in order to make the electronic communications sector more
competitive. This new regulatory framework consists of this Directive plus four specific Directives, namely the:
Directive on the authorisation of electronic communications networks and services (the “Authorisation
Directive”);
Directive on access to, and interconnection of, electronic communications networks and associated facilities
(the “Access Directive”);
Directive on the universal service (the “Universal Service Directive”);
Directive on the processing of personal data (the “Privacy and Electronic Communications Directive”).
Added to this list, there is also the recent Decision on a regulatory framework for radio spectrum policy (the
“Radio Spectrum Decision”). The “Telecoms Package” was amended in December 2009 by the two
Directives “Better law-making” and the “Citizens' rights”, as well as by a body of European regulators for
electronic communications. (source: Europa website, 18 March 2013)

Measuring Economic Integration
- 33 -
Pharmaceuticals Energy Financial
services
Motor vehicles
1989:
Transparency
Directive
89/105/EEC
1996-1998: First
energy package of
directives
(Electricity:
Directive
96/92/EC, Gas:
Directive
98/30/EC)
2001: Money
laundering, UCITS
1
1970: Directive
70/156/EEC type-
approval of motor
vehicles and their
trailers
1996: Court cases.
Repackaging:
Bristol-Myers
Squibb v Paranova
A/S and parallel
trade: Merck v.
Primecrown
2003: Second
energy package
(Directives
2003/54/EC and
Directive
2003/55/EC)
2002: Solvency
directive, IMD
(insurance),
Financial
Conglomerates
2001: Directive
2001/116/EC
(amendment)
2003:
Communication on
parallel trade
COM(2003) 839
2006: Energy end-
use efficiency and
energy services
(Directive
2006/32/EC)
2004: Markets in
Financial
Instruments
Directive
2007: Directive
2007/46/EC framework
for the approval of
motor vehicles and
their trailers
2009: Third energy
package
(Directives
2009/72/EC and
2009/73/EC)
2006: Capital
requirements
directive
Proposed: motor
vehicle registration
2010: Energy
performance of
buildings
(Directive
2010/31/EU)
2008: Credit
agreements for
consumers
(Directive
2008/48/EC)
2009: Taking up
and pursuit of the
business of
insurance and
reinsurance
(Solvency II) ,
(Directive
2009/138/EC)
4.2.1.1 Policy tool forms Setting aside General Provisions, the policy tools for promoting the Single Market could in principle take
the following forms:
Separate national or subnational (e.g. regional) regulation
Separate national or subnational (e.g. regional) regulation with co-operation on cross-border issues
National regulators with mutual recognition
European-level regulation
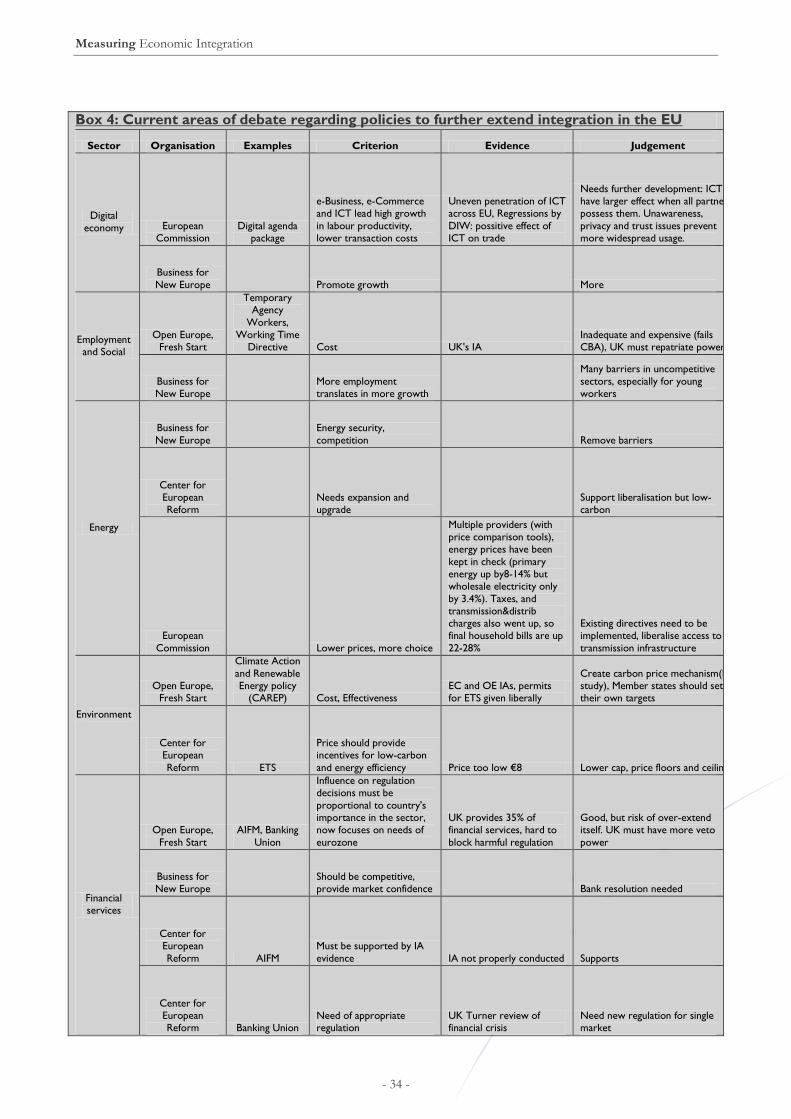
Measuring Economic Integration
- 34 -
Box 4: Current areas of debate regarding policies to further extend integration in the EU
Sector Organisation Examples Criterion Evidence Judgement
Digital
economy European Commission
Digital agenda package
e-Business, e-Commerce and ICT lead high growth
in labour productivity, lower transaction costs
Uneven penetration of ICT across EU, Regressions by
DIW: possitive effect of ICT on trade
Needs further development: ICT have larger effect when all partners possess them. Unawareness,
privacy and trust issues prevent more widespread usage.
Business for
New Europe
Promote growth
More
Employment and Social
Open Europe, Fresh Start
Temporary Agency
Workers, Working Time
Directive Cost UK's IA Inadequate and expensive (fails CBA), UK must repatriate powers
Business for New Europe
More employment translates in more growth
Many barriers in uncompetitive
sectors, especially for young workers
Energy
Business for
New Europe
Energy security,
competition
Remove barriers
Center for European Reform
Needs expansion and upgrade
Support liberalisation but low-carbon
European
Commission
Lower prices, more choice
Multiple providers (with price comparison tools),
energy prices have been
kept in check (primary energy up by8-14% but wholesale electricity only
by 3.4%). Taxes, and transmission&distrib charges also went up, so final household bills are up
22-28%
Existing directives need to be implemented, liberalise access to
transmission infrastructure
Environment
Open Europe, Fresh Start
Climate Action
and Renewable Energy policy
(CAREP) Cost, Effectiveness EC and OE IAs, permits for ETS given liberally
Create carbon price mechanism(EE study), Member states should set their own targets
Center for European
Reform ETS
Price should provide incentives for low-carbon
and energy efficiency Price too low €8 Lower cap, price floors and ceilings
Financial services
Open Europe,
Fresh Start
AIFM, Banking
Union
Influence on regulation decisions must be
proportional to country's importance in the sector, now focuses on needs of
eurozone
UK provides 35% of financial services, hard to
block harmful regulation
Good, but risk of over-extend itself. UK must have more veto
power
Business for New Europe
Should be competitive, provide market confidence
Bank resolution needed
Center for European
Reform AIFM
Must be supported by IA
evidence IA not properly conducted Supports
Center for European Reform Banking Union
Need of appropriate regulation
UK Turner review of financial crisis
Need new regulation for single market

Measuring Economic Integration
- 35 -
JHA
Open Europe,
Fresh Start
EU crime and policing laws,
European Arrest
Warrant
(EAW), Effectiveness
EAW unfair, Opinion: Redundant or little
improvement value
Eliminate redundancies, reform
EAW
Services
Business for New Europe
Trade pattern should reflect relative importance of services in the economy
Remove barriers
Center for European
Reform
Services
Directive
Must havefree movement
of services
Currently too many barriers, countries must implement Services Directive, SD gives too much room
for MSs to put barriers
European Commission
Services Directive
Lower barriers that
translate in increase in GDP, productivity, FDI
preliminary IA: GDP effect is 0.3-1.5%
Successful so far, needs further
implementation (directive not fully transposed in all MSs)
SMEs Business for New Europe
Should be able to compete in a level playing field
Improve IP and access to capital
Social Policy
The Foreign Policy Center
(FPC)
balance between
protections for workers and flexibility for firms needs to be assessed
YouGov, there is little to suggest that the removal of existing protections would assist UK or EU firms to
compete on grounds of cost with emerging markets, gold plating
There is room to gain employment flexibility without affecting workers rights
Transport
European
Commission
Common Transport
Policy (CTP), Single European
Sky
More competitive markets,
efficient use of infrastructure, benefit for
consumers
Lower fares (through
successful air liberalisation, also puts pressure on rail),
new services
Replicate success from air market
in rail
4.3 “Output” Measures of Integration
4.3.1 Price dispersion
In a perfectly-functioning Single Market the “law of one price” would apply — any attempt to sell products
at a different price to different consumers would result in resale arbitrage, closing price differentials. Hence
the degree of integration can be measured by reference to the degree of price dispersion across countries.
We illustrate this point using the case of pharmaceuticals. The market for pharmaceuticals is an interesting
example because it consists of a good that is in principle tradable, but subject to different regulations,
standards and national price regulation schemes that either themselves sustain price differentials across
countries or allow pharmaceuticals companies to price discriminate.32
We identified two key dates. In 1996, there were two major court rulings regarding parallel trade (Merck v
Primecrown) and trademarks/repackaging (Bristol-Myers Squibb v Paranova). In 2003, there was an EC
Communication regarding parallel trade, reflecting largely the decisions of previous court rulings.
32 Whether it is fundamentally buyer power, through national price regulation, or monopoly power from patented
pharmaceuticals manufacturers that is the key driver and sustainer of price differentials is a hotly disputed issue that it
falls outside the scope of this study for us to offer a view on.

Measuring Economic Integration
- 36 -
Figure 4.1: Average ex-manufacturer prices of pharmaceuticals
Source: Department of Health, Pharmaceutical Price Regulation Scheme: Reports to Parliament, 1998-2012. Price index constructed using a sample
of branded products among the top-250 sellers in England. Base price: UK price set to 100. The European countries represented in the sample
are: Austria, Belgium, Finland, France, Germany, Ireland, Italy, Netherlands, Spain and the UK
We can note the following:
European countries and the US have materially different price patterns for pharmaceuticals, in levels,
volatility and direction of movements.
EU countries follow a similar pattern, especially after 1996, with the notable exception of the price
increases in Germany after 2006.
In addition to average prices, it is possible to look at their dispersion, as in the figure below, measured by
the CoV.
Figure 4.2: Price dispersion measured by the coefficient of variation
Source: Department of Health, Pharmaceutical Price Regulation Scheme: Reports to Parliament, 1998-2012. Price index constructed using a sample
of branded products among the top-250 sellers in England. Base price: UK price set to 100. The European countries represented in the sample
are: Austria, Belgium, Finland, France, Germany, Ireland, Italy, Netherlands, Spain and the UK

Measuring Economic Integration
- 37 -
From Figure 4.2 we see that:
Price dispersion in the EU declined steadily in the period 1992-2003, providing evidence in favour of
increasing market integration during this period
The EU and the US follow very different price patterns, moving in opposite directions, indicating that
the EU pattern is not simply reflective of a global pattern.
There was an increase in price dispersion in the second half of the 2000s decade.
4.3.2 Wage dispersion
Just as the free movement of goods and services would be expected to lead to reduced dispersion in the
prices of goods and services, so one of the expected consequences of free movement of labour is
convergence in wages, as significant wage differentials are undermined by worker migration. The figure
below presents the wage dispersion for the Member States of the EU since 1991 and for the countries that
were EU members before 2004 (EU 15) since 1970.
Figure 4.3: Dispersion of Hourly Wages for EU Member States
Note: Labour compensation per hour worked (Euros/ECUs), measures by the (unweighted) coefficient of variation.
Source: EU KLEMS (hourly wage data expressed in national currencies and Gross Value Added price index), Penn World Table (exchange rates).
Cyprus, Latvia, Portugal and the Slovak Republic were excluded due to non-comparability of the data.
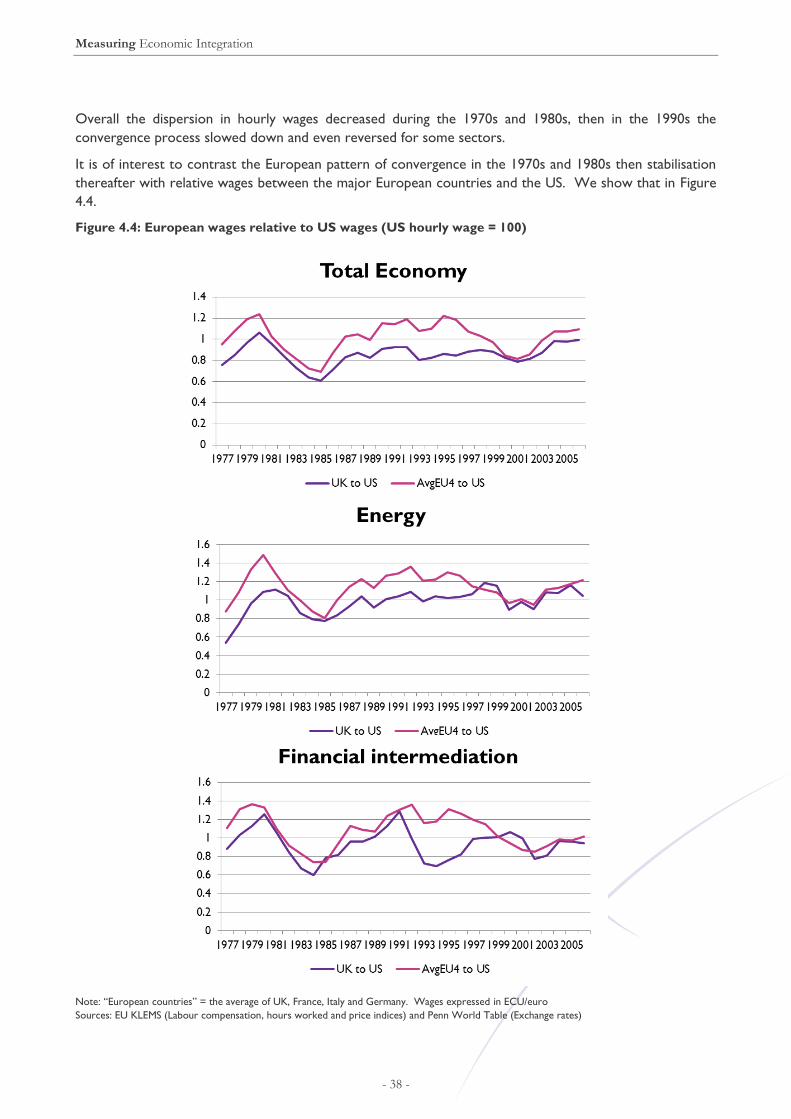
Measuring Economic Integration
- 38 -
Overall the dispersion in hourly wages decreased during the 1970s and 1980s, then in the 1990s the
convergence process slowed down and even reversed for some sectors.
It is of interest to contrast the European pattern of convergence in the 1970s and 1980s then stabilisation
thereafter with relative wages between the major European countries and the US. We show that in Figure
4.4.
Figure 4.4: European wages relative to US wages (US hourly wage = 100)
Note: “European countries” = the average of UK, France, Italy and Germany. Wages expressed in ECU/euro
Sources: EU KLEMS (Labour compensation, hours worked and price indices) and Penn World Table (Exchange rates)

Measuring Economic Integration
- 39 -
As versus the pattern within Europe of convergence through the 1970s and 1980s then stabilisation from
the 1990s onwards, relative to the US there appears to be relatively little convergence during the 1970s,
some during the 1980s followed by a period of stabilisation into the early 1990s, then further volatility
later. When comparing the UK and US hourly wages, UK wages have been lower for the total economy.
However, differences in hourly wages during recent years have been minimal. Thus we see that the
European experience in the 1970s and 1980s is unlikely to be attributed simply to global trends — the
pattern relative to the US is materially different. But whilst the pattern of wage convergence seems
Europe-specific and might thus be attributed to European integration in some way (e.g. theory predicts that
trade and capital mobility could potentially led to some convergence in the marginal revenue product of
labour even in a customs union), it is not clear that enhanced labour mobility associated with the Single
Market, per se, could be the cause, as it started only in the run-up to 1993 and most of the convergence in
wages occurs before that point.
Figure 4.5: Hourly wage dispersion in the EU and individual countries in 2006
Source: EU KLEMS, Eurostat and Structure of earnings survey 2006. Dispersion within countries was obtained by the unweighted CoV using NUTS
1 regions. Countries were selected due to the available data for a sufficient number of regions: Germany (16), UK (12), France (8) and Spain (7)
As discussed above, the dispersion information becomes more meaningful when compared to wage
differentials within individual countries. Figure 4.5 compares the CoV computed for the EU with selected
countries in 2006. Within-country dispersion is between .127 and .196, while the corresponding values for
the EU 15 and EU 27 are .288 and .519, respectively. The natural conclusion is that (perhaps as one might
expect given issues such as language differences and incomplete portability of public welfare entitlements)
there are still significant wage differentials across EU countries that go beyond the differences expected
within a well-integrated Single Market.
One factor limiting the closure of wage differentials within the EU may be its relatively limited labour
mobility.

Measuring Economic Integration
- 40 -
Box 5: Comparing the Labour Mobility of the USA and the EU
A 2008 study conducted by the European Union suggested evidence that labour mobility in 2006 between
US states was much higher than both between and within EU member states33:
USA EU-27 EU-15 EU-12
Share of working age residents
who moved from a different
region/state within the same
country
1.98% 0.96% 1.12% 0.34%
Share of working age residents
who moved from abroad 0.76% 0.30% 0.34% 0.16%
Net migration 0.40% 0.32% 0.40% -0.03%
Source: Regional Focus (2008), “Labour mobility between the regions of the EU-27 and a comparison with the USA”, European Union Regional policy
The EU regions where the largest proportions of people were leaving were found to have high
unemployment rates and low wages relative to other regions. Those regions that received the most
migrants were found to have growing employment levels but not necessarily higher wages.
Differences in the dispersion of the proportion of people moving between US states and between EU
regions was also found. In the US, the average share of working age residents moving from another US
state was 3.38 per cent in the highest decile of states and 1.08 per cent in the lowest decile, whilst in the
EU the respective figures were 2.54 per cent and 0.1 per cent.
For an extended discussion of these trends and comparison with intra-country dispersion, see Andersson
et al (2008).34
4.3.3 Labour productivity
As with wage dispersion, another product of free movement of labour should be a fall in labour
productivity differentials.
Labour productivity is a measure of efficiency. We define it here as the ratio of Gross Value Added to
Hours Worked.
The next figure shows the evolution of EU-aggregate labour productivity.35 Whilst the increase in labour
productivity was 13 per cent for the total economy, productivity in the energy and pharmaceutical
industries grew 20 per cent and 70 per cent respectively.36
33 Regional Focus (2008), “Labour mobility between the regions of the EU-27 and a comparison with the USA”,
European Union Regional policy. http://ec.europa.eu/regional_policy/sources/docgener/focus/2008_02_labour.pdf 34 Andersson et al “Wage Growth Dispersion Across The Euro Area Countries: Some Stylised Facts”, ECB 2008
(http://www.ecb.int/pub/pdf/scpops/ecbocp90.pdf). 35 Eurostat has no data for the finance industry on hours worked at the EU level. 36 Data for pharmaceuticals go until 2009.
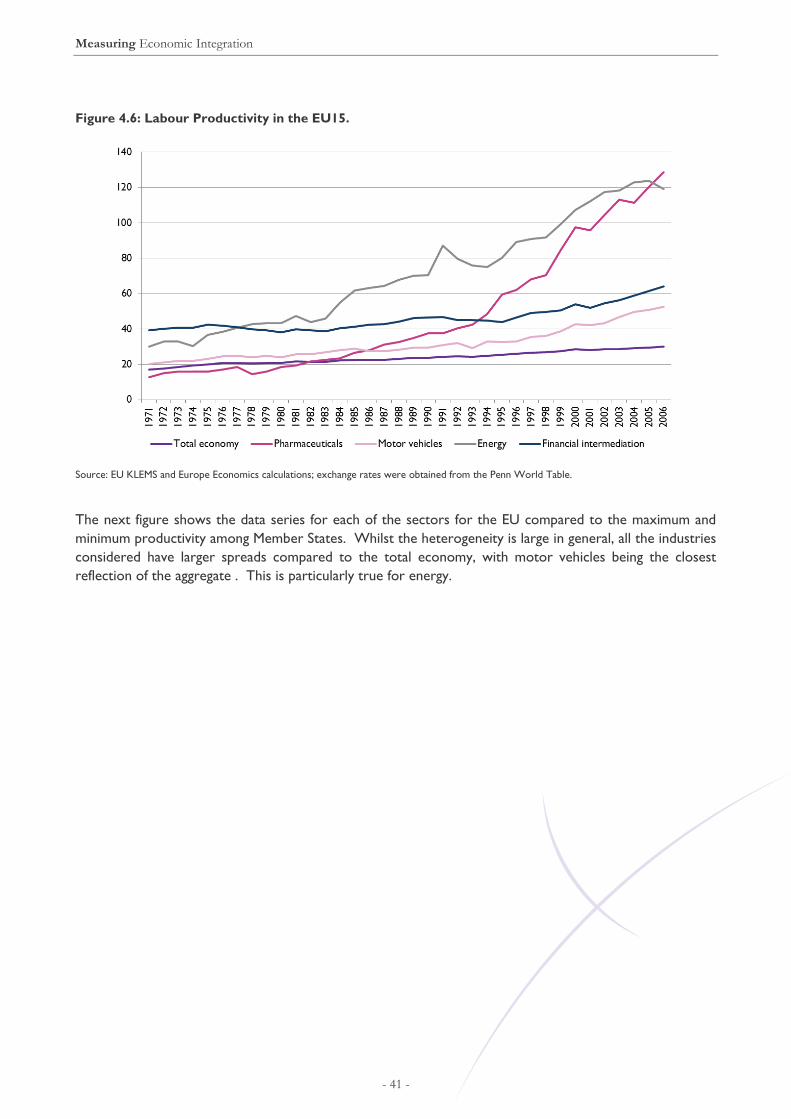
Measuring Economic Integration
- 41 -
Figure 4.6: Labour Productivity in the EU15.
Source: EU KLEMS and Europe Economics calculations; exchange rates were obtained from the Penn World Table.
The next figure shows the data series for each of the sectors for the EU compared to the maximum and
minimum productivity among Member States. Whilst the heterogeneity is large in general, all the industries
considered have larger spreads compared to the total economy, with motor vehicles being the closest
reflection of the aggregate . This is particularly true for energy.

Measuring Economic Integration
- 42 -
Figure 4.7: Labour productivity
Note: Labour productivity measured by NACE Rev.2 categories
Source: EU KLEMS and Penn World Table (exchange rates)
Of the next two figures the first includes all countries for which there is a complete series from the 2000-
2010 period, whilst the second excludes from the sample all Member States that joined the EU on or after
2004. These figures show the evolution of the coefficient of variation of labour productivity for the twelve

Source: EU KLEMS and Penn World Table.
Measuring Economic Integration
- 43 -
largest sectors of the UK economy, by gross value added. The charts illustrate whether labour productivity
in those sectors has converged/diverged since the early 1970s, both in absolute terms and relative to a
measure of global convergence – which we calculated by comparing the average labour productivity of the
EU’s “big four” – UK, France, Germany, Italy – with that of the US, Japan and Australia (so, a four-
“country” comparison). The key salient features are as follows:
In the period since the Accessions of the mid-2000s, there has been convergence in labour
productivity (increased integration in the Single Market) in most main sectors, with the notable
exceptions of manufacturing, wholesale & retail trade and education.
This convergence has been driven overwhelmingly by convergence between the new Member
States and the EU15, rather than amongst EU15 Member States.
For almost all sectors (excepting public administration (etc) and education – both relatively
unaffected by the Single Market), there has either been very little convergence since the early
1980s or what convergence there has been has been less than or entirely explicable in terms of
global convergence.
The worst four performances, in terms of EU15 convergence relative to global convergence, are
manufacturing, wholesale/retail trade, construction and transport.
Figure 4.8: Labour productivity, coefficient of variation.
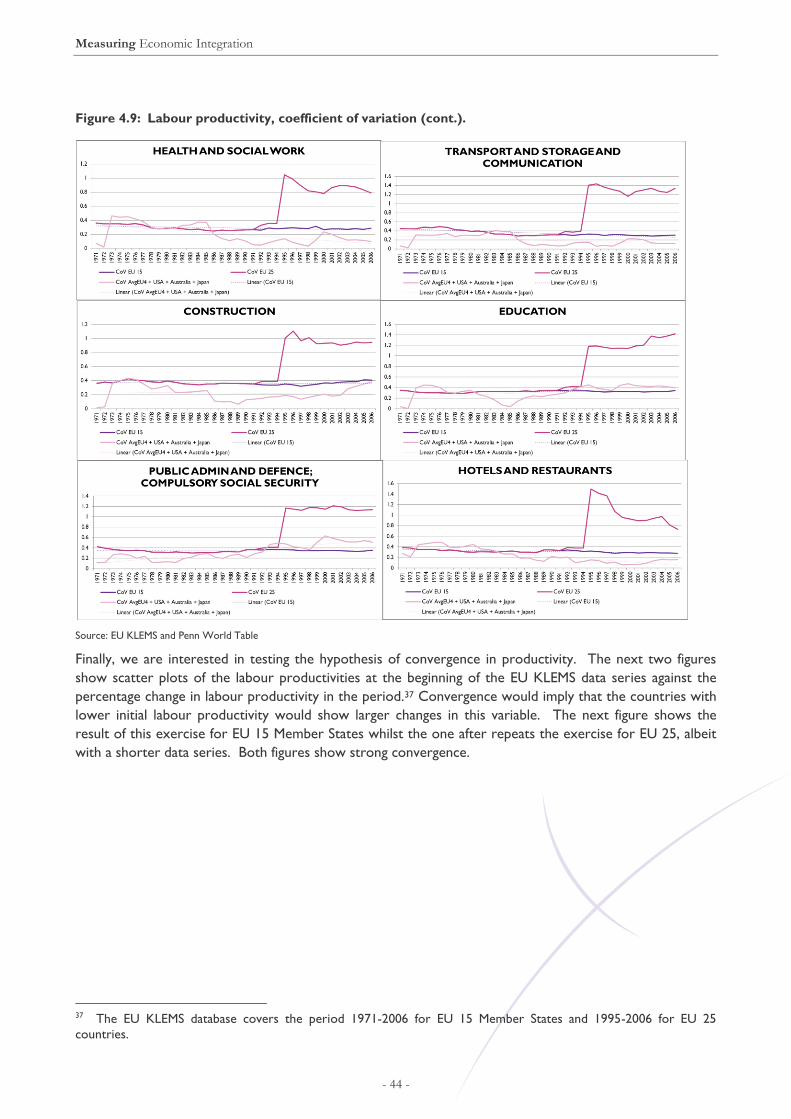
Measuring Economic Integration
- 44 -
Figure 4.9: Labour productivity, coefficient of variation (cont.).
Source: EU KLEMS and Penn World Table
Finally, we are interested in testing the hypothesis of convergence in productivity. The next two figures
show scatter plots of the labour productivities at the beginning of the EU KLEMS data series against the
percentage change in labour productivity in the period.37 Convergence would imply that the countries with
lower initial labour productivity would show larger changes in this variable. The next figure shows the
result of this exercise for EU 15 Member States whilst the one after repeats the exercise for EU 25, albeit
with a shorter data series. Both figures show strong convergence.
37 The EU KLEMS database covers the period 1971-2006 for EU 15 Member States and 1995-2006 for EU 25
countries.

Measuring Economic Integration
- 45 -
Figure 4.10 Convergence of Labour Productivity across EU 15 Member States, 1971-2006
Source: EU KLEMS and Penn World Table
Figure 4.11 Convergence of Labour Productivity across EU 27 Member States, 1995-2006
Source: EU KLEMS and Penn World Table

Measuring Economic Integration
- 46 -
4.3.4 Interest rates
As free movement of goods and services should reduce price differentials, and free movement of labour
reduce wage differentials, free movement of capital should reduce differentials in the cost of capital. One
form of capital is debt, and one measure of the cost of debt is interest rates charged. Hence a measure of
integration within the Single Market is the dispersion in interest rates.
Interest rates might differ between consumers and firms. In our analysis we have considered three
measures: the rate for housing loans, the rate for enterprises for loans up to one year and the rate for
enterprises over one year. We examine the CoV of these three rates.
The next chart compares the evolution of the CoV for all three borrowing interest rates for EU countries.
The chart can be divided in four periods. During the first period, 1990-1994, dispersion not only did not
decrease, but it increased during 1992-1994 — perhaps partly attributable to the ERM crisis and the
subsequent increase in exchange rate movement differentials between Member States38 and (both in the
period of the crisis39 and subsequently) between policy rates. The second period, 1995-2000, saw a sharp
decrease in the dispersion in all three rates, once the ERM stabilised and the euro was introduced,
alongside the early measures of the Financial Services Action Plan were introduced (from 1998 on). In the
third, 2001-2008, dispersion stabilized at a low level, with a range between .074 and .185. The fourth and
last period is the one that followed the financial crisis of 2008, where price dispersion increased, in
particular for housing and enterprises under a year.
Figure 4.12: Coefficient of Variation for borrowing interest rates in EU 15 countries
Source: Eurostat
38 For example, Italy and the UK left the ERM in late 1992, whilst the tolerance band was extended for surviving ERM
members from 2.25 per cent to 15 per cent in August. 39 As a particularly extreme example, although not itself an ERM member, at the peak of the ERM crisis the Swedish
Riksbank offered a 500 per cent interest rate in an attempt to sustain its own exchange rate peg against the
Deutschemark — see http://www.princeton.edu/~ies/IES_Studies/S84.pdf (p24).

Measuring Economic Integration
- 47 -
Figure 4.13Figure 4.13 compares the CoV for the borrowing rates for enterprises over one year between
EU 27 and EU 15 countries. Under an integrated Single Market for capital, we would expect the EU27
dispersion to be considerably higher until 2004, when most of the new countries joined the EU. Starting
from 2004, we would expected the EU 27 dispersion to decrease and to converge to that for EU15
countries. Figure 4.13 shows a broadly similar pattern to that for the EU up to 2011. Since 2011, however,
the dispersion levels have been very similar, albeit being at a significantly higher level as in previous years. A
natural interpretation is that the divergence from 2008-2010 for both EU15 and EU27 was at least partly
the product of the international financial crisis, whilst divergence post-2010 within the EU15 is largely the
product of the Eurozone crisis.
Figure 4.13: Coefficient of Variation for borrowing interest rates for enterprises over one year in EU15
and EU25
Source: Eurostat
4.3.5 Trade
When a Single Market or Customs Union agreement is formed, it is expected that trade between members
will increase whilst trade between members and non-members will decrease. We examine whether this is
true for the UK. In particular, given that data is available only since the mid-1990s, we look at changes in
the trade pattern between the UK and the countries that became members of the EU in or after 2004.
Additionally, we will compare these trade patterns with those for trade with non-EU members.
We define trade as the sum of imports and exports. We are concerned with two measures:
the amount of trade with the 12 New Member States joining after 2004 (the NMS12) as a proportion
of UK GDP; and
the proportion of total UK trade done with EU27 vs non-EU27 countries.

Measuring Economic Integration
- 48 -
The next two figures show these differences for total trade and for packaged pharmaceuticals, respectively.
In both Figures it can be seen that trade with countries that acceded the EU on or after 2004 has
increased.40
The difference in trade with the UK between the EU27 and non-EU countries illustrates the relative
importance of trade with the EU with the total international trade of the UK. The first figure shows that
the UK trades more packaged pharmaceuticals with EU Member States than with other countries. This
measure has shown some volatility, but the trend indicates that trade with the EU has become relatively
more important in recent years. In contrast, for trade as a whole it can be seen in the second figure that
the relative importance of non-EU trading partners has increased significantly since 2006 and that non-EU
trade now exceeds EU trade (a trend expected to continue in the next few years with continued expansion
especially in China).
Figure 4.14: Differences in Trade Patterns for the Total UK Economy
Note: Y axis is % of UK GDP
Source: Eurostat
Figure 4.15 : Differences in Trade Patterns for Packaged Pharmaceuticals
Note: HS code 3004; Y axis is % of UK GDP
Source: Eurostat
40 Of course, one cannot conclude simply from the existence of such an increase that EU Accession was the cause —
for example, increased trade could be the result of a significant increase in GDP unrelated to EU membership.
However, in later sections we shall analyse the impacts of customs union and single market membership more
formally.

Measuring Economic Integration
- 49 -
4.4 Effects of Policy Inputs on Output Measures of Integration
One question of interest is how effective different sorts of policies intended to promote integration have
been in delivering integration in the “output” sense. Or to put matters differently, what proportion of
achieved “output” integration can be attributed to different policy inputs?
To investigate this question we have performed a number of indicative econometric analyses. Within the
scope of this project we have not been able to gather all the data one might use to investigate this question
in detail in a specific sector. The essential approach here could be pursued in a more detailed sectoral
study.
Our first step is to disaggregate the “Single Market Programme” into the key components set out in
Section 4.2.1 above. For each of these we have identified a key date. A more detailed sectoral study might
identify more specific dates than those we have used here, but for our purpose the key dates were as
follows:
Competition policy: Creation of DG COMP, 1990
State Aid: “Enabling Regulation” Council Regulation (EC) No 994/98 of 7 May 1998
Environmental policy: Emissions Trading System (ETS), created in 2002
Employment policy: European Parliament and Council Directive 2004/38/EC of 29 April 2004 is about
the right of citizens of the Union and their family members to move and reside freely within the
territory of the EU and EEA member states.
Trade policy: Generalised Scheme of Preferences (GSP) 1971 and reformed on 2012
Procurement policy: EU directive 2004/18 - procurement - contracts for public works, public supply and
public service, EU directive 2004/17 – procurement in the water, energy, transport and postal services
sectors
Sector-specific regulatory frameworks (perhaps taking two or three sectors as examples)
Residual: creation of Single Market, 1993
It should be observed that the key dates for Employment and Procurement coincide, so there is just one
combined date used for these in the statistical analysis below since we cannot disentangle their effects.
4.4.1 Econometric specifications
The general form is linear, with an intercept41 and a time trend variable, with key dates as dummy variables,
in a panel study.
Table : Sources and dates of variables.
Variable Source Dates available
Wage dispersion EU KLEMS 1970-2007
EU-wide and market-specific events Europe Economics -
Trade between UK and selected
partners
Eurostat 1988-2011
Exchange rates Penn World Table 1950-2010
41 The intercept is not reported in the tables below
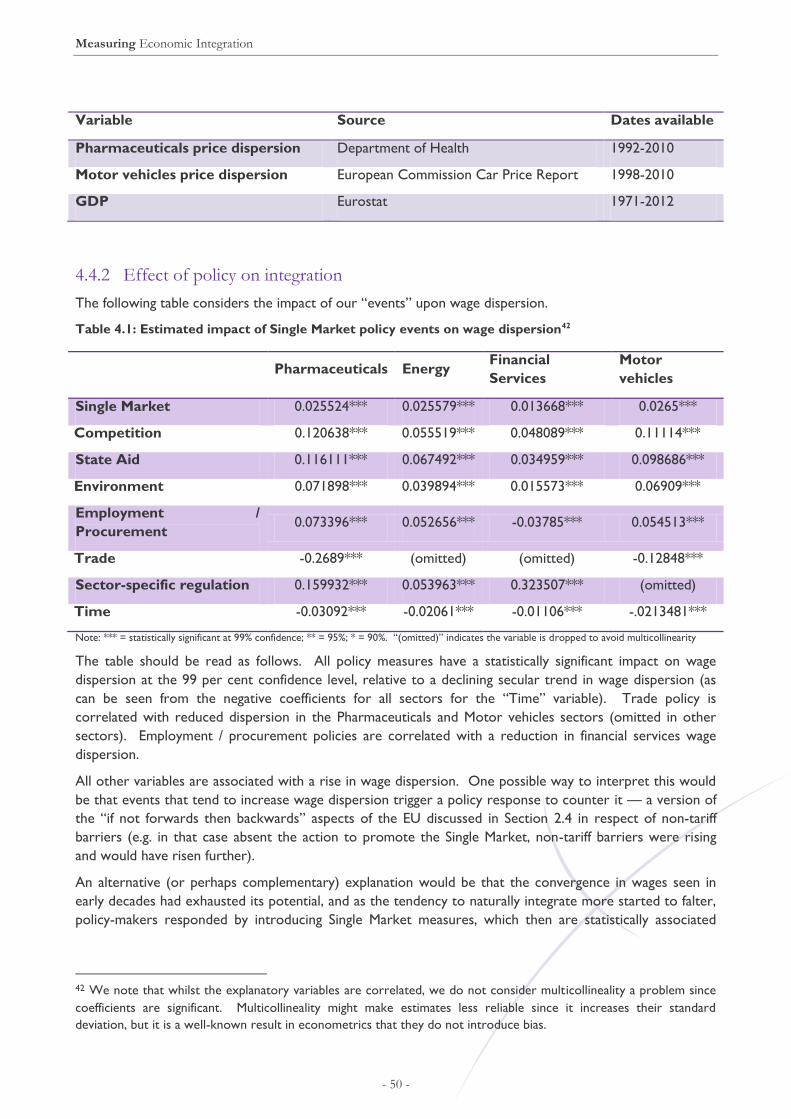
Measuring Economic Integration
- 50 -
Variable Source Dates available
Pharmaceuticals price dispersion Department of Health 1992-2010
Motor vehicles price dispersion European Commission Car Price Report 1998-2010
GDP Eurostat 1971-2012
4.4.2 Effect of policy on integration
The following table considers the impact of our “events” upon wage dispersion.
Table 4.1: Estimated impact of Single Market policy events on wage dispersion42
Pharmaceuticals Energy Financial
Services
Motor
vehicles
Single Market 0.025524*** 0.025579*** 0.013668*** 0.0265***
Competition 0.120638*** 0.055519*** 0.048089*** 0.11114***
State Aid 0.116111*** 0.067492*** 0.034959*** 0.098686***
Environment 0.071898*** 0.039894*** 0.015573*** 0.06909***
Employment /
Procurement 0.073396*** 0.052656*** -0.03785*** 0.054513***
Trade -0.2689*** (omitted) (omitted) -0.12848***
Sector-specific regulation 0.159932*** 0.053963*** 0.323507*** (omitted)
Time -0.03092*** -0.02061*** -0.01106*** -.0213481***
Note: *** = statistically significant at 99% confidence; ** = 95%; * = 90%. “(omitted)” indicates the variable is dropped to avoid multicollinearity
The table should be read as follows. All policy measures have a statistically significant impact on wage
dispersion at the 99 per cent confidence level, relative to a declining secular trend in wage dispersion (as
can be seen from the negative coefficients for all sectors for the “Time” variable). Trade policy is
correlated with reduced dispersion in the Pharmaceuticals and Motor vehicles sectors (omitted in other
sectors). Employment / procurement policies are correlated with a reduction in financial services wage
dispersion.
All other variables are associated with a rise in wage dispersion. One possible way to interpret this would
be that events that tend to increase wage dispersion trigger a policy response to counter it — a version of
the “if not forwards then backwards” aspects of the EU discussed in Section 2.4 in respect of non-tariff
barriers (e.g. in that case absent the action to promote the Single Market, non-tariff barriers were rising
and would have risen further).
An alternative (or perhaps complementary) explanation would be that the convergence in wages seen in
early decades had exhausted its potential, and as the tendency to naturally integrate more started to falter,
policy-makers responded by introducing Single Market measures, which then are statistically associated
42 We note that whilst the explanatory variables are correlated, we do not consider multicollineality a problem since
coefficients are significant. Multicollineality might make estimates less reliable since it increases their standard
deviation, but it is a well-known result in econometrics that they do not introduce bias.

Measuring Economic Integration
- 51 -
with a rise in wage dispersion relative to what the model (wrongly) treats as a continuing declining wage
dispersion trend.
A third possibility is that something about these measures has tended to slow convergence — that
measures intended to promote integration have had precisely the opposite effect. For example, perhaps a
more harmonised labour market might imply wages that were less flexible.
These results would be perhaps most naturally compatible with cost curves (according to our taxonomy of
Section 3) of type C or perhaps even A — that is to say, the costs of achieving additional integration veer
sharply upwards from at least the Single Market phase onwards on this measure.
4.5 So in which Sectors has Integration been Proceeding most?
Above we have proposed the use of “output” measures of convergence in prices, wages, productivity and
so on. Next, we use this method to provide some insight into sectors where integration has made
progress in recent years and similarly of sectors where progress on integration had stagnated or even
reversed.
We focus upon the twelve largest sectors of the UK economy, by gross value added, and the labour
productivity measure. We have calculated how labour productivity in those sectors has
converged/diverged since the early 1970s, both in absolute terms and relative to a measure of global
convergence – which we calculated by comparing the average labour productivity of the EU’s “big four” —
UK, France, Germany, Italy — with that of the US, Japan and Australia (so, a four-“country” comparison).
The results appear in the graphs below:

Figure 4.16: Labour productivity trends across sectors
Measuring Economic Integration
- 52 -

Measuring Economic Integration
- 53 -
The key salient features are as follows:
As noted for the other narrower sectors considered above, in the period since the Accessions of the
mid-2000s, there has been convergence in labour productivity (increased integration in the Single
Market) in most main sectors, with the notable exceptions of manufacturing, wholesale & retail trade
and education.
This convergence has been driven overwhelmingly by convergence between the new Member States
and the EU15, rather than amongst EU15 Member States.43
For almost all sectors (excepting public administration (etc) and education – both relatively unaffected
by the Single Market), there has either been very little convergence since the early 1980s or what
convergence there has been has been less than or entirely explicable in terms of global convergence.
The four sectors in which EU15 convergence relative to global convergence is least positive / most
negative are: manufacturing, wholesale/retail trade, construction and transport.44
4.6 Summary
In this section we have considered how the degree of integration within the Single Market, for economies
as a whole, for particular sector, and for the Four Freedoms of the Single Market, might be measured. We
have considered both “input” indicators, considering the evolution over time of regulation intended to
promote integration; and “output” indicators, measuring the degree of integration in terms of the expected
impacts of the Four Freedoms (specifically upon price differentials, wage differentials, interest rate
differentials, labour productivity, and trade volumes).
Key lessons from this section are as follows:
The degree of integration can be measured, especially in respect of “output” measures such as the
degree of price and wage dispersion, and output measures are correlated with input measures
(though not always in the direction policymakers might have expected).
There is evidence of increased integration — in particular in the form of wage convergence in the
1970s and 1980s and labour productivity convergence in the 2000s.
Integration, measured on outputs, is not a one-way process. Integration can reach a plateau (as
with wage dispersion from the 1990s onwards) or even, in some cases, be reversed (as with
pharmaceuticals price dispersion and interest rate dispersion during the 2000s).
43 One might speculate on a number of reasons for this. For example, it could be that the EU15 had already
converged as much as feasible (though our analysis above in respect of narrower sectors suggested that, relative to
single countries, there should still be further scope for integration in some dimensions, e.g. wage dispersion). The
collapse of the Warsaw Pact and Soviet Union may have meant there was still, even a decade and a half later, as
Eastern European countries joined the EU, material scope for further post-transition structural adjustment. 44 Again, one might speculate on a number of factors marking out these sectors, such as perhaps their role in
globalisation of supply chains.
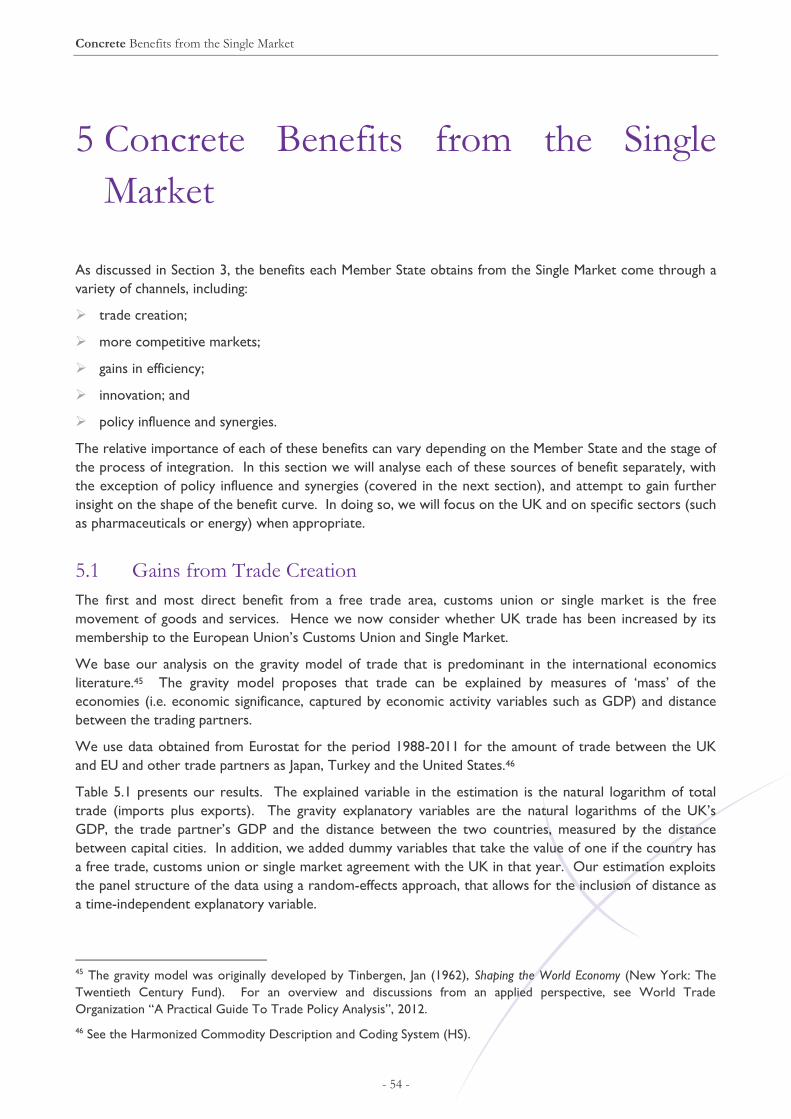
Concrete Benefits from the Single Market
- 54 -
5 Concrete Benefits from the Single
Market
As discussed in Section 3, the benefits each Member State obtains from the Single Market come through a
variety of channels, including:
trade creation;
more competitive markets;
gains in efficiency;
innovation; and
policy influence and synergies.
The relative importance of each of these benefits can vary depending on the Member State and the stage of
the process of integration. In this section we will analyse each of these sources of benefit separately, with
the exception of policy influence and synergies (covered in the next section), and attempt to gain further
insight on the shape of the benefit curve. In doing so, we will focus on the UK and on specific sectors (such
as pharmaceuticals or energy) when appropriate.
5.1 Gains from Trade Creation
The first and most direct benefit from a free trade area, customs union or single market is the free
movement of goods and services. Hence we now consider whether UK trade has been increased by its
membership to the European Union’s Customs Union and Single Market.
We base our analysis on the gravity model of trade that is predominant in the international economics
literature.45 The gravity model proposes that trade can be explained by measures of ‘mass’ of the
economies (i.e. economic significance, captured by economic activity variables such as GDP) and distance
between the trading partners.
We use data obtained from Eurostat for the period 1988-2011 for the amount of trade between the UK
and EU and other trade partners as Japan, Turkey and the United States.46
Table 5.1 presents our results. The explained variable in the estimation is the natural logarithm of total
trade (imports plus exports). The gravity explanatory variables are the natural logarithms of the UK’s
GDP, the trade partner’s GDP and the distance between the two countries, measured by the distance
between capital cities. In addition, we added dummy variables that take the value of one if the country has
a free trade, customs union or single market agreement with the UK in that year. Our estimation exploits
the panel structure of the data using a random-effects approach, that allows for the inclusion of distance as
a time-independent explanatory variable.
45 The gravity model was originally developed by Tinbergen, Jan (1962), Shaping the World Economy (New York: The
Twentieth Century Fund). For an overview and discussions from an applied perspective, see World Trade
Organization “A Practical Guide To Trade Policy Analysis”, 2012.
46 See the Harmonized Commodity Description and Coding System (HS).

Concrete Benefits from the Single Market
- 55 -
Table 5.1: Estimation of the effect of free trade agreements on total trade in the UK via a gravity
model
Variable 1 2 3
Intercept 11.80952*** 21.17065*** 21.88721***
UK GDP 0.50075***
Partner GDP 0.737377***
Distance -0.76516*** -0.76516***
Free Trade Agreement 0.155589 0.491578*** 0.305289***
Customs Union 0.085629 0.049096 0.02679
Single Market -0.16945** 0.50758*** 0.529891***
Unexplained UK GDP 0.50075***
Unexplained Partner GDP 0.737377***
R2 0.8936 0.4095 0.8936
Note: Panel estimation method: random effects. ***, ** and * denote that a coefficient is significant with 99%, 95% and 90% confidence, respectively.
The way to interpret these results are as follows. There are three regression models, in the columns
labelled “1”, “2” and “3”. Statistically-significant variables are marked with *s, with two stars and higher (i.e.
significance at the 95 per cent level or above) being the standard measure of “statistical significance”. In the
first regression, we obtain the coefficients for GDP, distance and our indicators for the various stages of
progress of the Single Market project. Our estimations show that there is considerable correlation
between the GDP and trade agreement dummies. Therefore, the impact of these variables is likely to pick
up the effects of one another. In order to confirm our suspicion that their effect on trade is influenced by
the correlation with other variables, we perform a second regression, in which we include only these
dummies but exclude GDP, and distance. It can be seen in the second column that there is a sign reversal
in the coefficient for the agreement dummies when comparing the first two regressions, in the one case
(Single Market) where the variable was significant in the first regression. We can infer, therefore, that
these agreements have a positive effect on trade, but this effect is not captured in the first estimation due
the “multicollinearity” problem — i.e. to the impact of variables picking up their effects upon each other.
In order to address this issue, therefore, we performed auxiliary estimations to determine what portion of
GDP variation can be explained by trade agreements.47 We subsequently constructed new variables for
UK and the partner countries’ GDP from the residuals of these estimations. These new variables are the
variation in GDP that cannot be explained by trade agreements. Finally we performed the gravity model
estimation using these new variables as ‘mass’, which is reported in the third column — this being our
preferred model.48
47 The auxiliary regressions have the UK and Partner’s GDP as explained variable and the trade agreement and events
in the pharmaceuticals market dummies as regressors. Whilst our approach with the auxiliary regression might
appear ad-hoc to some readers, it is analogous to a standard methods for the de-seasonalisation of time series.
Alternatively, it would be possible to conduct a difference-in-difference regression to account for this effect. 48 We observe that, by identity, the coefficients on the “Unexplained UK GDP” and “Unexplained Partner GDP”
variables in the third model will be the same as for “UK GDP” and “Partner GDP” in the first, as will the R2 for the
two models. The model includes a constant (Intercept), so all that the coefficient on GDP is measuring is changes
associated with changes. But the adjusted GDP variables (“Unexplained” UK and partner GDP) have precisely the
same changes as the unadjusted variables in every period except for at the time of introduction of the dummies for
the trade variables — these simply induce just a downward translation of the unadjusted variable, taken downwards in
the trade dummy introduction period — but the difference in that period is fully absorbed by the model as impacts of
the trade dummy coefficients. So the coefficients for GDP must be identical to adjusted GDP, but then there is an
impact on the constant.

Concrete Benefits from the Single Market
- 56 -
From our preferred model, in column 3, we can see that there is an underlying level of trade (the
Intercept), trade increases with the (adjusted) GDP of the UK and partners, trade decreases with
“Distance” (as expected in a gravity model), and trade increases with the introduction of a free trade area
and the Single Market, but is unaffected by the customs union (the coefficient on “Customs Union” is not
statistically significant). Overall, the model is statistically very powerful at explaining trade, as indicated by
the “R2” variable (which can range from 0 to 1, and in this context might be viewed as indicating reasonable
explanatory power even at around the 0.5 mark) being close to 0.9.
The broad method can be applied to specific sectors, also, and indeed in specific sectors more concrete
impacts may be identifiable. We present below gravity estimations for trade in pharmaceuticals packaged in
doses, again using data obtained from Eurostat for the period 1988-2011 for the amount of trade between
the UK and EU and other trade partners as Japan, Turkey and the United States.49 We believe that this
approach could be applied in other sectors, also, where data is available.
In Table 5.2 we present the results of our pharmaceuticals trade model. Note that in addition to the GDP
and trade policy dummies that appear in the all-trade regression above, for the pharmaceuticals sector we
also include a dummy variable that takes a value of one starting on 1996. This variable captures the year in
which, according to our judgement, there were relevant events that relate to the trade of pharmaceuticals
in the EU, namely, the court rulings regarding parallel trade (Merck v Primecrown) and
trademarks/repackaging (Bristol-Myers Squibb v Paranova).
Table 5.2: Estimation of the effect of free trade agreements on total pharmaceutical trade in the UK
via a gravity model
Variable 1 2 3
Intercept -0.9096606 16.88167*** 21.88721***
UK GDP 0.8094253***
Partner GDP 1.068762***
Distance -0.6975915*** -0.6975915***
Free Trade Agreement -0.4015218*** 0.1667964 0.1914056
Customs Union 0.2102044 0.0907828 -0.0117946
Single Market -0.237119 1.081346*** 0.6161392***
Court rulings 0.4608576*** 0.4608576***
Unexplained UK GDP 0.8094253***
Unexplained Partner GDP 1.068762***
R2 0.7978 0.1288 0.7978
Note: Panel estimation method: random effects. ***, ** and * denote that a coefficient is significant with 99%, 95% and 90% confidence, respectively.
We conclude from our estimations in the third column that trade in pharmaceuticals in the UK is positively
affected by the UK’s GDP, the partner country’s GDP, the existence of the Single Market and the court
rulings of 1996, whilst it is negatively affected by geographical distance. All these effects are statistically
significant at extremely high confidence levels and the total explanatory power of the estimation, measured
by the R-squared is at virtually 80 per cent.
As an alternative to the free trade agreement dummies approach (an inputs-based measure of integration)
used in the regressions reported above, it is possible to include price dispersion as a measure of
integration. It is expected that trade would increase with integration, which in turn leads to a lower price
49 Harmonized Commodity Description and Coding System (HS), category 3004.
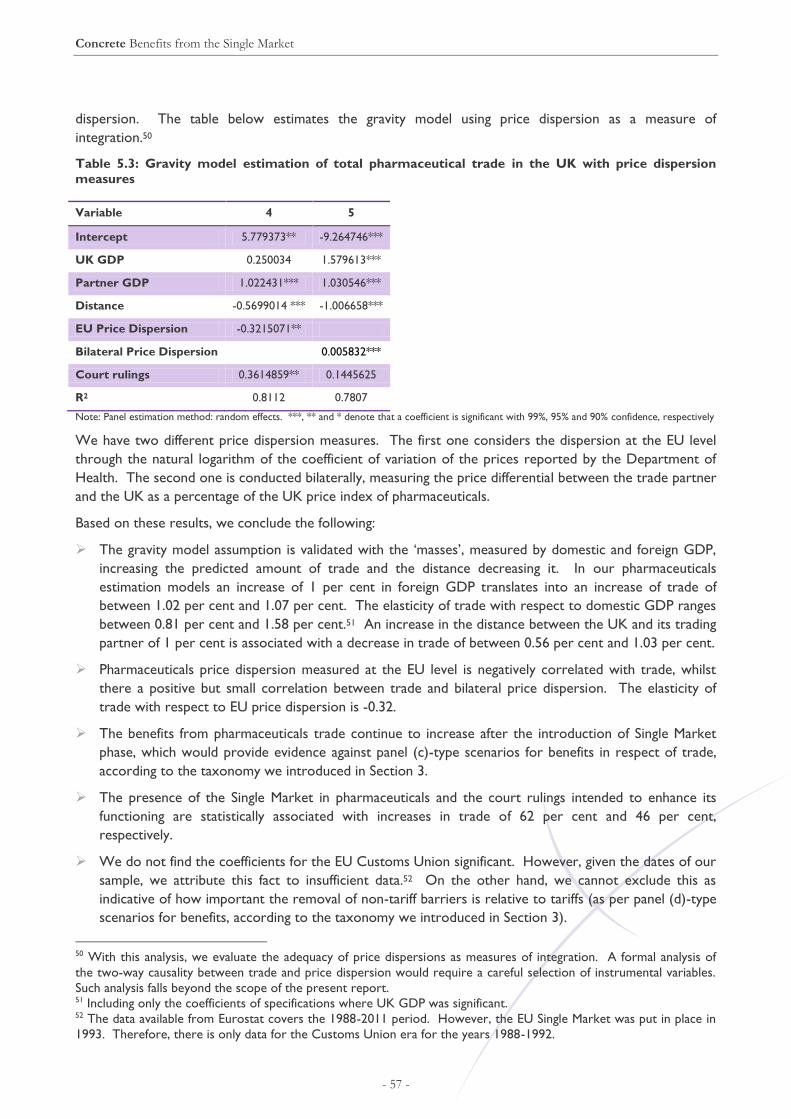
Concrete Benefits from the Single Market
- 57 -
dispersion. The table below estimates the gravity model using price dispersion as a measure of
integration.50
Table 5.3: Gravity model estimation of total pharmaceutical trade in the UK with price dispersion
measures
Variable 4 5
Intercept 5.779373** -9.264746***
UK GDP 0.250034 1.579613***
Partner GDP 1.022431*** 1.030546***
Distance -0.5699014 *** -1.006658***
EU Price Dispersion -0.3215071**
Bilateral Price Dispersion 0.005832***
Court rulings 0.3614859** 0.1445625
R2 0.8112 0.7807
Note: Panel estimation method: random effects. ***, ** and * denote that a coefficient is significant with 99%, 95% and 90% confidence, respectively
We have two different price dispersion measures. The first one considers the dispersion at the EU level
through the natural logarithm of the coefficient of variation of the prices reported by the Department of
Health. The second one is conducted bilaterally, measuring the price differential between the trade partner
and the UK as a percentage of the UK price index of pharmaceuticals.
Based on these results, we conclude the following:
The gravity model assumption is validated with the ‘masses’, measured by domestic and foreign GDP,
increasing the predicted amount of trade and the distance decreasing it. In our pharmaceuticals
estimation models an increase of 1 per cent in foreign GDP translates into an increase of trade of
between 1.02 per cent and 1.07 per cent. The elasticity of trade with respect to domestic GDP ranges
between 0.81 per cent and 1.58 per cent.51 An increase in the distance between the UK and its trading
partner of 1 per cent is associated with a decrease in trade of between 0.56 per cent and 1.03 per cent.
Pharmaceuticals price dispersion measured at the EU level is negatively correlated with trade, whilst
there a positive but small correlation between trade and bilateral price dispersion. The elasticity of
trade with respect to EU price dispersion is -0.32.
The benefits from pharmaceuticals trade continue to increase after the introduction of Single Market
phase, which would provide evidence against panel (c)-type scenarios for benefits in respect of trade,
according to the taxonomy we introduced in Section 3.
The presence of the Single Market in pharmaceuticals and the court rulings intended to enhance its
functioning are statistically associated with increases in trade of 62 per cent and 46 per cent,
respectively.
We do not find the coefficients for the EU Customs Union significant. However, given the dates of our
sample, we attribute this fact to insufficient data.52 On the other hand, we cannot exclude this as
indicative of how important the removal of non-tariff barriers is relative to tariffs (as per panel (d)-type
scenarios for benefits, according to the taxonomy we introduced in Section 3).
50 With this analysis, we evaluate the adequacy of price dispersions as measures of integration. A formal analysis of
the two-way causality between trade and price dispersion would require a careful selection of instrumental variables.
Such analysis falls beyond the scope of the present report. 51 Including only the coefficients of specifications where UK GDP was significant. 52 The data available from Eurostat covers the 1988-2011 period. However, the EU Single Market was put in place in
1993. Therefore, there is only data for the Customs Union era for the years 1988-1992.

Concrete Benefits from the Single Market
- 58 -
5.2 Competition
One of the expected benefits of the Single Market is an increase in the competitive pressure in domestic
markets reducing prices for consumers and increasing technical and allocative efficiency within and between
firms and industries.
We measure the degree in competitiveness in domestic markets through the standard Hirschman-
Herfindahl index (HHI).53 For HHI definition purposes we use the geographical area of the market as the
Member State itself.54 We focus on two different sectors: pharmaceuticals and motor vehicles. The
former is one of our main case studies, whilst we expect the latter to serve as benchmark of successful
integration across the EU.
Figure 5.1 shows the median, maximum and minimum HHI across 10 EU countries for the period 1997-
2006.55 The median and minimum values are relatively stable over time, with a small decrease in the
median from .17 to .14 (a 16.6 per cent decrease). However, the maximum value exhibits considerable
variation over time. The countries with the largest HHIs are Austria, Denmark and Finland, whilst the
lowest were France, Italy and Spain. For Austria and Finland HHIs decreased from .55 and .62, respectively,
in 1997 to .28 in 2006. It is interesting to note the resemblance between the maximum HHI and the price
dispersion of pharmaceuticals in the EU from the figure below.
Figure 5.1: Hirschman-Herfindahl index for Pharmaceuticals, 1997-2006
Source: EU KLEMS, based on the Amadeus database, defined according to NACE Rev.1.1, code 244.
53 The HHI is defined as the sum of the squares of the market shares of all the firms that participate in the market. A
higher value of this index indicates a less competitive industry. An index below 0.15 is generally interpreted as
competitive by different competition authorities. 54 This does not imply we are assuming that the relevant economic market is only the Member State — quite the
reverse, for we are seeking to assess how competition within states might be promoted by the extension of the
relevant economic market from the Member State to the EU as a whole. 55 Data is available for the following countries: Austria, Belgium, Denmark, Spain, Finland, France, Germany, Italy,
Netherlands and the United Kingdom

Concrete Benefits from the Single Market
- 59 -
Figure 5.2 shows an analogous analysis for the motor vehicles sector. In this chart, given the larger amount
of data available, we include results for EU15 and EU27 Member States. In this case, we observe that all
measures (namely, median, maximum and minimum values) decrease over time for both groups of
countries. See Table 5.4 for the corresponding nine-year percentage changes. As it is shown there, the
increase in competitive pressure applies to both EU15 and EU27 groups. Interestingly, for the EU27 group
the proportionate increase in the median HHI is greater than in the maximum HHI, suggesting that the
increase in competitive pressures is not simply a matter of competition increasing in those new Member
States that are least competitive to begin with.
Figure 5.2: Hirschman-Herfindahl index for Motor vehicles, trailers and semi-trailers, 1997-2006
Note: Uses code 34
Source: EU KLEMS, based on the Amadeus database, defined according to NACE Rev.1.1
Table 5.4: Hirschman-Herfindahl index for Motor vehicles, trailers and semi-trailers, 1997-2006
1997 2006 Percentage change
Median
EU15 0.26 0.19 -28.2%
EU27 0.29 0.19 -35.3%
Maximum
EU15 0.90 0.57 -36.2%
EU27 0.90 0.69 -22.9%
Minimum
EU15 0.11 0.09 -15.4%
EU27 0.11 0.07 -32.5%
Note: Uses code 34
Source: EU KLEMS, based on the Amadeus database, defined according to NACE Rev.1.1
Note that the greatest increase in competition / reduction in concentration has been achieved in those
countries with the least competition initially.

Concrete Benefits from the Single Market
- 60 -
Our findings are consistent with the hypothesis that competition increases with further integration. In
sectors when integration has been more successful, as with motor vehicles, improvements in the HHI can
be seen across the board. In sectors in which there is only partial integration, such as pharmaceuticals, the
benefits from the Single Market might become tangible only in some markets, such as those with, initially,
the lowest levels of competitive pressure.
5.3 Efficiency gains
Potential benefits of the Single Market include gains in efficiency from sources such as economies of scale
and scope. We measure these efficiency gains using unit labour costs — defined as the ratio of total labour
costs (total hours worked multiplied by the hourly wage) to Gross Value Added, deflated by the Gross
Value Added price index. Data is available from EU KLEMS from 1970 for EU 25 Member States.
The following charts present our results. Unlike the case with labour productivity in the previous chapter,
there seems to be no clear trend in the unit labour costs for the total economy, energy and financial
services sectors.
In the period 1996-2007, the EU median labour cost increased 7.7 per cent for the total economy, but
decreased by 10.2 per cent and 6.9 per cent for the energy and financial services sectors, respectively. As
we saw above, the pharmaceutical sector had the largest gains in efficiency in recent years, when measured
by labour productivity. It can be seen that this sector is exceptional in that the unit labour costs have
decreased.

Concrete Benefits from the Single Market
- 61 -
Figure 5.3: Unit Labour Costs for Member States of the EU15, 1971-
2006
Note: Defined by NACE Rev. 2 sectors
Source: EU KLEMS
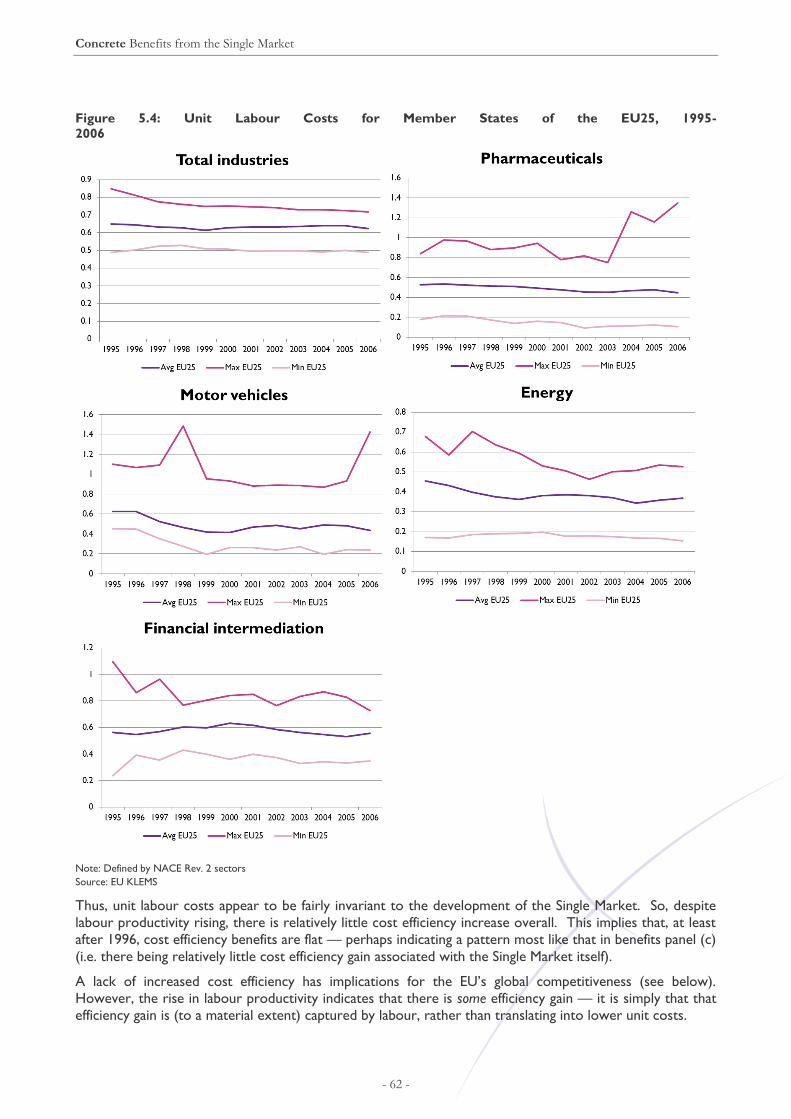
Concrete Benefits from the Single Market
- 62 -
Figure 5.4: Unit Labour Costs for Member States of the EU25, 1995-
2006
Note: Defined by NACE Rev. 2 sectors
Source: EU KLEMS
Thus, unit labour costs appear to be fairly invariant to the development of the Single Market. So, despite
labour productivity rising, there is relatively little cost efficiency increase overall. This implies that, at least
after 1996, cost efficiency benefits are flat — perhaps indicating a pattern most like that in benefits panel (c)
(i.e. there being relatively little cost efficiency gain associated with the Single Market itself).
A lack of increased cost efficiency has implications for the EU’s global competitiveness (see below).
However, the rise in labour productivity indicates that there is some efficiency gain — it is simply that that
efficiency gain is (to a material extent) captured by labour, rather than translating into lower unit costs.

Concrete Benefits from the Single Market
- 63 -
Figure 5.5: Unit Labour Costs for total industries in the EU15, Japan and the United States, 1977-2006
Note: Defined by NACE Rev. 2 sectors
Source: EU KLEMS
5.4 Innovation
Higher levels of innovation are among the expected benefits of European integration. We measure
innovation through expenditure in Research and Development (R&D). We observe immediately that there
are some weaknesses in such an approach, in particular
Because expenditure is an input, not an output — by our approach here, if less is spent on
innovation but is spent much more efficiently such that more innovating occurs, we shall mistakenly
infer that innovation has risen. Implicitly, we are assuming that the amount of innovation produced
increases with the amount spent on innovation, and that the productivity of innovation expenditure
is invariant.
Because innovation covers a much broader spectrum of activities than even simply the output of
R&D, including process innovation, new product ideas, and new service concepts that might arise
from new start-up firms or from on-the-job insights as well as from targeted research by existing
players.
Other measures of innovation could include the number of personnel employed in R&D activities, number
of patents and innovative activity (according to the biannual Community Innovation Survey). These caveats
notwithstanding, due to data availability and the need to make international comparisons, we focus on
expenditure on R&D.
The figure below shows the evolution of R&D expenditure for the total economy as a percentage of GDP.
On first inspection, the expenditure in EU 27 and EU15 countries follow similar patterns, which show a
very gradual increase over time, from 1.8-1.84 per cent of GDP in 1995 to 2.02-2.11 per cent in 2009 (a
12.2-14.7 per cent increase in the period). Figure 5.6 also shows that Japan, South Korea and the United
States have had consistently higher levels of R&D expenditure relative to GDP, whilst China and Russia
exhibit lower levels. In addition, the time evolution of R&D expenditure has seen rapid increase in China
and South Korea, whilst this process has been slower in Japan and the United States.

Concrete Benefits from the Single Market
- 64 -
Figure 5.6: Total R&D Expenditure (GERD) as a percentage of GDP, 1995-2009
Source: Eurostat.
Table 5.5 shows that the apparent uniformity and stability of innovation in the EU does not hold when
comparing individual Member States. The second column shows the level of R&D expenditure in 2011.
The European average is approximately 2 per cent of GDP. The countries that significantly outperform this
figure are (in order) Finland, Sweden, Iceland, Denmark, Switzerland, Germany, Austria, Slovenia and
Estonia.
The third column in
Table 5.5 shows that average percentage change of the R&D expenditure to GDP ratio in the period from
1995 to 2011. Whilst the European average is .75 per cent, this measure shows a large degree of
dispersion across Member States. The countries that show an average at least four times as large as the
European are (in order) Malta, Estonia, Portugal, Cyprus, Iceland, Lithuania, Czech Republic, Austria,
Switzerland, Denmark, Spain, Hungary, Finland and Slovenia.
There are two main conclusions that can be drawn from
Table 5.5. First, a significant part of the Member States that joined the EU on or after 2004 have seen a
very substantial increase in their R&D expenditure. This fact is consistent with the benefits of the Single
Market in terms of innovation. Second, a number of established economies in the EU have either low levels
or low growth in their R&D spending. These Member States include France, the Netherlands and the UK.
This fact, however, might not necessarily indicate that those countries do not reap the benefits from
innovation in the Single Market for two reasons. First, integration might lead to specialisation and those
Member States might not have their comparative advantage in sectors that are R&D intensive. Second,
innovation in sectors such as financial services, which represent a significant part of the economies of some
Member States as the UK, might not be best captured through R&D expenditure. Therefore, their
innovation activities might be underrepresented in the measures used in this section.

Concrete Benefits from the Single Market
- 65 -
Table 5.5: Total R&D Expenditure (GERD) as a percentage of GDP, 1995-2011
Country 2011 level Average annual percentage change
European Union (27 countries) 2.03% 0.75%
European Union (15 countries) 2.12% 0.89%
Malta 0.73% 12.15%
Estonia 2.38% 11.62%
Portugal 1.50% 6.85%
Cyprus 0.48% 6.18%
Lithuania 0.92% 4.87%
Czech Republic 1.84% 4.50%
Austria 2.75% 3.65%
Denmark 3.09% 3.36%
Spain 1.33% 3.31%
Hungary 1.21% 3.30%
Finland 3.78% 3.27%
Slovenia 2.47% 3.08%
Greece 0.60%* 2.82%
Latvia 0.70% 2.52%
Ireland 1.72% 2.01%
Germany 2.84% 1.64%
Italy 1.25% 1.60%
Belgium 2.04% 1.26%
Poland 0.77% 1.26%
Sweden 3.37% 0.28%
Netherlands 2.04% 0.22%
France 2.25% -0.08%
United Kingdom 1.77% -0.41%
Bulgaria 0.57% -0.52%
Luxembourg 1.43% -1.58%
Slovakia 0.68% -1.87%
Romania 0.48% -2.75%
Non-EU
Iceland 3.11%*** 5.61%
Norway 1.70% 0.05%
Switzerland 2.87%** 3.48%
Croatia 0.75% -2.71%
Note: Due to data availability, *, ** and *** denote the levels in the years 2007, 2008 and 2009, respectively
Source: Eurostat
As it has been done throughout our analysis, more detailed conclusions can sometimes be obtained for
specific sectors. We conduct a similar analysis for the pharmaceutical sector.
Figure 5.7 shows expenditure on R&D in the pharmaceuticals sector. The median and maximum
expenditure in European countries is compared to other developed countries.56 From this Figure we make
the following two observations. First, it can be seen that the median EU R&D expenditure in
56 The maximum R&D expenditure in pharmaceuticals in the Europe for the period covered in our sample took place
initially in Sweden and later in Switzerland. The median expenditure in the EU considers all the current Member
States for which data is available. We note that the results of the BERD survey are not available for some NACE
categories for the following EU countries in the period covered: Denmark, Finland, Lithuania, Luxembourg and the
UK.
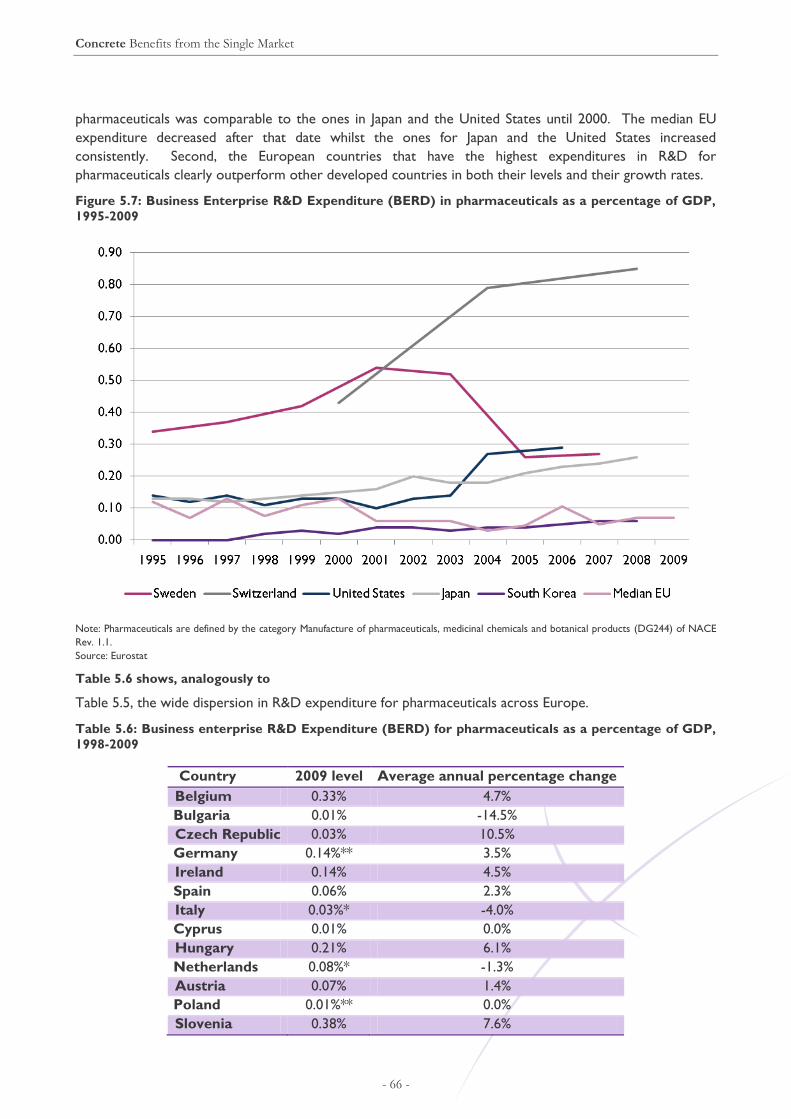
Concrete Benefits from the Single Market
- 66 -
pharmaceuticals was comparable to the ones in Japan and the United States until 2000. The median EU
expenditure decreased after that date whilst the ones for Japan and the United States increased
consistently. Second, the European countries that have the highest expenditures in R&D for
pharmaceuticals clearly outperform other developed countries in both their levels and their growth rates.
Figure 5.7: Business Enterprise R&D Expenditure (BERD) in pharmaceuticals as a percentage of GDP,
1995-2009
Note: Pharmaceuticals are defined by the category Manufacture of pharmaceuticals, medicinal chemicals and botanical products (DG244) of NACE
Rev. 1.1.
Source: Eurostat
Table 5.6 shows, analogously to
Table 5.5, the wide dispersion in R&D expenditure for pharmaceuticals across Europe.
Table 5.6: Business enterprise R&D Expenditure (BERD) for pharmaceuticals as a percentage of GDP,
1998-2009
Country 2009 level Average annual percentage change
Belgium 0.33% 4.7%
Bulgaria 0.01% -14.5%
Czech Republic 0.03% 10.5%
Germany 0.14%** 3.5%
Ireland 0.14% 4.5%
Spain 0.06% 2.3%
Italy 0.03%* -4.0%
Cyprus 0.01% 0.0%
Hungary 0.21% 6.1%
Netherlands 0.08%* -1.3%
Austria 0.07% 1.4%
Poland 0.01%** 0.0%
Slovenia 0.38% 7.6%

Concrete Benefits from the Single Market
- 67 -
Country 2009 level Average annual percentage change
Slovakia 0.01%* -38.9%
Sweden 0.27%* -5.4%
Iceland 0.15% 10.0%
Norway 0.02%** -5.6%
Switzerland 0.85%** 8.9%
Croatia 0.05% 25.8%
Median 0.07% 2.3%
Maximum 0.85% 25.8%
Minimum 0.01% -38.9%
Note: Due to data availability, * and ** denote the levels in the years 2007 and 2008, respectively. UK figures appear only for some NACE
categories, not including pharmaceuticals and for some (such as financial services and motor vehicles) only since 2007
Source: Eurostat.
A conclusion that can be obtained from this section is that the benefits from the Single Market in terms of
innovation may not apply uniformly to all Member States, but to those that specialise in sectors intensive in
R&D, such as pharmaceuticals.
Thus, in conclusion, the effects of the EU in terms of promoting innovation may be concentrated in certain
Member States (of which the UK might be an example if innovation were measured properly in the
dimensions in which the UK specialises, though the UK does badly in terms of the data available) — and the
gains of such innovation may accrue to consumers and firms across the EU. We are unable to draw any
clear conclusion regarding the likely shape of benefits.
5.5 Indicative Quantitative Results
The following table summarizes the quantitative results from this section. As throughout this report, we
note that the purpose of exhibiting these results is not to offer commentary on the specific sectors studied,
but to illustrate the synoptic method of analysis.
Table 5.7: Estimated effect of price dispersion
Pharmaceuticals Motor vehicles
Trade -3.09*** -6.41***
Unit Labour Cost 2.42
Competition (HHI) .409*** 1.3**
Innovation (R&D) -.382 .170
Note: *** = statistically significant at 99% confidence; ** = 95%; * = 90%.
One of our measures of the degree of integration is the (reduction in) the degree of price dispersion. This
first table tells us that we had data sufficient to estimate impacts of changes in price dispersion in the
pharmaceuticals sector on trade, competition and innovation and in the motor vehicles sector for all four
efficiency areas, and found there to be statistically significant correlation with Trade and Competition but
not unit labour costs or innovation (*** or ** indicates statistical significance, which * is only marginal
significance). For each percentage point reduction in price dispersion (measured by the CoV), there is
increase in trade of 3.09 per cent for pharmaceuticals and 6.41 per cent for motor vehicles, and a reduction

Concrete Benefits from the Single Market
- 68 -
in the index of competition (HHI) (i.e. an increase in competition) of 0.409 per cent for pharmaceuticals
and 1.3 per cent for motor vehicles.57
Table 5.8: Estimated effect of wage dispersion
Pharmaceuticals Energy Financial Services Motor vehicles
Trade 3.03** -3.44**
Unit Labour Cost -.117 -.726 .632
Competition (HHI) .218 -2.04*
Innovation (R&D) .397 -.173 -.227
Note: *** = statistically significant at 99% confidence; ** = 95%; * = 90%.
Another measure of integration is wage dispersion. We found that falling wage dispersion is correlated
with increased trade in the motor vehicles sector — a 3.44 per cent rise in motor vehicles trade for each 1
per cent reduction in wage dispersion. The pharmaceuticals sector exhibits a perverse impact of reduced
wage dispersion — falling wage dispersion is associated with reduced trade. There was no other clearly
statistically significant correlation (the * on competition HHI for motor vehicles is only marginally significant
and the coefficient is perverse — i.e. competition falls as wage dispersion falls; we therefore believe this
should be discounted.). There were no statistically significant impacts for Energy or Financial Services.
Our final regression of this section focuses up “input” measures, breaking down the Single Market
programme into the components set out in Section 4.4.
Table 5.9: Impact of Single Market programme on Motor vehicles
Trade Unit Labour Cost HHI Innovation
Single Market 0.462068*** 1.786881 0.00000 0.024961***
Competition -0.19934 (omitted) (omitted) (omitted)
State Aid -0.25334* -0.13779 0.003163*** 0.031253***
Environment -0.02338 -2.74343* -0.01957*** -0.01332
Employment / Procurement -0.18205* 0.940149 0.001114 -0.01555
Trade (omitted) (omitted) (omitted) (omitted)
Sector-specific (omitted) (omitted) (omitted) (omitted)
Time -0.04961*** 1.634626*** -0.00729*** 0.00096
Note: *** = statistically significant at 99% confidence; ** = 95%; * = 90%. “(omitted)” indicates the variable is dropped to avoid multicollinearity
For non-omitted variables, the statistically significant impacts (those with significance of 95 per cent or 99
per cent — *** or ** in the table above) are:
The Single Market in general (over and above the specific policy areas identified) is associated with
increased trade and innovation in the motor vehicles sector.
Amongst (or additional to) Single Market impacts, State aid is relatively unsuccessful — it has no
statistically significant impact on trade or unit labour costs, and is associated with a tiny increase in
concentration.58 It is, however, correlated with increased expenditure on innovation. (One
57 We note that there is a potential technical issue of endogeneity here, which would require detailed data to resolve
and which it is not proportionate for us to address fully within this synoptic review, but which should be addressed
were a detailed study to be made of these sectors. 58 If the impact were larger, it might be tempting to speculate that the removal of state aid knocks out inefficient
“national champions” leaving room for larger more efficient cross-border players. But although statistically significant,
the impact is very small, making interpretation problematic.

Concrete Benefits from the Single Market
- 69 -
potential interpretation is that, forbidden from subsidising firms in other ways, governments
respond by funding or otherwise promoting increased research.)
Environment policy is not correlated with statistically significant impacts on trade, unit labour costs
or innovation, but is correlated with reduced concentration.59
Employment/procurement policies are not statistically significantly correlated with any impacts.
Trade and sector-specific regulation cannot be disentangled statistically from other effects by our
model and thus are omitted.
59 Environmental regulation, including specific national standards, was a well-known significant form of non-tariff
barrier prior to the Single Market programme. It might therefore be expected that the pan-Europe coordination of
policy, associated with significantly reducing non-tariff barriers of this form, should ease barriers to entry and increase
competition.
Concrete Costs of the Single Market
- 70 -
6 Concrete Costs of the Single Market
In this chapter we will explore the costs incurred by Member States by participating in the European Single
Market. We have identified the following sources of these costs, which are:
trade diversion;
sovereignty/democracy costs;
subsidiarity costs;
process costs EU Budget: Administration;
costs of regulation.
In this section we shall focus upon trade diversion risks, process costs and the costs of regulation, whilst
mentioning subsidiarity costs. More general sovereignty costs are considered in the next section.
6.1 Trade diversion
In a customs union, the degree of trade diversion increases as the volume of trade that would occur with
the rest of the world, but for the external tariff of the customs union, increases. That in turn depends on
the quality of product produced outside the customs union, the cost thereof, and the volume available.
If the pre-tariff price of non-customs union products falls further below the customs union price and
production capacity outside the customs union rises, the proportion of international trade accounted for
will rise. Hence two indicators of an increasing risk of trade diversion are:
An increasing proportion of international GDP and trade accounted for by countries outside the
customs union (other things being equal60);61
A fall in international tariffs imposed by countries outside the customs union.
There is also a dynamic aspect, especially in a Single Market in which not only products (goods and
services) are relevant but also the factors of production — with the implication that relative investment
expectations (relative, that is, between EU and non-EU sources) are a key potential source of benefits or
costs.
6.1.1 The proportion of world GDP accounted for by the EU is falling
Opportunities outside the EU may be growing more rapidly than was the case in previous decades. Though
Britain and Europe may grow only slow through the next few years, the world as a whole has been growing
much more healthily — setting aside the global contraction of 2009.
60 In particular, for invariant non-tariff barriers, which is clearly not the case for the EU. 61 To develop the intuition for why this is so, consider the following thought experiment. Imagine first that the
customs union encompassed the entire world — in that case there would no trade diversion at all. Next imagine that
the boundary of the customs union were contracted so that it covered fewer and fewer trading countries and hence a
smaller and smaller proportion of the world with which one would otherwise trade — as more and more of
international trade were conducted outside the customs union, the amount of trade diverted would, other things
being equal, increase.

Concrete Costs of the Single Market
- 71 -
Figure 6.1: GDP at PPP, 1990-2016 ($)
Source: IMF World Economic Outlook
In 1990, the European Union was 27 per cent of world output (in US dollars, at purchasing power parity).
By 2002 the EU was still 25 per cent of world output — only a small drop. But by 2016 the EU is forecast
to be just 18 per cent of world output — a dramatic and rapid relative fall.62
The balance of advantage, over the next decade, could quite plausibly have shifted dramatically. Whilst EU
Member States offer stagnant (or even in some sectors such as financial services, shrinking) opportunities
for UK firms, opportunities explode elsewhere. This would be likely to imply increasing trade diversion
risk.
6.1.2 International tariffs are much lower than in past decades
The following table illustrates the ways that international trade agreements have led to a reduction in
international tariffs amongst countries outside the EU and with the EU.
Table 6.1: GATTs reductions in tariffs
Global
liberalization
Description
1950: Individual
External Tariffs (%)
Reduction by countries (%): AT(20), BE(9),
DE(16), DK(5), ES*(24),
FI(13.5), FR(19), GR*(24), IE*(17),
IT(24), NL(9), PT*(24), SE(6), UK(17)
1964-1967:
Kennedy-Round
Average agreed (relative) tariff reductions: 47%
1973-1979: Tokyo-Average agreed (relative) tariff reductions: 30%
62 We observe that since some of this impact arises from especially strong growth in the emerging markets of Brazil,
Russia, China and India, the relative share of other developed economies falls also — though EU growth is projected
to be slower than growth in the US, Australia, and a number of other developed economies, so the overall impact is
reduced. But even if the share of other developed countries fell even faster than that of the EU, that would not affect
the central point being made, which is that as the share of EU trade in global trade falls, the trade diversion associated
with the EU’s customs union will tend to rise, regardless of whether that is trade with developed or emerging
markets.

Concrete Costs of the Single Market
- 72 -
Global
liberalization
Description
Round
1986-1993:
Uruguay-Round
Average agreed (relative) tariff reductions: 40%
Source: Badinger (2001), “Growth effects of Economic integration – the case of the EU Member States (1950 – 2000), IEF working paper Nr. 40
We see that a series of GATTs negotiations have led to very significant falls in tariffs. It has even been
argued that the fall in international tariffs has been significant enough that it, alone, could account for the
considerable majority of the trade-enhancements more normally attributed to the elimination of tariffs
within the EU’s customs union.63
As international tariffs fall, the tariff-based benefits of being inside the EU’s tariff-free customs union area
fall. On the other hand, the lower the external tariffs imposed by the EU, because of these international
agreements, the lower the trade diversion risk (since the difference between the pre-tariff price and the
post-tariff price falls).
One should also be cautious, however, in being too definitive on this point. In particular, a key element of
the EU is that it serves as a device for the joint negotiation of international trade accords with non-EU
partners. It might therefore be a mistake to assume that, absent combining into the EU as joint negotiator,
European Member States would have secured as large reductions in international tariffs as have been
secured via the EU.
6.1.3 Case study: Global opportunities versus EU opportunities in Financial Services
We can explore further the ways a changed balance of opportunities within versus outside the EU has
evolved through time by considering the concrete case of the financial services sector. As the Single
Market developed and expanded, and as financial development advanced in many EU Member States,
especially under the influence of EU-level regulation, the 1990s and 2000s saw opportunities for UK
businesses within the EU, including in particular UK financial sector businesses, both because financial
services sectors developed within the EU as economies developed and under the influence of liberalising
regulation, and also because the development of the financial services sector in turn promoted more rapid
economic growth.
However, although for nearly two decades financial development within the EU created attractive
opportunities for British financial services sector exporters, this is much less clearly likely to be the case
over the next decade. In a number of Member States (e.g. Ireland, Spain), an important factor in enhanced
financial development appears to have been over-indebtedness and over-expansion in banking sectors. The
correction of this problem is likely to be associated with reductions in the volume and value of financial
sector business. Even simply the process of deleveraging — reducing indebtedness relative to the size of
the economy — is likely to have the consequence of a fall in financial sector activity, as lower debt levels
means less demand for the debt to be put to work adding value, and hence passing through financial
intermediaries. But beyond that there may be considerable austerity at national level, reduced function of
banking sectors, reduced appetite for experimenting with new financial sector firms or new innovations —
in short, these are unlikely to be as attractive growth opportunities for British financial sector firms as was
the case in the past.
The financial crisis of recent years is unprecedented in the post-World War II era. It is an established
empirical observation that major financial crises are followed by periods of deleveraging. The more
substantial the financial crisis, other things being equal, the more substantial the deleveraging that follows.
63 e.g. see Badinger (2001), “Growth effects of Economic integration – the case of the EU Member States (1950 –
2000), IEF working paper Nr.40 http://epub.wu.ac.at/170/1/document.pdf
Concrete Costs of the Single Market
- 73 -
Given the scale of the recent (and in some senses on-going) financial crisis, we would anticipate a significant
phase of deleveraging. The McKinsey Global Institute analysed 45 historic episodes of deleveraging, finding
that they on average last six to seven years and reduce the ratio of debt to GDP by 25 per cent.64 This
empirical finding suggests that households, businesses and governments will continue to deleverage for a
number of years.
In some Member States, the key form of deleveraging will be direct reductions in household indebtedness.
For example, a European Parliament study in 2010 identified Cyprus, Denmark, Ireland, Portugal, Spain and
the United Kingdom as “high household indebtedness” Member States, averaging 85 per cent household
debt to GDP in December 2009.65 That compared with average household indebtedness of just 56 per
cent for Belgium, Germany, Luxembourg, Austria, Finland, France, Malta, Netherland and Sweden. A
reduction of 25 per cent in household debt to GDP for the high indebtedness countries (in line with
McKinsey’s historical analysis) would take them to 60 per cent — close to the average for the lower-
indebtedness group.
In other Member States (and to some extent even in the high household indebtedness states), a key
mechanism of deleveraging will be government austerity programmes. That will deleverage both by
reducing government debt and by increasing household tax commitments and reducing benefits, thereby
making households less attractive to lenders, reducing their creditworthiness and so reducing the amounts
they borrow.
In other cases, deleveraging may take the more brutal form of default. That could be true over the next
decade at household, corporate, and even sovereign level.
Just as periods of increasing leverage are both effect and cause of growth in financial services, periods of
deleveraging will tend to be associated with and encourage contraction in financial services. Thus, this
protracted period of deleveraging will tend to reduce financial services activity. This follows both from a
reduction in credit extended by financial services firms and a consequent reduction in economic activity and
growth, further restricting demand for and provision of financial services.
The Eurozone, in aggregate, is not as heavily indebted as the UK or the US, and of course there are EU
Member States outside the euro, such as the Czech Republic, which offer their own unique growth
opportunities. And we emphasize that the point being made here is not that there remains no scope for an
expansion in financial services within the EU, or that financial services sectors had become “just too
large”.66 The central point is merely that there is clearly a case to be made that, in this next-decade phase
of deleveraging, relative to the recent past, opportunities for rapid growth in financial services within the
EU are likely to be more limited.
6.2 Process costs
The functioning of the Single Market requires dedicated administrative bodies together with utilisation of a
significant part of the EU government. The associated considerable processing cost must be funded by
Member States. The following graph presents the UK contributions to the administrative expenditure
component of each EU Budget period67, in gross and net terms, relative to UK GDP.
64
http://www.mckinsey.com/Insights/MGI/Research/Financial_Markets/Debt_and_deleveraging_The_global_credit_bubbl
e_Update 65 Household indebtedness in the EU, Europe Economics on behalf of the CRIS Committee of the European Parliament,
2010. 66 For example, Europe Economics’ analysis for TheCityUK has suggested that, in all Member States except Ireland
and the United Kingdom, the financial services sector is clearly below even fairly minimal notions of its efficient size —
see paragraphs 2.65ff in http://217.154.230.218/NR/rdonlyres/583EB1BD-3CAE-4EAD-8BEA-
41B2CEC1EFD6/0/BC_RS_ValueofEUsFinancialCentres_FullReport.pdf. 67 The EU budget is governed by the Multi-Annual Financial Framework (MFF) in which each annual EU budget is based
on spending rules which apply across seven-year framework period.

Concrete Costs of the Single Market
- 74 -
Figure 6.2: UK contribution to EU administrative expenditure
Source: Europe Economic analysis based on data collected from Eurostat, Official Journals of the European Communities and financial reports of the
European Commission
We see that there is a rising trend in gross UK contribution to administrative expenditure, even relative to
GDP. In general, the gross UK contribution would adjust according to the goals of the EU and fluctuate
between 0.04 and 0.07 per cent to GDP level. After the introduction of Single Market in 1993, there was a
gradual fall in gross UK contribution until the financial crisis in 2007. Specific budget has recently been
assigned to improving the institutional infrastructure of the EU as a single economy, for instance, €40 billion
was assigned to the creation of the Connecting Europe Facility in the 2014 – 2020 budget.68,69
6.3 Costs of Regulation
6.3.1 Sources of cost of EU legislation
Besides the annual contribution each Member States make, another major component of the cost of EU
membership is the cost of complying with EU regulations. Regulatory costs to businesses could include:
- Administrative costs — i.e. those incurred from providing information to government authorities
or complying with administrative tasks such as record-keeping;
- Policy costs — i.e. those incurred in meeting the aims of the regulations, e.g. installing new
computer software to facilitate information sharing;
- Financial costs — i.e. costs arising from a direct transfer of money to the government and
regulatory agencies, such as authorisation fee, a tax or levy; and
- Wider costs on the economy created by regulatory distortions.
68 http://europa.eu/legislation_summaries/budget/bu0001_en.htm 69 The analysis here considers EU institutional estimates. Details of the UK Treasury view of UK contributions and
public sector receipts for the years 2009-10 to 2011-12 can be found in Table 3C, page 17, of European Union
Finances 2012 (Cm 8405) — see http://www.hm-treasury.gov.uk/int_eu_statefraud.htm. The Office for Budget
Responsibility’s latest forecast of UK contributions to the EU Budget over the period 2012-13 to 2017-18 was
published in December 2012 and can be found in Table 2.19 of Economic and fiscal outlook supplementary fiscal tables
at: http://budgetresponsibility.independent.gov.uk/economic-and-fiscal-outlook-december-2012/

Concrete Costs of the Single Market
- 75 -
We have seen in Section 4.4.2 that the costs of achieving additional integration appear to be rising as more
integration is achieved (i.e. the cost curves take a form like curves C or A of Section 3). Between 1998 and
2007, there were a total of 9,415 EU laws/rules, at an average of 942 new laws introduced each year.70 In
implementing the requirements of these EU laws/rules, there were over 23,000 new regulations brought
into force in the UK between 1997 and 2003.
Various studies commissioned by governments and political organisations have attempted to measure the
costs of EU regulations to the UK economy but no strong consensus has yet been reached. The House of
Commons Library claims that 9.1 per cent of UK laws stem from the EU, but some groups claim much less
(e.g. the British Chambers of Commerce reported a much lower percentage of 0.1 per cent for the period
in 2007–200871) whilst others claim much more. As an example of the latter, a report by Open Europe
estimated that the cost of UK regulations was approximately £176 billion between 1998 and 2009. While
some of the cost could solely attributed to the UK domestic regulations in the absence of the EU
legislations, the average proportion of the cost stemmed from EU legislation is argued to be 72 per cent
per annum, though the share of the total cost has tended to fall in recent years.72 The 72 per cent
attribution figure is broadly in line with other “Eurosceptic” analysis, which typically suggests a range of 50
to 84 per cent of national laws come from the EU.73
The cost of EU legislation tends to be focused in specific policy areas. For example, it is estimated that EU
employment laws alone account for 22 per cent of the total costs of regulation imposed on the UK in 1998
– 2009.74 (We observe in passing that the value of regulation is not only to be understood in terms of
how low its costs are — a regulation of high benefit might justify higher costs than a regulation of low
benefit.)
Much analysis of the cost of EU regulation, however, includes the implicit assumptions (a) that equivalent
regulation would not be imposed by the UK authorities acting alone, absent the EU; and (b) that the cost of
regulation is to be treated in terms of (estimates of) the impact on existing firms, despite the focus and
intent of much EU regulation being to liberalise markets and strip away barriers to entry by new players in
markets, in particular firms from other EU Member States, thereby reducing their costs.75 On the other
hand, domestic regulation could be more cost effective than EU legislation, for the subsidiarity reasons
explored in Section 3.
6.3.2 Case study: The Financial Services Action Plan (FSAP)
The Financial Services Action Plan (FSAP) is a key part of the EU’s attempt to create a single market for
financial services. It was created in 1999 and contained 42 articles relating to the harmonisation of financial
services markets within the EU.
A Europe Economics 2009 report76 looked at compliance costs and focused on six Derivatives, five of
which were important parts of the FSAP. The report looked at four sectors of the financial services
70 The Taxpayers’ alliance, “Brussels of Whitehall: locating the source of the UK’s regulatory burden”,
http://tpa.typepad.com/home/files/UK_and_EU_Regulatory_Burden_Embargoed_Monday_27_October.pdf 71 British Chambers of Commerce (2009), “Worlds apart: the EU and British Regulatory systems” 72 S.Gaskell and M.Persson (2010), “Still out of control? – measuring eleven years of EU regulation”, Open Europe
report 73 Europhobia, http://www.jcm.org.uk/blog/2009/06/what-percentage-of-laws-come-from-the-eu/ 74 S.Gaskell and M.Persson (2010), “Still out of control? – measuring eleven years of EU regulation”, Open Europe
report http://www.openeurope.org.uk/Content/documents/Pdfs/stilloutofcontrol.pdf 75 This is a variant of the classic and well-known policy analysis error of focusing upon the visible firms affected by a
measure and failing to consider the effect upon firms that do not yet exist 76 Europe Economics report commissioned by the DG Internal Market (2009), “Study on the cost of compliance with
selected FSAP measures”

Concrete Costs of the Single Market
- 76 -
industry: banks & financial conglomerates, asset managers, investment banks and financial markets and
assess the cost of compliance and its impact of business across the sectors.
Mean one-off costs of complying with the six selected derivatives as a percentage of 2007 operating
expenses were found to vary across sectors with the lowest percentage of 1.43 per cent in asset managers
and the highest percentage of 2.41 per cent in banks & financial conglomerates. On the other hand, the
mean on-going costs of complying with the six selected derivatives as a percentage of 2007 operating
expenses were estimated to be between 0.32 per cent and 1.41 per cent. Despite the associated
compliance costs, the benefits of the extensive regulations were considered to outweigh the costs mainly
because of the potential for significant market failure in an unregulated financial market.
Another study on the cost of compliance on FSAP was carried out by Open Europe.77 That report
estimated that the FSAP would involve total costs of £14 – £23.5billion to the UK economy by 2010, based
on a summation across the government’s own Regulatory Impact Assessments (RIAs).
6.3.3 Case study –environment regulations in the United Kingdom before and within the
EU
The following table presents environmental regulations introduced in the UK before and during the period
of the EU.
Table 6.2 Number of environmental regulations between 1933 and 2011
Number of environmental
regulations introduced
2003 - 2011 197
1993 - 2002 51
1983 - 1992 31
1973 - 1982 14
1963 - 1972 17
1953 - 1962 4
1943 - 1952 1
1933 - 1942 2
Total 317
Total (pre 1973) 25
Total (post 1973) 292
Source: Europe Economic analysis based on information collected from The National Archives
We can see that the number of laws has increased significantly since the UK joined the European Economic
Community in the 1973 and especially significantly since the establishment of the European Commission’s
77 K.Boyfield (2006), “Selling the city short? – A review of the EU’s financial services action plan”, Open Europe

Concrete Costs of the Single Market
- 77 -
Directorate General for the Environment in 1981.78 It is therefore natural to suppose that the presence of
the EU has been a considerable factor in increasing the volume of environmental regulation.
In considering the implications of this, it is important to recognise that the EU has long had an aspiration to
have amongst the most comprehensive environment policy frameworks in the world, with ambitious
targets on sustainable development. The growth of environmental regulation is therefore no accidental
accretion, but deliberate policy. However, a number of more recent regulations involve modifying UK
regulations to comply with EU frameworks and standards, rather than extending UK regulation per se.
We note that we argued above that achieving policy synergies in an area such as environmental regulation
would mean that membership of the EU should therefore, as a benefit, entail an increase in the volume of
environmental regulation.
6.4 Conclusion
Of the concrete costs, although the rising trend in process costs within the EU should not be ignored and
there does appear to be an accelerating trend in the volume of regulation associated with the EU (although
deeper counterfactual analysis would be required before concluding that this acceleration would not be
fully duplicated by the UK alone), we consider the most significant dynamic aspect of recent and
forthcoming years has been the shifts in trade diversion. Though the removal of non-tariff barriers should
allow the EU, in principle, to achieve deeper cost reduction than is feasible under customs union or free
trade agreements, in practice the EU has not kept pace with international competitiveness trends — not
necessarily through any failings of its own but perhaps simply because of successes elsewhere. The
proportion of world economic activity accounted for by the EU is set to contract dramatically over the
next decade or so, and given that the EU has not managed to keep up with past international trends in unit
labour costs for decades, it seems unlikely that there will be any large turnaround in that trend soon.
Since trade diversion costs should (other things being equal) be expected to increase as the EU’s share of
global trade falls, the implication is that trade diversion is a rapidly increasing cost of EU membership and
could eventually become a threat to its economic efficacy, and thus that the focus upon EU competitiveness
amongst EU-level policymakers is a concern well founded.
78 The significant increase in the number of regulations in the period 2003 – 2011 can be partially explained by the
fact that, over the period, various new complex and holistic framework legislations were introduced, such as the
Ambient Air Quality Directive and the Water Framework Directive which would lay a path of extensive environment
policy development in the coming ten years.78 See C.Hey, “EU Environmental Policies: A short history of the policy
strategies”, Chapter 3 of the Environment policy Handbook

Policy Costs and Benefits
- 78 -
7 Policy Costs and Benefits
In previous sections we have considered the concrete costs and benefits of developing integration within
the Single Market. In the current section we turn our attention to the “policy costs and benefits” —
including the ways the Single Market allows British ideas to influence and improve policy-setting elsewhere,
but also the risk over Britain being over-ruled by others. A key question in this section will be the dynamic
one: is there a genuine risk that although policy benefits have outweighed costs in the past, policy costs
might outweigh benefits in the future?
7.1 How can one Measure Sovereignty Costs and Benefits?
In Section 3 we argued that one of the benefits of membership of the Single Market was the UK’s ability to
influence the policies of other Member States, whilst one of the costs was that other Member States might
collectively set UK policy in ways the UK itself might not choose. Since Britain is traditionally a pro-trade
country, the impact of its influence will tend to be to increase opportunities for trade, to the benefit of
British firms and British consumers.
On the other hand, there are also potential drawbacks to the EU-level setting of regulation:
Regulation might not be set in Britain’s national interest. As discussed above, a simple case might
be where Britain is outvoted on some regulation, and the result is that regulation is imposed upon
Britain that is conceptually inferior to British-set regulation.
Regulation set at EU level might be technically inferior to British-set regulation. For example,
designing regulations that are applicable across all Member States might result in messy
compromises on certain technical points, creating anomalies and loopholes.
The loss of regulatory competition might undermine both the long-term quality of regulation
(because of the loss of processes of learning from the mistakes and successes of others) and
remove the pressure, from the threat of regulatory arbitrage, to keep regulation at a low level —
which offsets natural bureaucratic and democratic tendencies to over-regulate. Furthermore,
Britain could be a beneficiary from regulatory arbitrage if all other relevant countries had a natural
tendency to over-regulate — i.e. ideal regulation could be the attractive regulatory minimum.
The balance of such sovereignty costs and benefits can be extremely challenging to quantify or even pin
down to specific instances. Because they are so difficult to quantify, many studies make no attempt at
quantification of any sort or even attempt to pin down whether sovereignty costs are falling or rising over
time, let alone whether the rate at which costs fall or rise is accelerating or decelerating.
Given that the costs of pooling sovereignty or the benefits thereof are argued by many commentators to
be much the largest costs/benefits of EU membership, setting them aside entirely has the drawback of
making it impossible to form a reasoned judgement as to the costs and benefits of EU membership, either
overall or in a particular sector.
Nonetheless, although we shall sketch a method for forming a view as to the dynamic of the costs and
benefits of pooling sovereignty, it is imperative to recognise from the start that any such assessment will, of
its very nature, involve an ineliminable element of judgement.
We shall consider two ways on might inform a judgement as to the evolution of the policy costs and
benefits of pooling sovereignty — noting that for the purposes of this section the only costs and benefits
relevant are the policy costs (in particular, the risk of over-rule but also other sovereignty costs) and
benefits (in particular, the opportunity to influence policy-making in other countries) rather than the
broader costs and benefits of pooling sovereignty in the EU that we explore in other sectors.
One approach considers the number of areas to which sovereignty pooling applies — which for our
purposes we treat as the policy areas falling under qualified majority voting — and the frequency with

Policy Costs and Benefits
- 79 -
which the UK is over-ruled (i.e. dissents from a legislative act). The second approach considers in detail
how key EU directives and regulation in a specific sector compare to pre-existing UK regulation, relative to
pre-existing regulation in other Member States, as a measure of the UK’s influence over policy in that
sector.
Agreeing to pool sovereignty is an ongoing commitment. The costs and benefits of a decision to pool
sovereignty in, say, 1973 or 1992 are unlikely to have their key effects in 1973 or 1992. It is plausible
(perhaps likely) that sovereignty costs and benefits go through phases. For example, there may be a phase
in which UK thinking in a specific policy area is especially influential, such that the benefits of influencing
others appear to outweigh the costs of potentially being over-ruled — when no-one wants to over-rule
you, the fact that they could do so may seem a small cost. The costs may only come later, in a period
where the UK’s influence is less.
We shall explore below how one might reason through to a judgement on this dynamic point in a specific
sector: Financial Services. The Financial Services sector is highly important in any economy, the free
movement of capital is one of the four freedoms of the Single Market, the Financial Services Action Plan
was arguably the single most important regulatory programme of the EU from 1998 to 2006, and the
Financial Services industry is a very significant industry to the UK in particular. These factors all serve to
make the Financial Services sector a very relevant case study. However, as always our goal in what follows
is to explore a method, which could in principle be applied to other sectors, rather than to draw a final
conclusion in respect of the specific sector explored. We do not claim that our findings for the Financial
Services sector (even in the provisional form they take here) can be generalised across the Single Market as
a whole. What we do claim is that the method of reasoning could be a helpful way to work towards a
judgement as to the policy costs and benefits of pooling sovereignty.
7.2 Sovereignty costs dimension 1: Over-rule and dissent
As noted, sovereignty costs are particularly challenging to measure. However it is natural to assume that if
EU processes entailed measures being imposed upon countries, those countries might vote against them —
either at the Council of Ministers or via a majority of a country’s representatives at the European
Parliament. If ministers agree to a measure passing and the majority of a countriy’s European
Parliamentarians votes in favour, it is unclear on what basis one could claim that that country had been
over-ruled. Hence one possible way to assess the sovereignty cost is to determine in how many decisions
that pertain the Single Market a Member State votes with the minority.
“Qualified Majority Voting” (QMV) is the name given to the (dominant) decision-making procedure within
the EU whereby measures are not passed simply by a majority of states voting in favour, nor even by a
weighted majority of states voting in favour (with the weights attached to different member states set by
the Treaty) but rather, that for a measure to pass it must have a weighted “super-majority” — so a
sufficient “blocking minority” can prevent passage of a measure.79
Amongst Eurosceptic groups, a common metric to use for sovereignty costs are the numbers of “lost
vetoes” i.e. areas to which QMV is applied, as can be seen in the following table:
79 e.g. Blocking minority percentages were: 35.3 per cent until 1973; 31 per cent from 1973-80; 30.2 per cent from
1981-5; 30.3 per cent from 1986-94; and 29.9 per cent from 1995-2004. See
http://www.parliament.uk/documents/commons/lib/research/rp2004/rp04-054.pdf footnote 1 p7. The fall in required
blocking minorities could be seen as a “negative sovereignty cost” to be offset against the loss of an increased number
of “vetoes” (i.e. an extension of the use of QMV) discussed below.

Policy Costs and Benefits
- 80 -
Table 7.1: "Lost vetoes" associated with various EU Treaties
European Treaty
Number of articles introduced on moved to QMV
Treaty of Rome (plus extensions) 38
Single European Act 12
Maastricht (Treaty on European Union) 30
Treaty of Amsterdam 24
Treaty of Nice 46
Lisbon Treaty 63 Source: http://www.brugesgroup.com/mediacentre/comment.live?article=4056
An arguably more fine-grained measure of sovereignty costs can be obtained by considering how often
QMV procedures result in the UK being over-ruled. In 1988, 14 per cent of the 320 legislative acts passed
through the Council of Ministers were subject to dissent by some country (i.e. minorities did not achieve a
blocking minority and measures were passed despite votes against); in 2008 the equivalent figure was 15
per cent of 200 legislative acts. Breaking down the actual votes by sector we have the following:
Table 7.2: Negative votes and abstentions by sector in 1988 and 2008
1988 2008
Agriculture 10 7
Fisheries 12 2
Single Market and industrial policy 6 7
Environment 1 2
Total number of acts in the above sectors 29 18
Total number of votes 34 30 Source: http://www.eng.notre-europe.eu/media/Etud88_EN-QualifiedMajority-Voting-Novak.pdf
We thus see a change in the balance of negative votes over time — whereas in 1988 dissent is heavily
concentrated in Agriculture and Fisheries matters (Fisheries dissent was particularly driven by Spain), by
2008 Single Market and Industrial Policy issues are just as important as Agriculture and Fisheries dissent has
become much less.
The next table considers the distribution of dissent amongst countries:
Table 7.3: Distribution by member states (in % of legislative acts dissented from)
1988 2008
Spain 3.75 1
Denmark 3.1 2
Greece 2.5 1.5
Ireland 1.9 1.5
UK 1.9 3.5
Italy 1.6 1
France 1.25 0.5

Policy Costs and Benefits
- 81 -
1988 2008
Portugal 0.9 1
Germany 0.9 2
Netherlands 0.6 1
Belgium 0 2
Luxembourg 0 1.5 Source: http://www.eng.notre-europe.eu/media/Etud88_EN-QualifiedMajority-Voting-Novak.pdf
We see that whereas in 1988 the UK was fairly close to the median in terms of dissent, by 2008 the UK
was much the most common dissenter — being over-ruled in QMV more than twice as often as any other
Member State.
Noting the perils of drawing too firm a conclusion from a comparison between just two years80, as it stands
these numbers suggest that not only do brute sovereignty costs rise as harmonisation measures are
extended (as is, in a sense, inevitable) but that over time the costs to the UK have increased faster than
those for other Member States.
We observe that it might be tempting to believe that the legitimacy of analysis above is threatened by a
changed context — e.g. that there have been several Treaties since 1988 or that some newer members
tended to dissent more early. But such a response misses the point that may be precisely the evolution of
the context and/or the tendency for states to conform to majority opinion over time that generates the
sovereignty costs here. What we are attempting to identify here is what costs there are, not why they
were regarded as appropriate to bear — the “why” should be dealt with in the analysis of benefits.
Box 6: Gold-plating of EU legislation
“Gold-plating” is the name commonly given to the practice of exceeding the requirements of EU legislation
when implementing directives into national laws. It could include: The imposition (or retention) of additional
requirements to those set out in a Directive by means of the implementing legislative measure in a
Member State.
A increase in scope, relative to the requirements of
the directive — e.g. the application of the measures incorporated into the Directive to a larger
universe of firms.
Where the Directive offers discretion to national
regulatory authorities or implementing legislature to impose greater or lesser degrees of regulatory
burden upon firms, choice of the former is sometimes regarded as gold-plating.
In the case of financial regulation, a study conducted by Europe Economics on the cost of compliance with
selected FSAP measures identified that some selected directives were indeed subject to gold-plating.81 The
study participants provided several examples:
- The Markets in Financial Instruments Directive: it was
suggested that the Danish and Italian competent authorities extended the trading transparency
obligations of MiFID to include bonds.
- Third Anti-Money Laundering Directive: It was cited
that the local interpretation of this Directive was more stringent than required in the Czech
Republic and United Kingdom.
80 The two years quoted are simply those for which we had data available from the study quoted. A fuller exercise
might perhaps focus upon results in a specific sector of interest and gather voting outcomes for that sector for a
number of years. As always throughout this report, we quote these results to illustrate a method and the sorts of
analysis one might produce within that method, rather than with a view to drawing final conclusions. 81 Europe Economics report for DG internal Market, “Study on the Cost of Compliance with Selected FSAP
Measures”, 2009

Policy Costs and Benefits
- 82 -
- Capital Requirements Directives: the UK
implementation of the CRDs was found to have made the requirements rather more complex than
the language used in the Directive.
Most of those highlighting examples of gold-plating consider it to be a source of cost (or at least missed
opportunity). However, gold-plating is not always seen as intrinsically a mistake — for example the original
form of a measure may be ineffective or imply lower level of enforcement or robustness of implementation
than is the regulatory norm for some countries (e.g. the UK) — but there is a concern that it could result
in an “unlevel playing field”. Pressure to achieve a level playing field by skimping on implementation or
enforcement could undermine regulatory and legislative traditions and culture, and thereby generate a
sovereignty cost.
The UK Department for Business Innovation & Skills has noted the UK government’s aim to reduce gold-
plating of European Regulations to reduce competitive disadvantages of EU law on UK businesses as
compared to their European competitors.82 In 2013, a Gold-Plating review conducted by BIS showed that
Government has been successful in minimising the gold-plating of EU legislation and little evidence has been
found on the additional burdens of the gold-plating on UK businesses between 2011 and 2012.83
7.3 Sovereignty costs dimension 2: Changing balance of your influence
over others versus their influence over you — Case study: The financial
services sector
To unpack what “influence” might mean and how one might used evidence to draw a reasoned judgement
on how much evidence the UK has over EU policy-making and how that has changed over time (and may
change in the future) we shall focus on the financial services sector, and in particular on the UK’s influence
over EU financial services regulation and the risk of over-rule on some fundamental issue of difference.
7.3.1 Influence in Financial Services Regulation
We shall now explore the senses in which, up to this point, there is a case to be made that EU-level setting
of financial services regulation has been beneficial to the UK. As stated, we shall focus upon the ways in
which EU financial services regulation has been liberalising in certain Member States in ways that mimicked
UK regulatory practice.
7.3.1.1 The Benefits of Influence As discussed in previous sections, the stated ambition of EU directives and regulation and judgements of EU
competition authorities and the European Court of Justice (hereafter frequently referred to as “EU-level
decisions”) has been, in general, “liberalisation” across most industries. More specifically, it has been to
strip away government subsidies, government-created monopoly power, and legal impediments to trade
and competition (both explicit and implicit).
It is, of course, strongly disputed how ideal or complete EU-level decisions are in delivering upon these
stated objectives. However, as a sweeping generalisation, one might observe that it is not uncommon for
EU directives and regulations, seen as increasing the level of regulation in the UK, to be regarded as
reducing it in many other Member States. This reflects the fact that for many Member States, participation
in the Single Market programme is a mechanism for delivering liberalisation that would not be chosen by
82 https://www.gov.uk/government/news/government-ends-goldplating-of-european-regulations 83 BIS, “Gold-Plating Review”, March 2013,
https://www.gov.uk/government/uploads/system/uploads/attachment_data/file/137696/bis-13-683-gold-plating-review-
the-operation-of-the-transposition-principles-in-the-governments-guiding-principles-for-eu-legislation.pdf

Policy Costs and Benefits
- 83 -
purely domestic political processes. But for the UK, there was a much longer-standing tradition of
liberalisation or a liberalised market environment, that was domestically-driven. So, Britain would very
often choose, for itself, at least as liberalised rules as those delivered at EU level. This is particularly true in
the Financial Services sector (as we shall see in more detail below).
The key gain for Britain, then, has never been conceived as that the EU would deliver liberalisation within
Britain that Britain could not deliver for itself. Rather, it has been that
by being involved, Britain would influence policy positively, so that it delivered more and better
liberalisation than would be delivered absent British ideas; where the final result distinguished between the treatment of different parties (e.g. between firms
within and outside the EU), by being involved in the decision, Britain would be more likely to be
on the more advantageous side of the line (e.g. by not being subject to tariff or non-tariff
barriers).
It can be argued that the ways in which, influenced significantly by British ideas, EU-level decisions are
liberalising for other countries has, in recent years (specifically, taking EU membership and the Single
Market Programme to 1992 as given), been much the most significant benefit to the UK of EU-level
decision-making. This is particularly evident in the financial services sector in respect of the Financial
Services Action Plan (FSAP) of 1998-2006, which sought to create / deepen the Single Market in Financial
Services.
7.3.1.2 The Financial Services Action Plan The potentials benefits of creating/completing a Single Market in Financial Services were explored by the
Lamfalussy group of “Wise Men”, who identified in particular the following84:
Improved allocation of capital — through more efficient, deeper and broader security markets
enabling savings to flow more efficiently to investment; lower transaction costs and improved
market liquidity; more diversified and innovative financial systems; and more opportunities to pool
risk. More efficient intermediation between savers and investors — through Intensified competition
among financial intermediaries across Europe, leading to fewer inefficiencies; giving users greater
freedom of choice; and the opportunity to reap economies of scale and scope across a larger
market.
Hence, a stronger faster-growing European economy.
The European Parliament’s ex-post evaluation of the FSAP85 identifies the following as the most material
FSAP measures:
For the Banking sector:
Directives relating to money laundering86;
The Capital Requirements Directive87;
For the Insurance sector:
The Insurance Mediation Directive88;
The Solvency I framework89;
84 See Creating a Single European Market for Financial Services - a discussion paper — City of London 85 The Impact of the New Financial Services Framework — IP/A/ECON/ST/2005-86, report prepared by Europe
Economics for the European Parliament, http://www.pedz.uni-mannheim.de/daten/edz-ma/ep/07/pe385.623_part_I-
en.pdf 86 …particularly 2001/97, the “second money laundering directive” 87 2006/48/EC and 2006/49/EC 88 2002/92 89 …particularly 2002/13 and 2002/83. The report also identifies the Solvency II framework, but this is part of the
FSWP, not the FSAP.

Policy Costs and Benefits
- 84 -
For the Securities sector:
The Markets in Financial Instruments Directive90;
The UCITS directives91;
The Prospectus Directive92;
For Financial Conglomerates:
The Financial Conglomerates Directive93.
A number of these directives were significantly influenced by British thinking — indeed, in many key
respects they sought to conform the regulation in other Member States to pre-existing British regulations
— and significantly liberalising for many Member States.
7.3.1.3 British influence: the example of MiFID A clear illustration of British influence upon directives in the Financial Services Action Plan can be seen in
arguably the single most important component of the FSAP: the Markets in Financial Instruments Directive
(MiFID). MiFID is a directive that sets out how Member States must regulate “investment services”. By
“investment services” we mean activities such as trading shares or bonds or commodity derivatives on
behalf of other people, or running a stock exchange where other people trade, or virtually any other
investment service apart from a small number of foreign exchange activities. The firms affected included94:
investment banks;
portfolio managers; stockbrokers and broker dealers; corporate finance firms;
many futures and options firms; and some commodities firms.
MiFID aimed to:
Increase harmonisation, in particular in order to limit the ability of Member States to set
regulation above the EU standard (under the directive that MiFD replaced — the Investment
Services Directive — states had been entitled to gold plate the EU regulations, and many did in
ways that the EU authorities regarded as protectionist);
Increase the ease (and reduce the cost) of trading across borders within the EU; Increase competition; Protect investors;
Increase efficiency; Increase transparency.
For our purposes here we do not need to analyze all of the voluminous detail of MiFID. Neither do we
need to come to a conclusion about how successful it was in its aims, or to adjudicate upon the fierce
debate there has been about how costly it has been to comply with. But what is of interest is to see (a)
how its form was heavily influenced by pre-MiFID UK regulation; and (b) that it was materially liberalising
for a number of other Member States.95
Two illustrations of the influence of UK thinking are the ways MiFID requires firms to categorise their
clients; and some of the forms of trading MiFID says must be permitted.
90 2004/39 91 2001/107 and 2001/108 92 2003/71 93 2002/87 94 See http://www.fsa.gov.uk/pages/About/What/International/mifid/background/index.shtml 95 Such a structural comparison of key regulatory measures is potentially relevant when considering the relative
influence of the UK and other Member States’ thinking in other sectors, also.

Policy Costs and Benefits
- 85 -
7.3.1.4 Categorisation MiFID requires firms to categorise clients into three groups:
“eligible counterparties” “professional clients”
“retail clients”
As one might expect, the level of consumer protection in the regulation increases as one goes down this
list — i.e. is greater for professional clients than eligible counterparties, and greater still for retail clients.
Before MiFID, UK regulation, set by the Financial Services Authority (FSA), had required firms to categorise
clients into three very similar groups:
“Market counterparties”
“Intermediate customers”
“Private customers”
The MiFID groups were not precisely the same as the pre-existing FSA categories (e.g. certain FSA “market
counterparties” counted as MiFID “professional clients”). But the choice of categories in the MiFID was
consciously made so as to closely reflect the pre-existing UK regulations, and to learn from them.
7.3.1.5 Permitted forms of trading Prior to MiFID, a number of countries (e.g. France, Italy, and Spain) had what were called “concentration
rules”. Concentration rules stated that if an ordinary investor ordered an investment firm to buy or sell
shares on her behalf, that order could only be “executed” (i.e. carried out) on a “regulated market” —
which in practice meant the main exchange. Put less technically, that meant that if you asked an investment
bank to buy shares for you, that bank was only permitted to buy them at the stock exchange.
Britain, by contrast, had for some time permitted certain firms to act as “systematic internalisers” (some
readers may be familiar with the concept of a “market maker”, which has some overlap with that of a
systematic internaliser). To make things concrete and simple, let us think of a systematic internaliser in
some shares. A systematic internaliser will have some clients that want to sell and other clients that want
to buy the same shares. Instead of executing the buy orders on the main stock exchange, and then the sell
orders on that same stock exchange, a systematic internaliser can simply match up those seeking to buy
with those seeking to sell. (So, instead of going “externally” — to the stock exchange — it “internally”
matches up between its own orders.)
MiFID required all countries to be like Britain, in permitting systematic internalising. This was a large
change — a significant liberalisation introduced by EU regulation — as, prior to MiFID, even in Member
States where systematic internalising was not specifically forbidden, it was effectively so by the complex
interplay of other regulations. And even in some Member States where there was some systematic
internalising (e.g. Germany), it was much less widespread than in the UK.96
MiFID was an extensive and complex piece of regulation, affecting many areas of investment business. The
above two areas are simply examples of the widespread ways in which MiFID was heavily influenced by, and
conceived itself as learning from, pre-existing British financial regulation.
7.3.1.6 Other ways in which the FSAP was liberalising for other Member States One of the key goals of the FSAP was increased liberalisation and competition. Where the FSAP has
enhanced competition, the single most important mechanism is that the FSAP increased openness to
foreign firms, which can lead to enhanced competition directly through an increase in the number of firms
in the market or via the threat of entry.
The main European Parliament evaluation of FSAP found that its impact on Italy was particularly significant,
leading to enhanced competition in banking, insurance, securities services and in relation to financial
conglomerates.
96 In Germany, internalisation was allowed, but investment firms were required to obtain explicit permission for
every order before internalising trades.

Policy Costs and Benefits
- 86 -
The FSAP was also found to have resulted in increased competitiveness in the banking sectors of Italy,
Poland and Spain.97 Italy also increased its competitiveness in insurance, securities services and in relation
to financial conglomerates.
FSAP (and Financial Services White Paper) directives and regulation, when implemented in full, were
predicted to lead to a significant lowering in the cost of equity capital for Italy.98 The key drivers of this
were seen as being reductions in transaction costs and reductions in servicing costs as liquidity increases.
Transaction costs in Italy were relatively high and liquidity low, compared, for example, with the UK. A fall
in the cost of equity was also expected to lead to an increase in the use of equity.
However, the largest impact of the FSAP was seen in New Member States, though it is difficult to
disentangle the impact of the FSAP from other impacts, including the Member States’ Accession to the
European Union.
Table 7.4: Illustrative Impacts of FSAP on Italy, Poland and Spain
Italy Poland Spain
Key liberalising
effects Increase in competition in
banking, insurance, securities
services and financial
conglomerates.
Increase in competitiveness in
banking, insurance, securities
services and financial
conglomerates
Increase in consumer
protection in banking and
insurance
Large fall in the cost of equity
capital
Increase in competition in
banking, insurance and
securities services
Increase in competitiveness in
banking
Increase in consumer
protection in banking and
securities services
Increase in competition in
banking
Increase in competitiveness in
banking
Source: European Parliament, The Impact of the New Financial Services Framework — IP/A/ECON/ST/2005-86
Indeed, perhaps partly reflecting UK influence via its influence upon EU institutions and thence down into
action in other Member States, the common caricature that the UK is materially more liberal than other
EU Member States is something of a UK myth. Considering the World Bank’s Ease of Doing Business
survey or WEF’s Global Competitiveness Report the UK comes across as actually rather run-of-the-mill in
its overall approach (i.e. not limited to just financial services): more liberal than a France (or Greece or
Italy), less so than Ireland, Netherlands and Finland. Germany, for example, is much more liberal in action
than is often thought.
7.3.2 Limited Risk of Over-Rule
As detailed above, one of the potential draw-backs of EU-level setting of regulation is the risk that Britain is
over-ruled in some fundamental aspect of financial services regulation with regards to which its concept of
the regulation differs from that of other EU Member States.
Through most of the period of Britain’s membership of the European Union and its forerunners, this risk
has been relatively limited. There have been three key classes of reason why:
97 The term “competitiveness” is used here in relation to the relative efficiency and attractiveness of the output of
domestic firms compared with foreign firms. 98 Europe Economics (2007), “The Impact of the New Financial Services Framework. A Report by Europe Economics
for the Internal Policies Directorate of the European Parliament”.

Policy Costs and Benefits
- 87 -
The thrust of EU regulation has been liberalising, pro-trade, and pro-competition. This has meant
that, although Britain might have preferred the details of certain regulations to be different, some
compromise provided the opportunity, overall and the considerable majority of the time, to extend
British concepts at the EU level.
EU policymakers at, in particular, the European Commission have been highly influenced by British
thinking and often (arguably typically) regarded British financial regulation as definitive of
international best practice and the British experience as a key source of evidence when formulating
policy.
It has long been understood that financial services, particularly at the wholesale level, were an
industry in which Britain had a particular specialism and was much the leading player in the EU, and
there was a general reluctance at EU level to over-rule a country that was especially dominant in
the industry concerned.
This last point, regarding the reluctance to over-rule, is worth dwelling upon, because it will be important
in our discussion later. Shortly after qualified majority voting (QMV i.e. the process of over-ruling national
vetoes by a weighted vote of all Member States) was introduced, President de Gaulle came to power in
France. He regarded qualified majority voting as an impingement upon the sovereignty of France, and there
was an extended “empty chair” crisis in 1965, when France refused to participate in European Council
proceedings. This led to the Luxembourg Compromise of 1966. According to the Luxembourg
Compromise:
"Where, in the case of decisions which may be taken by majority vote on a proposal of the
Commission, very important interests of one or more partners are at stake, the Members of the
Council will endeavour, within a reasonable time, to reach solutions which can be adopted by all
the Members of the Council while respecting their mutual interests and those of the Community".
The Luxembourg Compromise was never formally accepted by the European Commission or the European
Court of Justice, and was widely regarded as becoming largely obsolete with the Stuttgart Declaration of
1983, in which the French accepted the principle of widespread curtailing of national vetoes. However, the
French have occasionally subsequently invoked the Luxembourg Compromise to prevent themselves being
over-ruled in agriculture99, and the Compromise was in place for so long that it became part of the culture,
still informally curtailing or at least influencing the conduct of QMV. As the Member State with much the
largest presence in wholesale financial services, and very large involvement in other financial services
activities as well, the cultural echo of the Luxembourg Compromise has been a significant protection for
the UK up to this point.
We shall see in the next section that this has now changed. The implications for the efficacy of EU-level
setting of financial services regulations are potentially profound.
7.3.2.1 London as an Asset for the EU Another traditionally important reason why British financial regulation concepts were influential and there
was limited risk of Britain being over-ruled in anything fundamental with respect to financial sector
regulation was the understanding that the City of London, as a global player in the financial services sector,
was an asset to the European Union.
Before the financial crisis, in the mid-2000s, it was estimated that London provided 41 per cent of all City-
type financial services activity in the European Union, and had a dominant international market share in six
of eight major international financial product areas. If London’s financial cluster did not exist, advocates for
the City claimed that the cost of financial services in the EU would rise sixteen per cent and EU GDP
99 Indeed, the British government position is that the Compromise is still in place, and the possibility of the UK’s
applying the Luxembourg Compromise to financial services regulation was floated by Mark Hoban at the Treasury
Select Committee on 8 November 2011 (see http://uk.reuters.com/article/2011/11/08/uk-britain-financial-hoban-
idUKTRE7A74WO20111108).

Policy Costs and Benefits
- 88 -
would be €33bn lower in the short term, €23bn lower over the medium term, with the loss of 100,000
jobs.100
Of course, the benefits of the financial sector to the broader EU go far beyond the simple generation of
jobs and activity in the City.101 The financial services sector has a much broader contribution — to how
business investment is funded, including small local businesses; how pensions are paid for; how companies
manage to buffer themselves against bad times, to hedge against risks, and insure against disaster; how
broader access to financial services enables households to smooth consumption during periods of
unemployment or unexpected drops in income (e.g. short-hours working) or family surprises (illness,
divorce, babies) and hence to deliver greater overall macroeconomic stability (contrary to much recent
discussion); how interventions in distressed businesses can preserve value and restore long-term jobs; how
governments use international financial centres to borrow to service public spending in periods when tax
takes are temporarily depressed.
Such contributions are not simply within one Member State. Some Europeans gain returns on their
investments in the UK; others travel to the UK to work in the City. And the benefits of the business
activities carried out in the City are not accrued only by the UK. The activities of London’s financial centre
benefit car companies in Sweden, pharmaceuticals manufacturers in France, clothes manufacturers in Italy,
agribusinesses in Poland, and so on.
7.3.3 Remembering the Goal of this Discussion
The analysis above would not be sufficient, alone, to establish, that all EU-level financial regulation has been
to the UK’s benefit, or even that EU-level setting of financial regulation has, overall, been to the benefit of
the UK — to establish that we would need to consider the costs of complying with regulation, the trade
created, competition promoted, etc. so as to form an overall judgement. Our discussion here has focused
solely upon the policy influence question — the most one could conclude from our discussion, if it seemed
persuasive, would be that Britain had, in recent decades in respect of financial services regulation, gained
more from its policy influence on other countries than it had lost from risking being over-ruled and from
any losses of sovereignty.
An analysis of precisely why Britain was particularly influential in financial services regulation in this period
falls outside our scope here, but could be important in understanding the policy dynamic to be expected in
other sectors. For example, does the example of Financial Services suggest that the UK should expect to
be better at influencing in areas where we have a genuine national interest or comparative advantage
relative to other Member States, with the result that our regulation tends to be more up-to-the-minute in
responding to technological and business trends, and more detailed/based on more evidence (because of
the greater materiality to us of the issue)?
Though, as ever, our main goal is to explore a method rather than draw concrete final sectoral conclusions,
for our purposes here we shall regard our discussion as implying that the UK is likely to have gained more
than it lost, during the 1990s and 2000s, through the EU-level setting of Financial Services regulation.
However, that case rests on the specific key planks we have identified. We shall now float the thought that
these key planks have now reversed — that is to say, the key factors that would, up to now, be offered by
someone contending that EU-level setting of financial regulation has indeed been to the UK’s benefit can be
argued to be factors that, over the next decade, would suggest that, in terms of policy costs and benefits
(always remembering that in this section we are setting aside trade creation effects, the cost of compliance,
etc.) EU-level setting of financial regulation will not be to the benefit of the UK.
100 The City’s Importance to the EU Economy 2005, City of London & CEBR, February 2005. It falls outside our scope
here either to dispute or validate the figures in this report. We merely quote them for context. 101 See, for instance, The Value of Europe’s International Financial Centres to the EU Economy, Report prepared for the
City of London Corporation and TheCityUK by Europe Economics, July 2011,
http://217.154.230.218/NR/rdonlyres/583EB1BD-3CAE-4EAD-8BEA-
41B2CEC1EFD6/0/BC_RS_ValueofEUsFinancialCentres_FullReport.pdf
Policy Costs and Benefits
- 89 -
7.3.4 The Future Outlook for EU-Level Financial Services Regulation
In the previous section, we identified the key planks upon which rested an argument that EU-level setting of
financial regulation has, over the past couple of decades, been to the UK’s benefit (i.e. the policy influence
gains have outweighed other policy costs). In this section, we shall explore the risk that these very same
factors that, in the past, might have supported the case for the UK’s so benefitting, might over the next
decade suggest that the UK would not (in policy influence cost-benefit terms) benefit from EU-level setting
of financial regulation.
More specifically, we shall now argue that it is likely that in the future the case from what we argued above
were the two dominant potentially beneficial factors seems, as matters stand, likely to reverse, along with a
reversal in respect of the third effect. That is to say, in the future
it, at present, seems more likely that the EU will be a de-liberalising force in the financial services
sector, that British influence will be negligible in preventing this, and that, if anything, European
thinking will be more likely to influence the British debate in a de-liberalising direction; and
the consequence of EU-level setting of regulation (which, because EU, may be more de-liberalising
than might be sustainable in the presence of regulatory arbitrage and regulatory competition),
seems likely to be slower growth (or greater contraction) in EU member states than would
otherwise be the case; and absent EU-level setting of regulation, Britain would be more likely to be a beneficiary of regulatory
arbitrage than a loser, as business would be more likely to be attracted to Britain as regulation
introduced elsewhere was regarded by some firms and investors as inappropriate and/or excessive.
7.3.5 Change in Spirit and Thrust of Regulation
The Financial Crisis of 2007 onwards, and in particular the collapses in the banking sector of late 2008 and
early 2009 led to a sea-change in attitudes to financial sector regulation across Europe and the United
States. This has partly been reflected in certain specific regulatory changes in the banking sector —
changes already announced and a number of changes yet to come. But more fundamentally it has driven a
significant change in the thrust of financial services regulation at EU level. Whereas we have argued in
previous sections that during the 1990s and 2000s the key thrust of EU-level regulation, on average across
the EU (if not always in the specific case of the UK), has been liberalisation and the encouragement /
facilitation of cross-border trade within the EU, the key driving force now has become the extension of the
net of regulation, increasing restriction on financial services regulation, limiting the activities of financial
sector firms, and empowering greater national control over the activities of the financial sector.
There are, of course, very good reasons for this change in motive force. We do not need, for our
purposes here, to rule either in favour of or against all the specific measures currently being enacted or
planned at EU level. But we do offer the following points for debate:
The balance of EU regulatory plans has shifted from liberalising and promoting cross-border trade
to extending the scope, depth, and national bite of regulation.
Whereas in the 1990s and 2000s, EU-level policymakers were eager to learn from and emulate
British financial regulators and regulation, Britain has become much less unambiguously influential
upon the shape, objectives and detail of EU-level financial regulation.
Whereas in the 1990s and 2000s, EU politicians would have felt constrained, by the culture and
norms created by the Luxembourg Compromise, from imposing financial regulation upon the UK
that the UK strongly resisted, that has now ceased to be the case. A recent example of this was
the EU bonus cap, from which the UK dissented.
A number of initiatives in EU-level financial sector regulation are directed at and relevant to specific
issues of the Eurozone, rather than the EU as a whole.
Policy Costs and Benefits
- 90 -
EU-level financial regulation impinges upon and in some cases appears may impede some of the
British new regulatory initiatives in response to the financial crisis (in other words, even where
Britain is increasing its financial sector regulation, it is not always able to do so in its chosen way).102
The scale of financial sector trade within the EU is likely to decrease or grow much more slowly
than non-EU financial sector trade over the next decade.
7.3.6 EU-Level Regulation as a Check / Balance upon Regulatory Over-Reaction to the
Financial Crisis
Under the pressure of the financial crisis, particularly in late 2008 and early 2009, many widespread
principles of regulation were overthrown. Procedures for mergers were set aside in the urgency of events
(e.g. in the case of Lloyds TSB and HBOS). Rules limiting state support to particular companies (regarded
as anti-competitive and protectionist) were set aside.
At the national level, such principles were simply blown away by events. But in many of these areas the
ultimate authority lay with European Union institutions. It is not as widely appreciated as perhaps it
deserves to be that the European Union rules were left much more intact than were national frameworks.
This partly reflects the fact that the EU rules were embedded in Treaties, and so not straightforward to
sweep away in one heated and hasty Parliamentary vote. Partly it reflects their international nature. And
partly it reflects the fact that the European Union Single Market rules are intrinsically insulated from the
day-to-day pressures of public opinion — they exist precisely to deliver liberalisation, competition, and the
removal of barriers to trade between countries that either would not, for most Member States of the EU,
be passed by Member State democratic institutions if left to themselves, and to resist the erection of
barriers to trade and competition, and state aids, that might naturally arise as politicians respond to day-to-
demands that “something must be done” and then, once in place, are only slow removed (if at all).
The European institutions, therefore, to some extent ensconced in their ivory tower and deliberately
insulated from day-to-day political pressures, could not and did not abandon the principles laid out in the
EU Treaties. By and large they did not seek to obstruct the neglect of merger procedures or the
institution of anti-competitive state aids. Instead, they issued memoranda of forbearance, and entered into
agreements with Member States about the timescales over which state aids would be unwound and more
competition would once again be introduced. One example of this that has emerged during the writing of
this report was the requirement for the British government to divest itself of much of Northern Rock by
2013. Other examples include the divestments required by EU competition authorities of RBS and Lloyds.
Thus, although we are about to argue that EU-level regulation will, over the next few years, be a source of
de-liberalisation and reduced trade in the financial sector, this should be understood as a delicate
judgement. The underlying deep structure of the Single Market is still present in the Treaties and in the
institutional set-up, and this deep structure has been a pro-competitive pro-liberalising force in respect of
the UK as well as elsewhere — that is to say, it has forced the UK to be more liberal and pro-competition,
in certain respects, than the UK might have found it easy to choose to be for itself. It is thus not enough
(and would not be enough in other sectors than financial services, either), to conclude that the EU is de-
liberalising, to show that EU-level policy-setting will imply the introduction of de-liberalising regulation.
One would also have to show that the de-liberalising regulation introduced would be more de-liberalising
than the regulatory changes the UK would be likely to choose for itself, and that this more-than-offsets the
liberalising character of the Treaty-embedded principles that have forced, and will probably continue to
force, the UK government to be more liberal, more competitive, and more pro-trade, in certain respects,
than it might find easy to choose for itself.
102 It is important to recognise, as we shall set out in more detail below, that some of these EU-level changes are
globally-driven. It is, of course, a matter of potential dispute to what extent the UK would accept globally-driven
changes tout court, were it not for their being introduced at EU level.
Policy Costs and Benefits
- 91 -
7.3.7 Extension to the Scope and Depth of Regulation
The financial sector is currently experiencing an unprecedented wave of new regulation, and regulatory and
tax changes. These include:
(a) Measures that had only recently been implemented prior to the crisis, and had probably not yet been fully
absorbed into behaviour, prices, demand or market structure, are already being revised in light of these
events. These include the Capital Requirements Directives (implementing Basel II and now Basel III) and the
Markets in Financial Instruments Directive.
(b) Measures that had been planned before the crisis but scheduled for introduction shortly afterwards. These
include the Solvency II Directive and the Clearing and Settlement framework.
(c) Measures introduced at least partly in response to the banking crisis which affect the broader financial
sector rather than the banks themselves. This includes in particular the Alternative Investment Fund
Managers Directive, the proposed Financial Transactions Tax, and the EU bonus cap.
(d) Measures introduced, proposed or debated in response to the crisis affecting mainly the banking sector.
These include measures requiring or effecting:
new arrangements for cross-border supervision and crisis management
changes to capital and liquidity requirements even under existing regulatory structures and
new measures such as changes to trading book capital requirements
new special administration regimes or other resolution mechanisms
new mechanisms for the treatment of bondholders in the event of administration (e.g. “bailins”
— debt-equity swaps)
the restriction or separation of activities (e.g. as per the retail / investment banking separation
/ ringfencing discussed by the Vickers Commission, with proposals now to consider such
separation at EU level, also)
restrictions on remuneration or dividend policy
caps on size, connectedness, concentration or complexity
accounting changes
taxes or stability fees
macroprudential oversight
(e) Measures introduced at Member State level, in response to particular crisis, such as restrictions on the
short selling of bank equities or on sovereign credit default swaps.
The central issue for our discussion here is not whether any or all of these measures are justified and
appropriate regulatory improvements. It is that they are clearly not liberalising deregulatory trade- and
competition-promoting measures. Their central goal is to restrict and control the activities of the financial
sector.
It is also the case that a significant tendency has arisen for different Member States to enact their own new
measures of financial regulation. Obvious examples of this are the various country-specific bans on the
short selling of banking stocks or various trades in sovereign CDS. There have also been country-specific
moves in areas such as the treatment of banking sector bonds (e.g. Denmark has taken a different approach
on this question from, say, Belgium, which has in turn treated such bonds differently from Ireland).
Furthermore, the crisis has inspired the creation of a number of new EU institutions, such as ESMA, EBA
and EIOPA. We note that the UK has objected to the granting to ESMA of broad-based powers (proposed

Policy Costs and Benefits
- 92 -
on credit rating agencies, defining appropriate technical standards on equity and non-equity trading, and on
product bans).103
Without, at this stage, committing either way on the efficacy of these measures104, we aim to highlight that
— in deep contrast to the general liberalising thrust of financial services regulation in the 1990s and 2000s
— the thrust of financial services sector regulation at present is quite the reverse. And this is, at the time
of writing, expected to remain the case for much of the next decade.
It is, however, worth observing that at least some important components of this rise in regulation originate
from global institutions, rather than the EU. Examples include
the revisions to the capital requirements directives (which reflect — though amplify upon — the
Basel III global rules);
revisions to MiFID (which have been heavily influenced by G20 initiatives in derivatives trading and
transaction reporting).
7.3.8 Reduced Future Influence of the UK
In previous sections we have emphasized how influential United Kingdom regulatory models were upon
EU-level financial services regulation in the 1990s and 2000s. There has now been a significant change in
this area. There are three key aspects to this:
Partly this reflects a reaction to the financial crisis, and its widespread characterisation (perhaps
arguably caricature?) on the Continent as having been the consequence of an “Anglo-saxon” light
touch, low supervision deregulatory approach to the financial services sector.
Partly it is a consequence of a change in the balance of initiative in European Union institutional
policy-setting, with the European Parliament gaining codecision-making powers.
Partly, this reflects the fact that certain forms of financial regulatory change have been developed in
response to Eurozone-specific issues, to which British concerns are regarded as peripheral at best.
7.3.8.1 Changed spirit of regulation Of course, UK regulation has also, to some extent, shifted away from the “light-touch” aspiration.105 There
is a wider re-evaluation of the approach to regulation within the UK. However, it is by no means clear that
the new paradigm emerging within the UK matches that emerging at EU level.
Within the UK, two of the key foci concern the nature of supervision (and its institutional expression) and
the structure of firms. An illustration of the supervision point is the switch away from FSA prudential
supervisory powers to prudential regulation becoming a Bank of England competence. This is neither, per
se, a matter of increased nor of resistance to increasing regulation. The Bank of England has argued,
indeed, that supervisory relationship is likely to make it more feasible to enforce regulatory change than
would be more detailed regulation106:
103 However, it should also be observed that, as at the time of writing, it remains uncertain what direction ESMA, etc
will take. It is not impossible that in due course these may be as keen to learn from UK ways as the European
Commission was before. 104 It could, for example, be argued that it would be wrong-headed to argue that the previous “light touch” UK
approach to regulation was ideal, and that the UK had a bias to under-regulating financial services, especially on the
wholesale side. Some commentators have even argued that the financial services sector is intrinsically likely to be
successful in “regulatory capture” of individual countries in which the sector is located. Perhaps it could even be
argued that EU institutions might be less susceptible of such regulatory capture, and so intrinsically better-placed to
regulate for all? 105 Whether it was ever truly light-touch in practice is a disputed point, which it falls outside the scope of this study to
assess. 106 See, for example, Mervyn King’s evidence to the Parliamentary Joint Committee on the Draft Financial Services
Bilol, 3 November 2011:
I give two examples of where we think it will be important for regulators to exercise judgment and why we need to make a
break from the style of regulation we have seen in the past. One is that I would like [Bank of England supervisors] to be
able to say to a bank—this is a hypothetical example but is clearly relevant to what happened before the crisis—“Your
Policy Costs and Benefits
- 93 -
This is not merely a changed style of supervision. It is a changed concept of regulation. But at EU level,
though the possibility of the ECB taking some supervisory responsibility for banks has been floated, there is
nothing on the table remotely of the nature of the change that is taking place in the UK.
Another central element of UK regulatory change has been proposals for changing the structure of the
industry. The most visible example of this has been the Vickers commission consideration of splitting or
subsidiarising retail from investment banking activities. As matters stand, it appears that, far from EU-level
regulation following British regulation in this area, it might even be a blockage to certain of the Vickers
proposals (in particular, the giving of bite to the ringfencing proposals by associating them with differences
in capital requirements).107
The approach at EU level and in many other Member States has reflected the concept that there was in the
past, simply too much freedom, perhaps even laxness with respect to the activities of financial sector firms.
Whereas in the UK the concept has been to try to re-empower market forces (through changes in
structure) and re-empower supervisors (through relational supervisory oversight, rather than rules-based
regulation), at EU level much of the concept has been fairly straightforwardly to write more rules. This is
not altogether true — we have mentioned above the continuation of EU competition, state aid and merger
rules, and it is also worth noting that the Vickers proposals in areas such as making bank debt “bail-in-able”
(i.e. empowering banking administrators to convert bank debt into equity) were first proposed by the
European Commission. But it does not, overall, mis-characterise the new spirit of EU regulation to say that
it is consciously and explicitly more sceptical of markets and actively seeks to curtail their activities.
Now we are clearly in a time of flux, and the possibility cannot yet altogether be ruled out that in due
course EU and UK concepts in financial regulation might converge. But at present the UK’s thought
leadership in this area is much less clear than was the case in the past.
leverage has gone up from 20 to one to 40 to one in the past four or five years. You have not broken any rules.
Nevertheless, this is a highly risky set of activities to undertake, and we want you to reduce your leverage.” The only way
that regulation can have an effect is if the regulators have the freedom to impose their judgment and not base it purely on a
myriad of detailed rules.
Another example would be to say to a bank, “The structure of your bank is so complex and opaque, with so many offshore
and onshore legal entities, that we don’t understand the risks you are taking. We are not entirely confident that you do
either, but certainly outside investments cannot assess it. We think that degree of opacity is inconsistent with a sensible and
stable contribution to financial stability.” These institutions are operating not only for themselves; they are big enough to
affect the economy of the whole country. Therefore, the regulator has to be free to make a judgment about that degree of
opacity, even though nothing is done that could be said to violate a specific detailed rule. That degree of judgment is vital.
http://www.parliament.uk/documents/joint-committees/Draft-Financial-Services-Bill/Ucjcdfsb031111ev11.pdf 107 During his evidence to the Parliamentary Joint Committee on the Draft Financial Services Bill, Mervyn King
discussed this point with David Mowat MP:
Q769 David Mowat: My final question is about the Capital Requirements Directive and the way we co-ordinate with Europe
on that. At one time it looked as though it might make it difficult for us to impose higher capital requirements on our
institutions than the Europeans would find acceptable.
Sir Mervyn King: It is still a problem. The Commission’s current proposals still want to impose maximum harmonisation. I am
completely baffled as to why they want to do it. I can think of no logical or economic reason why you would want to have
maximum harmonisation, other than a theology of convergence for the sake of it. But the whole spirit of the agreement
under Basel I, II and III was to have a level playing field in terms of common minimum requirements. No one could conceive
of any reason why you would object to a country wanting to impose higher requirements, for example to protect their
taxpayers. At the European Systemic Risk Board the vast majority of the people round the table were equally baffled as to
why there was a case for maximum harmonisation, and I believe that an increasing number of governments in Europe will
come to the same view. This is a problem.
The Commission takes the view that some of the things we want to achieve by implementation of the proposals of the
Vickers Commission, or macro-prudential regulation through the Financial Policy Committee of the Bank, could be done
through what is known as pillar 2 of the capital requirement. Again, that seems rather bizarre to us, because it is clear from
the legal basis of pillar 2 that this is for individual institutions, but clearly that is not macro-prudential. Macro-prudential is
something that applies to all banks, and that is naturally pillar 1. I cannot see any reason why anyone should object to a
country using pillar 1 to have higher capital requirements. I absolutely agree there need to be common minimum capital
requirements, and it is good that Europe is now taking this through the European Parliament to get European legislation. We
are ahead of other countries in this respect, but I am completely baffled as to why they see any need or reason for having
maximum harmonisation.

Policy Costs and Benefits
- 94 -
7.3.8.2 Changed institutional balance Another, non-trivial development has been a change in the relative powers of institutions within EU-level
decision-making. Traditionally, the European Commission was especially sympathetic to UK thinking across
a range of economic policy areas, but especially in the financial services sector, whilst the European
Parliament was much less sympathetic to UK orthodoxy.
In recent years, and especially with the Treaty of Nice, the power of the European Parliament has been
enhanced. One example is the development of the “codecision procedure” whereby the European
Parliament now has equal power with the Council, in its ability to amend and reject legislation.108 Another
is that, under provisions of the Treaty of Maastricht enhanced by the Lisbon Treaty, the European
Parliament now has a right of legislative initiative that allows it to ask the Commission to submit a
proposal.109
This enhanced role for the European Parliament has increased its influence over what legislation comes
forward, also. An example is the Alternative Investment Fund Managers Directive (the AIFM Directive).
This was a measure that the European Parliament repeatedly urged should be investigated from the mid-
2000s onwards (with the European Commission repeatedly refusing), but was only finally introduced in
2009, partly as a reflection of the financial crisis but also, and crucially, as a reflection of the increased
institutional role of the Parliament.
7.3.8.3 Increased relevance of needs of Eurozone Some financial sector measures recently introduced or considered have reflected particular issues in the
Eurozone. Two examples of this are restrictions on trading in sovereign CDS and proposals for a Financial
Transactions Tax. Neither of these was a measure likely to be proposed within the UK. Each reflected
particular issues in the Eurozone — in the case of sovereign CDS issues relating to concerns about
whether assessments of sovereign creditworthiness reflected genuine analysis or were merely the result of
manipulative speculation; in the case of the Financial Transactions Tax reflecting the need to obtain a
revenue stream to fund future increased fiscal transfers within the Eurozone.
If Eurozone members seek to introduce regulation of particular relevance to the Eurozone, such measures
are unlikely to be significantly influenced by British ideas.
The needs of the Eurozone are becoming increasingly significant within the needs of the EU as a whole.
The euro began in 1999 with eleven of the 15 Members of the EU; by 2004 12 of the 25 Members of the
EU were members of the Eurozone. At present there are 17 members of the Eurozone out of 27 EU
members with a further 8 EU members committed to joining the euro in due course. Thus whereas in the
late 1990s and early 2000s (whilst the Financial Services Action Plan, upon which the UK was so influential,
was being enacted) the Eurozone consisted of only a minority of those states that were EU members or
about to become so, the Eurozone now comprises the vast majority of the EU and is scheduled to
comprise almost all members of the EU, and the distinction between the “needs of the Eurozone” and the
“needs of the EU” is much less clear.
Given the stated intention of the EU to form itself into an “EU Federation”110, along with various other
measures to deepen fiscal and political union between Eurozone members in response to the Eurozone
sovereign debt crisis, it seems plausible that the central goals of the Eurozone may become relatively more
weighted towards the promoting and securing of political integration, and less towards the promotion of
trade, over the next decade. This means both that within the EU the Eurozone will carry a very high voting
weight, and that the objectives of Eurozone members (being increasingly political, rather than trade-
oriented, relative to the UK) may become increasingly ill-aligned with UK policy goals.111
108 Previously, a measure proposed by the European Commission and supported unanimously by the Council could
not be stopped by the European Parliament. 109 http://www.europarl.europa.eu/parliament/expert/staticDisplay.do?id=55&pageRank=13&language=EN 110 See President of the European Commission José Manuel Barroso’s State of the Union 2012 Address to the Plenary
session of the European Parliament/Strasbourg 12 September 2012 — http://europa.eu/rapid/press-release_SPEECH-
12-596_en.htm 111 We observe that the concern that, outwith the euro, UK policy influence within the EU would decline was one of
the main arguments put forward by those advocating UK membership of the euro. The analysis in this subsection can

Policy Costs and Benefits
- 95 -
7.3.9 Will the Key Future Threats of Regulatory Arbitrage come from within the EU,
or without?
As discussed above, a key motivation for regulatory harmonisation within the EU is the threat that, absent
regulation providing a floor, there would be the risk of regulatory arbitrage between EU members. Perhaps
some New Member State — say from Eastern Europe — might tempt business away from, say, London to
some other centre within the EU, still able to passport and trade within the EU, but subject to lower
regulation.
The relevance of this analysis over the next decade or so could be challenged ( ) and defended ( ) on a
number of grounds:
Is the most important threat to London, coming from regulatory arbitrage, really from other EU
Member States? Or, as a global player in financial services, should it be more concerned about
international regulatory competition, from jurisdictions such as Hong Kong, Dubai, or
Johannesburg?
Of course, this way of framing the question assumes that London’s role as a global player can be divorced
from its position within the EU. In the past, it could perhaps be contended that London was able to
exercise a global role partly on the back of leveraging scale benefits it secures from its EU markets. But
even if correct in the past, whether that would remain the case if EU financial services sector declines over
the next decade is less clear. When the EU was a force for liberalisation, the EU itself was a device of international regulatory
competition, providing pressure to drive down regulation for the EU as a whole. But if the EU is
now (rightly or wrongly) to be driven by an ethos of increased regulation of financial services, does
that make London (if subject to such increased EU-level regulation) more vulnerable to
international regulatory competition from outside the EU?
Against this, it could be argued that the EU might, as a large and cohesive international player, be
able to export its ideas internationally outside the EU (or even EEA). A new jurisdiction adopting
such a common rulebook would open up an additional revenue stream for City-based firms to
exploit as they would have ready-made knowhow and scale compared to local firms adjusting to
the new situation.
Additionally, it should be observed that international coordination of regulation has downsides as well as
upsides. When market participants become dependent upon regulators for assessing the robustness of
institutions (once regulatory badging is widespread), then regulatory failure coordinates market failure —
the regulator fails for the whole market at once. And if regulation is coordinated internationally, that can
mean that market failure is coordinated internationally, also. Was it a coincidence that the peak of
international coordination of banking regulation, with the introduction of the Basel II banking rules,
coincided with the most internationally-coordinated banking crisis ever? Of course, regulatory badging and
international coordination have upsides as well as these drawbacks, but the current environment of great
uncertainty regarding the best way to proceed on financial regulation suggests there could be an unusually
high value to regulatory competition — to different countries trying their own different paths in this new
financial regulation world, learning from the successes or failures of others, and in due course adapting to
the new best practice.
7.3.10 Caveats
In this section we have explored the risk that the very same factors that might have meant the UK
benefitted from EU-level setting of financial regulation in the past, might, over the next decade, mean that
the UK suffers from EU-level setting of such regulation.
be seen as reflecting (perhaps vindicating?) this traditional pro-euro-membership concern regarding the drawbacks of
non-membership of the euro. Of course, UK membership of the euro might have had its own alternative drawbacks,
but those fall outside our scope here.

Policy Costs and Benefits
- 96 -
It is an inevitable feature of the future-focused nature of our discussion here that we can only identify risks
— we cannot come to a robust definitive conclusion about them. It is not impossible that, in fact, a
consensus arises quickly as to the best form of the new phase of financial regulation, and that that
consensus closely reflects British views. It also cannot be ruled out altogether that the Eurozone resolves
its current difficulties fairly smoothly and the focus of EU regulation returns to EU-wide needs rather than
those of the Eurozone and of particular Member States within the Eurozone. It also cannot be ruled out
altogether that, having resolved these current challenges, the EU moves into a phase of rapid further
integration and growth — whilst at the same time opportunities outside the EU turn out to have been
exaggerated and risks under-estimated (as has happened often in the past). An element of judgement is
inevitably required in interpreting the discussion of risks here.
That notwithstanding, we do not regard our discussion as idle speculation. We have offered reasons to
believe that the risks we identify are material, and that although there is of course great uncertainty about
the future at the time of writing, the scenarios we paint are sufficiently plausible to carry important weight
in policy considerations.
We emphasize again, however, that this report is an input to a synoptic review, rather than a sector study
of financial services regulation in particular, and a more detailed study focused upon that sector might,
identifying better data and other considerations we have not brought into the analysis here, come to a
different conclusion.
Thus, though we stand squarely behind the analysis and conclusions here, our main purpose has been to set
out how one might reason through such an issue, the sorts of criteria upon which one might base a
conclusion, and to be transparent in drawing our own provisional conclusion in this case. A reader that is
convinced by this analysis might perhaps conclude that the net benefits of policy influence, sovereignty
costs, etc. takes a shape rather like panel Db in Figure 3.3 — i.e. that in terms of policy influence,
sovereignty costs and the like, the phase of total harmonisation in financial services regulation, relative to
the Single Market, is liable to entail a significant fall-away in net benefits to the UK, with those benefits
perhaps even becoming negative. Other readers are invited to draw their own alternative conclusions.
This case study has focused upon financial services regulation. The method could be applied to other
sectors.

Conclusions
- 97 -
8 Conclusions
This report has considered the following questions:
What is the Single Market and what are its goals?
The Single Market can be regarded as a trading relationship, extending the European customs union
to encompass the stripping away of non-tariff barriers and free movement in capital and labour as
well as goods and services, and that has been the main basis of our analysis here. However, the
promotion of trade is not the only (or even, arguably, the main) goal of the Single Market — from
the beginning its architects have openly identified other goals for the project such as the deepening of
political and social linkages between the peoples and regions of Europe.
What are the tools by which integration in the Single Market is promoted?
Key tools include
the stripping away of internal tariffs and the imposing of a common external tariff
Treaty commitments by governments to the principles of free movement of goods, services,
capital and labour, to the liberalisation of markets, and to common principles of competition
and the addressing of externalities
mutual recognition of the regulatory and other requirements of other Member States
harmonisation of regulatory and other requirements across the EU
the spreading of best practice
common frameworks for economic regulation (e.g. of utilities)
How should we understand the question of whether integration within the Single Market is
optimal?
Membership and development of the Single Market entails a number of trade-offs. Benefits include
gains from trade, gains from efficiency from economies of scale and scope, gains to innovation, policy
synergies where policies spill over borders, and the opportunity to improve policy-setting in other
countries. Losses include trade diversion, sovereignty/democracy costs, subsidiarity costs, and
process costs (including the cost of complying with regulation).
How should one measure the degree of integration within Europe?
We have argued that the “inputs” to integration — policy measures designed to enhance integration
— should, if integration is genuinely delivered, produce fruits in the form of “outputs” —
convergence in prices and costs and productivity of the factors of production across the EU.
In which sectors has integration proceeded least?
We found that the worst four sectoral performances, in terms of EU15 convergence relative to
global convergence, are manufacturing, wholesale/retail trade, construction and transport.
How can the concrete benefits of integration be measured in particular sectors?
Using a combination of general reflections upon data, econometrics, and analytical judgement, we
have illustrated how one might explore the relationship between integration in the Single Market and
trade, competition, efficiency and innovation for the pharmaceuticals, financial services, motor
vehicles and energy sectors. In general we believe one should be optimistic regarding the scope for
drawing fairly objective quantitative results in respect of these benefits in respect of trade,
Conclusions
- 98 -
competition and efficiency. In respect of innovation, we believe some quantification is worth
attempting but the likelihood of producing robust and definitive results is limited.
How can the concrete costs of integration be measured in particular sectors?
We have explored trade diversion and process costs, including the costs of regulation. Regulatory
costs can be measured quite concretely, but there is an inevitable element of judgement involved in
determining how much additional regulatory costs the EU creates that would not have been incurred
anyway through national regulatory interventions. We also note that the ways regulatory costs are
typically analysed in regulatory impact assessments is not precisely suited to our purpose here, in
that many EU regulations are intended to be deregulatory or liberalising — the very essence of the
stripping away of non-tariff barriers is that doing so should have the net effect of reducing regulatory
costs, not increasing them. Trade diversion can be measured, just as can trade creation. Rather than
repeating the methods explored earlier, our trade diversion analysis approaches the question from a
different angle, considering how international trends in competitiveness and in the balance of global
versus EU trade mean that the significant rise in non-EU versus EU competitiveness in recent year
(and projected for the next decade, also) is a potential and material threat to the efficacy of the
Single Market, since it implies a large rise in trade diversion costs. That means the current EU
policymaker concern for EU competitiveness is particularly well-founded.
How can policy costs and benefits be assessed according to some objective or transparent
standard?
We consider policy costs and benefits to be potentially as large as or even larger than the concrete
costs and benefits of the Single Market, bearing in mind especially the point that the key goals of the
Single Market project may be political (and hence directly related to policy influence) as much as
trade-oriented. We explore how measures of dissent, such as occasions the UK has been outvoted
via QMV, might supplement more widely-used coarser-grained measures of policy costs, such as the
number of “lost vetoes”. In respect of particular sectors, we suggest that detailed reflection upon
the dynamic of policy-making can reveal the UK’s influence or lack thereof and how this changes
through time. We explore the specific case of the Financial Services Sector, showing how the UK’s
past influence can be seen through detailed consideration of the structural similarities between key
EU and UK financial regulations and the differences between these and previous regulation in other
Member States. We also argue that once one understands the factors that drove high UK influence
over financial services regulation in the past, it seems likely (in our judgement — others are invited
to draw their own conclusions) that the UK’s policy influence, at EU level, in this area has recently
declined markedly and should be expected to be weak over the next decade — implying that we are
in a phase of relatively high policy costs, especially in terms of the risk of being over-ruled, in respect
of that sector.
The key lessons of this analysis are thus methodological and synoptic — establishing an overall framework
of analysis for the Single Market and showing how it can be applied in other sectors.