EUROnu and NF-IDS Target Meeting, CERN, 22-25 March 2008 Progress on Solid Target Studies J. R. J....
25
EUROnu and NF-IDS Target Meeting, CERN, 22-25 March 2008 Progress on Solid Target Studies J. R. J. Bennett 1 , G. Skoro 2 , J. Back 3 , S. Brooks 1 , R. Brownsword 1 , C. J. Densham 1 , T. R. Davenne 1 , R. Edgecock 1 , S. Gray 1 , P. Loveridge 1 and A. J. McFarland 1 1 Rutherford Appleton Laboratory, Chilton, Didcot, Oxon. OX11 0QX, UK 2 Department of Physics and Astronomy, University of Sheffield, Sheffield. S3 7RH, UK 3 Department of Physics, University of Warwick, Coventry. CV4 7AL, UK
-
date post
21-Dec-2015 -
Category
Documents
-
view
217 -
download
0
Transcript of EUROnu and NF-IDS Target Meeting, CERN, 22-25 March 2008 Progress on Solid Target Studies J. R. J....

EUROnu and NF-IDS Target Meeting, CERN, 22-25 March 2008
Progress on Solid Target Studies
J. R. J. Bennett1, G. Skoro2, J. Back3, S. Brooks1, R. Brownsword1,C. J. Densham1, T. R. Davenne1, R. Edgecock1, S. Gray1, P. Loveridge1
and A. J. McFarland1
1 Rutherford Appleton Laboratory, Chilton, Didcot, Oxon. OX11 0QX, UK2 Department of Physics and Astronomy, University of Sheffield, Sheffield. S3 7RH, UK3 Department of Physics, University of Warwick, Coventry. CV4 7AL, UK

Outline
1. Reminder of the Solid Target Design and Studies.2. Target lifetime.3. Measuring thermal shock with the VISAR*.4. Measuring thermal shock with a Vibrometer.
*Velocity Interferometer System for Any Reflector

Solid Target Studies1. The original idea was to have a tantalum toroid rotate
through the beam and threading the pion collection/focussing solenoid. The toroid operated at ~1600 K and radiated the heat to the surrounding water cooled walls.
2. The main problem was considered to be thermal shock generated by the ~2 ns long proton pulses (10 GeV, 50 Hz, 4 MW beam, dissipating ~700 kW in the target).
Thermal Shock Studies: Lifetime Test. A high current pulse was passed through a 0.5 mm
diameter tantalum wire, simulating the stress expected in a full size target. The number of pulses was counted before failure of the wire. Tantalum quickly proved to be too weak and was replaced by tungsten . Great care was needed to align the wire in the support structure to minimise the very large Lorenz magnetic forces. Most failures were probably due to this and to the wire sticking in the sliding free-end support /electrical connection.
It soon became evident in the wire shock tests that thermal shock was not the problem. The wire was not failing from a single or a few shock pulses, but could survive tens of millions of pulses. The problem is not thermal shock but fatigue and creep. Fatigue and creep are not amenable to analysis. It is not possible to predict the number of cycles to failure with any accuracy.

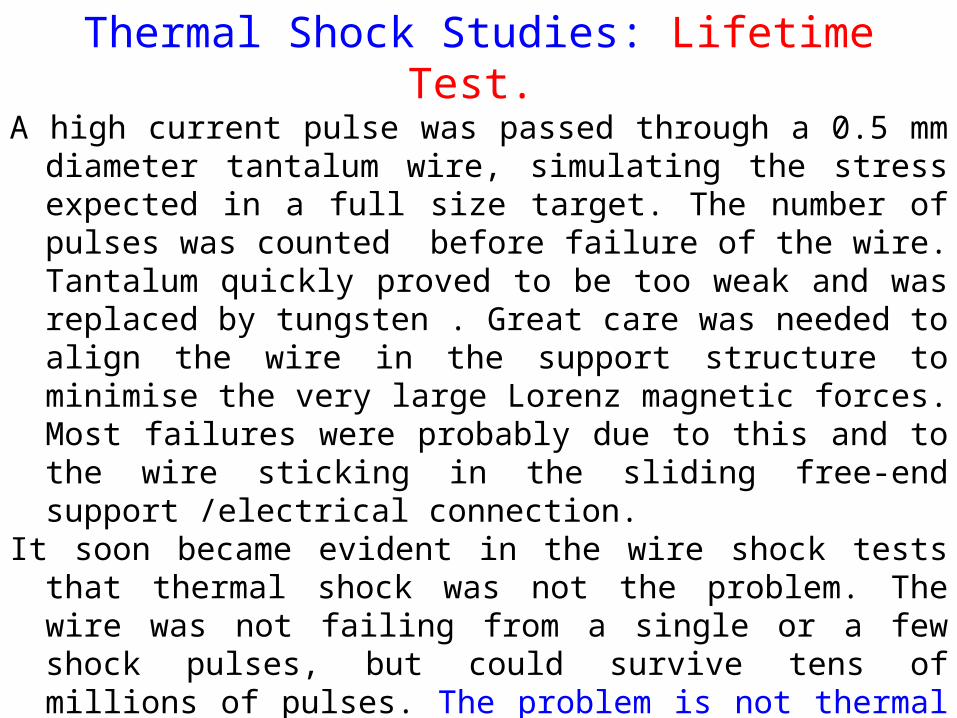
Current
Inner conductor of co-axial insulator feed-through.
Stainless steel split sphere
Copper “nut”
Current
Two graphite (copper) wedges
Tungsten wire
Spring clips
Fixed connection
Sliding connection
Vertical Section through the Wire Test Apparatus
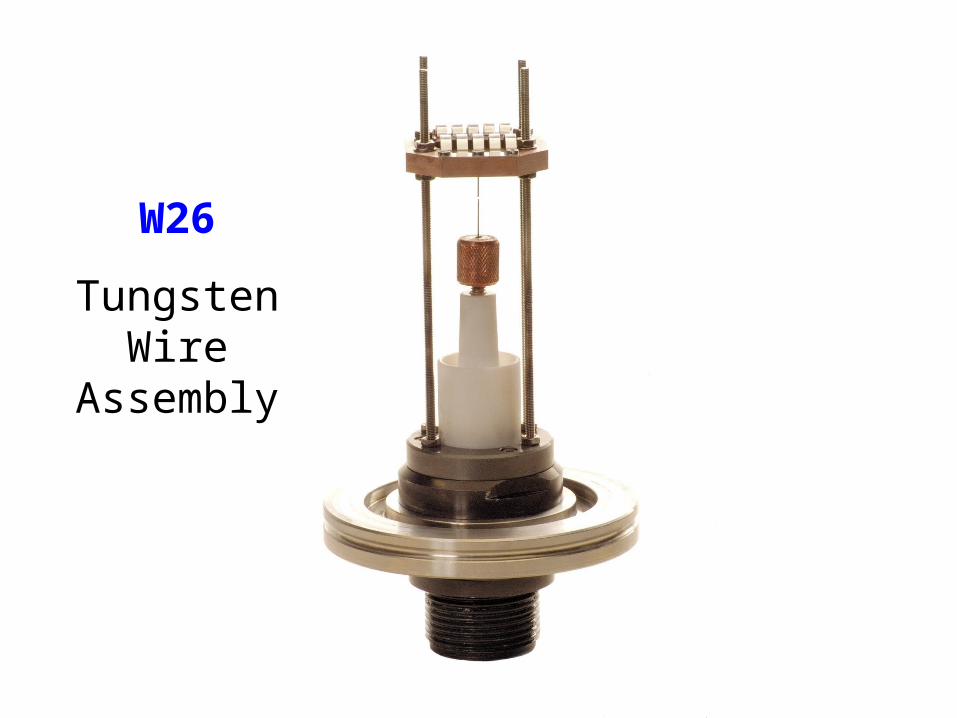
W26
Tungsten Wire
Assembly

Picture of the pulse current, 200 ns/division
We are proposing circulating a series of 200 - 500 tungsten bars through the beam at a rate of 50 bars per second to coincide with the beam pulses. This should give a lifetime of tens of years for each bar. The bars will be 1-2 cm in diameter and ~20 cm long.

ConclusionsI believe that the viability of solid tungsten targets at high-temperature for a long life (~10 years) has been demonstrated with respect to thermal shock and fatigue and will not suffer undue radiation damage.

Thermal Shock Studies Measure Surface Motion and deduce the constitutive
equations of state at high temperature under shock conditions.
Currently a VISAR is being used to measure the surface accelerations/velocities/displacements. We are measuring the longitudinal vibrations of the “free” end of the wire.
Results are very preliminary. The instability of the laser in the VISAR makes reproducible, accurate measurement difficult. Currently we are starting to using Fourier analysis to find the frequency spectrum. Young’s modulus of elasticity is given by,
where f is the frequency of the longitudinal oscillation.
From this it should be possible to measure E as a function of stress and temperature and predict failure under shock conditions.
2fE
VISAR & FFT
Goran Skoro
25 February 2009
VERY Preliminary Results

VISAR tests02
VISAR tests have been performed with 0.3 mm diameter tungsten wire
Idea was to measure the VISAR signal and to extract the longitudinal oscillations of the pulsed wire
Two characteristic results (shots 3 and 5) shown on the left*
Yellow – Current pulse
Green, Purple – VISAR signal (2 channels)
* Note the different time scale
3
Current pulse
VISAR signal
VISAR signal
5
Current pulse
VISAR signal
VISAR signal
Wire Laser beam
VISAR signal obtained for the very first time - nice agreement with simulations results -
But, noise is an issue here!!!
Analysis shown on the following slides will try to address this problem
03
3
Current pulse
VISAR signal
VISAR signal
Frequency analysis of the VISAR signal
FFT method (MATLAB) has been used – from time to frequency domain -
~ 16s
~ 60 kHz
Dominant signal frequency clearly seen in frequency spectrum (noise - negligible)
We need this region too in order to describe the wire motion properly (noise ~ signal)
5
Current pulse
VISAR signal
VISAR signal
04Frequency analysis of the VISAR signal
~ 60 kHz
Dominant signal frequency (not so clearly) seen in frequency spectrum
~ 16s
~ 8s
~ 125 kHz
Real effect (friction of wire’s end) or noise?Compare with previous plot – looks like a noise(here: not enough data points for noise)
Really powerful method; we need more data from VISAR
FFT method (MATLAB) has been used – from time to frequency domain -

05Frequency analysis of the VISAR signal - Filtering
A few examples how we can filter the data
Filter set 2
2
Filter set 1
1
Update I
17 March 2009
6

7
Frequency analysis of the VISAR signal and LS-DYNA results
~ 60 kHz
Dominant frequency that corresponds to longitudinal motion of the wire is clearly present in both frequency spectra
~ 60 kHzshot 3
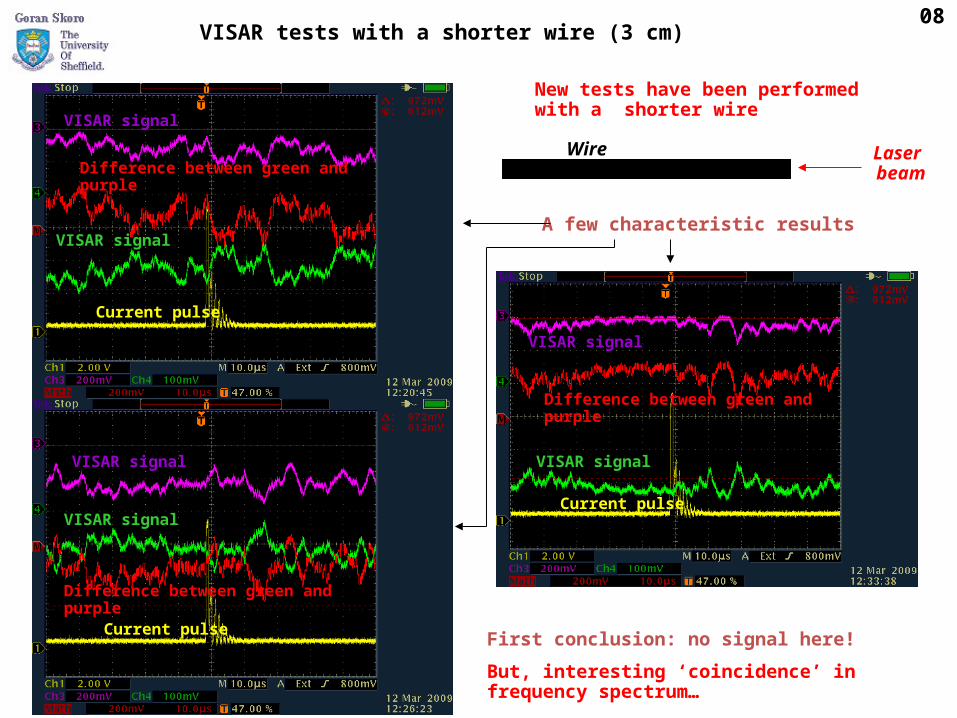
VISAR tests with a shorter wire (3 cm)08
New tests have been performed with a shorter wire
Current pulse
VISAR signal
VISAR signal
Wire Laser beamDifference between green and
purple
Current pulse
VISAR signal
VISAR signal
Difference between green and purple
Current pulse
VISAR signal
VISAR signal
Difference between green and purple
A few characteristic results
First conclusion: no signal here!
But, interesting ‘coincidence’ in frequency spectrum…

09
FFT analysis of each shot – no signal seen (expected, if we look at previous slide)
Small statistics – so we can say it’s a coincidence (but will be interesting to collect more data)
Frequency analysis of the VISAR signal
Tests with a shorter wire
But, by averaging the frequency spectra, the ‘structure’ starting to appear exactly at the right position
We could expect to see this dominant frequency (~ 80 kHz)
Experiment
averaged
VIBROMETER
We have had a trial demonstration of a Vibrometer – a type of Michelson interferometer. This enables us to see the radial vibrations of the wire as well as the longitudinal under thermal shock.
Here is a very preliminary result.
Vibrometer & FFT
Goran Skoro
28 February 2009
Trial R
un

Vibrometer tests02
Laser Doppler Vibrometer tests have been performed with 0.5 mm diameter tungsten wire
Only a few shots taken - shown on the left and below*
Yellow – Current pulse
Green, Purple – “Displacement”, Velocity
* Note the different time scale
6
Current pulse
“Displacement”
Velocity
Wire
Laser beam
But, noise is an issue here!!!
5Current pulse
“Displacement”
Velocity
4
Current pulse
“Displacement”
Velocity

03Frequency analysis of the Vibrometer signal
FFT method (MATLAB) has been used to analyse velocity signal – here: short time scale -
~ 1s
~ 1 MHz
Current pulse (and reflections) Radial oscillations of the wire
~ 160 ns
~ 6 MHz
We expect to see radial oscillations
6
Current pulse
“Displacement”
Velocity
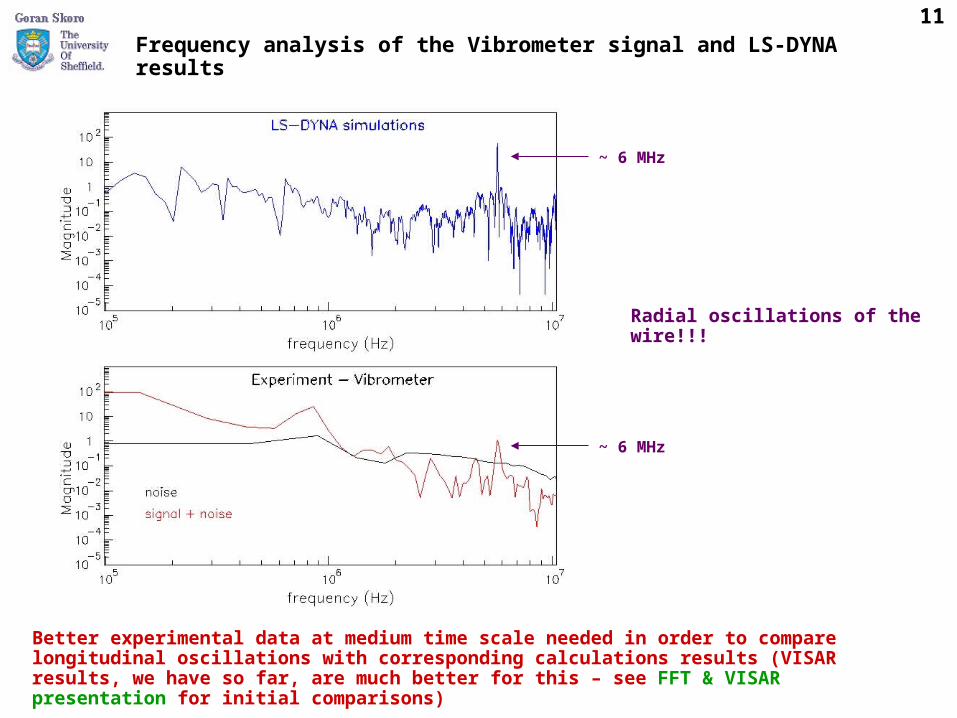
11Frequency analysis of the Vibrometer signal and LS-DYNA results
~ 6 MHz
~ 6 MHz
Radial oscillations of the wire!!!
Better experimental data at medium time scale needed in order to compare longitudinal oscillations with corresponding calculations results (VISAR results, we have so far, are much better for this – see FFT & VISAR presentation for initial comparisons)

ConclusionAt long last I believe we are beginning to see our way to making an assessment of the strength of the tungsten under stress conditions at high temperatures.