EUROCONTROL Seven-Year Forecast Autumn 2019 Annex 2 ... · STATFOR Doc 659 Annex 2 Detailed...
44
Document Confidentiality Classification: White Supporting European Aviation EUROCONTROL Seven-Year Forecast Autumn 2019 – Annex 2: Detailed Forecast Table of Contents 1. Seven-year Flight Forecast per State (IFR movements) ..................................................... 3 2. Seven-year Flight Forecast per State (Growth) ................................................................... 8 3. Two-year en-route service units forecast per state............................................................ 13 4. Seven-year en-route service units with Model 2 forecast per state (Thousands) ............... 15 5. Seven-year en-route service units with Model 2 forecast per state (Growth) ..................... 20 6. Seven-year en-route service units with Model 3 forecast per state (Thousands) ............... 25 7. Seven-year en-route service units with Model 3 forecast per state (Growth) ..................... 30 8. Terminal Navigation Service Units forecast per state (Thousands) ................................... 35 9. Terminal Navigation Service Units forecast per state (Growth) ......................................... 39 10. ECAC Forecast Summary ................................................................................................. 42
Transcript of EUROCONTROL Seven-Year Forecast Autumn 2019 Annex 2 ... · STATFOR Doc 659 Annex 2 Detailed...
Document Confidentiality Classification: White
Supporting European
Aviation
EUROCONTROL Seven-Year Forecast Autumn 2019 – Annex 2: Detailed Forecast
Table of Contents 1. Seven-year Flight Forecast per State (IFR movements) ..................................................... 3
2. Seven-year Flight Forecast per State (Growth) ................................................................... 8
3. Two-year en-route service units forecast per state ............................................................ 13
4. Seven-year en-route service units with Model 2 forecast per state (Thousands) ............... 15
5. Seven-year en-route service units with Model 2 forecast per state (Growth) ..................... 20
6. Seven-year en-route service units with Model 3 forecast per state (Thousands) ............... 25
7. Seven-year en-route service units with Model 3 forecast per state (Growth) ..................... 30
8. Terminal Navigation Service Units forecast per state (Thousands) ................................... 35
9. Terminal Navigation Service Units forecast per state (Growth) ......................................... 39
10. ECAC Forecast Summary ................................................................................................. 42
EUROCONTROL Seven-Year Forecast Autumn 2019 – Annex 2: Detailed Forecast
STATFOR Doc 659 Annex 2 Detailed Forecast 15/10/19
Page 3
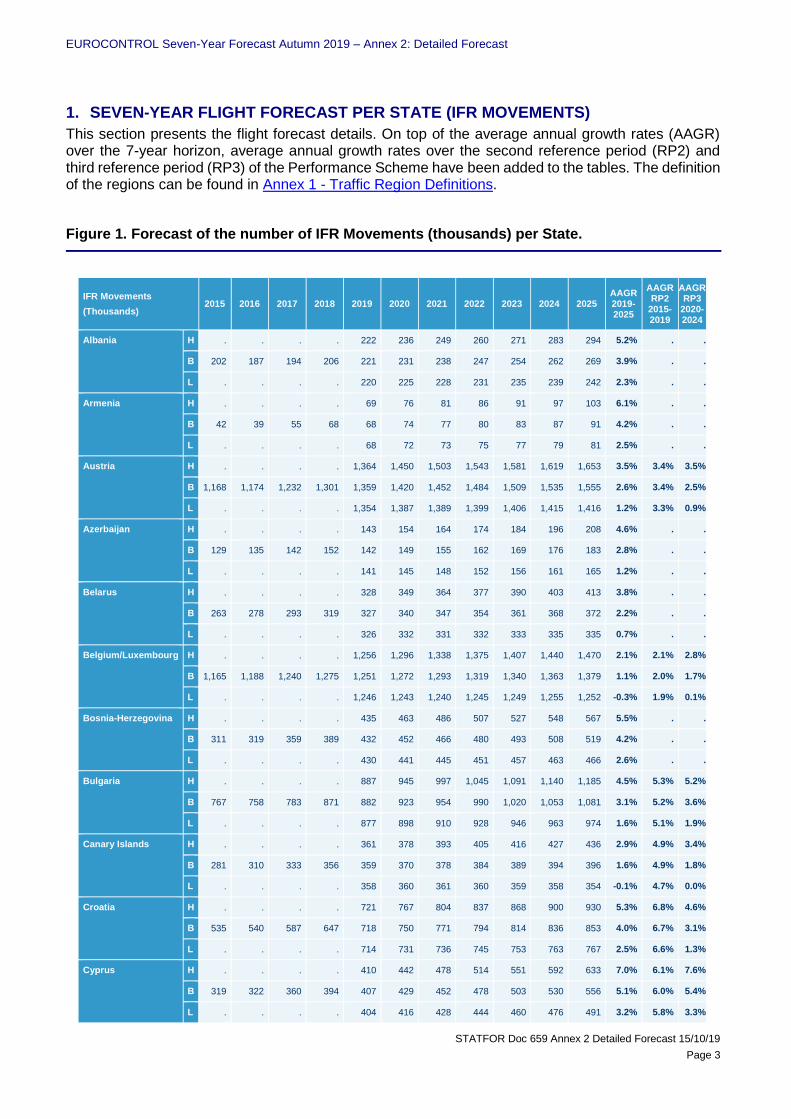
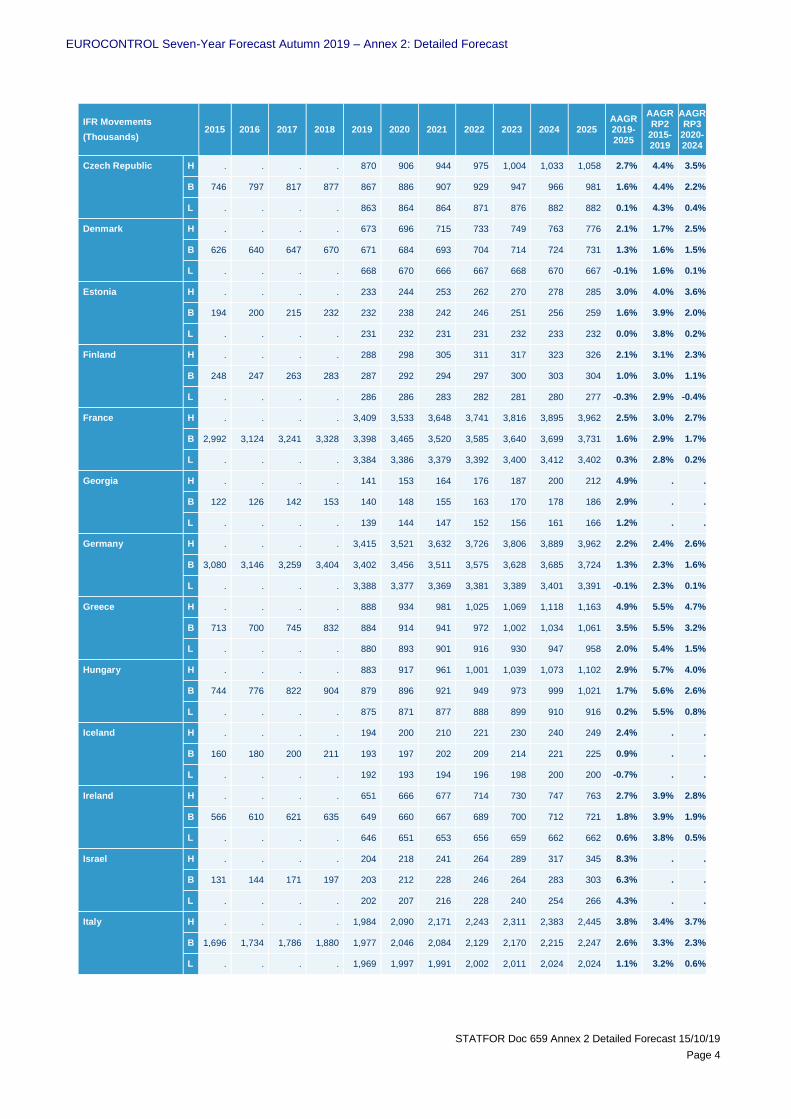
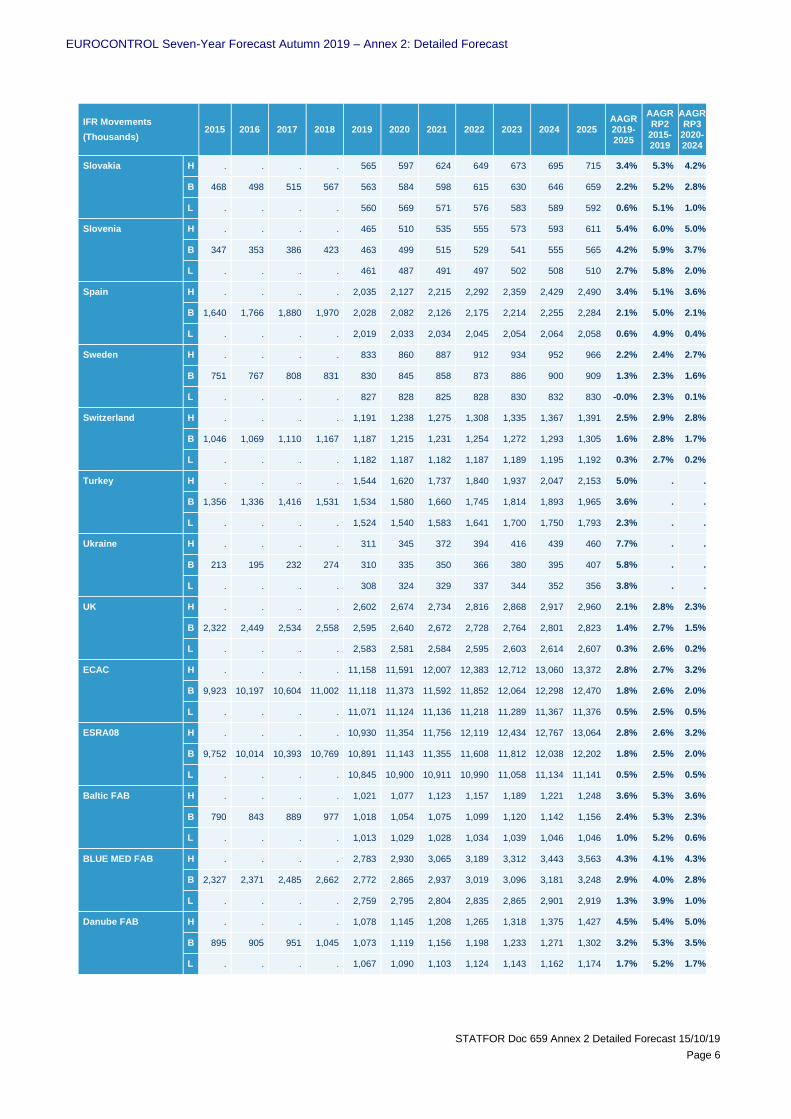
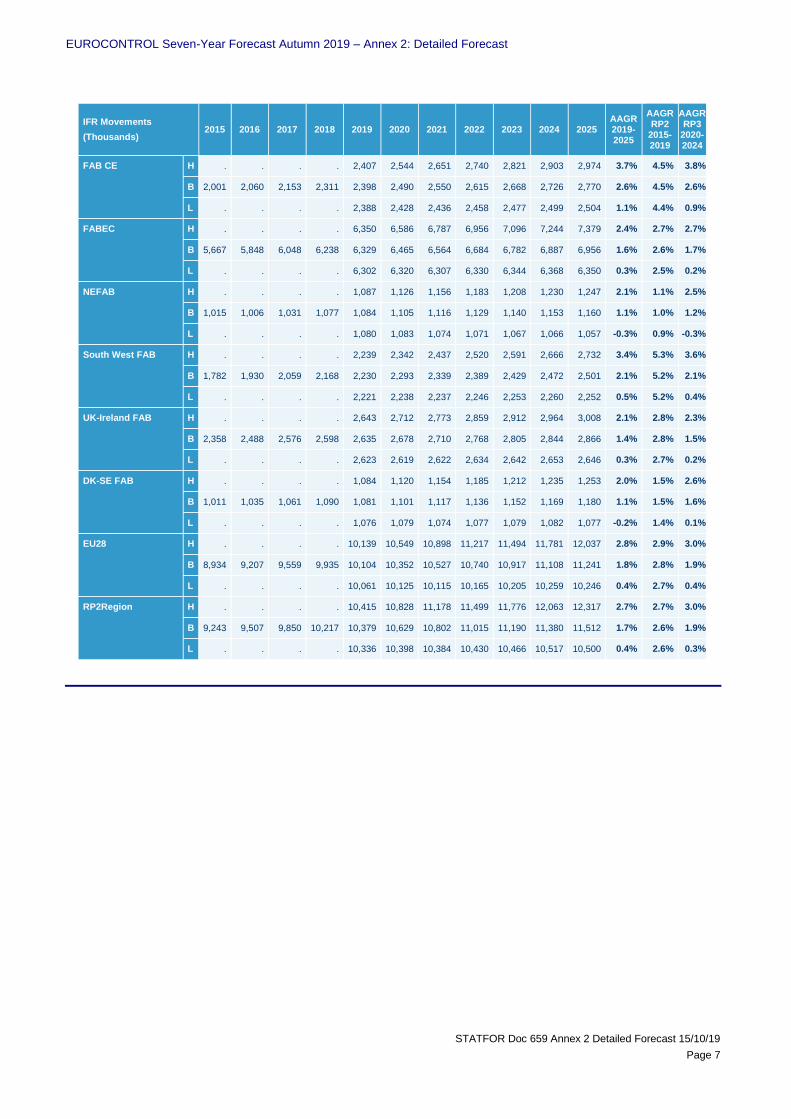
1. SEVEN-YEAR FLIGHT FORECAST PER STATE (IFR MOVEMENTS)
This section presents the flight forecast details. On top of the average annual growth rates (AAGR) over the 7-year horizon, average annual growth rates over the second reference period (RP2) and third reference period (RP3) of the Performance Scheme have been added to the tables. The definition of the regions can be found in Annex 1 - Traffic Region Definitions.
Figure 1. Forecast of the number of IFR Movements (thousands) per State.
IFR Movements
(Thousands) 2015 2016 2017 2018 2019 2020 2021 2022 2023 2024 2025
AAGR 2019-2025
AAGR RP2
2015-2019
AAGR RP3
2020-2024
Albania H . . . . 222 236 249 260 271 283 294 5.2% . .
B 202 187 194 206 221 231 238 247 254 262 269 3.9% . .
L . . . . 220 225 228 231 235 239 242 2.3% . .
Armenia H . . . . 69 76 81 86 91 97 103 6.1% . .
B 42 39 55 68 68 74 77 80 83 87 91 4.2% . .
L . . . . 68 72 73 75 77 79 81 2.5% . .
Austria H . . . . 1,364 1,450 1,503 1,543 1,581 1,619 1,653 3.5% 3.4% 3.5%
B 1,168 1,174 1,232 1,301 1,359 1,420 1,452 1,484 1,509 1,535 1,555 2.6% 3.4% 2.5%
L . . . . 1,354 1,387 1,389 1,399 1,406 1,415 1,416 1.2% 3.3% 0.9%
Azerbaijan H . . . . 143 154 164 174 184 196 208 4.6% . .
B 129 135 142 152 142 149 155 162 169 176 183 2.8% . .
L . . . . 141 145 148 152 156 161 165 1.2% . .
Belarus H . . . . 328 349 364 377 390 403 413 3.8% . .
B 263 278 293 319 327 340 347 354 361 368 372 2.2% . .
L . . . . 326 332 331 332 333 335 335 0.7% . .
Belgium/Luxembourg H . . . . 1,256 1,296 1,338 1,375 1,407 1,440 1,470 2.1% 2.1% 2.8%
B 1,165 1,188 1,240 1,275 1,251 1,272 1,293 1,319 1,340 1,363 1,379 1.1% 2.0% 1.7%
L . . . . 1,246 1,243 1,240 1,245 1,249 1,255 1,252 -0.3% 1.9% 0.1%
Bosnia-Herzegovina H . . . . 435 463 486 507 527 548 567 5.5% . .
B 311 319 359 389 432 452 466 480 493 508 519 4.2% . .
L . . . . 430 441 445 451 457 463 466 2.6% . .
Bulgaria H . . . . 887 945 997 1,045 1,091 1,140 1,185 4.5% 5.3% 5.2%
B 767 758 783 871 882 923 954 990 1,020 1,053 1,081 3.1% 5.2% 3.6%
L . . . . 877 898 910 928 946 963 974 1.6% 5.1% 1.9%
Canary Islands H . . . . 361 378 393 405 416 427 436 2.9% 4.9% 3.4%
B 281 310 333 356 359 370 378 384 389 394 396 1.6% 4.9% 1.8%
L . . . . 358 360 361 360 359 358 354 -0.1% 4.7% 0.0%
Croatia H . . . . 721 767 804 837 868 900 930 5.3% 6.8% 4.6%
B 535 540 587 647 718 750 771 794 814 836 853 4.0% 6.7% 3.1%
L . . . . 714 731 736 745 753 763 767 2.5% 6.6% 1.3%
Cyprus H . . . . 410 442 478 514 551 592 633 7.0% 6.1% 7.6%
B 319 322 360 394 407 429 452 478 503 530 556 5.1% 6.0% 5.4%
L . . . . 404 416 428 444 460 476 491 3.2% 5.8% 3.3%
EUROCONTROL Seven-Year Forecast Autumn 2019 – Annex 2: Detailed Forecast
STATFOR Doc 659 Annex 2 Detailed Forecast 15/10/19
Page 4
IFR Movements
(Thousands) 2015 2016 2017 2018 2019 2020 2021 2022 2023 2024 2025
AAGR 2019-2025
AAGR RP2
2015-2019
AAGR RP3
2020-2024
Czech Republic H . . . . 870 906 944 975 1,004 1,033 1,058 2.7% 4.4% 3.5%
B 746 797 817 877 867 886 907 929 947 966 981 1.6% 4.4% 2.2%
L . . . . 863 864 864 871 876 882 882 0.1% 4.3% 0.4%
Denmark H . . . . 673 696 715 733 749 763 776 2.1% 1.7% 2.5%
B 626 640 647 670 671 684 693 704 714 724 731 1.3% 1.6% 1.5%
L . . . . 668 670 666 667 668 670 667 -0.1% 1.6% 0.1%
Estonia H . . . . 233 244 253 262 270 278 285 3.0% 4.0% 3.6%
B 194 200 215 232 232 238 242 246 251 256 259 1.6% 3.9% 2.0%
L . . . . 231 232 231 231 232 233 232 0.0% 3.8% 0.2%
Finland H . . . . 288 298 305 311 317 323 326 2.1% 3.1% 2.3%
B 248 247 263 283 287 292 294 297 300 303 304 1.0% 3.0% 1.1%
L . . . . 286 286 283 282 281 280 277 -0.3% 2.9% -0.4%
France H . . . . 3,409 3,533 3,648 3,741 3,816 3,895 3,962 2.5% 3.0% 2.7%
B 2,992 3,124 3,241 3,328 3,398 3,465 3,520 3,585 3,640 3,699 3,731 1.6% 2.9% 1.7%
L . . . . 3,384 3,386 3,379 3,392 3,400 3,412 3,402 0.3% 2.8% 0.2%
Georgia H . . . . 141 153 164 176 187 200 212 4.9% . .
B 122 126 142 153 140 148 155 163 170 178 186 2.9% . .
L . . . . 139 144 147 152 156 161 166 1.2% . .
Germany H . . . . 3,415 3,521 3,632 3,726 3,806 3,889 3,962 2.2% 2.4% 2.6%
B 3,080 3,146 3,259 3,404 3,402 3,456 3,511 3,575 3,628 3,685 3,724 1.3% 2.3% 1.6%
L . . . . 3,388 3,377 3,369 3,381 3,389 3,401 3,391 -0.1% 2.3% 0.1%
Greece H . . . . 888 934 981 1,025 1,069 1,118 1,163 4.9% 5.5% 4.7%
B 713 700 745 832 884 914 941 972 1,002 1,034 1,061 3.5% 5.5% 3.2%
L . . . . 880 893 901 916 930 947 958 2.0% 5.4% 1.5%
Hungary H . . . . 883 917 961 1,001 1,039 1,073 1,102 2.9% 5.7% 4.0%
B 744 776 822 904 879 896 921 949 973 999 1,021 1.7% 5.6% 2.6%
L . . . . 875 871 877 888 899 910 916 0.2% 5.5% 0.8%
Iceland H . . . . 194 200 210 221 230 240 249 2.4% . .
B 160 180 200 211 193 197 202 209 214 221 225 0.9% . .
L . . . . 192 193 194 196 198 200 200 -0.7% . .
Ireland H . . . . 651 666 677 714 730 747 763 2.7% 3.9% 2.8%
B 566 610 621 635 649 660 667 689 700 712 721 1.8% 3.9% 1.9%
L . . . . 646 651 653 656 659 662 662 0.6% 3.8% 0.5%
Israel H . . . . 204 218 241 264 289 317 345 8.3% . .
B 131 144 171 197 203 212 228 246 264 283 303 6.3% . .
L . . . . 202 207 216 228 240 254 266 4.3% . .
Italy H . . . . 1,984 2,090 2,171 2,243 2,311 2,383 2,445 3.8% 3.4% 3.7%
B 1,696 1,734 1,786 1,880 1,977 2,046 2,084 2,129 2,170 2,215 2,247 2.6% 3.3% 2.3%
L . . . . 1,969 1,997 1,991 2,002 2,011 2,024 2,024 1.1% 3.2% 0.6%

EUROCONTROL Seven-Year Forecast Autumn 2019 – Annex 2: Detailed Forecast
STATFOR Doc 659 Annex 2 Detailed Forecast 15/10/19
Page 5
IFR Movements
(Thousands) 2015 2016 2017 2018 2019 2020 2021 2022 2023 2024 2025
AAGR 2019-2025
AAGR RP2
2015-2019
AAGR RP3
2020-2024
Latvia H . . . . 300 315 328 340 351 362 372 3.6% 4.4% 3.8%
B 244 246 268 290 299 307 312 318 324 330 334 2.0% 4.3% 2.0%
L . . . . 297 299 297 297 298 299 298 0.4% 4.2% 0.1%
Lisbon FIR H . . . . 657 687 715 739 761 784 804 3.4% 6.5% 3.6%
B 505 559 613 634 654 672 685 699 711 724 732 2.1% 6.4% 2.0%
L . . . . 651 655 654 655 655 657 653 0.4% 6.3% 0.2%
Lithuania H . . . . 307 325 338 349 360 371 380 3.4% 3.6% 3.9%
B 260 261 277 301 305 317 322 328 333 339 343 1.9% 3.5% 2.1%
L . . . . 304 309 306 307 307 308 307 0.3% 3.4% 0.3%
Malta H . . . . 132 144 153 161 170 179 188 6.0% 5.3% 6.3%
B 102 110 116 125 131 140 145 151 156 162 167 4.3% 5.2% 4.3%
L . . . . 130 136 138 141 144 147 149 2.6% 5.1% 2.4%
Moldova H . . . . 56 60 65 69 73 77 81 5.7% . .
B 45 42 50 55 55 58 61 64 66 69 72 3.8% . .
L . . . . 55 57 58 59 60 62 63 1.9% . .
Morocco H . . . . 451 473 500 525 549 576 600 4.8% . .
B 361 383 411 431 449 460 475 490 504 519 530 3.0% . .
L . . . . 446 447 452 456 461 465 467 1.1% . .
Netherlands H . . . . 1,338 1,382 1,416 1,447 1,472 1,496 1,535 2.1% 3.3% 2.3%
B 1,176 1,241 1,287 1,329 1,333 1,359 1,379 1,406 1,425 1,442 1,465 1.4% 3.2% 1.6%
L . . . . 1,328 1,328 1,326 1,331 1,334 1,340 1,336 0.1% 3.1% 0.2%
North Macedonia H . . . . 225 246 259 271 282 295 306 6.8% . .
B 152 146 171 193 224 240 248 257 265 273 280 5.5% . .
L . . . . 223 235 237 241 245 249 251 3.9% . .
Norway H . . . . 592 608 619 629 639 647 651 1.3% -0.9% 1.8%
B 603 599 591 594 590 599 602 607 611 616 618 0.6% -0.9% 0.8%
L . . . . 589 589 583 580 577 575 569 -0.6% -1.0% -0.5%
Poland H . . . . 912 966 1,007 1,036 1,064 1,091 1,115 3.6% 5.4% 3.7%
B 699 755 793 872 909 946 965 987 1,006 1,026 1,038 2.5% 5.3% 2.4%
L . . . . 905 924 923 928 933 940 940 1.1% 5.2% 0.7%
Romania H . . . . 744 767 809 848 885 923 958 3.8% 4.5% 4.4%
B 635 621 673 738 740 750 774 801 826 851 873 2.4% 4.4% 2.8%
L . . . . 736 730 737 750 763 776 783 0.9% 4.2% 1.0%
Santa Maria FIR H . . . . 169 180 187 194 200 207 214 3.6% 6.3% 4.1%
B 136 151 162 167 169 177 180 184 188 192 196 2.3% 6.2% 2.7%
L . . . . 168 173 174 175 176 178 178 0.9% 6.1% 1.2%
Serbia&Montenegro H . . . . 771 817 860 898 934 972 1,007 5.0% . .
B 605 619 654 716 768 798 824 851 875 901 922 3.7% . .
L . . . . 764 778 785 798 810 822 829 2.1% . .
EUROCONTROL Seven-Year Forecast Autumn 2019 – Annex 2: Detailed Forecast
STATFOR Doc 659 Annex 2 Detailed Forecast 15/10/19
Page 6
IFR Movements
(Thousands) 2015 2016 2017 2018 2019 2020 2021 2022 2023 2024 2025
AAGR 2019-2025
AAGR RP2
2015-2019
AAGR RP3
2020-2024
Slovakia H . . . . 565 597 624 649 673 695 715 3.4% 5.3% 4.2%
B 468 498 515 567 563 584 598 615 630 646 659 2.2% 5.2% 2.8%
L . . . . 560 569 571 576 583 589 592 0.6% 5.1% 1.0%
Slovenia H . . . . 465 510 535 555 573 593 611 5.4% 6.0% 5.0%
B 347 353 386 423 463 499 515 529 541 555 565 4.2% 5.9% 3.7%
L . . . . 461 487 491 497 502 508 510 2.7% 5.8% 2.0%
Spain H . . . . 2,035 2,127 2,215 2,292 2,359 2,429 2,490 3.4% 5.1% 3.6%
B 1,640 1,766 1,880 1,970 2,028 2,082 2,126 2,175 2,214 2,255 2,284 2.1% 5.0% 2.1%
L . . . . 2,019 2,033 2,034 2,045 2,054 2,064 2,058 0.6% 4.9% 0.4%
Sweden H . . . . 833 860 887 912 934 952 966 2.2% 2.4% 2.7%
B 751 767 808 831 830 845 858 873 886 900 909 1.3% 2.3% 1.6%
L . . . . 827 828 825 828 830 832 830 -0.0% 2.3% 0.1%
Switzerland H . . . . 1,191 1,238 1,275 1,308 1,335 1,367 1,391 2.5% 2.9% 2.8%
B 1,046 1,069 1,110 1,167 1,187 1,215 1,231 1,254 1,272 1,293 1,305 1.6% 2.8% 1.7%
L . . . . 1,182 1,187 1,182 1,187 1,189 1,195 1,192 0.3% 2.7% 0.2%
Turkey H . . . . 1,544 1,620 1,737 1,840 1,937 2,047 2,153 5.0% . .
B 1,356 1,336 1,416 1,531 1,534 1,580 1,660 1,745 1,814 1,893 1,965 3.6% . .
L . . . . 1,524 1,540 1,583 1,641 1,700 1,750 1,793 2.3% . .
Ukraine H . . . . 311 345 372 394 416 439 460 7.7% . .
B 213 195 232 274 310 335 350 366 380 395 407 5.8% . .
L . . . . 308 324 329 337 344 352 356 3.8% . .
UK H . . . . 2,602 2,674 2,734 2,816 2,868 2,917 2,960 2.1% 2.8% 2.3%
B 2,322 2,449 2,534 2,558 2,595 2,640 2,672 2,728 2,764 2,801 2,823 1.4% 2.7% 1.5%
L . . . . 2,583 2,581 2,584 2,595 2,603 2,614 2,607 0.3% 2.6% 0.2%
ECAC H . . . . 11,158 11,591 12,007 12,383 12,712 13,060 13,372 2.8% 2.7% 3.2%
B 9,923 10,197 10,604 11,002 11,118 11,373 11,592 11,852 12,064 12,298 12,470 1.8% 2.6% 2.0%
L . . . . 11,071 11,124 11,136 11,218 11,289 11,367 11,376 0.5% 2.5% 0.5%
ESRA08 H . . . . 10,930 11,354 11,756 12,119 12,434 12,767 13,064 2.8% 2.6% 3.2%
B 9,752 10,014 10,393 10,769 10,891 11,143 11,355 11,608 11,812 12,038 12,202 1.8% 2.5% 2.0%
L . . . . 10,845 10,900 10,911 10,990 11,058 11,134 11,141 0.5% 2.5% 0.5%
Baltic FAB H . . . . 1,021 1,077 1,123 1,157 1,189 1,221 1,248 3.6% 5.3% 3.6%
B 790 843 889 977 1,018 1,054 1,075 1,099 1,120 1,142 1,156 2.4% 5.3% 2.3%
L . . . . 1,013 1,029 1,028 1,034 1,039 1,046 1,046 1.0% 5.2% 0.6%
BLUE MED FAB H . . . . 2,783 2,930 3,065 3,189 3,312 3,443 3,563 4.3% 4.1% 4.3%
B 2,327 2,371 2,485 2,662 2,772 2,865 2,937 3,019 3,096 3,181 3,248 2.9% 4.0% 2.8%
L . . . . 2,759 2,795 2,804 2,835 2,865 2,901 2,919 1.3% 3.9% 1.0%
Danube FAB H . . . . 1,078 1,145 1,208 1,265 1,318 1,375 1,427 4.5% 5.4% 5.0%
B 895 905 951 1,045 1,073 1,119 1,156 1,198 1,233 1,271 1,302 3.2% 5.3% 3.5%
L . . . . 1,067 1,090 1,103 1,124 1,143 1,162 1,174 1.7% 5.2% 1.7%
EUROCONTROL Seven-Year Forecast Autumn 2019 – Annex 2: Detailed Forecast
STATFOR Doc 659 Annex 2 Detailed Forecast 15/10/19
Page 7
IFR Movements
(Thousands) 2015 2016 2017 2018 2019 2020 2021 2022 2023 2024 2025
AAGR 2019-2025
AAGR RP2
2015-2019
AAGR RP3
2020-2024
FAB CE H . . . . 2,407 2,544 2,651 2,740 2,821 2,903 2,974 3.7% 4.5% 3.8%
B 2,001 2,060 2,153 2,311 2,398 2,490 2,550 2,615 2,668 2,726 2,770 2.6% 4.5% 2.6%
L . . . . 2,388 2,428 2,436 2,458 2,477 2,499 2,504 1.1% 4.4% 0.9%
FABEC H . . . . 6,350 6,586 6,787 6,956 7,096 7,244 7,379 2.4% 2.7% 2.7%
B 5,667 5,848 6,048 6,238 6,329 6,465 6,564 6,684 6,782 6,887 6,956 1.6% 2.6% 1.7%
L . . . . 6,302 6,320 6,307 6,330 6,344 6,368 6,350 0.3% 2.5% 0.2%
NEFAB H . . . . 1,087 1,126 1,156 1,183 1,208 1,230 1,247 2.1% 1.1% 2.5%
B 1,015 1,006 1,031 1,077 1,084 1,105 1,116 1,129 1,140 1,153 1,160 1.1% 1.0% 1.2%
L . . . . 1,080 1,083 1,074 1,071 1,067 1,066 1,057 -0.3% 0.9% -0.3%
South West FAB H . . . . 2,239 2,342 2,437 2,520 2,591 2,666 2,732 3.4% 5.3% 3.6%
B 1,782 1,930 2,059 2,168 2,230 2,293 2,339 2,389 2,429 2,472 2,501 2.1% 5.2% 2.1%
L . . . . 2,221 2,238 2,237 2,246 2,253 2,260 2,252 0.5% 5.2% 0.4%
UK-Ireland FAB H . . . . 2,643 2,712 2,773 2,859 2,912 2,964 3,008 2.1% 2.8% 2.3%
B 2,358 2,488 2,576 2,598 2,635 2,678 2,710 2,768 2,805 2,844 2,866 1.4% 2.8% 1.5%
L . . . . 2,623 2,619 2,622 2,634 2,642 2,653 2,646 0.3% 2.7% 0.2%
DK-SE FAB H . . . . 1,084 1,120 1,154 1,185 1,212 1,235 1,253 2.0% 1.5% 2.6%
B 1,011 1,035 1,061 1,090 1,081 1,101 1,117 1,136 1,152 1,169 1,180 1.1% 1.5% 1.6%
L . . . . 1,076 1,079 1,074 1,077 1,079 1,082 1,077 -0.2% 1.4% 0.1%
EU28 H . . . . 10,139 10,549 10,898 11,217 11,494 11,781 12,037 2.8% 2.9% 3.0%
B 8,934 9,207 9,559 9,935 10,104 10,352 10,527 10,740 10,917 11,108 11,241 1.8% 2.8% 1.9%
L . . . . 10,061 10,125 10,115 10,165 10,205 10,259 10,246 0.4% 2.7% 0.4%
RP2Region H . . . . 10,415 10,828 11,178 11,499 11,776 12,063 12,317 2.7% 2.7% 3.0%
B 9,243 9,507 9,850 10,217 10,379 10,629 10,802 11,015 11,190 11,380 11,512 1.7% 2.6% 1.9%
L . . . . 10,336 10,398 10,384 10,430 10,466 10,517 10,500 0.4% 2.6% 0.3%
EUROCONTROL Seven-Year Forecast Autumn 2019 – Annex 2: Detailed Forecast
STATFOR Doc 659 Annex 2 Detailed Forecast 15/10/19
Page 8
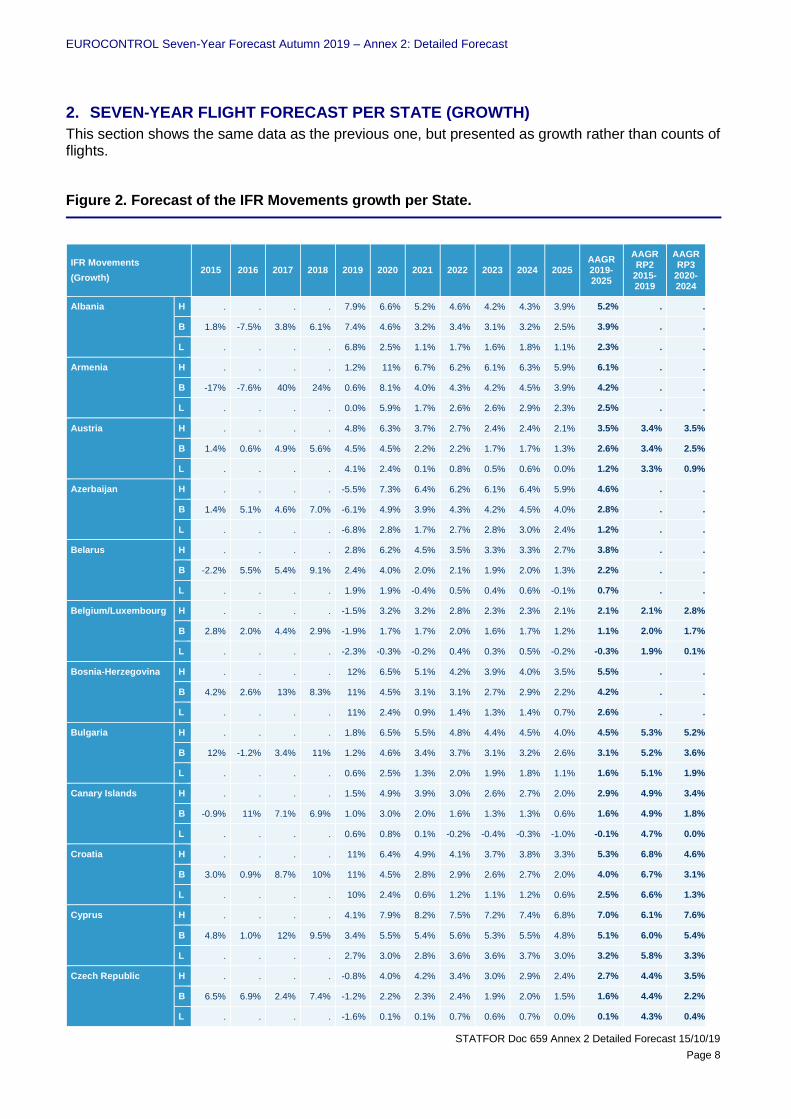
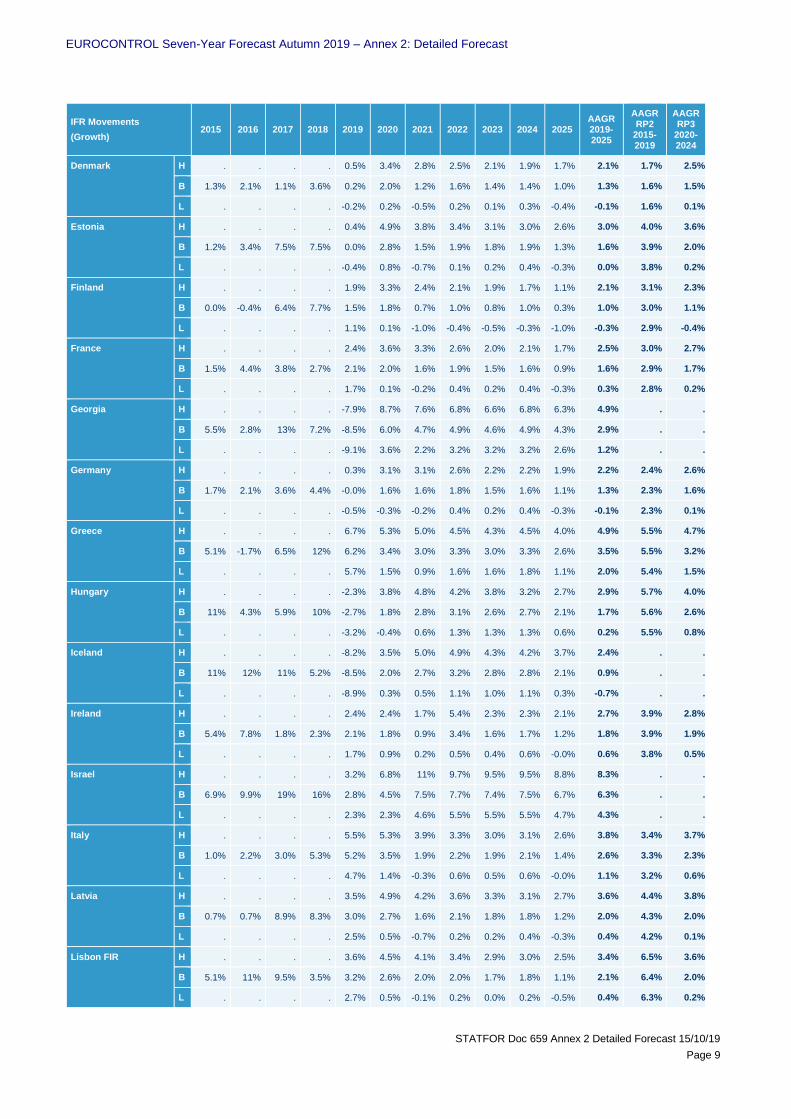
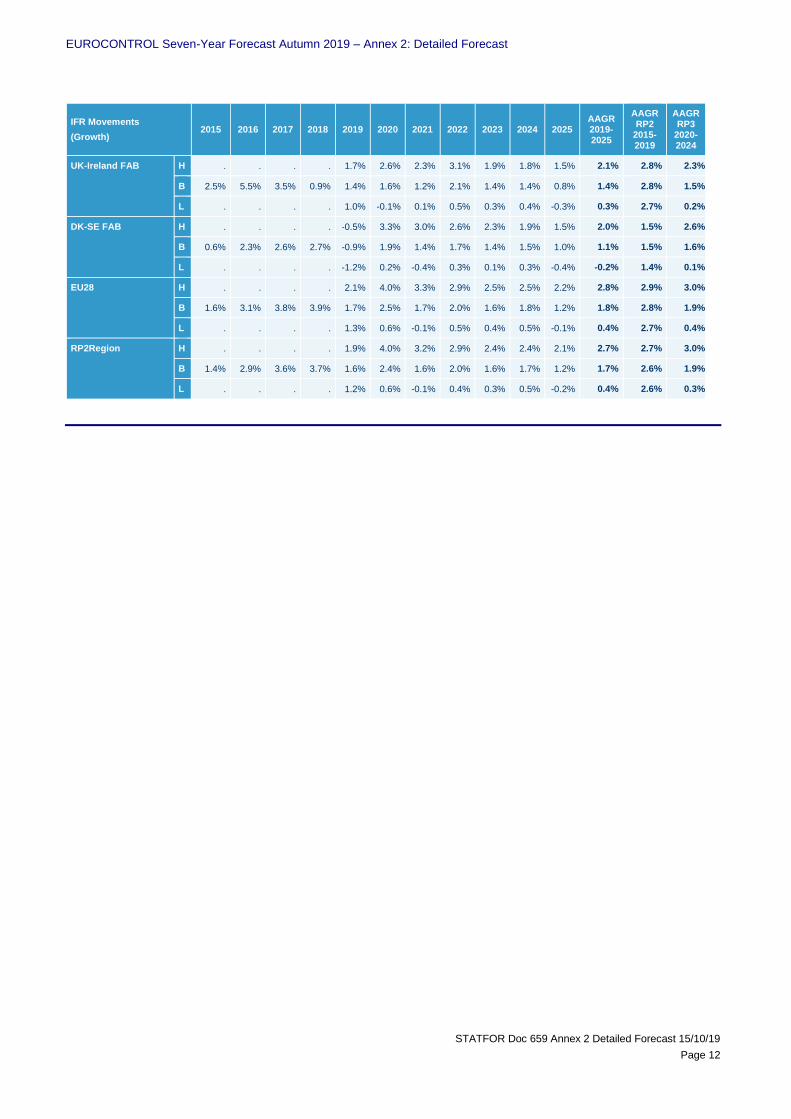
2. SEVEN-YEAR FLIGHT FORECAST PER STATE (GROWTH)
This section shows the same data as the previous one, but presented as growth rather than counts of flights.
Figure 2. Forecast of the IFR Movements growth per State.
IFR Movements
(Growth) 2015 2016 2017 2018 2019 2020 2021 2022 2023 2024 2025
AAGR 2019-2025
AAGR RP2
2015-2019
AAGR RP3
2020-2024
Albania H . . . . 7.9% 6.6% 5.2% 4.6% 4.2% 4.3% 3.9% 5.2% . .
B 1.8% -7.5% 3.8% 6.1% 7.4% 4.6% 3.2% 3.4% 3.1% 3.2% 2.5% 3.9% . .
L . . . . 6.8% 2.5% 1.1% 1.7% 1.6% 1.8% 1.1% 2.3% . .
Armenia H . . . . 1.2% 11% 6.7% 6.2% 6.1% 6.3% 5.9% 6.1% . .
B -17% -7.6% 40% 24% 0.6% 8.1% 4.0% 4.3% 4.2% 4.5% 3.9% 4.2% . .
L . . . . 0.0% 5.9% 1.7% 2.6% 2.6% 2.9% 2.3% 2.5% . .
Austria H . . . . 4.8% 6.3% 3.7% 2.7% 2.4% 2.4% 2.1% 3.5% 3.4% 3.5%
B 1.4% 0.6% 4.9% 5.6% 4.5% 4.5% 2.2% 2.2% 1.7% 1.7% 1.3% 2.6% 3.4% 2.5%
L . . . . 4.1% 2.4% 0.1% 0.8% 0.5% 0.6% 0.0% 1.2% 3.3% 0.9%
Azerbaijan H . . . . -5.5% 7.3% 6.4% 6.2% 6.1% 6.4% 5.9% 4.6% . .
B 1.4% 5.1% 4.6% 7.0% -6.1% 4.9% 3.9% 4.3% 4.2% 4.5% 4.0% 2.8% . .
L . . . . -6.8% 2.8% 1.7% 2.7% 2.8% 3.0% 2.4% 1.2% . .
Belarus H . . . . 2.8% 6.2% 4.5% 3.5% 3.3% 3.3% 2.7% 3.8% . .
B -2.2% 5.5% 5.4% 9.1% 2.4% 4.0% 2.0% 2.1% 1.9% 2.0% 1.3% 2.2% . .
L . . . . 1.9% 1.9% -0.4% 0.5% 0.4% 0.6% -0.1% 0.7% . .
Belgium/Luxembourg H . . . . -1.5% 3.2% 3.2% 2.8% 2.3% 2.3% 2.1% 2.1% 2.1% 2.8%
B 2.8% 2.0% 4.4% 2.9% -1.9% 1.7% 1.7% 2.0% 1.6% 1.7% 1.2% 1.1% 2.0% 1.7%
L . . . . -2.3% -0.3% -0.2% 0.4% 0.3% 0.5% -0.2% -0.3% 1.9% 0.1%
Bosnia-Herzegovina H . . . . 12% 6.5% 5.1% 4.2% 3.9% 4.0% 3.5% 5.5% . .
B 4.2% 2.6% 13% 8.3% 11% 4.5% 3.1% 3.1% 2.7% 2.9% 2.2% 4.2% . .
L . . . . 11% 2.4% 0.9% 1.4% 1.3% 1.4% 0.7% 2.6% . .
Bulgaria H . . . . 1.8% 6.5% 5.5% 4.8% 4.4% 4.5% 4.0% 4.5% 5.3% 5.2%
B 12% -1.2% 3.4% 11% 1.2% 4.6% 3.4% 3.7% 3.1% 3.2% 2.6% 3.1% 5.2% 3.6%
L . . . . 0.6% 2.5% 1.3% 2.0% 1.9% 1.8% 1.1% 1.6% 5.1% 1.9%
Canary Islands H . . . . 1.5% 4.9% 3.9% 3.0% 2.6% 2.7% 2.0% 2.9% 4.9% 3.4%
B -0.9% 11% 7.1% 6.9% 1.0% 3.0% 2.0% 1.6% 1.3% 1.3% 0.6% 1.6% 4.9% 1.8%
L . . . . 0.6% 0.8% 0.1% -0.2% -0.4% -0.3% -1.0% -0.1% 4.7% 0.0%
Croatia H . . . . 11% 6.4% 4.9% 4.1% 3.7% 3.8% 3.3% 5.3% 6.8% 4.6%
B 3.0% 0.9% 8.7% 10% 11% 4.5% 2.8% 2.9% 2.6% 2.7% 2.0% 4.0% 6.7% 3.1%
L . . . . 10% 2.4% 0.6% 1.2% 1.1% 1.2% 0.6% 2.5% 6.6% 1.3%
Cyprus H . . . . 4.1% 7.9% 8.2% 7.5% 7.2% 7.4% 6.8% 7.0% 6.1% 7.6%
B 4.8% 1.0% 12% 9.5% 3.4% 5.5% 5.4% 5.6% 5.3% 5.5% 4.8% 5.1% 6.0% 5.4%
L . . . . 2.7% 3.0% 2.8% 3.6% 3.6% 3.7% 3.0% 3.2% 5.8% 3.3%
Czech Republic H . . . . -0.8% 4.0% 4.2% 3.4% 3.0% 2.9% 2.4% 2.7% 4.4% 3.5%
B 6.5% 6.9% 2.4% 7.4% -1.2% 2.2% 2.3% 2.4% 1.9% 2.0% 1.5% 1.6% 4.4% 2.2%
L . . . . -1.6% 0.1% 0.1% 0.7% 0.6% 0.7% 0.0% 0.1% 4.3% 0.4%
EUROCONTROL Seven-Year Forecast Autumn 2019 – Annex 2: Detailed Forecast
STATFOR Doc 659 Annex 2 Detailed Forecast 15/10/19
Page 9
IFR Movements
(Growth) 2015 2016 2017 2018 2019 2020 2021 2022 2023 2024 2025
AAGR 2019-2025
AAGR RP2
2015-2019
AAGR RP3
2020-2024
Denmark H . . . . 0.5% 3.4% 2.8% 2.5% 2.1% 1.9% 1.7% 2.1% 1.7% 2.5%
B 1.3% 2.1% 1.1% 3.6% 0.2% 2.0% 1.2% 1.6% 1.4% 1.4% 1.0% 1.3% 1.6% 1.5%
L . . . . -0.2% 0.2% -0.5% 0.2% 0.1% 0.3% -0.4% -0.1% 1.6% 0.1%
Estonia H . . . . 0.4% 4.9% 3.8% 3.4% 3.1% 3.0% 2.6% 3.0% 4.0% 3.6%
B 1.2% 3.4% 7.5% 7.5% 0.0% 2.8% 1.5% 1.9% 1.8% 1.9% 1.3% 1.6% 3.9% 2.0%
L . . . . -0.4% 0.8% -0.7% 0.1% 0.2% 0.4% -0.3% 0.0% 3.8% 0.2%
Finland H . . . . 1.9% 3.3% 2.4% 2.1% 1.9% 1.7% 1.1% 2.1% 3.1% 2.3%
B 0.0% -0.4% 6.4% 7.7% 1.5% 1.8% 0.7% 1.0% 0.8% 1.0% 0.3% 1.0% 3.0% 1.1%
L . . . . 1.1% 0.1% -1.0% -0.4% -0.5% -0.3% -1.0% -0.3% 2.9% -0.4%
France H . . . . 2.4% 3.6% 3.3% 2.6% 2.0% 2.1% 1.7% 2.5% 3.0% 2.7%
B 1.5% 4.4% 3.8% 2.7% 2.1% 2.0% 1.6% 1.9% 1.5% 1.6% 0.9% 1.6% 2.9% 1.7%
L . . . . 1.7% 0.1% -0.2% 0.4% 0.2% 0.4% -0.3% 0.3% 2.8% 0.2%
Georgia H . . . . -7.9% 8.7% 7.6% 6.8% 6.6% 6.8% 6.3% 4.9% . .
B 5.5% 2.8% 13% 7.2% -8.5% 6.0% 4.7% 4.9% 4.6% 4.9% 4.3% 2.9% . .
L . . . . -9.1% 3.6% 2.2% 3.2% 3.2% 3.2% 2.6% 1.2% . .
Germany H . . . . 0.3% 3.1% 3.1% 2.6% 2.2% 2.2% 1.9% 2.2% 2.4% 2.6%
B 1.7% 2.1% 3.6% 4.4% -0.0% 1.6% 1.6% 1.8% 1.5% 1.6% 1.1% 1.3% 2.3% 1.6%
L . . . . -0.5% -0.3% -0.2% 0.4% 0.2% 0.4% -0.3% -0.1% 2.3% 0.1%
Greece H . . . . 6.7% 5.3% 5.0% 4.5% 4.3% 4.5% 4.0% 4.9% 5.5% 4.7%
B 5.1% -1.7% 6.5% 12% 6.2% 3.4% 3.0% 3.3% 3.0% 3.3% 2.6% 3.5% 5.5% 3.2%
L . . . . 5.7% 1.5% 0.9% 1.6% 1.6% 1.8% 1.1% 2.0% 5.4% 1.5%
Hungary H . . . . -2.3% 3.8% 4.8% 4.2% 3.8% 3.2% 2.7% 2.9% 5.7% 4.0%
B 11% 4.3% 5.9% 10% -2.7% 1.8% 2.8% 3.1% 2.6% 2.7% 2.1% 1.7% 5.6% 2.6%
L . . . . -3.2% -0.4% 0.6% 1.3% 1.3% 1.3% 0.6% 0.2% 5.5% 0.8%
Iceland H . . . . -8.2% 3.5% 5.0% 4.9% 4.3% 4.2% 3.7% 2.4% . .
B 11% 12% 11% 5.2% -8.5% 2.0% 2.7% 3.2% 2.8% 2.8% 2.1% 0.9% . .
L . . . . -8.9% 0.3% 0.5% 1.1% 1.0% 1.1% 0.3% -0.7% . .
Ireland H . . . . 2.4% 2.4% 1.7% 5.4% 2.3% 2.3% 2.1% 2.7% 3.9% 2.8%
B 5.4% 7.8% 1.8% 2.3% 2.1% 1.8% 0.9% 3.4% 1.6% 1.7% 1.2% 1.8% 3.9% 1.9%
L . . . . 1.7% 0.9% 0.2% 0.5% 0.4% 0.6% -0.0% 0.6% 3.8% 0.5%
Israel H . . . . 3.2% 6.8% 11% 9.7% 9.5% 9.5% 8.8% 8.3% . .
B 6.9% 9.9% 19% 16% 2.8% 4.5% 7.5% 7.7% 7.4% 7.5% 6.7% 6.3% . .
L . . . . 2.3% 2.3% 4.6% 5.5% 5.5% 5.5% 4.7% 4.3% . .
Italy H . . . . 5.5% 5.3% 3.9% 3.3% 3.0% 3.1% 2.6% 3.8% 3.4% 3.7%
B 1.0% 2.2% 3.0% 5.3% 5.2% 3.5% 1.9% 2.2% 1.9% 2.1% 1.4% 2.6% 3.3% 2.3%
L . . . . 4.7% 1.4% -0.3% 0.6% 0.5% 0.6% -0.0% 1.1% 3.2% 0.6%
Latvia H . . . . 3.5% 4.9% 4.2% 3.6% 3.3% 3.1% 2.7% 3.6% 4.4% 3.8%
B 0.7% 0.7% 8.9% 8.3% 3.0% 2.7% 1.6% 2.1% 1.8% 1.8% 1.2% 2.0% 4.3% 2.0%
L . . . . 2.5% 0.5% -0.7% 0.2% 0.2% 0.4% -0.3% 0.4% 4.2% 0.1%
Lisbon FIR H . . . . 3.6% 4.5% 4.1% 3.4% 2.9% 3.0% 2.5% 3.4% 6.5% 3.6%
B 5.1% 11% 9.5% 3.5% 3.2% 2.6% 2.0% 2.0% 1.7% 1.8% 1.1% 2.1% 6.4% 2.0%
L . . . . 2.7% 0.5% -0.1% 0.2% 0.0% 0.2% -0.5% 0.4% 6.3% 0.2%

EUROCONTROL Seven-Year Forecast Autumn 2019 – Annex 2: Detailed Forecast
STATFOR Doc 659 Annex 2 Detailed Forecast 15/10/19
Page 10
IFR Movements
(Growth) 2015 2016 2017 2018 2019 2020 2021 2022 2023 2024 2025
AAGR 2019-2025
AAGR RP2
2015-2019
AAGR RP3
2020-2024
Lithuania H . . . . 2.0% 5.9% 4.0% 3.4% 3.1% 3.0% 2.4% 3.4% 3.6% 3.9%
B 1.2% 0.2% 6.2% 8.6% 1.5% 3.8% 1.5% 1.9% 1.7% 1.7% 1.0% 1.9% 3.5% 2.1%
L . . . . 1.1% 1.6% -0.7% 0.1% 0.2% 0.3% -0.4% 0.3% 3.4% 0.3%
Malta H . . . . 5.6% 8.8% 6.2% 5.5% 5.3% 5.6% 5.0% 6.0% 5.3% 6.3%
B 0.7% 7.1% 5.3% 8.2% 4.9% 6.5% 3.8% 3.8% 3.6% 3.9% 3.2% 4.3% 5.2% 4.3%
L . . . . 4.2% 4.2% 1.6% 2.1% 1.9% 2.2% 1.6% 2.6% 5.1% 2.4%
Moldova H . . . . 0.8% 8.6% 7.4% 6.3% 6.0% 6.1% 5.3% 5.7% . .
B -19% -8.0% 20% 9.8% 0.2% 5.9% 4.4% 4.5% 4.2% 4.3% 3.5% 3.8% . .
L . . . . -0.5% 3.3% 1.5% 2.5% 2.4% 2.5% 1.7% 1.9% . .
Morocco H . . . . 4.5% 5.0% 5.7% 4.9% 4.6% 4.8% 4.3% 4.8% . .
B 0.3% 6.3% 7.3% 4.9% 4.0% 2.6% 3.2% 3.1% 2.8% 2.9% 2.2% 3.0% . .
L . . . . 3.5% 0.2% 1.0% 1.1% 0.9% 1.0% 0.3% 1.1% . .
Netherlands H . . . . 0.7% 3.3% 2.5% 2.2% 1.7% 1.6% 2.6% 2.1% 3.3% 2.3%
B 3.4% 5.5% 3.7% 3.2% 0.4% 1.9% 1.5% 1.9% 1.4% 1.2% 1.6% 1.4% 3.2% 1.6%
L . . . . -0.1% 0.0% -0.1% 0.4% 0.3% 0.4% -0.3% 0.1% 3.1% 0.2%
North Macedonia H . . . . 17% 9.4% 5.4% 4.6% 4.3% 4.4% 3.9% 6.8% . .
B 3.9% -4.3% 18% 13% 16% 7.5% 3.3% 3.4% 3.1% 3.2% 2.6% 5.5% . .
L . . . . 15% 5.4% 1.0% 1.6% 1.5% 1.7% 1.0% 3.9% . .
Norway H . . . . -0.4% 2.6% 1.9% 1.7% 1.6% 1.2% 0.6% 1.3% -0.9% 1.8%
B -2.5% -0.8% -1.2% 0.6% -0.7% 1.4% 0.5% 0.8% 0.7% 0.8% 0.3% 0.6% -0.9% 0.8%
L . . . . -1.0% 0.0% -1.0% -0.5% -0.6% -0.4% -0.9% -0.6% -1.0% -0.5%
Poland H . . . . 4.6% 5.9% 4.2% 3.0% 2.6% 2.6% 2.2% 3.6% 5.4% 3.7%
B -0.3% 7.9% 5.0% 10% 4.3% 4.1% 2.0% 2.2% 2.0% 2.0% 1.2% 2.5% 5.3% 2.4%
L . . . . 3.9% 2.1% -0.1% 0.5% 0.5% 0.7% 0.1% 1.1% 5.2% 0.7%
Romania H . . . . 0.8% 3.1% 5.4% 4.8% 4.4% 4.3% 3.8% 3.8% 4.5% 4.4%
B 6.1% -2.2% 8.5% 9.6% 0.3% 1.2% 3.2% 3.6% 3.0% 3.1% 2.5% 2.4% 4.4% 2.8%
L . . . . -0.2% -0.9% 1.0% 1.7% 1.7% 1.7% 1.0% 0.9% 4.2% 1.0%
Santa Maria FIR H . . . . 1.3% 6.5% 4.0% 3.6% 3.3% 3.4% 3.1% 3.6% 6.3% 4.1%
B 8.8% 11% 7.5% 2.9% 0.9% 4.7% 2.1% 2.3% 2.1% 2.2% 1.6% 2.3% 6.2% 2.7%
L . . . . 0.4% 2.9% 0.5% 0.8% 0.7% 0.9% 0.3% 0.9% 6.1% 1.2%
Serbia&Montenegro H . . . . 7.7% 6.0% 5.3% 4.4% 4.0% 4.1% 3.6% 5.0% . .
B 9.3% 2.3% 5.6% 9.5% 7.3% 4.0% 3.3% 3.3% 2.8% 3.0% 2.3% 3.7% . .
L . . . . 6.7% 1.8% 1.0% 1.6% 1.5% 1.5% 0.8% 2.1% . .
Slovakia H . . . . -0.3% 5.6% 4.5% 4.1% 3.7% 3.4% 2.9% 3.4% 5.3% 4.2%
B 7.2% 6.4% 3.5% 10% -0.8% 3.7% 2.4% 2.9% 2.4% 2.5% 2.0% 2.2% 5.2% 2.8%
L . . . . -1.3% 1.5% 0.4% 1.0% 1.1% 1.2% 0.5% 0.6% 5.1% 1.0%
Slovenia H . . . . 9.8% 9.7% 4.9% 3.7% 3.4% 3.4% 3.0% 5.4% 6.0% 5.0%
B -0.2% 1.7% 9.3% 9.7% 9.4% 7.8% 3.2% 2.8% 2.4% 2.5% 1.9% 4.2% 5.9% 3.7%
L . . . . 8.9% 5.7% 1.0% 1.1% 1.0% 1.1% 0.4% 2.7% 5.8% 2.0%
Spain H . . . . 3.3% 4.5% 4.2% 3.5% 2.9% 3.0% 2.5% 3.4% 5.1% 3.6%
B 3.3% 7.7% 6.4% 4.8% 2.9% 2.7% 2.1% 2.3% 1.8% 1.9% 1.3% 2.1% 5.0% 2.1%
L . . . . 2.5% 0.7% 0.1% 0.6% 0.4% 0.4% -0.3% 0.6% 4.9% 0.4%

EUROCONTROL Seven-Year Forecast Autumn 2019 – Annex 2: Detailed Forecast
STATFOR Doc 659 Annex 2 Detailed Forecast 15/10/19
Page 11
IFR Movements
(Growth) 2015 2016 2017 2018 2019 2020 2021 2022 2023 2024 2025
AAGR 2019-2025
AAGR RP2
2015-2019
AAGR RP3
2020-2024
Sweden H . . . . 0.2% 3.2% 3.2% 2.7% 2.4% 1.9% 1.4% 2.2% 2.4% 2.7%
B 1.6% 2.2% 5.4% 2.8% -0.1% 1.8% 1.6% 1.7% 1.5% 1.6% 1.0% 1.3% 2.3% 1.6%
L . . . . -0.5% 0.1% -0.3% 0.4% 0.2% 0.3% -0.3% -0.0% 2.3% 0.1%
Switzerland H . . . . 2.0% 3.9% 3.0% 2.6% 2.1% 2.3% 1.8% 2.5% 2.9% 2.8%
B 1.2% 2.3% 3.8% 5.2% 1.7% 2.3% 1.4% 1.8% 1.4% 1.7% 0.9% 1.6% 2.8% 1.7%
L . . . . 1.3% 0.5% -0.4% 0.4% 0.1% 0.5% -0.3% 0.3% 2.7% 0.2%
Turkey H . . . . 0.8% 4.9% 7.2% 5.9% 5.3% 5.7% 5.2% 5.0% . .
B 6.8% -1.5% 6.0% 8.2% 0.2% 3.0% 5.0% 5.1% 4.0% 4.4% 3.8% 3.6% . .
L . . . . -0.5% 1.0% 2.8% 3.6% 3.6% 3.0% 2.5% 2.3% . .
Ukraine H . . . . 14% 11% 7.6% 6.1% 5.6% 5.5% 4.8% 7.7% . .
B -33% -8.7% 19% 18% 13% 8.1% 4.6% 4.4% 4.0% 3.9% 3.1% 5.8% . .
L . . . . 12% 5.4% 1.6% 2.4% 2.1% 2.1% 1.4% 3.8% . .
UK H . . . . 1.7% 2.7% 2.3% 3.0% 1.8% 1.7% 1.5% 2.1% 2.8% 2.3%
B 2.4% 5.4% 3.5% 0.9% 1.5% 1.7% 1.2% 2.1% 1.3% 1.3% 0.8% 1.4% 2.7% 1.5%
L . . . . 1.0% -0.1% 0.1% 0.4% 0.3% 0.4% -0.3% 0.3% 2.6% 0.2%
ECAC H . . . . 1.4% 3.9% 3.6% 3.1% 2.7% 2.7% 2.4% 2.8% 2.7% 3.2%
B 1.6% 2.8% 4.0% 3.8% 1.1% 2.3% 1.9% 2.2% 1.8% 1.9% 1.4% 1.8% 2.6% 2.0%
L . . . . 0.6% 0.5% 0.1% 0.7% 0.6% 0.7% 0.1% 0.5% 2.5% 0.5%
ESRA08 H . . . . 1.5% 3.9% 3.5% 3.1% 2.6% 2.7% 2.3% 2.8% 2.6% 3.2%
B 1.5% 2.7% 3.8% 3.6% 1.1% 2.3% 1.9% 2.2% 1.8% 1.9% 1.4% 1.8% 2.5% 2.0%
L . . . . 0.7% 0.5% 0.1% 0.7% 0.6% 0.7% 0.1% 0.5% 2.5% 0.5%
Baltic FAB H . . . . 4.5% 5.5% 4.3% 3.1% 2.7% 2.7% 2.2% 3.6% 5.3% 3.6%
B 0.3% 6.6% 5.5% 9.9% 4.1% 3.6% 2.0% 2.2% 1.9% 2.0% 1.2% 2.4% 5.3% 2.3%
L . . . . 3.7% 1.5% -0.1% 0.6% 0.5% 0.7% 0.0% 1.0% 5.2% 0.6%
BLUE MED FAB H . . . . 4.5% 5.3% 4.6% 4.1% 3.8% 4.0% 3.5% 4.3% 4.1% 4.3%
B 2.0% 1.9% 4.8% 7.1% 4.1% 3.4% 2.5% 2.8% 2.6% 2.7% 2.1% 2.9% 4.0% 2.8%
L . . . . 3.6% 1.3% 0.3% 1.1% 1.1% 1.2% 0.6% 1.3% 3.9% 1.0%
Danube FAB H . . . . 3.1% 6.2% 5.4% 4.7% 4.3% 4.3% 3.8% 4.5% 5.4% 5.0%
B 8.0% 1.0% 5.1% 9.9% 2.6% 4.3% 3.3% 3.6% 3.0% 3.1% 2.4% 3.2% 5.3% 3.5%
L . . . . 2.1% 2.2% 1.2% 1.9% 1.7% 1.7% 1.0% 1.7% 5.2% 1.7%
FAB CE H . . . . 4.1% 5.7% 4.2% 3.3% 3.0% 2.9% 2.5% 3.7% 4.5% 3.8%
B 3.8% 3.0% 4.5% 7.4% 3.7% 3.8% 2.4% 2.5% 2.1% 2.2% 1.6% 2.6% 4.5% 2.6%
L . . . . 3.3% 1.7% 0.3% 0.9% 0.8% 0.9% 0.2% 1.1% 4.4% 0.9%
FABEC H . . . . 1.8% 3.7% 3.1% 2.5% 2.0% 2.1% 1.9% 2.4% 2.7% 2.7%
B 1.7% 3.2% 3.4% 3.1% 1.5% 2.2% 1.5% 1.8% 1.5% 1.5% 1.0% 1.6% 2.6% 1.7%
L . . . . 1.0% 0.3% -0.2% 0.4% 0.2% 0.4% -0.3% 0.3% 2.5% 0.2%
NEFAB H . . . . 1.0% 3.5% 2.7% 2.3% 2.1% 1.8% 1.3% 2.1% 1.1% 2.5%
B -1.5% -0.9% 2.5% 4.5% 0.6% 2.0% 0.9% 1.2% 1.0% 1.1% 0.6% 1.1% 1.0% 1.2%
L . . . . 0.3% 0.3% -0.9% -0.3% -0.3% -0.2% -0.8% -0.3% 0.9% -0.3%
South West FAB H . . . . 3.2% 4.6% 4.1% 3.4% 2.8% 2.9% 2.5% 3.4% 5.3% 3.6%
B 3.1% 8.3% 6.7% 5.3% 2.9% 2.8% 2.0% 2.1% 1.7% 1.8% 1.2% 2.1% 5.2% 2.1%
L . . . . 2.4% 0.8% -0.1% 0.4% 0.3% 0.3% -0.4% 0.5% 5.2% 0.4%
EUROCONTROL Seven-Year Forecast Autumn 2019 – Annex 2: Detailed Forecast
STATFOR Doc 659 Annex 2 Detailed Forecast 15/10/19
Page 12
IFR Movements
(Growth) 2015 2016 2017 2018 2019 2020 2021 2022 2023 2024 2025
AAGR 2019-2025
AAGR RP2
2015-2019
AAGR RP3
2020-2024
UK-Ireland FAB H . . . . 1.7% 2.6% 2.3% 3.1% 1.9% 1.8% 1.5% 2.1% 2.8% 2.3%
B 2.5% 5.5% 3.5% 0.9% 1.4% 1.6% 1.2% 2.1% 1.4% 1.4% 0.8% 1.4% 2.8% 1.5%
L . . . . 1.0% -0.1% 0.1% 0.5% 0.3% 0.4% -0.3% 0.3% 2.7% 0.2%
DK-SE FAB H . . . . -0.5% 3.3% 3.0% 2.6% 2.3% 1.9% 1.5% 2.0% 1.5% 2.6%
B 0.6% 2.3% 2.6% 2.7% -0.9% 1.9% 1.4% 1.7% 1.4% 1.5% 1.0% 1.1% 1.5% 1.6%
L . . . . -1.2% 0.2% -0.4% 0.3% 0.1% 0.3% -0.4% -0.2% 1.4% 0.1%
EU28 H . . . . 2.1% 4.0% 3.3% 2.9% 2.5% 2.5% 2.2% 2.8% 2.9% 3.0%
B 1.6% 3.1% 3.8% 3.9% 1.7% 2.5% 1.7% 2.0% 1.6% 1.8% 1.2% 1.8% 2.8% 1.9%
L . . . . 1.3% 0.6% -0.1% 0.5% 0.4% 0.5% -0.1% 0.4% 2.7% 0.4%
RP2Region H . . . . 1.9% 4.0% 3.2% 2.9% 2.4% 2.4% 2.1% 2.7% 2.7% 3.0%
B 1.4% 2.9% 3.6% 3.7% 1.6% 2.4% 1.6% 2.0% 1.6% 1.7% 1.2% 1.7% 2.6% 1.9%
L . . . . 1.2% 0.6% -0.1% 0.4% 0.3% 0.5% -0.2% 0.4% 2.6% 0.3%
EUROCONTROL Seven-Year Forecast Autumn 2019 – Annex 2: Detailed Forecast
STATFOR Doc 659 Annex 2 Detailed Forecast 15/10/19
Page 13
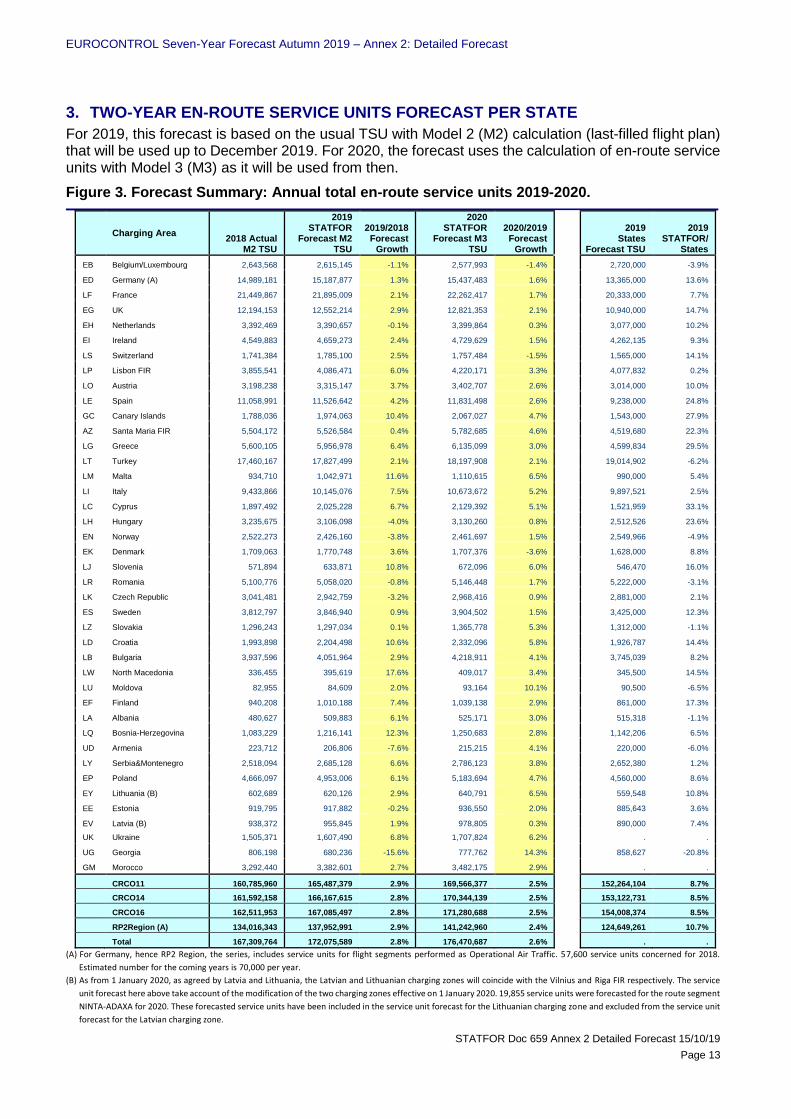
3. TWO-YEAR EN-ROUTE SERVICE UNITS FORECAST PER STATE
For 2019, this forecast is based on the usual TSU with Model 2 (M2) calculation (last-filled flight plan) that will be used up to December 2019. For 2020, the forecast uses the calculation of en-route service units with Model 3 (M3) as it will be used from then.
Figure 3. Forecast Summary: Annual total en-route service units 2019-2020.
Charging Area 2018 Actual
M2 TSU
2019 STATFOR
Forecast M2 TSU
2019/2018 Forecast
Growth
2020 STATFOR
Forecast M3 TSU
2020/2019 Forecast
Growth
2019 States
Forecast TSU
2019 STATFOR/
States
EB Belgium/Luxembourg 2,643,568 2,615,145 -1.1% 2,577,993 -1.4%
2,720,000 -3.9%
ED Germany (A) 14,989,181 15,187,877 1.3% 15,437,483 1.6%
13,365,000 13.6%
LF France 21,449,867 21,895,009 2.1% 22,262,417 1.7%
20,333,000 7.7%
EG UK 12,194,153 12,552,214 2.9% 12,821,353 2.1%
10,940,000 14.7%
EH Netherlands 3,392,469 3,390,657 -0.1% 3,399,864 0.3%
3,077,000 10.2%
EI Ireland 4,549,883 4,659,273 2.4% 4,729,629 1.5%
4,262,135 9.3%
LS Switzerland 1,741,384 1,785,100 2.5% 1,757,484 -1.5%
1,565,000 14.1%
LP Lisbon FIR 3,855,541 4,086,471 6.0% 4,220,171 3.3%
4,077,832 0.2%
LO Austria 3,198,238 3,315,147 3.7% 3,402,707 2.6%
3,014,000 10.0%
LE Spain 11,058,991 11,526,642 4.2% 11,831,498 2.6%
9,238,000 24.8%
GC Canary Islands 1,788,036 1,974,063 10.4% 2,067,027 4.7%
1,543,000 27.9%
AZ Santa Maria FIR 5,504,172 5,526,584 0.4% 5,782,685 4.6%
4,519,680 22.3%
LG Greece 5,600,105 5,956,978 6.4% 6,135,099 3.0%
4,599,834 29.5%
LT Turkey 17,460,167 17,827,499 2.1% 18,197,908 2.1%
19,014,902 -6.2%
LM Malta 934,710 1,042,971 11.6% 1,110,615 6.5%
990,000 5.4%
LI Italy 9,433,866 10,145,076 7.5% 10,673,672 5.2%
9,897,521 2.5%
LC Cyprus 1,897,492 2,025,228 6.7% 2,129,392 5.1%
1,521,959 33.1%
LH Hungary 3,235,675 3,106,098 -4.0% 3,130,260 0.8%
2,512,526 23.6%
EN Norway 2,522,273 2,426,160 -3.8% 2,461,697 1.5%
2,549,966 -4.9%
EK Denmark 1,709,063 1,770,748 3.6% 1,707,376 -3.6%
1,628,000 8.8%
LJ Slovenia 571,894 633,871 10.8% 672,096 6.0%
546,470 16.0%
LR Romania 5,100,776 5,058,020 -0.8% 5,146,448 1.7%
5,222,000 -3.1%
LK Czech Republic 3,041,481 2,942,759 -3.2% 2,968,416 0.9%
2,881,000 2.1%
ES Sweden 3,812,797 3,846,940 0.9% 3,904,502 1.5%
3,425,000 12.3%
LZ Slovakia 1,296,243 1,297,034 0.1% 1,365,778 5.3%
1,312,000 -1.1%
LD Croatia 1,993,898 2,204,498 10.6% 2,332,096 5.8%
1,926,787 14.4%
LB Bulgaria 3,937,596 4,051,964 2.9% 4,218,911 4.1%
3,745,039 8.2%
LW North Macedonia 336,455 395,619 17.6% 409,017 3.4%
345,500 14.5%
LU Moldova 82,955 84,609 2.0% 93,164 10.1%
90,500 -6.5%
EF Finland 940,208 1,010,188 7.4% 1,039,138 2.9%
861,000 17.3%
LA Albania 480,627 509,883 6.1% 525,171 3.0%
515,318 -1.1%
LQ Bosnia-Herzegovina 1,083,229 1,216,141 12.3% 1,250,683 2.8%
1,142,206 6.5%
UD Armenia 223,712 206,806 -7.6% 215,215 4.1%
220,000 -6.0%
LY Serbia&Montenegro 2,518,094 2,685,128 6.6% 2,786,123 3.8%
2,652,380 1.2%
EP Poland 4,666,097 4,953,006 6.1% 5,183,694 4.7%
4,560,000 8.6%
EY Lithuania (B) 602,689 620,126 2.9% 640,791 6.5%
559,548 10.8%
EE Estonia 919,795 917,882 -0.2% 936,550 2.0%
885,643 3.6%
EV Latvia (B) 938,372 955,845 1.9% 978,805 0.3%
890,000 7.4%
UK Ukraine 1,505,371 1,607,490 6.8% 1,707,824 6.2%
. .
UG Georgia 806,198 680,236 -15.6% 777,762 14.3% 858,627 -20.8%
GM Morocco 3,292,440 3,382,601 2.7% 3,482,175 2.9% . .
CRCO11 160,785,960 165,487,379 2.9% 169,566,377 2.5% 152,264,104 8.7%
CRCO14 161,592,158 166,167,615 2.8% 170,344,139 2.5% 153,122,731 8.5%
CRCO16 162,511,953 167,085,497 2.8% 171,280,688 2.5% 154,008,374 8.5%
RP2Region (A) 134,016,343 137,952,991 2.9% 141,242,960 2.4% 124,649,261 10.7%
Total 167,309,764 172,075,589 2.8% 176,470,687 2.6% . .
(A) For Germany, hence RP2 Region, the series, includes service units for flight segments performed as Operational Air Traffic. 57,600 service units concerned for 2018.
Estimated number for the coming years is 70,000 per year.
(B) As from 1 January 2020, as agreed by Latvia and Lithuania, the Latvian and Lithuanian charging zones will coincide with the Vilnius and Riga FIR respectively. The service
unit forecast here above take account of the modification of the two charging zones effective on 1 January 2020. 19,855 service units were forecasted for the route segment
NINTA-ADAXA for 2020. These forecasted service units have been included in the service unit forecast for the Lithuanian charging zone and excluded from the service unit
forecast for the Latvian charging zone.

EUROCONTROL Seven-Year Forecast Autumn 2019 – Annex 2: Detailed Forecast
STATFOR Doc 659 Annex 2 Detailed Forecast 15/10/19
Page 14
Figure 4. Forecast Summary: Annual chargeable en-route service units 2019-2020.
Charging Area 2018 Actual
M2 TSU
2019 STATFOR
Forecast M2 TSU
2020 STATFOR
Forecast M3 TSU
2018 Actual Exempted
SU in %
2018 Actual Chargeable
SU in %
2019 Chargeable
SU M2 Estimate
2020 Chargeable
SU M3 Estimate
EB Belgium/Luxembourg 2,643,568 2,615,145 2,577,993 0.6% 99.4% 2,599,700 2,562,800
ED Germany (A) 14,989,181 15,187,877 15,437,483 0.8% 99.2% 15,066,900 15,314,500
LF France 21,449,867 21,895,009 22,262,417 0.8% 99.2% 21,714,200 22,078,600
EG UK 12,194,153 12,552,214 12,821,353 1.1% 98.9% 12,409,100 12,675,100
EH Netherlands 3,392,469 3,390,657 3,399,864 1.0% 99.0% 3,357,900 3,367,000
EI Ireland 4,549,883 4,659,273 4,729,629 0.9% 99.1% 4,618,100 4,687,800
LS Switzerland 1,741,384 1,785,100 1,757,484 0.2% 99.8% 1,781,500 1,753,900
LP Lisbon FIR 3,855,541 4,086,471 4,220,171 0.7% 99.3% 4,056,300 4,189,000
LO Austria 3,198,238 3,315,147 3,402,707 0.4% 99.6% 3,301,700 3,388,900
LE Spain 11,058,991 11,526,642 11,831,498 0.7% 99.3% 11,443,500 11,746,200
GC Canary Islands 1,788,036 1,974,063 2,067,027 0.7% 99.3% 1,959,800 2,052,100
AZ Santa Maria FIR 5,504,172 5,526,584 5,782,685 1.4% 98.6% 5,448,800 5,701,200
LG Greece 5,600,105 5,956,978 6,135,099 1.6% 98.4% 5,862,500 6,037,800
LT Turkey 17,460,167 17,827,499 18,197,908 0.6% 99.4% 17,720,400 18,088,600
LM Malta 934,710 1,042,971 1,110,615 3.6% 96.4% 1,005,100 1,070,300
LI Italy 9,433,866 10,145,076 10,673,672 1.5% 98.5% 9,994,200 10,515,000
LC Cyprus 1,897,492 2,025,228 2,129,392 1.2% 98.8% 2,000,800 2,103,700
LH Hungary 3,235,675 3,106,098 3,130,260 0.9% 99.1% 3,078,200 3,102,200
EN Norway 2,522,273 2,426,160 2,461,697 0.9% 99.1% 2,404,900 2,440,100
EK Denmark 1,709,063 1,770,748 1,707,376 0.7% 99.3% 1,758,900 1,695,900
LJ Slovenia 571,894 633,871 672,096 0.3% 99.7% 632,000 670,100
LR Romania 5,100,776 5,058,020 5,146,448 0.8% 99.2% 5,016,800 5,104,500
LK Czech Republic 3,041,481 2,942,759 2,968,416 1.2% 98.8% 2,906,900 2,932,200
ES Sweden 3,812,797 3,846,940 3,904,502 0.5% 99.5% 3,827,400 3,884,700
LZ Slovakia 1,296,243 1,297,034 1,365,778 0.9% 99.1% 1,284,800 1,352,900
LD Croatia 1,993,898 2,204,498 2,332,096 0.2% 99.8% 2,199,800 2,327,200
LB Bulgaria 3,937,596 4,051,964 4,218,911 0.8% 99.2% 4,018,700 4,184,300
LW FYROM 336,455 395,619 409,017 0.1% 99.9% 395,300 408,700
LU Moldova 82,955 84,609 93,164 0.1% 99.9% 84,500 93,100
EF Finland 940,208 1,010,188 1,039,138 0.4% 99.6% 1,006,500 1,035,300
LA Albania 480,627 509,883 525,171 0.4% 99.6% 507,600 522,800
LQ Bosnia-Herzegovina 1,083,229 1,216,141 1,250,683 0.1% 99.9% 1,215,000 1,249,500
UD Armenia 223,712 206,806 215,215 0.1% 99.9% 206,700 215,100
LY Serbia&Montenegro 2,518,094 2,685,128 2,786,123 0.1% 99.9% 2,682,800 2,783,700
EP Poland 4,666,097 4,953,006 5,183,694 0.7% 99.3% 4,917,000 5,146,000
EY Lithuania (B) 602,689 620,126 640,791 0.6% 99.4% 616,200 636,700
EE Estonia 919,795 917,882 936,550 0.2% 99.8% 916,300 934,900
EV Latvia (B) 938,372 955,845 978,805 0.7% 99.3% 949,400 972,200
UK Ukraine 1,505,371 1,607,490 1,707,824 0.4% 99.6% 1,600,600 1,700,500
UG Georgia 806,198 680,236 777,762 1.0% 99.0% 673,600 770,200
GM Morocco 3,292,440 3,382,601 3,482,175 0.0% 100.0% 3,382,600 3,482,200
CRCO11 160,785,960 165,487,379 169,566,377 0.9% 99.1% 164,052,100 168,095,700
CRCO14 161,592,158 166,167,615 170,344,139 0.9% 99.1% 164,725,500 168,865,800
CRCO16 162,511,953 167,085,497 171,280,688 0.9% 99.1% 165,642,000 169,800,900
RP2Region (A) 134,016,343 137,952,991 141,242,960 0.9% 99.1% 136,709,500 139,969,800
Total 167,309,764 172,075,589 176,470,687 0.8% 99.2% 170,624,900 174,982,900
(A) For Germany, hence RP2 Region, the series, includes service units for flight segments performed as Operational Air Traffic. 57,600 service units concerned for 2018.
Estimated number for the coming years is 70,000 per year.
(B) As from 1 January 2020, as agreed by Latvia and Lithuania, the Latvian and Lithuanian charging zones will coincide with the Vilnius and Riga FIR respectively. The service
unit forecast here above take account of the modification of the two charging zones effective on 1 January 2020, 19,855service units were forecasted for the route segment
NINTA-ADAXA for 2020. These forecasted service units have been included in the service unit forecast for the Lithuanian charging zone and excluded from the service unit
forecast for the Latvian charging zone.
EUROCONTROL Seven-Year Forecast Autumn 2019 – Annex 2: Detailed Forecast
STATFOR Doc 659 Annex 2 Detailed Forecast 15/10/19
Page 15
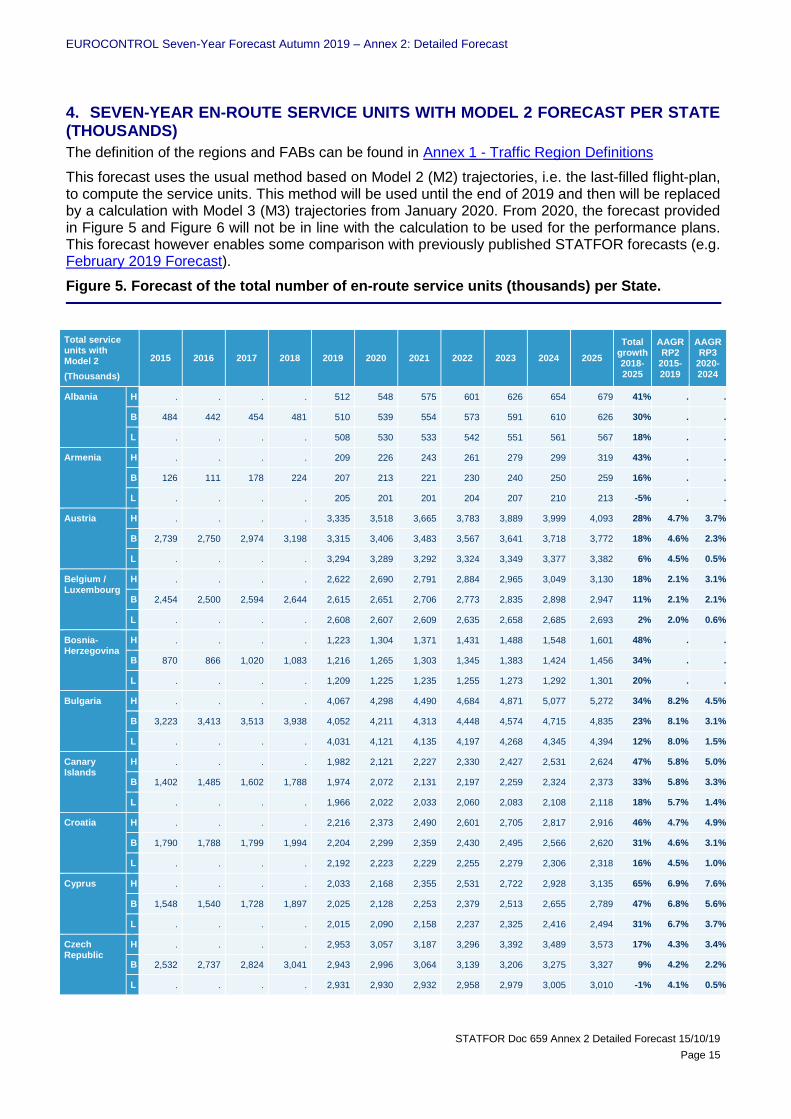
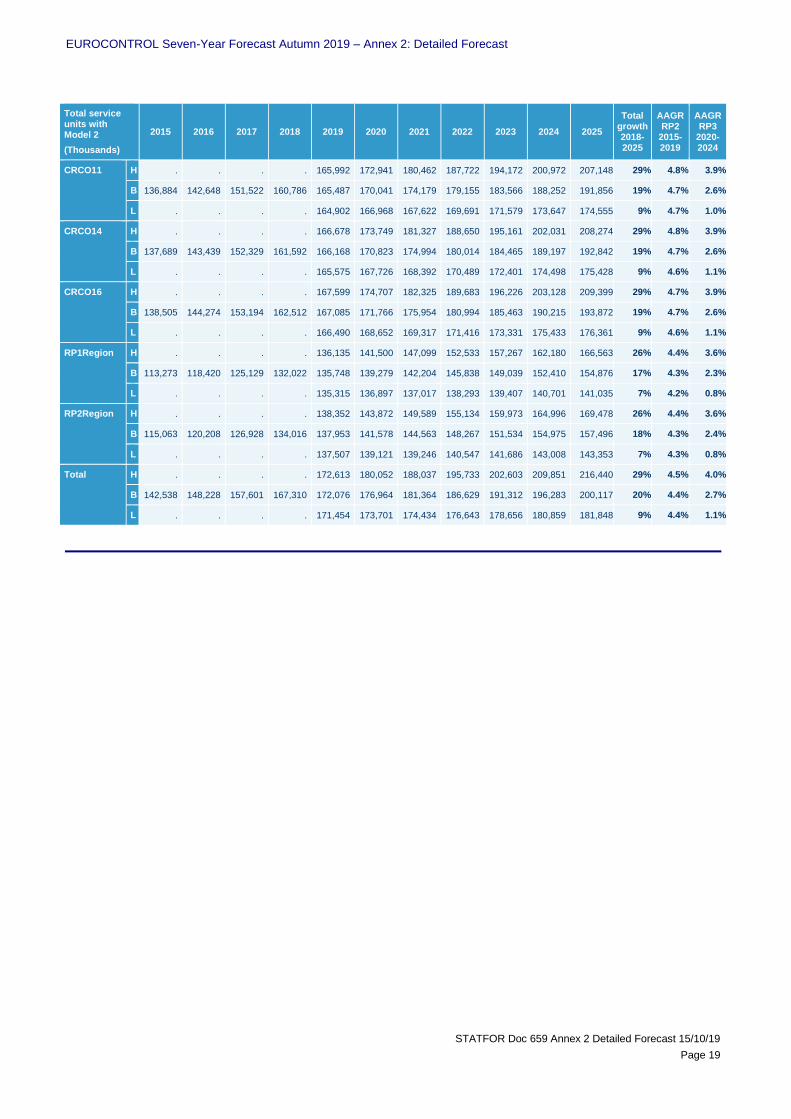
4. SEVEN-YEAR EN-ROUTE SERVICE UNITS WITH MODEL 2 FORECAST PER STATE (THOUSANDS)
The definition of the regions and FABs can be found in Annex 1 - Traffic Region Definitions
This forecast uses the usual method based on Model 2 (M2) trajectories, i.e. the last-filled flight-plan, to compute the service units. This method will be used until the end of 2019 and then will be replaced by a calculation with Model 3 (M3) trajectories from January 2020. From 2020, the forecast provided in Figure 5 and Figure 6 will not be in line with the calculation to be used for the performance plans. This forecast however enables some comparison with previously published STATFOR forecasts (e.g. February 2019 Forecast).
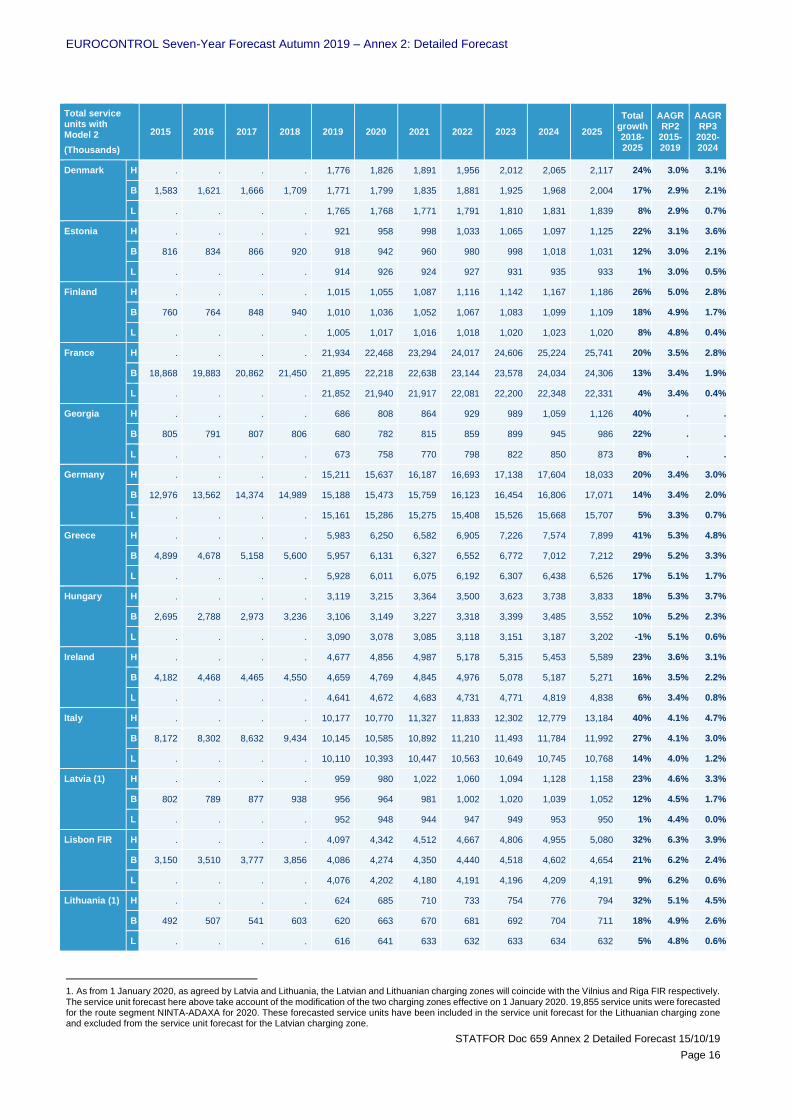
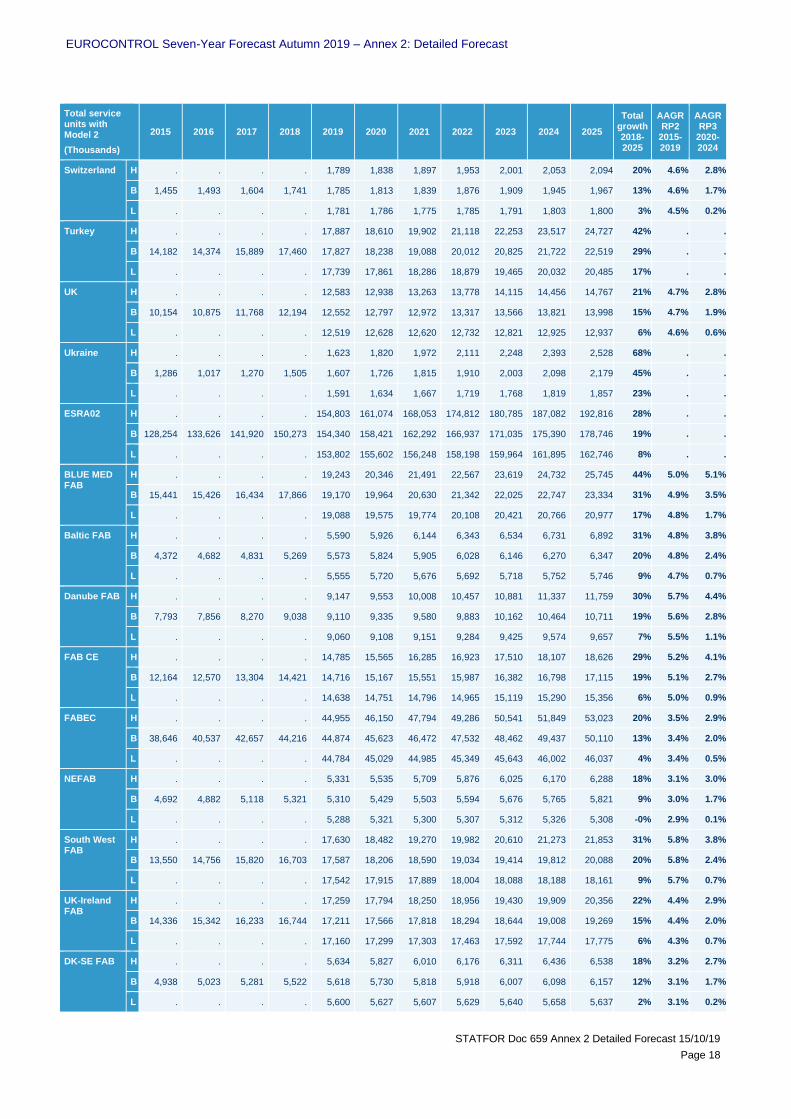
Figure 5. Forecast of the total number of en-route service units (thousands) per State.
Total service units with Model 2
(Thousands)
2015 2016 2017 2018 2019 2020 2021 2022 2023 2024 2025
Total growth 2018-2025
AAGR RP2
2015-2019
AAGR RP3
2020-2024
Albania H . . . . 512 548 575 601 626 654 679 41% . .
B 484 442 454 481 510 539 554 573 591 610 626 30% . .
L . . . . 508 530 533 542 551 561 567 18% . .
Armenia H . . . . 209 226 243 261 279 299 319 43% . .
B 126 111 178 224 207 213 221 230 240 250 259 16% . .
L . . . . 205 201 201 204 207 210 213 -5% . .
Austria H . . . . 3,335 3,518 3,665 3,783 3,889 3,999 4,093 28% 4.7% 3.7%
B 2,739 2,750 2,974 3,198 3,315 3,406 3,483 3,567 3,641 3,718 3,772 18% 4.6% 2.3%
L . . . . 3,294 3,289 3,292 3,324 3,349 3,377 3,382 6% 4.5% 0.5%
Belgium / Luxembourg
H . . . . 2,622 2,690 2,791 2,884 2,965 3,049 3,130 18% 2.1% 3.1%
B 2,454 2,500 2,594 2,644 2,615 2,651 2,706 2,773 2,835 2,898 2,947 11% 2.1% 2.1%
L . . . . 2,608 2,607 2,609 2,635 2,658 2,685 2,693 2% 2.0% 0.6%
Bosnia-Herzegovina
H . . . . 1,223 1,304 1,371 1,431 1,488 1,548 1,601 48% . .
B 870 866 1,020 1,083 1,216 1,265 1,303 1,345 1,383 1,424 1,456 34% . .
L . . . . 1,209 1,225 1,235 1,255 1,273 1,292 1,301 20% . .
Bulgaria H . . . . 4,067 4,298 4,490 4,684 4,871 5,077 5,272 34% 8.2% 4.5%
B 3,223 3,413 3,513 3,938 4,052 4,211 4,313 4,448 4,574 4,715 4,835 23% 8.1% 3.1%
L . . . . 4,031 4,121 4,135 4,197 4,268 4,345 4,394 12% 8.0% 1.5%
Canary Islands
H . . . . 1,982 2,121 2,227 2,330 2,427 2,531 2,624 47% 5.8% 5.0%
B 1,402 1,485 1,602 1,788 1,974 2,072 2,131 2,197 2,259 2,324 2,373 33% 5.8% 3.3%
L . . . . 1,966 2,022 2,033 2,060 2,083 2,108 2,118 18% 5.7% 1.4%
Croatia H . . . . 2,216 2,373 2,490 2,601 2,705 2,817 2,916 46% 4.7% 4.9%
B 1,790 1,788 1,799 1,994 2,204 2,299 2,359 2,430 2,495 2,566 2,620 31% 4.6% 3.1%
L . . . . 2,192 2,223 2,229 2,255 2,279 2,306 2,318 16% 4.5% 1.0%
Cyprus H . . . . 2,033 2,168 2,355 2,531 2,722 2,928 3,135 65% 6.9% 7.6%
B 1,548 1,540 1,728 1,897 2,025 2,128 2,253 2,379 2,513 2,655 2,789 47% 6.8% 5.6%
L . . . . 2,015 2,090 2,158 2,237 2,325 2,416 2,494 31% 6.7% 3.7%
Czech Republic
H . . . . 2,953 3,057 3,187 3,296 3,392 3,489 3,573 17% 4.3% 3.4%
B 2,532 2,737 2,824 3,041 2,943 2,996 3,064 3,139 3,206 3,275 3,327 9% 4.2% 2.2%
L . . . . 2,931 2,930 2,932 2,958 2,979 3,005 3,010 -1% 4.1% 0.5%
EUROCONTROL Seven-Year Forecast Autumn 2019 – Annex 2: Detailed Forecast
STATFOR Doc 659 Annex 2 Detailed Forecast 15/10/19
Page 16
Total service units with Model 2
(Thousands)
2015 2016 2017 2018 2019 2020 2021 2022 2023 2024 2025
Total growth 2018-2025
AAGR RP2
2015-2019
AAGR RP3
2020-2024
Denmark H . . . . 1,776 1,826 1,891 1,956 2,012 2,065 2,117 24% 3.0% 3.1%
B 1,583 1,621 1,666 1,709 1,771 1,799 1,835 1,881 1,925 1,968 2,004 17% 2.9% 2.1%
L . . . . 1,765 1,768 1,771 1,791 1,810 1,831 1,839 8% 2.9% 0.7%
Estonia H . . . . 921 958 998 1,033 1,065 1,097 1,125 22% 3.1% 3.6%
B 816 834 866 920 918 942 960 980 998 1,018 1,031 12% 3.0% 2.1%
L . . . . 914 926 924 927 931 935 933 1% 3.0% 0.5%
Finland H . . . . 1,015 1,055 1,087 1,116 1,142 1,167 1,186 26% 5.0% 2.8%
B 760 764 848 940 1,010 1,036 1,052 1,067 1,083 1,099 1,109 18% 4.9% 1.7%
L . . . . 1,005 1,017 1,016 1,018 1,020 1,023 1,020 8% 4.8% 0.4%
France H . . . . 21,934 22,468 23,294 24,017 24,606 25,224 25,741 20% 3.5% 2.8%
B 18,868 19,883 20,862 21,450 21,895 22,218 22,638 23,144 23,578 24,034 24,306 13% 3.4% 1.9%
L . . . . 21,852 21,940 21,917 22,081 22,200 22,348 22,331 4% 3.4% 0.4%
Georgia H . . . . 686 808 864 929 989 1,059 1,126 40% . .
B 805 791 807 806 680 782 815 859 899 945 986 22% . .
L . . . . 673 758 770 798 822 850 873 8% . .
Germany H . . . . 15,211 15,637 16,187 16,693 17,138 17,604 18,033 20% 3.4% 3.0%
B 12,976 13,562 14,374 14,989 15,188 15,473 15,759 16,123 16,454 16,806 17,071 14% 3.4% 2.0%
L . . . . 15,161 15,286 15,275 15,408 15,526 15,668 15,707 5% 3.3% 0.7%
Greece H . . . . 5,983 6,250 6,582 6,905 7,226 7,574 7,899 41% 5.3% 4.8%
B 4,899 4,678 5,158 5,600 5,957 6,131 6,327 6,552 6,772 7,012 7,212 29% 5.2% 3.3%
L . . . . 5,928 6,011 6,075 6,192 6,307 6,438 6,526 17% 5.1% 1.7%
Hungary H . . . . 3,119 3,215 3,364 3,500 3,623 3,738 3,833 18% 5.3% 3.7%
B 2,695 2,788 2,973 3,236 3,106 3,149 3,227 3,318 3,399 3,485 3,552 10% 5.2% 2.3%
L . . . . 3,090 3,078 3,085 3,118 3,151 3,187 3,202 -1% 5.1% 0.6%
Ireland H . . . . 4,677 4,856 4,987 5,178 5,315 5,453 5,589 23% 3.6% 3.1%
B 4,182 4,468 4,465 4,550 4,659 4,769 4,845 4,976 5,078 5,187 5,271 16% 3.5% 2.2%
L . . . . 4,641 4,672 4,683 4,731 4,771 4,819 4,838 6% 3.4% 0.8%
Italy H . . . . 10,177 10,770 11,327 11,833 12,302 12,779 13,184 40% 4.1% 4.7%
B 8,172 8,302 8,632 9,434 10,145 10,585 10,892 11,210 11,493 11,784 11,992 27% 4.1% 3.0%
L . . . . 10,110 10,393 10,447 10,563 10,649 10,745 10,768 14% 4.0% 1.2%
Latvia (1) H . . . . 959 980 1,022 1,060 1,094 1,128 1,158 23% 4.6% 3.3%
B 802 789 877 938 956 964 981 1,002 1,020 1,039 1,052 12% 4.5% 1.7%
L . . . . 952 948 944 947 949 953 950 1% 4.4% 0.0%
Lisbon FIR H . . . . 4,097 4,342 4,512 4,667 4,806 4,955 5,080 32% 6.3% 3.9%
B 3,150 3,510 3,777 3,856 4,086 4,274 4,350 4,440 4,518 4,602 4,654 21% 6.2% 2.4%
L . . . . 4,076 4,202 4,180 4,191 4,196 4,209 4,191 9% 6.2% 0.6%
Lithuania (1) H . . . . 624 685 710 733 754 776 794 32% 5.1% 4.5%
B 492 507 541 603 620 663 670 681 692 704 711 18% 4.9% 2.6%
L . . . . 616 641 633 632 633 634 632 5% 4.8% 0.6%
1. As from 1 January 2020, as agreed by Latvia and Lithuania, the Latvian and Lithuanian charging zones will coincide with the Vilnius and Riga FIR respectively. The service unit forecast here above take account of the modification of the two charging zones effective on 1 January 2020. 19,855 service units were forecasted for the route segment NINTA-ADAXA for 2020. These forecasted service units have been included in the service unit forecast for the Lithuanian charging zone and excluded from the service unit forecast for the Latvian charging zone.

EUROCONTROL Seven-Year Forecast Autumn 2019 – Annex 2: Detailed Forecast
STATFOR Doc 659 Annex 2 Detailed Forecast 15/10/19
Page 17
Total service units with Model 2
(Thousands)
2015 2016 2017 2018 2019 2020 2021 2022 2023 2024 2025
Total growth 2018-2025
AAGR RP2
2015-2019
AAGR RP3
2020-2024
Malta H . . . . 1,050 1,158 1,227 1,298 1,370 1,451 1,528 63% 7.6% 6.7%
B 823 905 916 935 1,043 1,119 1,158 1,201 1,246 1,296 1,341 43% 7.5% 4.4%
L . . . . 1,034 1,081 1,094 1,116 1,139 1,167 1,189 27% 7.3% 2.4%
Moldova H . . . . 86 98 105 113 120 128 135 63% . .
B 74 60 69 83 85 92 96 101 106 111 115 39% . .
L . . . . 83 86 88 91 93 96 98 18% . .
Morocco H . . . . 3,391 3,525 3,740 3,939 4,129 4,330 4,513 37% . .
B 2,747 2,937 3,136 3,292 3,383 3,471 3,595 3,726 3,846 3,970 4,066 23% . .
L . . . . 3,374 3,416 3,450 3,508 3,556 3,607 3,630 10% . .
Netherlands H . . . . 3,399 3,517 3,625 3,738 3,831 3,919 4,024 19% 4.2% 2.9%
B 2,893 3,100 3,223 3,392 3,391 3,467 3,530 3,615 3,687 3,754 3,820 13% 4.1% 2.1%
L . . . . 3,382 3,409 3,410 3,440 3,468 3,499 3,506 3% 4.1% 0.7%
North Macedonia
H . . . . 397 434 457 478 499 521 542 61% . .
B 264 250 301 336 396 426 439 454 469 485 497 48% . .
L . . . . 394 418 421 428 435 443 447 33% . .
Norway H . . . . 2,436 2,521 2,580 2,645 2,701 2,755 2,794 11% 1.9% 2.5%
B 2,314 2,495 2,527 2,522 2,426 2,467 2,490 2,525 2,554 2,588 2,609 3% 1.8% 1.3%
L . . . . 2,416 2,412 2,396 2,396 2,393 2,396 2,385 -5% 1.7% -0.2%
Poland H . . . . 4,966 5,261 5,456 5,633 5,803 5,979 6,122 31% 4.8% 3.8%
B 3,880 4,175 4,291 4,666 4,953 5,181 5,255 5,367 5,475 5,587 5,658 21% 4.7% 2.4%
L . . . . 4,939 5,098 5,061 5,079 5,104 5,136 5,133 10% 4.7% 0.8%
Romania H . . . . 5,080 5,255 5,518 5,773 6,010 6,260 6,488 27% 4.0% 4.3%
B 4,571 4,443 4,757 5,101 5,058 5,123 5,267 5,436 5,588 5,749 5,876 15% 3.9% 2.6%
L . . . . 5,029 4,987 5,016 5,087 5,157 5,229 5,263 3% 3.8% 0.8%
Santa Maria FIR
H . . . . 5,552 5,945 6,186 6,427 6,657 6,899 7,133 30% 5.9% 4.4%
B 4,662 5,040 5,309 5,504 5,527 5,837 5,973 6,132 6,286 6,445 6,570 19% 5.8% 3.1%
L . . . . 5,500 5,729 5,769 5,838 5,903 5,975 6,011 9% 5.7% 1.7%
Serbia & Montenegro
H . . . . 2,696 2,862 3,033 3,191 3,343 3,507 3,660 45% . .
B 1,975 2,131 2,241 2,518 2,685 2,794 2,902 3,019 3,130 3,249 3,349 33% . .
L . . . . 2,672 2,724 2,767 2,834 2,898 2,966 3,012 20% . .
Slovakia H . . . . 1,302 1,404 1,476 1,546 1,613 1,681 1,743 34% 4.5% 5.2%
B 1,071 1,138 1,189 1,296 1,297 1,374 1,414 1,461 1,506 1,552 1,591 23% 4.4% 3.7%
L . . . . 1,291 1,343 1,352 1,372 1,392 1,414 1,425 10% 4.3% 1.8%
Slovenia H . . . . 636 693 731 766 800 835 868 52% 6.7% 5.6%
B 466 502 525 572 634 679 702 727 751 777 798 40% 6.7% 4.2%
L . . . . 631 663 671 684 696 710 718 26% 6.6% 2.4%
Spain H . . . . 11,552 12,019 12,531 12,985 13,376 13,787 14,149 28% 5.7% 3.6%
B 8,997 9,761 10,441 11,059 11,527 11,859 12,109 12,397 12,636 12,886 13,060 18% 5.6% 2.3%
L . . . . 11,500 11,690 11,676 11,754 11,809 11,871 11,852 7% 5.6% 0.6%
Sweden H . . . . 3,859 4,001 4,119 4,220 4,300 4,370 4,421 16% 3.3% 2.5%
B 3,355 3,402 3,615 3,813 3,847 3,932 3,983 4,037 4,082 4,130 4,153 9% 3.2% 1.4%
L . . . . 3,835 3,859 3,836 3,837 3,830 3,827 3,798 -0% 3.1% -0.0%
EUROCONTROL Seven-Year Forecast Autumn 2019 – Annex 2: Detailed Forecast
STATFOR Doc 659 Annex 2 Detailed Forecast 15/10/19
Page 18
Total service units with Model 2
(Thousands)
2015 2016 2017 2018 2019 2020 2021 2022 2023 2024 2025
Total growth 2018-2025
AAGR RP2
2015-2019
AAGR RP3
2020-2024
Switzerland H . . . . 1,789 1,838 1,897 1,953 2,001 2,053 2,094 20% 4.6% 2.8%
B 1,455 1,493 1,604 1,741 1,785 1,813 1,839 1,876 1,909 1,945 1,967 13% 4.6% 1.7%
L . . . . 1,781 1,786 1,775 1,785 1,791 1,803 1,800 3% 4.5% 0.2%
Turkey H . . . . 17,887 18,610 19,902 21,118 22,253 23,517 24,727 42% . .
B 14,182 14,374 15,889 17,460 17,827 18,238 19,088 20,012 20,825 21,722 22,519 29% . .
L . . . . 17,739 17,861 18,286 18,879 19,465 20,032 20,485 17% . .
UK H . . . . 12,583 12,938 13,263 13,778 14,115 14,456 14,767 21% 4.7% 2.8%
B 10,154 10,875 11,768 12,194 12,552 12,797 12,972 13,317 13,566 13,821 13,998 15% 4.7% 1.9%
L . . . . 12,519 12,628 12,620 12,732 12,821 12,925 12,937 6% 4.6% 0.6%
Ukraine H . . . . 1,623 1,820 1,972 2,111 2,248 2,393 2,528 68% . .
B 1,286 1,017 1,270 1,505 1,607 1,726 1,815 1,910 2,003 2,098 2,179 45% . .
L . . . . 1,591 1,634 1,667 1,719 1,768 1,819 1,857 23% . .
ESRA02 H . . . . 154,803 161,074 168,053 174,812 180,785 187,082 192,816 28% . .
B 128,254 133,626 141,920 150,273 154,340 158,421 162,292 166,937 171,035 175,390 178,746 19% . .
L . . . . 153,802 155,602 156,248 158,198 159,964 161,895 162,746 8% . .
BLUE MED FAB
H . . . . 19,243 20,346 21,491 22,567 23,619 24,732 25,745 44% 5.0% 5.1%
B 15,441 15,426 16,434 17,866 19,170 19,964 20,630 21,342 22,025 22,747 23,334 31% 4.9% 3.5%
L . . . . 19,088 19,575 19,774 20,108 20,421 20,766 20,977 17% 4.8% 1.7%
Baltic FAB H . . . . 5,590 5,926 6,144 6,343 6,534 6,731 6,892 31% 4.8% 3.8%
B 4,372 4,682 4,831 5,269 5,573 5,824 5,905 6,028 6,146 6,270 6,347 20% 4.8% 2.4%
L . . . . 5,555 5,720 5,676 5,692 5,718 5,752 5,746 9% 4.7% 0.7%
Danube FAB H . . . . 9,147 9,553 10,008 10,457 10,881 11,337 11,759 30% 5.7% 4.4%
B 7,793 7,856 8,270 9,038 9,110 9,335 9,580 9,883 10,162 10,464 10,711 19% 5.6% 2.8%
L . . . . 9,060 9,108 9,151 9,284 9,425 9,574 9,657 7% 5.5% 1.1%
FAB CE H . . . . 14,785 15,565 16,285 16,923 17,510 18,107 18,626 29% 5.2% 4.1%
B 12,164 12,570 13,304 14,421 14,716 15,167 15,551 15,987 16,382 16,798 17,115 19% 5.1% 2.7%
L . . . . 14,638 14,751 14,796 14,965 15,119 15,290 15,356 6% 5.0% 0.9%
FABEC H . . . . 44,955 46,150 47,794 49,286 50,541 51,849 53,023 20% 3.5% 2.9%
B 38,646 40,537 42,657 44,216 44,874 45,623 46,472 47,532 48,462 49,437 50,110 13% 3.4% 2.0%
L . . . . 44,784 45,029 44,985 45,349 45,643 46,002 46,037 4% 3.4% 0.5%
NEFAB H . . . . 5,331 5,535 5,709 5,876 6,025 6,170 6,288 18% 3.1% 3.0%
B 4,692 4,882 5,118 5,321 5,310 5,429 5,503 5,594 5,676 5,765 5,821 9% 3.0% 1.7%
L . . . . 5,288 5,321 5,300 5,307 5,312 5,326 5,308 -0% 2.9% 0.1%
South West FAB
H . . . . 17,630 18,482 19,270 19,982 20,610 21,273 21,853 31% 5.8% 3.8%
B 13,550 14,756 15,820 16,703 17,587 18,206 18,590 19,034 19,414 19,812 20,088 20% 5.8% 2.4%
L . . . . 17,542 17,915 17,889 18,004 18,088 18,188 18,161 9% 5.7% 0.7%
UK-Ireland FAB
H . . . . 17,259 17,794 18,250 18,956 19,430 19,909 20,356 22% 4.4% 2.9%
B 14,336 15,342 16,233 16,744 17,211 17,566 17,818 18,294 18,644 19,008 19,269 15% 4.4% 2.0%
L . . . . 17,160 17,299 17,303 17,463 17,592 17,744 17,775 6% 4.3% 0.7%
DK-SE FAB H . . . . 5,634 5,827 6,010 6,176 6,311 6,436 6,538 18% 3.2% 2.7%
B 4,938 5,023 5,281 5,522 5,618 5,730 5,818 5,918 6,007 6,098 6,157 12% 3.1% 1.7%
L . . . . 5,600 5,627 5,607 5,629 5,640 5,658 5,637 2% 3.1% 0.2%
EUROCONTROL Seven-Year Forecast Autumn 2019 – Annex 2: Detailed Forecast
STATFOR Doc 659 Annex 2 Detailed Forecast 15/10/19
Page 19
Total service units with Model 2
(Thousands)
2015 2016 2017 2018 2019 2020 2021 2022 2023 2024 2025
Total growth 2018-2025
AAGR RP2
2015-2019
AAGR RP3
2020-2024
CRCO11 H . . . . 165,992 172,941 180,462 187,722 194,172 200,972 207,148 29% 4.8% 3.9%
B 136,884 142,648 151,522 160,786 165,487 170,041 174,179 179,155 183,566 188,252 191,856 19% 4.7% 2.6%
L . . . . 164,902 166,968 167,622 169,691 171,579 173,647 174,555 9% 4.7% 1.0%
CRCO14 H . . . . 166,678 173,749 181,327 188,650 195,161 202,031 208,274 29% 4.8% 3.9%
B 137,689 143,439 152,329 161,592 166,168 170,823 174,994 180,014 184,465 189,197 192,842 19% 4.7% 2.6%
L . . . . 165,575 167,726 168,392 170,489 172,401 174,498 175,428 9% 4.6% 1.1%
CRCO16 H . . . . 167,599 174,707 182,325 189,683 196,226 203,128 209,399 29% 4.7% 3.9%
B 138,505 144,274 153,194 162,512 167,085 171,766 175,954 180,994 185,463 190,215 193,872 19% 4.7% 2.6%
L . . . . 166,490 168,652 169,317 171,416 173,331 175,433 176,361 9% 4.6% 1.1%
RP1Region H . . . . 136,135 141,500 147,099 152,533 157,267 162,180 166,563 26% 4.4% 3.6%
B 113,273 118,420 125,129 132,022 135,748 139,279 142,204 145,838 149,039 152,410 154,876 17% 4.3% 2.3%
L . . . . 135,315 136,897 137,017 138,293 139,407 140,701 141,035 7% 4.2% 0.8%
RP2Region H . . . . 138,352 143,872 149,589 155,134 159,973 164,996 169,478 26% 4.4% 3.6%
B 115,063 120,208 126,928 134,016 137,953 141,578 144,563 148,267 151,534 154,975 157,496 18% 4.3% 2.4%
L . . . . 137,507 139,121 139,246 140,547 141,686 143,008 143,353 7% 4.3% 0.8%
Total H . . . . 172,613 180,052 188,037 195,733 202,603 209,851 216,440 29% 4.5% 4.0%
B 142,538 148,228 157,601 167,310 172,076 176,964 181,364 186,629 191,312 196,283 200,117 20% 4.4% 2.7%
L . . . . 171,454 173,701 174,434 176,643 178,656 180,859 181,848 9% 4.4% 1.1%
EUROCONTROL Seven-Year Forecast Autumn 2019 – Annex 2: Detailed Forecast
STATFOR Doc 659 Annex 2 Detailed Forecast 15/10/19
Page 20
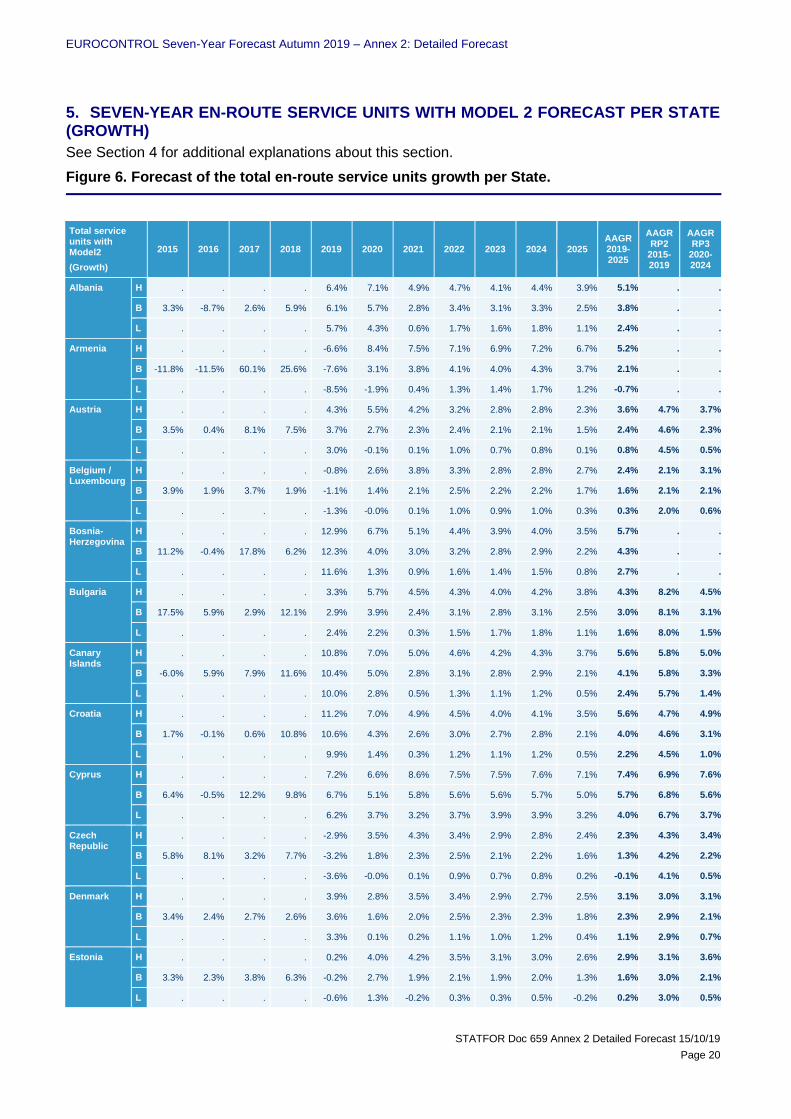
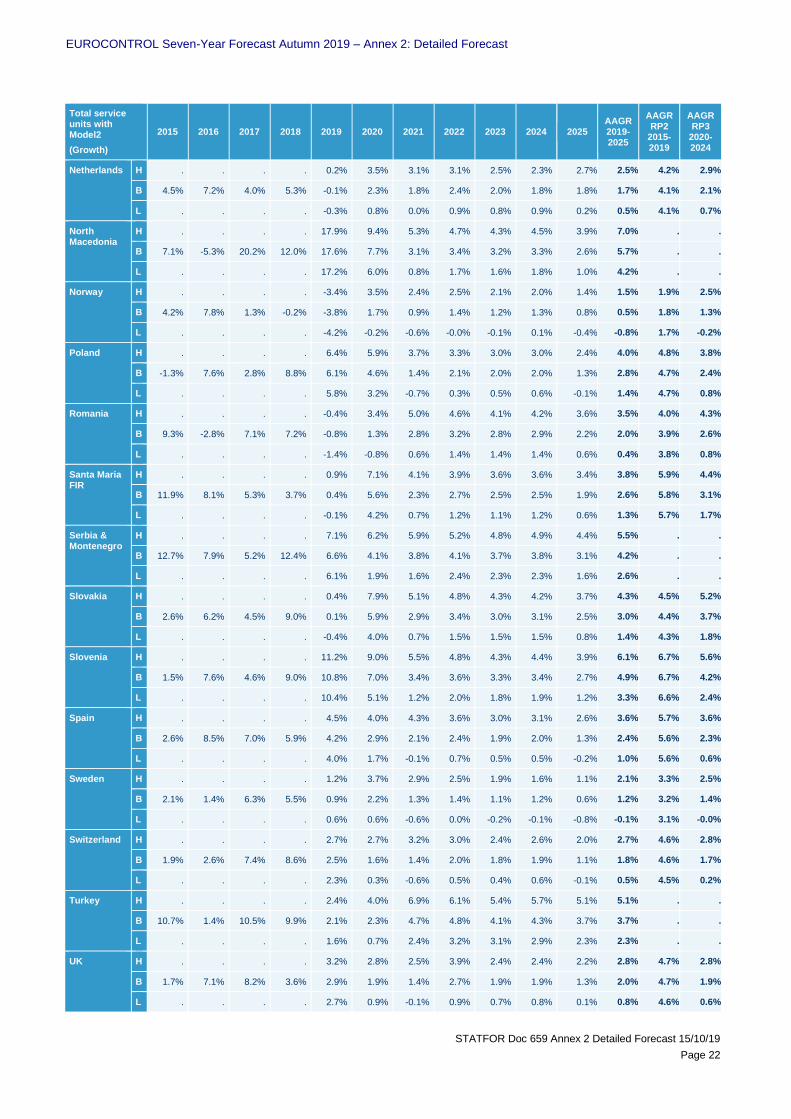
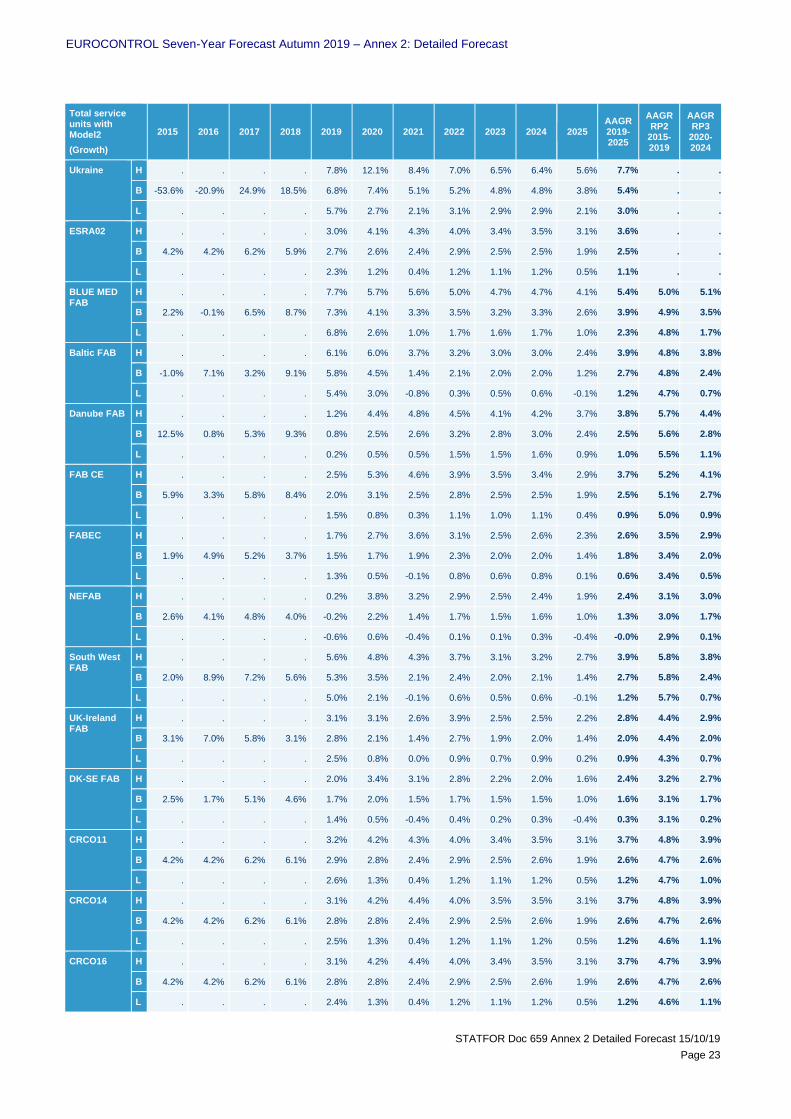
5. SEVEN-YEAR EN-ROUTE SERVICE UNITS WITH MODEL 2 FORECAST PER STATE (GROWTH)
See Section 4 for additional explanations about this section.
Figure 6. Forecast of the total en-route service units growth per State.
Total service units with Model2
(Growth)
2015 2016 2017 2018 2019 2020 2021 2022 2023 2024 2025 AAGR 2019-2025
AAGR RP2
2015-2019
AAGR RP3
2020-2024
Albania H . . . . 6.4% 7.1% 4.9% 4.7% 4.1% 4.4% 3.9% 5.1% . .
B 3.3% -8.7% 2.6% 5.9% 6.1% 5.7% 2.8% 3.4% 3.1% 3.3% 2.5% 3.8% . .
L . . . . 5.7% 4.3% 0.6% 1.7% 1.6% 1.8% 1.1% 2.4% . .
Armenia H . . . . -6.6% 8.4% 7.5% 7.1% 6.9% 7.2% 6.7% 5.2% . .
B -11.8% -11.5% 60.1% 25.6% -7.6% 3.1% 3.8% 4.1% 4.0% 4.3% 3.7% 2.1% . .
L . . . . -8.5% -1.9% 0.4% 1.3% 1.4% 1.7% 1.2% -0.7% . .
Austria H . . . . 4.3% 5.5% 4.2% 3.2% 2.8% 2.8% 2.3% 3.6% 4.7% 3.7%
B 3.5% 0.4% 8.1% 7.5% 3.7% 2.7% 2.3% 2.4% 2.1% 2.1% 1.5% 2.4% 4.6% 2.3%
L . . . . 3.0% -0.1% 0.1% 1.0% 0.7% 0.8% 0.1% 0.8% 4.5% 0.5%
Belgium / Luxembourg
H . . . . -0.8% 2.6% 3.8% 3.3% 2.8% 2.8% 2.7% 2.4% 2.1% 3.1%
B 3.9% 1.9% 3.7% 1.9% -1.1% 1.4% 2.1% 2.5% 2.2% 2.2% 1.7% 1.6% 2.1% 2.1%
L . . . . -1.3% -0.0% 0.1% 1.0% 0.9% 1.0% 0.3% 0.3% 2.0% 0.6%
Bosnia-Herzegovina
H . . . . 12.9% 6.7% 5.1% 4.4% 3.9% 4.0% 3.5% 5.7% . .
B 11.2% -0.4% 17.8% 6.2% 12.3% 4.0% 3.0% 3.2% 2.8% 2.9% 2.2% 4.3% . .
L . . . . 11.6% 1.3% 0.9% 1.6% 1.4% 1.5% 0.8% 2.7% . .
Bulgaria H . . . . 3.3% 5.7% 4.5% 4.3% 4.0% 4.2% 3.8% 4.3% 8.2% 4.5%
B 17.5% 5.9% 2.9% 12.1% 2.9% 3.9% 2.4% 3.1% 2.8% 3.1% 2.5% 3.0% 8.1% 3.1%
L . . . . 2.4% 2.2% 0.3% 1.5% 1.7% 1.8% 1.1% 1.6% 8.0% 1.5%
Canary Islands
H . . . . 10.8% 7.0% 5.0% 4.6% 4.2% 4.3% 3.7% 5.6% 5.8% 5.0%
B -6.0% 5.9% 7.9% 11.6% 10.4% 5.0% 2.8% 3.1% 2.8% 2.9% 2.1% 4.1% 5.8% 3.3%
L . . . . 10.0% 2.8% 0.5% 1.3% 1.1% 1.2% 0.5% 2.4% 5.7% 1.4%
Croatia H . . . . 11.2% 7.0% 4.9% 4.5% 4.0% 4.1% 3.5% 5.6% 4.7% 4.9%
B 1.7% -0.1% 0.6% 10.8% 10.6% 4.3% 2.6% 3.0% 2.7% 2.8% 2.1% 4.0% 4.6% 3.1%
L . . . . 9.9% 1.4% 0.3% 1.2% 1.1% 1.2% 0.5% 2.2% 4.5% 1.0%
Cyprus H . . . . 7.2% 6.6% 8.6% 7.5% 7.5% 7.6% 7.1% 7.4% 6.9% 7.6%
B 6.4% -0.5% 12.2% 9.8% 6.7% 5.1% 5.8% 5.6% 5.6% 5.7% 5.0% 5.7% 6.8% 5.6%
L . . . . 6.2% 3.7% 3.2% 3.7% 3.9% 3.9% 3.2% 4.0% 6.7% 3.7%
Czech Republic
H . . . . -2.9% 3.5% 4.3% 3.4% 2.9% 2.8% 2.4% 2.3% 4.3% 3.4%
B 5.8% 8.1% 3.2% 7.7% -3.2% 1.8% 2.3% 2.5% 2.1% 2.2% 1.6% 1.3% 4.2% 2.2%
L . . . . -3.6% -0.0% 0.1% 0.9% 0.7% 0.8% 0.2% -0.1% 4.1% 0.5%
Denmark H . . . . 3.9% 2.8% 3.5% 3.4% 2.9% 2.7% 2.5% 3.1% 3.0% 3.1%
B 3.4% 2.4% 2.7% 2.6% 3.6% 1.6% 2.0% 2.5% 2.3% 2.3% 1.8% 2.3% 2.9% 2.1%
L . . . . 3.3% 0.1% 0.2% 1.1% 1.0% 1.2% 0.4% 1.1% 2.9% 0.7%
Estonia H . . . . 0.2% 4.0% 4.2% 3.5% 3.1% 3.0% 2.6% 2.9% 3.1% 3.6%
B 3.3% 2.3% 3.8% 6.3% -0.2% 2.7% 1.9% 2.1% 1.9% 2.0% 1.3% 1.6% 3.0% 2.1%
L . . . . -0.6% 1.3% -0.2% 0.3% 0.3% 0.5% -0.2% 0.2% 3.0% 0.5%

EUROCONTROL Seven-Year Forecast Autumn 2019 – Annex 2: Detailed Forecast
STATFOR Doc 659 Annex 2 Detailed Forecast 15/10/19
Page 21
Total service units with Model2
(Growth)
2015 2016 2017 2018 2019 2020 2021 2022 2023 2024 2025 AAGR 2019-2025
AAGR RP2
2015-2019
AAGR RP3
2020-2024
Finland H . . . . 8.0% 3.9% 3.0% 2.7% 2.3% 2.2% 1.6% 3.4% 5.0% 2.8%
B -4.4% 0.5% 11.1% 10.8% 7.4% 2.6% 1.5% 1.5% 1.4% 1.5% 0.9% 2.4% 4.9% 1.7%
L . . . . 6.9% 1.1% -0.0% 0.2% 0.2% 0.3% -0.3% 1.2% 4.8% 0.4%
France H . . . . 2.3% 2.4% 3.7% 3.1% 2.5% 2.5% 2.1% 2.6% 3.5% 2.8%
B 2.0% 5.4% 4.9% 2.8% 2.1% 1.5% 1.9% 2.2% 1.9% 1.9% 1.1% 1.8% 3.4% 1.9%
L . . . . 1.9% 0.4% -0.1% 0.8% 0.5% 0.7% -0.1% 0.6% 3.4% 0.4%
Georgia H . . . . -14.9% 17.7% 7.0% 7.5% 6.5% 7.1% 6.3% 4.9% . .
B 7.1% -1.7% 1.9% -0.1% -15.6% 15.0% 4.2% 5.4% 4.6% 5.1% 4.3% 2.9% . .
L . . . . -16.5% 12.6% 1.6% 3.6% 3.0% 3.5% 2.7% 1.1% . .
Germany H . . . . 1.5% 2.8% 3.5% 3.1% 2.7% 2.7% 2.4% 2.7% 3.4% 3.0%
B 0.7% 4.5% 6.0% 4.3% 1.3% 1.9% 1.8% 2.3% 2.1% 2.1% 1.6% 1.9% 3.4% 2.0%
L . . . . 1.1% 0.8% -0.1% 0.9% 0.8% 0.9% 0.2% 0.7% 3.3% 0.7%
Greece H . . . . 6.8% 4.5% 5.3% 4.9% 4.6% 4.8% 4.3% 5.0% 5.3% 4.8%
B 6.1% -4.5% 10.3% 8.6% 6.4% 2.9% 3.2% 3.5% 3.4% 3.5% 2.9% 3.7% 5.2% 3.3%
L . . . . 5.9% 1.4% 1.1% 1.9% 1.9% 2.1% 1.4% 2.2% 5.1% 1.7%
Hungary H . . . . -3.6% 3.1% 4.6% 4.0% 3.5% 3.2% 2.5% 2.5% 5.3% 3.7%
B 12.0% 3.5% 6.6% 8.8% -4.0% 1.4% 2.5% 2.8% 2.5% 2.5% 1.9% 1.3% 5.2% 2.3%
L . . . . -4.5% -0.4% 0.2% 1.1% 1.1% 1.1% 0.5% -0.2% 5.1% 0.6%
Ireland H . . . . 2.8% 3.8% 2.7% 3.8% 2.6% 2.6% 2.5% 3.0% 3.6% 3.1%
B 6.6% 6.8% -0.1% 1.9% 2.4% 2.4% 1.6% 2.7% 2.1% 2.1% 1.6% 2.1% 3.5% 2.2%
L . . . . 2.0% 0.7% 0.2% 1.0% 0.8% 1.0% 0.4% 0.9% 3.4% 0.8%
Italy H . . . . 7.9% 5.8% 5.2% 4.5% 4.0% 3.9% 3.2% 4.9% 4.1% 4.7%
B -1.7% 1.6% 4.0% 9.3% 7.5% 4.3% 2.9% 2.9% 2.5% 2.5% 1.8% 3.5% 4.1% 3.0%
L . . . . 7.2% 2.8% 0.5% 1.1% 0.8% 0.9% 0.2% 1.9% 4.0% 1.2%
Latvia (1) H . . . . 2.2% 2.2% 4.3% 3.7% 3.2% 3.1% 2.7% 3.0% 4.6% 3.3%
B 4.6% -1.6% 11.2% 7.0% 1.9% 0.8% 1.8% 2.1% 1.8% 1.9% 1.2% 1.6% 4.5% 1.7%
L . . . . 1.5% -0.4% -0.4% 0.3% 0.3% 0.4% -0.3% 0.2% 4.4% 0.0%
Lisbon FIR H . . . . 6.3% 6.0% 3.9% 3.4% 3.0% 3.1% 2.5% 4.0% 6.3% 3.9%
B 4.3% 11.4% 7.6% 2.1% 6.0% 4.6% 1.8% 2.1% 1.8% 1.9% 1.1% 2.7% 6.2% 2.4%
L . . . . 5.7% 3.1% -0.5% 0.2% 0.1% 0.3% -0.4% 1.2% 6.2% 0.6%
Lithuania (1) H . . . . 3.5% 9.8% 3.6% 3.2% 2.9% 2.9% 2.3% 4.0% 5.1% 4.5%
B 1.0% 3.1% 6.6% 11.4% 2.9% 6.9% 1.1% 1.7% 1.6% 1.7% 1.0% 2.4% 4.9% 2.6%
L . . . . 2.2% 4.0% -1.2% -0.1% 0.1% 0.2% -0.5% 0.7% 4.8% 0.6%
Malta H . . . . 12.4% 10.2% 6.0% 5.8% 5.6% 5.9% 5.3% 7.3% 7.6% 6.7%
B 13.2% 10.0% 1.2% 2.0% 11.6% 7.3% 3.5% 3.8% 3.7% 4.0% 3.4% 5.3% 7.5% 4.4%
L . . . . 10.7% 4.5% 1.3% 2.0% 2.1% 2.4% 1.9% 3.5% 7.3% 2.4%
Moldova H . . . . 3.6% 13.7% 7.8% 6.8% 6.5% 6.6% 5.7% 7.2% . .
B -43.7% -18.9% 15.3% 20.2% 2.0% 8.6% 4.8% 4.9% 4.7% 4.8% 3.9% 4.8% . .
L . . . . 0.2% 3.6% 2.1% 3.0% 2.9% 3.0% 2.2% 2.4% . .
Morocco H . . . . 3.0% 4.0% 6.1% 5.3% 4.8% 4.9% 4.2% 4.6% . .
B -0.9% 6.9% 6.8% 5.0% 2.7% 2.6% 3.5% 3.6% 3.2% 3.2% 2.4% 3.1% . .
L . . . . 2.5% 1.2% 1.0% 1.7% 1.4% 1.4% 0.6% 1.4% . .
EUROCONTROL Seven-Year Forecast Autumn 2019 – Annex 2: Detailed Forecast
STATFOR Doc 659 Annex 2 Detailed Forecast 15/10/19
Page 22
Total service units with Model2
(Growth)
2015 2016 2017 2018 2019 2020 2021 2022 2023 2024 2025 AAGR 2019-2025
AAGR RP2
2015-2019
AAGR RP3
2020-2024
Netherlands H . . . . 0.2% 3.5% 3.1% 3.1% 2.5% 2.3% 2.7% 2.5% 4.2% 2.9%
B 4.5% 7.2% 4.0% 5.3% -0.1% 2.3% 1.8% 2.4% 2.0% 1.8% 1.8% 1.7% 4.1% 2.1%
L . . . . -0.3% 0.8% 0.0% 0.9% 0.8% 0.9% 0.2% 0.5% 4.1% 0.7%
North Macedonia
H . . . . 17.9% 9.4% 5.3% 4.7% 4.3% 4.5% 3.9% 7.0% . .
B 7.1% -5.3% 20.2% 12.0% 17.6% 7.7% 3.1% 3.4% 3.2% 3.3% 2.6% 5.7% . .
L . . . . 17.2% 6.0% 0.8% 1.7% 1.6% 1.8% 1.0% 4.2% . .
Norway H . . . . -3.4% 3.5% 2.4% 2.5% 2.1% 2.0% 1.4% 1.5% 1.9% 2.5%
B 4.2% 7.8% 1.3% -0.2% -3.8% 1.7% 0.9% 1.4% 1.2% 1.3% 0.8% 0.5% 1.8% 1.3%
L . . . . -4.2% -0.2% -0.6% -0.0% -0.1% 0.1% -0.4% -0.8% 1.7% -0.2%
Poland H . . . . 6.4% 5.9% 3.7% 3.3% 3.0% 3.0% 2.4% 4.0% 4.8% 3.8%
B -1.3% 7.6% 2.8% 8.8% 6.1% 4.6% 1.4% 2.1% 2.0% 2.0% 1.3% 2.8% 4.7% 2.4%
L . . . . 5.8% 3.2% -0.7% 0.3% 0.5% 0.6% -0.1% 1.4% 4.7% 0.8%
Romania H . . . . -0.4% 3.4% 5.0% 4.6% 4.1% 4.2% 3.6% 3.5% 4.0% 4.3%
B 9.3% -2.8% 7.1% 7.2% -0.8% 1.3% 2.8% 3.2% 2.8% 2.9% 2.2% 2.0% 3.9% 2.6%
L . . . . -1.4% -0.8% 0.6% 1.4% 1.4% 1.4% 0.6% 0.4% 3.8% 0.8%
Santa Maria FIR
H . . . . 0.9% 7.1% 4.1% 3.9% 3.6% 3.6% 3.4% 3.8% 5.9% 4.4%
B 11.9% 8.1% 5.3% 3.7% 0.4% 5.6% 2.3% 2.7% 2.5% 2.5% 1.9% 2.6% 5.8% 3.1%
L . . . . -0.1% 4.2% 0.7% 1.2% 1.1% 1.2% 0.6% 1.3% 5.7% 1.7%
Serbia & Montenegro
H . . . . 7.1% 6.2% 5.9% 5.2% 4.8% 4.9% 4.4% 5.5% . .
B 12.7% 7.9% 5.2% 12.4% 6.6% 4.1% 3.8% 4.1% 3.7% 3.8% 3.1% 4.2% . .
L . . . . 6.1% 1.9% 1.6% 2.4% 2.3% 2.3% 1.6% 2.6% . .
Slovakia H . . . . 0.4% 7.9% 5.1% 4.8% 4.3% 4.2% 3.7% 4.3% 4.5% 5.2%
B 2.6% 6.2% 4.5% 9.0% 0.1% 5.9% 2.9% 3.4% 3.0% 3.1% 2.5% 3.0% 4.4% 3.7%
L . . . . -0.4% 4.0% 0.7% 1.5% 1.5% 1.5% 0.8% 1.4% 4.3% 1.8%
Slovenia H . . . . 11.2% 9.0% 5.5% 4.8% 4.3% 4.4% 3.9% 6.1% 6.7% 5.6%
B 1.5% 7.6% 4.6% 9.0% 10.8% 7.0% 3.4% 3.6% 3.3% 3.4% 2.7% 4.9% 6.7% 4.2%
L . . . . 10.4% 5.1% 1.2% 2.0% 1.8% 1.9% 1.2% 3.3% 6.6% 2.4%
Spain H . . . . 4.5% 4.0% 4.3% 3.6% 3.0% 3.1% 2.6% 3.6% 5.7% 3.6%
B 2.6% 8.5% 7.0% 5.9% 4.2% 2.9% 2.1% 2.4% 1.9% 2.0% 1.3% 2.4% 5.6% 2.3%
L . . . . 4.0% 1.7% -0.1% 0.7% 0.5% 0.5% -0.2% 1.0% 5.6% 0.6%
Sweden H . . . . 1.2% 3.7% 2.9% 2.5% 1.9% 1.6% 1.1% 2.1% 3.3% 2.5%
B 2.1% 1.4% 6.3% 5.5% 0.9% 2.2% 1.3% 1.4% 1.1% 1.2% 0.6% 1.2% 3.2% 1.4%
L . . . . 0.6% 0.6% -0.6% 0.0% -0.2% -0.1% -0.8% -0.1% 3.1% -0.0%
Switzerland H . . . . 2.7% 2.7% 3.2% 3.0% 2.4% 2.6% 2.0% 2.7% 4.6% 2.8%
B 1.9% 2.6% 7.4% 8.6% 2.5% 1.6% 1.4% 2.0% 1.8% 1.9% 1.1% 1.8% 4.6% 1.7%
L . . . . 2.3% 0.3% -0.6% 0.5% 0.4% 0.6% -0.1% 0.5% 4.5% 0.2%
Turkey H . . . . 2.4% 4.0% 6.9% 6.1% 5.4% 5.7% 5.1% 5.1% . .
B 10.7% 1.4% 10.5% 9.9% 2.1% 2.3% 4.7% 4.8% 4.1% 4.3% 3.7% 3.7% . .
L . . . . 1.6% 0.7% 2.4% 3.2% 3.1% 2.9% 2.3% 2.3% . .
UK H . . . . 3.2% 2.8% 2.5% 3.9% 2.4% 2.4% 2.2% 2.8% 4.7% 2.8%
B 1.7% 7.1% 8.2% 3.6% 2.9% 1.9% 1.4% 2.7% 1.9% 1.9% 1.3% 2.0% 4.7% 1.9%
L . . . . 2.7% 0.9% -0.1% 0.9% 0.7% 0.8% 0.1% 0.8% 4.6% 0.6%
EUROCONTROL Seven-Year Forecast Autumn 2019 – Annex 2: Detailed Forecast
STATFOR Doc 659 Annex 2 Detailed Forecast 15/10/19
Page 23
Total service units with Model2
(Growth)
2015 2016 2017 2018 2019 2020 2021 2022 2023 2024 2025 AAGR 2019-2025
AAGR RP2
2015-2019
AAGR RP3
2020-2024
Ukraine H . . . . 7.8% 12.1% 8.4% 7.0% 6.5% 6.4% 5.6% 7.7% . .
B -53.6% -20.9% 24.9% 18.5% 6.8% 7.4% 5.1% 5.2% 4.8% 4.8% 3.8% 5.4% . .
L . . . . 5.7% 2.7% 2.1% 3.1% 2.9% 2.9% 2.1% 3.0% . .
ESRA02 H . . . . 3.0% 4.1% 4.3% 4.0% 3.4% 3.5% 3.1% 3.6% . .
B 4.2% 4.2% 6.2% 5.9% 2.7% 2.6% 2.4% 2.9% 2.5% 2.5% 1.9% 2.5% . .
L . . . . 2.3% 1.2% 0.4% 1.2% 1.1% 1.2% 0.5% 1.1% . .
BLUE MED FAB
H . . . . 7.7% 5.7% 5.6% 5.0% 4.7% 4.7% 4.1% 5.4% 5.0% 5.1%
B 2.2% -0.1% 6.5% 8.7% 7.3% 4.1% 3.3% 3.5% 3.2% 3.3% 2.6% 3.9% 4.9% 3.5%
L . . . . 6.8% 2.6% 1.0% 1.7% 1.6% 1.7% 1.0% 2.3% 4.8% 1.7%
Baltic FAB H . . . . 6.1% 6.0% 3.7% 3.2% 3.0% 3.0% 2.4% 3.9% 4.8% 3.8%
B -1.0% 7.1% 3.2% 9.1% 5.8% 4.5% 1.4% 2.1% 2.0% 2.0% 1.2% 2.7% 4.8% 2.4%
L . . . . 5.4% 3.0% -0.8% 0.3% 0.5% 0.6% -0.1% 1.2% 4.7% 0.7%
Danube FAB H . . . . 1.2% 4.4% 4.8% 4.5% 4.1% 4.2% 3.7% 3.8% 5.7% 4.4%
B 12.5% 0.8% 5.3% 9.3% 0.8% 2.5% 2.6% 3.2% 2.8% 3.0% 2.4% 2.5% 5.6% 2.8%
L . . . . 0.2% 0.5% 0.5% 1.5% 1.5% 1.6% 0.9% 1.0% 5.5% 1.1%
FAB CE H . . . . 2.5% 5.3% 4.6% 3.9% 3.5% 3.4% 2.9% 3.7% 5.2% 4.1%
B 5.9% 3.3% 5.8% 8.4% 2.0% 3.1% 2.5% 2.8% 2.5% 2.5% 1.9% 2.5% 5.1% 2.7%
L . . . . 1.5% 0.8% 0.3% 1.1% 1.0% 1.1% 0.4% 0.9% 5.0% 0.9%
FABEC H . . . . 1.7% 2.7% 3.6% 3.1% 2.5% 2.6% 2.3% 2.6% 3.5% 2.9%
B 1.9% 4.9% 5.2% 3.7% 1.5% 1.7% 1.9% 2.3% 2.0% 2.0% 1.4% 1.8% 3.4% 2.0%
L . . . . 1.3% 0.5% -0.1% 0.8% 0.6% 0.8% 0.1% 0.6% 3.4% 0.5%
NEFAB H . . . . 0.2% 3.8% 3.2% 2.9% 2.5% 2.4% 1.9% 2.4% 3.1% 3.0%
B 2.6% 4.1% 4.8% 4.0% -0.2% 2.2% 1.4% 1.7% 1.5% 1.6% 1.0% 1.3% 3.0% 1.7%
L . . . . -0.6% 0.6% -0.4% 0.1% 0.1% 0.3% -0.4% -0.0% 2.9% 0.1%
South West FAB
H . . . . 5.6% 4.8% 4.3% 3.7% 3.1% 3.2% 2.7% 3.9% 5.8% 3.8%
B 2.0% 8.9% 7.2% 5.6% 5.3% 3.5% 2.1% 2.4% 2.0% 2.1% 1.4% 2.7% 5.8% 2.4%
L . . . . 5.0% 2.1% -0.1% 0.6% 0.5% 0.6% -0.1% 1.2% 5.7% 0.7%
UK-Ireland FAB
H . . . . 3.1% 3.1% 2.6% 3.9% 2.5% 2.5% 2.2% 2.8% 4.4% 2.9%
B 3.1% 7.0% 5.8% 3.1% 2.8% 2.1% 1.4% 2.7% 1.9% 2.0% 1.4% 2.0% 4.4% 2.0%
L . . . . 2.5% 0.8% 0.0% 0.9% 0.7% 0.9% 0.2% 0.9% 4.3% 0.7%
DK-SE FAB H . . . . 2.0% 3.4% 3.1% 2.8% 2.2% 2.0% 1.6% 2.4% 3.2% 2.7%
B 2.5% 1.7% 5.1% 4.6% 1.7% 2.0% 1.5% 1.7% 1.5% 1.5% 1.0% 1.6% 3.1% 1.7%
L . . . . 1.4% 0.5% -0.4% 0.4% 0.2% 0.3% -0.4% 0.3% 3.1% 0.2%
CRCO11 H . . . . 3.2% 4.2% 4.3% 4.0% 3.4% 3.5% 3.1% 3.7% 4.8% 3.9%
B 4.2% 4.2% 6.2% 6.1% 2.9% 2.8% 2.4% 2.9% 2.5% 2.6% 1.9% 2.6% 4.7% 2.6%
L . . . . 2.6% 1.3% 0.4% 1.2% 1.1% 1.2% 0.5% 1.2% 4.7% 1.0%
CRCO14 H . . . . 3.1% 4.2% 4.4% 4.0% 3.5% 3.5% 3.1% 3.7% 4.8% 3.9%
B 4.2% 4.2% 6.2% 6.1% 2.8% 2.8% 2.4% 2.9% 2.5% 2.6% 1.9% 2.6% 4.7% 2.6%
L . . . . 2.5% 1.3% 0.4% 1.2% 1.1% 1.2% 0.5% 1.2% 4.6% 1.1%
CRCO16 H . . . . 3.1% 4.2% 4.4% 4.0% 3.4% 3.5% 3.1% 3.7% 4.7% 3.9%
B 4.2% 4.2% 6.2% 6.1% 2.8% 2.8% 2.4% 2.9% 2.5% 2.6% 1.9% 2.6% 4.7% 2.6%
L . . . . 2.4% 1.3% 0.4% 1.2% 1.1% 1.2% 0.5% 1.2% 4.6% 1.1%

EUROCONTROL Seven-Year Forecast Autumn 2019 – Annex 2: Detailed Forecast
STATFOR Doc 659 Annex 2 Detailed Forecast 15/10/19
Page 24
Total service units with Model2
(Growth)
2015 2016 2017 2018 2019 2020 2021 2022 2023 2024 2025 AAGR 2019-2025
AAGR RP2
2015-2019
AAGR RP3
2020-2024
RP1Region H . . . . 3.1% 3.9% 4.0% 3.7% 3.1% 3.1% 2.7% 3.4% 4.4% 3.6%
B 3.1% 4.5% 5.7% 5.5% 2.8% 2.6% 2.1% 2.6% 2.2% 2.3% 1.6% 2.3% 4.3% 2.3%
L . . . . 2.5% 1.2% 0.1% 0.9% 0.8% 0.9% 0.2% 0.9% 4.2% 0.8%
RP2Region H . . . . 3.2% 4.0% 4.0% 3.7% 3.1% 3.1% 2.7% 3.4% 4.4% 3.6%
B 3.0% 4.5% 5.6% 5.6% 2.9% 2.6% 2.1% 2.6% 2.2% 2.3% 1.6% 2.3% 4.3% 2.4%
L . . . . 2.6% 1.2% 0.1% 0.9% 0.8% 0.9% 0.2% 1.0% 4.3% 0.8%
Total H . . . . 3.2% 4.3% 4.4% 4.1% 3.5% 3.6% 3.1% 3.7% 4.5% 4.0%
B 2.9% 4.0% 6.3% 6.2% 2.8% 2.8% 2.5% 2.9% 2.5% 2.6% 2.0% 2.6% 4.4% 2.7%
L . . . . 2.5% 1.3% 0.4% 1.3% 1.1% 1.2% 0.5% 1.2% 4.4% 1.1%

EUROCONTROL Seven-Year Forecast Autumn 2019 – Annex 2: Detailed Forecast
STATFOR Doc 659 Annex 2 Detailed Forecast 15/10/19
Page 25
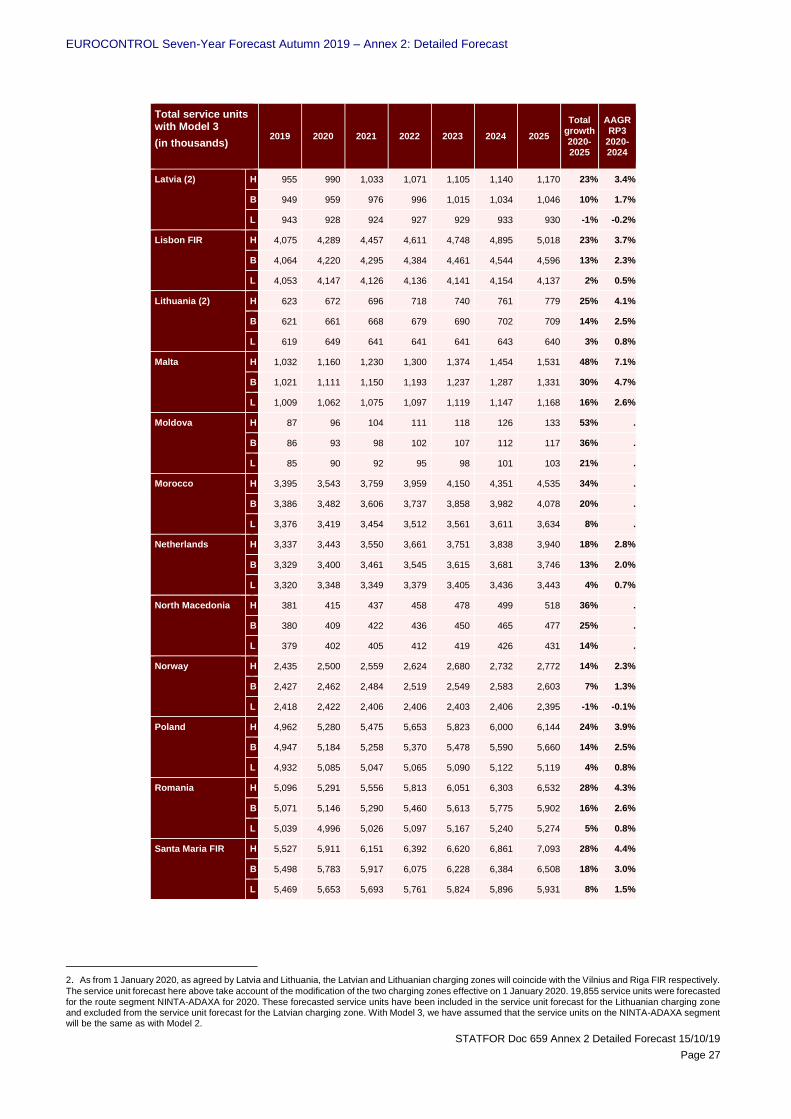
6. SEVEN-YEAR EN-ROUTE SERVICE UNITS WITH MODEL 3 FORECAST PER STATE (THOUSANDS)
The definition of the regions and FABs can be found in Annex 1- Traffic Region Definitions
This section proposes a forecast of en-route service units based on Model 3 (M3) calculation, as they will be considered from January 2020. This forecast is based on a history of estimated monthly en-route service unit per state calculated with Model 3 from January 2013 to August 2019:
• It takes into consideration the ratios M3/M2 by state published by the CRCO for November 2017 to May 2019 in Annex 3 - CRCO Ratios
• It uses STATFOR ratio calculation with some consolidation based on CRCO ratios otherwise.
The forecast is available from 2019 to 2025. The forecast for 2019 can be considered as an estimation of the en-route service units if Model 3 data were used, even if no official CRCO en-route service units calculated with Model 3 will be made available for this year.
The forecast was built independently of the usual en-route service units forecast whose results have been presented in Section 4 and 5. The forecast method uses a similar method but with a different history.
The total growth, average annual growth (AAGR) and average annual Growth during the RP3 period (AAGR RP3) provided in Figure 7 and Figure 8 are calculated from the estimated 2019 en-route service units with Model 3, which is a figure that will never be used as 2019 service units are to be based on M2 data. States are invited to combine the results of this section with those of Section 4 to get growth results that will account for the method change.
Figure 7. Forecast of the total number of en-route service units with Model 3 (thousands) per State.
Total service units with Model 3
(in thousands)
2019 2020 2021 2022 2023 2024 2025
Total growth 2020-2025
AAGR RP3
2020-2024
Albania H 501 535 562 588 612 639 663 32% .
B 499 525 540 558 576 595 610 22% .
L 497 514 517 526 535 545 551 11% .
Armenia H 208 229 246 264 282 302 323 55% .
B 206 215 223 232 242 252 262 27% .
L 204 202 203 205 208 212 214 5% .
Austria H 3,332 3,524 3,671 3,789 3,895 4,005 4,099 23% 3.8%
B 3,310 3,403 3,480 3,564 3,638 3,715 3,769 14% 2.3%
L 3,287 3,277 3,281 3,313 3,337 3,365 3,370 3% 0.5%
Belgium / Luxembourg
H 2,551 2,622 2,720 2,811 2,890 2,972 3,051 20% 3.1%
B 2,543 2,578 2,632 2,697 2,757 2,819 2,866 13% 2.1%
L 2,534 2,530 2,532 2,557 2,579 2,605 2,613 3% 0.6%
Bosnia-Herzegovina
H 1,210 1,271 1,337 1,395 1,450 1,508 1,561 29% .
B 1,206 1,251 1,289 1,330 1,368 1,408 1,439 19% .
L 1,201 1,229 1,240 1,259 1,277 1,296 1,306 9% .
Bulgaria H 4,059 4,325 4,518 4,714 4,902 5,110 5,306 31% 4.7%
B 4,041 4,219 4,321 4,456 4,583 4,724 4,844 20% 3.2%
L 4,015 4,109 4,123 4,185 4,256 4,332 4,381 9% 1.5%

EUROCONTROL Seven-Year Forecast Autumn 2019 – Annex 2: Detailed Forecast
STATFOR Doc 659 Annex 2 Detailed Forecast 15/10/19
Page 26
Total service units with Model 3
(in thousands)
2019 2020 2021 2022 2023 2024 2025
Total growth 2020-2025
AAGR RP3
2020-2024
Canary Islands H 1,975 2,102 2,207 2,308 2,405 2,508 2,600 32% 4.9%
B 1,969 2,067 2,126 2,191 2,253 2,318 2,367 20% 3.3%
L 1,962 2,031 2,042 2,068 2,091 2,117 2,127 8% 1.5%
Croatia H 2,225 2,408 2,527 2,639 2,746 2,859 2,959 33% 5.1%
B 2,213 2,332 2,393 2,465 2,531 2,603 2,658 20% 3.3%
L 2,199 2,255 2,261 2,287 2,311 2,339 2,351 7% 1.2%
Cyprus H 2,022 2,169 2,356 2,532 2,723 2,929 3,136 55% 7.7%
B 2,014 2,129 2,254 2,380 2,514 2,656 2,790 39% 5.7%
L 2,004 2,091 2,159 2,238 2,327 2,417 2,496 25% 3.8%
Czech Republic H 2,927 3,014 3,142 3,249 3,344 3,439 3,522 20% 3.3%
B 2,917 2,968 3,036 3,111 3,177 3,246 3,297 13% 2.2%
L 2,905 2,919 2,921 2,947 2,968 2,993 2,999 3% 0.6%
Denmark H 1,676 1,734 1,795 1,857 1,910 1,961 2,010 20% 3.2%
B 1,669 1,707 1,742 1,786 1,827 1,868 1,902 14% 2.3%
L 1,662 1,678 1,682 1,700 1,718 1,738 1,746 5% 0.9%
Estonia H 918 954 993 1,028 1,060 1,092 1,120 22% 3.5%
B 915 937 954 974 992 1,011 1,025 12% 2.0%
L 912 919 918 921 924 928 927 2% 0.4%
Finland H 1,015 1,070 1,102 1,132 1,158 1,184 1,203 18% 3.1%
B 1,009 1,039 1,055 1,071 1,086 1,102 1,112 10% 1.8%
L 1,002 1,008 1,008 1,009 1,011 1,014 1,011 1% 0.2%
France H 21,978 22,523 23,351 24,077 24,667 25,286 25,805 17% 2.8%
B 21,935 22,262 22,683 23,190 23,625 24,081 24,354 11% 1.9%
L 21,889 21,973 21,949 22,114 22,233 22,381 22,364 2% 0.4%
Georgia H 680 806 862 926 987 1,056 1,123 65% .
B 674 778 810 854 893 939 980 45% .
L 667 751 763 790 814 843 865 30% .
Germany H 15,261 15,647 16,197 16,703 17,148 17,614 18,043 18% 2.9%
B 15,229 15,437 15,723 16,086 16,416 16,767 17,031 12% 1.9%
L 15,192 15,205 15,194 15,326 15,443 15,585 15,624 3% 0.5%
Greece H 5,968 6,297 6,631 6,957 7,279 7,631 7,958 33% 5.0%
B 5,941 6,135 6,331 6,556 6,776 7,016 7,217 21% 3.4%
L 5,912 5,971 6,035 6,151 6,266 6,396 6,484 10% 1.6%
Hungary H 3,097 3,193 3,341 3,476 3,599 3,713 3,807 23% 3.7%
B 3,088 3,130 3,208 3,298 3,379 3,465 3,531 14% 2.3%
L 3,075 3,063 3,070 3,103 3,136 3,171 3,186 4% 0.6%
Ireland H 4,657 4,779 4,908 5,096 5,230 5,367 5,501 18% 2.9%
B 4,644 4,730 4,806 4,935 5,037 5,145 5,227 13% 2.1%
L 4,630 4,671 4,682 4,730 4,769 4,818 4,837 4% 0.8%
Italy H 10,169 10,854 11,415 11,925 12,397 12,878 13,286 31% 4.8%
B 10,140 10,674 10,983 11,303 11,589 11,882 12,092 19% 3.2%
L 10,107 10,486 10,541 10,657 10,745 10,842 10,864 7% 1.4%
EUROCONTROL Seven-Year Forecast Autumn 2019 – Annex 2: Detailed Forecast
STATFOR Doc 659 Annex 2 Detailed Forecast 15/10/19
Page 27
Total service units with Model 3
(in thousands)
2019 2020 2021 2022 2023 2024 2025
Total growth 2020-2025
AAGR RP3
2020-2024
Latvia (2) H 955 990 1,033 1,071 1,105 1,140 1,170 23% 3.4%
B 949 959 976 996 1,015 1,034 1,046 10% 1.7%
L 943 928 924 927 929 933 930 -1% -0.2%
Lisbon FIR H 4,075 4,289 4,457 4,611 4,748 4,895 5,018 23% 3.7%
B 4,064 4,220 4,295 4,384 4,461 4,544 4,596 13% 2.3%
L 4,053 4,147 4,126 4,136 4,141 4,154 4,137 2% 0.5%
Lithuania (2) H 623 672 696 718 740 761 779 25% 4.1%
B 621 661 668 679 690 702 709 14% 2.5%
L 619 649 641 641 641 643 640 3% 0.8%
Malta H 1,032 1,160 1,230 1,300 1,374 1,454 1,531 48% 7.1%
B 1,021 1,111 1,150 1,193 1,237 1,287 1,331 30% 4.7%
L 1,009 1,062 1,075 1,097 1,119 1,147 1,168 16% 2.6%
Moldova H 87 96 104 111 118 126 133 53% .
B 86 93 98 102 107 112 117 36% .
L 85 90 92 95 98 101 103 21% .
Morocco H 3,395 3,543 3,759 3,959 4,150 4,351 4,535 34% .
B 3,386 3,482 3,606 3,737 3,858 3,982 4,078 20% .
L 3,376 3,419 3,454 3,512 3,561 3,611 3,634 8% .
Netherlands H 3,337 3,443 3,550 3,661 3,751 3,838 3,940 18% 2.8%
B 3,329 3,400 3,461 3,545 3,615 3,681 3,746 13% 2.0%
L 3,320 3,348 3,349 3,379 3,405 3,436 3,443 4% 0.7%
North Macedonia H 381 415 437 458 478 499 518 36% .
B 380 409 422 436 450 465 477 25% .
L 379 402 405 412 419 426 431 14% .
Norway H 2,435 2,500 2,559 2,624 2,680 2,732 2,772 14% 2.3%
B 2,427 2,462 2,484 2,519 2,549 2,583 2,603 7% 1.3%
L 2,418 2,422 2,406 2,406 2,403 2,406 2,395 -1% -0.1%
Poland H 4,962 5,280 5,475 5,653 5,823 6,000 6,144 24% 3.9%
B 4,947 5,184 5,258 5,370 5,478 5,590 5,660 14% 2.5%
L 4,932 5,085 5,047 5,065 5,090 5,122 5,119 4% 0.8%
Romania H 5,096 5,291 5,556 5,813 6,051 6,303 6,532 28% 4.3%
B 5,071 5,146 5,290 5,460 5,613 5,775 5,902 16% 2.6%
L 5,039 4,996 5,026 5,097 5,167 5,240 5,274 5% 0.8%
Santa Maria FIR H 5,527 5,911 6,151 6,392 6,620 6,861 7,093 28% 4.4%
B 5,498 5,783 5,917 6,075 6,228 6,384 6,508 18% 3.0%
L 5,469 5,653 5,693 5,761 5,824 5,896 5,931 8% 1.5%
2.2 As from 1 January 2020, as agreed by Latvia and Lithuania, the Latvian and Lithuanian charging zones will coincide with the Vilnius and Riga FIR respectively.
The service unit forecast here above take account of the modification of the two charging zones effective on 1 January 2020. 19,855 service units were forecasted for the route segment NINTA-ADAXA for 2020. These forecasted service units have been included in the service unit forecast for the Lithuanian charging zone and excluded from the service unit forecast for the Latvian charging zone. With Model 3, we have assumed that the service units on the NINTA-ADAXA segment will be the same as with Model 2.
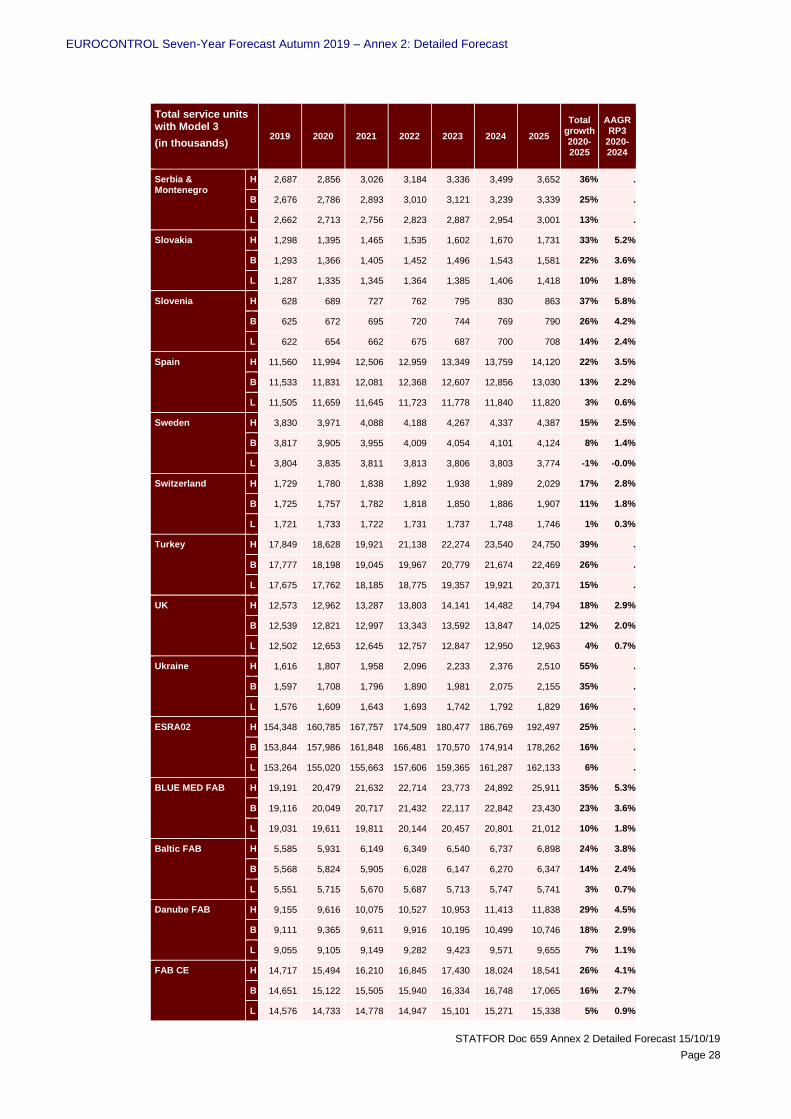
EUROCONTROL Seven-Year Forecast Autumn 2019 – Annex 2: Detailed Forecast
STATFOR Doc 659 Annex 2 Detailed Forecast 15/10/19
Page 28
Total service units with Model 3
(in thousands)
2019 2020 2021 2022 2023 2024 2025
Total growth 2020-2025
AAGR RP3
2020-2024
Serbia & Montenegro
H 2,687 2,856 3,026 3,184 3,336 3,499 3,652 36% .
B 2,676 2,786 2,893 3,010 3,121 3,239 3,339 25% .
L 2,662 2,713 2,756 2,823 2,887 2,954 3,001 13% .
Slovakia H 1,298 1,395 1,465 1,535 1,602 1,670 1,731 33% 5.2%
B 1,293 1,366 1,405 1,452 1,496 1,543 1,581 22% 3.6%
L 1,287 1,335 1,345 1,364 1,385 1,406 1,418 10% 1.8%
Slovenia H 628 689 727 762 795 830 863 37% 5.8%
B 625 672 695 720 744 769 790 26% 4.2%
L 622 654 662 675 687 700 708 14% 2.4%
Spain H 11,560 11,994 12,506 12,959 13,349 13,759 14,120 22% 3.5%
B 11,533 11,831 12,081 12,368 12,607 12,856 13,030 13% 2.2%
L 11,505 11,659 11,645 11,723 11,778 11,840 11,820 3% 0.6%
Sweden H 3,830 3,971 4,088 4,188 4,267 4,337 4,387 15% 2.5%
B 3,817 3,905 3,955 4,009 4,054 4,101 4,124 8% 1.4%
L 3,804 3,835 3,811 3,813 3,806 3,803 3,774 -1% -0.0%
Switzerland H 1,729 1,780 1,838 1,892 1,938 1,989 2,029 17% 2.8%
B 1,725 1,757 1,782 1,818 1,850 1,886 1,907 11% 1.8%
L 1,721 1,733 1,722 1,731 1,737 1,748 1,746 1% 0.3%
Turkey H 17,849 18,628 19,921 21,138 22,274 23,540 24,750 39% .
B 17,777 18,198 19,045 19,967 20,779 21,674 22,469 26% .
L 17,675 17,762 18,185 18,775 19,357 19,921 20,371 15% .
UK H 12,573 12,962 13,287 13,803 14,141 14,482 14,794 18% 2.9%
B 12,539 12,821 12,997 13,343 13,592 13,847 14,025 12% 2.0%
L 12,502 12,653 12,645 12,757 12,847 12,950 12,963 4% 0.7%
Ukraine H 1,616 1,807 1,958 2,096 2,233 2,376 2,510 55% .
B 1,597 1,708 1,796 1,890 1,981 2,075 2,155 35% .
L 1,576 1,609 1,643 1,693 1,742 1,792 1,829 16% .
ESRA02 H 154,348 160,785 167,757 174,509 180,477 186,769 192,497 25% .
B 153,844 157,986 161,848 166,481 170,570 174,914 178,262 16% .
L 153,264 155,020 155,663 157,606 159,365 161,287 162,133 6% .
BLUE MED FAB H 19,191 20,479 21,632 22,714 23,773 24,892 25,911 35% 5.3%
B 19,116 20,049 20,717 21,432 22,117 22,842 23,430 23% 3.6%
L 19,031 19,611 19,811 20,144 20,457 20,801 21,012 10% 1.8%
Baltic FAB H 5,585 5,931 6,149 6,349 6,540 6,737 6,898 24% 3.8%
B 5,568 5,824 5,905 6,028 6,147 6,270 6,347 14% 2.4%
L 5,551 5,715 5,670 5,687 5,713 5,747 5,741 3% 0.7%
Danube FAB H 9,155 9,616 10,075 10,527 10,953 11,413 11,838 29% 4.5%
B 9,111 9,365 9,611 9,916 10,195 10,499 10,746 18% 2.9%
L 9,055 9,105 9,149 9,282 9,423 9,571 9,655 7% 1.1%
FAB CE H 14,717 15,494 16,210 16,845 17,430 18,024 18,541 26% 4.1%
B 14,651 15,122 15,505 15,940 16,334 16,748 17,065 16% 2.7%
L 14,576 14,733 14,778 14,947 15,101 15,271 15,338 5% 0.9%
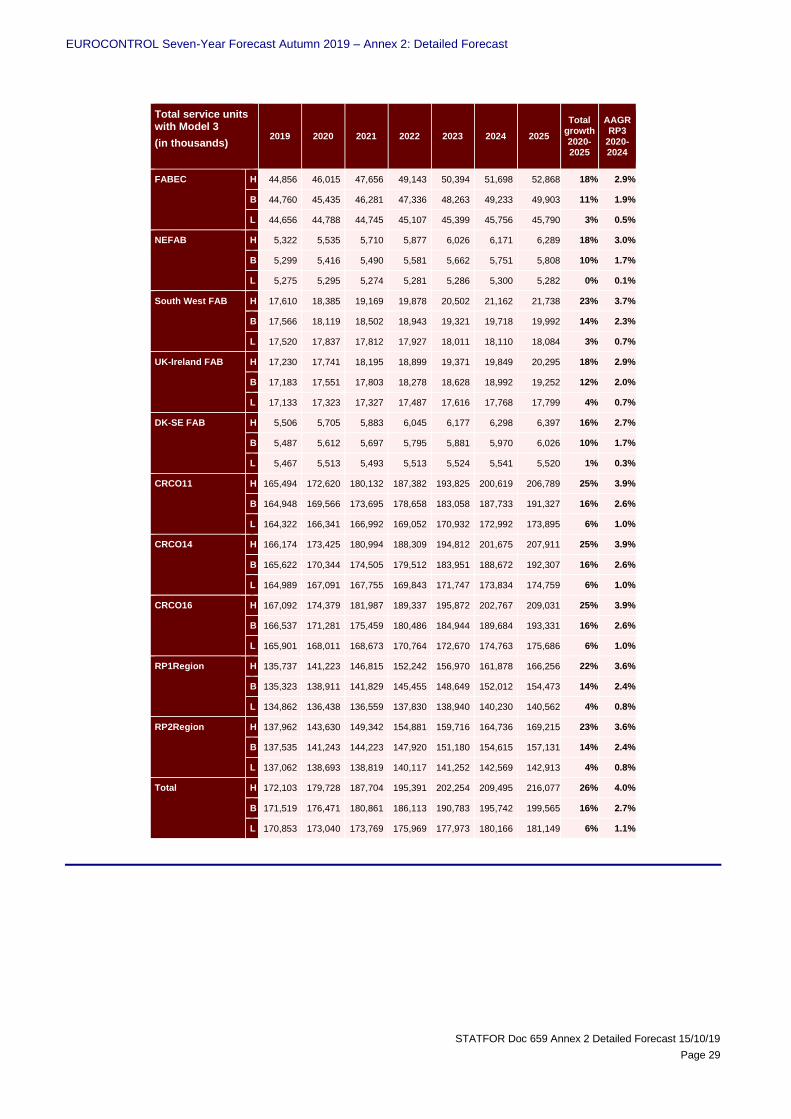
EUROCONTROL Seven-Year Forecast Autumn 2019 – Annex 2: Detailed Forecast
STATFOR Doc 659 Annex 2 Detailed Forecast 15/10/19
Page 29
Total service units with Model 3
(in thousands)
2019 2020 2021 2022 2023 2024 2025
Total growth 2020-2025
AAGR RP3
2020-2024
FABEC H 44,856 46,015 47,656 49,143 50,394 51,698 52,868 18% 2.9%
B 44,760 45,435 46,281 47,336 48,263 49,233 49,903 11% 1.9%
L 44,656 44,788 44,745 45,107 45,399 45,756 45,790 3% 0.5%
NEFAB H 5,322 5,535 5,710 5,877 6,026 6,171 6,289 18% 3.0%
B 5,299 5,416 5,490 5,581 5,662 5,751 5,808 10% 1.7%
L 5,275 5,295 5,274 5,281 5,286 5,300 5,282 0% 0.1%
South West FAB H 17,610 18,385 19,169 19,878 20,502 21,162 21,738 23% 3.7%
B 17,566 18,119 18,502 18,943 19,321 19,718 19,992 14% 2.3%
L 17,520 17,837 17,812 17,927 18,011 18,110 18,084 3% 0.7%
UK-Ireland FAB H 17,230 17,741 18,195 18,899 19,371 19,849 20,295 18% 2.9%
B 17,183 17,551 17,803 18,278 18,628 18,992 19,252 12% 2.0%
L 17,133 17,323 17,327 17,487 17,616 17,768 17,799 4% 0.7%
DK-SE FAB H 5,506 5,705 5,883 6,045 6,177 6,298 6,397 16% 2.7%
B 5,487 5,612 5,697 5,795 5,881 5,970 6,026 10% 1.7%
L 5,467 5,513 5,493 5,513 5,524 5,541 5,520 1% 0.3%
CRCO11 H 165,494 172,620 180,132 187,382 193,825 200,619 206,789 25% 3.9%
B 164,948 169,566 173,695 178,658 183,058 187,733 191,327 16% 2.6%
L 164,322 166,341 166,992 169,052 170,932 172,992 173,895 6% 1.0%
CRCO14 H 166,174 173,425 180,994 188,309 194,812 201,675 207,911 25% 3.9%
B 165,622 170,344 174,505 179,512 183,951 188,672 192,307 16% 2.6%
L 164,989 167,091 167,755 169,843 171,747 173,834 174,759 6% 1.0%
CRCO16 H 167,092 174,379 181,987 189,337 195,872 202,767 209,031 25% 3.9%
B 166,537 171,281 175,459 180,486 184,944 189,684 193,331 16% 2.6%
L 165,901 168,011 168,673 170,764 172,670 174,763 175,686 6% 1.0%
RP1Region H 135,737 141,223 146,815 152,242 156,970 161,878 166,256 22% 3.6%
B 135,323 138,911 141,829 145,455 148,649 152,012 154,473 14% 2.4%
L 134,862 136,438 136,559 137,830 138,940 140,230 140,562 4% 0.8%
RP2Region H 137,962 143,630 149,342 154,881 159,716 164,736 169,215 23% 3.6%
B 137,535 141,243 144,223 147,920 151,180 154,615 157,131 14% 2.4%
L 137,062 138,693 138,819 140,117 141,252 142,569 142,913 4% 0.8%
Total H 172,103 179,728 187,704 195,391 202,254 209,495 216,077 26% 4.0%
B 171,519 176,471 180,861 186,113 190,783 195,742 199,565 16% 2.7%
L 170,853 173,040 173,769 175,969 177,973 180,166 181,149 6% 1.1%

EUROCONTROL Seven-Year Forecast Autumn 2019 – Annex 2: Detailed Forecast
STATFOR Doc 659 Annex 2 Detailed Forecast 15/10/19
Page 30
7. SEVEN-YEAR EN-ROUTE SERVICE UNITS WITH MODEL 3 FORECAST PER STATE (GROWTH)
See Section 6 for additional details about this section.
Figure 8. Forecast of the total en-route service units with Model 3 growth per State.
Total service units with Model 3
(Growth)
2020 2021 2022 2023 2024 2025 AAGR 2020-2025
AAGR RP3
2020-2024
Albania H 6.9% 4.9% 4.7% 4.1% 4.4% 3.9% 4.8% .
B 5.3% 2.8% 3.4% 3.1% 3.3% 2.5% 3.4% .
L 3.6% 0.6% 1.7% 1.6% 1.8% 1.1% 1.7% .
Armenia H 10.0% 7.5% 7.1% 6.9% 7.2% 6.7% 7.6% .
B 4.5% 3.8% 4.1% 4.0% 4.3% 3.7% 4.1% .
L -1.0% 0.4% 1.3% 1.4% 1.7% 1.2% 0.8% .
Austria H 5.8% 4.2% 3.2% 2.8% 2.8% 2.3% 3.5% 3.8%
B 2.8% 2.3% 2.4% 2.1% 2.1% 1.5% 2.2% 2.3%
L -0.3% 0.1% 1.0% 0.7% 0.8% 0.1% 0.4% 0.5%
Belgium / Luxembourg
H 2.8% 3.8% 3.3% 2.8% 2.8% 2.7% 3.0% 3.1%
B 1.4% 2.1% 2.5% 2.2% 2.2% 1.7% 2.0% 2.1%
L -0.2% 0.1% 1.0% 0.9% 1.0% 0.3% 0.5% 0.6%
Bosnia-Herzegovina
H 5.0% 5.1% 4.4% 3.9% 4.0% 3.5% 4.3% .
B 3.7% 3.0% 3.2% 2.8% 2.9% 2.2% 3.0% .
L 2.4% 0.9% 1.6% 1.4% 1.5% 0.8% 1.4% .
Bulgaria H 6.6% 4.5% 4.3% 4.0% 4.2% 3.8% 4.6% 4.7%
B 4.4% 2.4% 3.1% 2.8% 3.1% 2.5% 3.1% 3.2%
L 2.3% 0.3% 1.5% 1.7% 1.8% 1.1% 1.5% 1.5%
Canary Islands
H 6.4% 5.0% 4.6% 4.2% 4.3% 3.7% 4.7% 4.9%
B 5.0% 2.8% 3.1% 2.8% 2.9% 2.1% 3.1% 3.3%
L 3.5% 0.5% 1.3% 1.1% 1.2% 0.5% 1.4% 1.5%
Croatia H 8.2% 4.9% 4.5% 4.0% 4.1% 3.5% 4.9% 5.1%
B 5.4% 2.6% 3.0% 2.7% 2.8% 2.1% 3.1% 3.3%
L 2.5% 0.3% 1.2% 1.1% 1.2% 0.5% 1.1% 1.2%
Cyprus H 7.3% 8.6% 7.5% 7.5% 7.6% 7.1% 7.6% 7.7%
B 5.7% 5.8% 5.6% 5.6% 5.7% 5.0% 5.6% 5.7%
L 4.4% 3.2% 3.7% 3.9% 3.9% 3.2% 3.7% 3.8%
Czech Republic
H 3.0% 4.3% 3.4% 2.9% 2.8% 2.4% 3.1% 3.3%
B 1.8% 2.3% 2.5% 2.1% 2.2% 1.6% 2.1% 2.2%
L 0.5% 0.1% 0.9% 0.7% 0.8% 0.2% 0.5% 0.6%
Denmark H 3.4% 3.5% 3.4% 2.9% 2.7% 2.5% 3.1% 3.2%
B 2.3% 2.0% 2.5% 2.3% 2.3% 1.8% 2.2% 2.3%
L 1.0% 0.2% 1.1% 1.0% 1.2% 0.4% 0.8% 0.9%
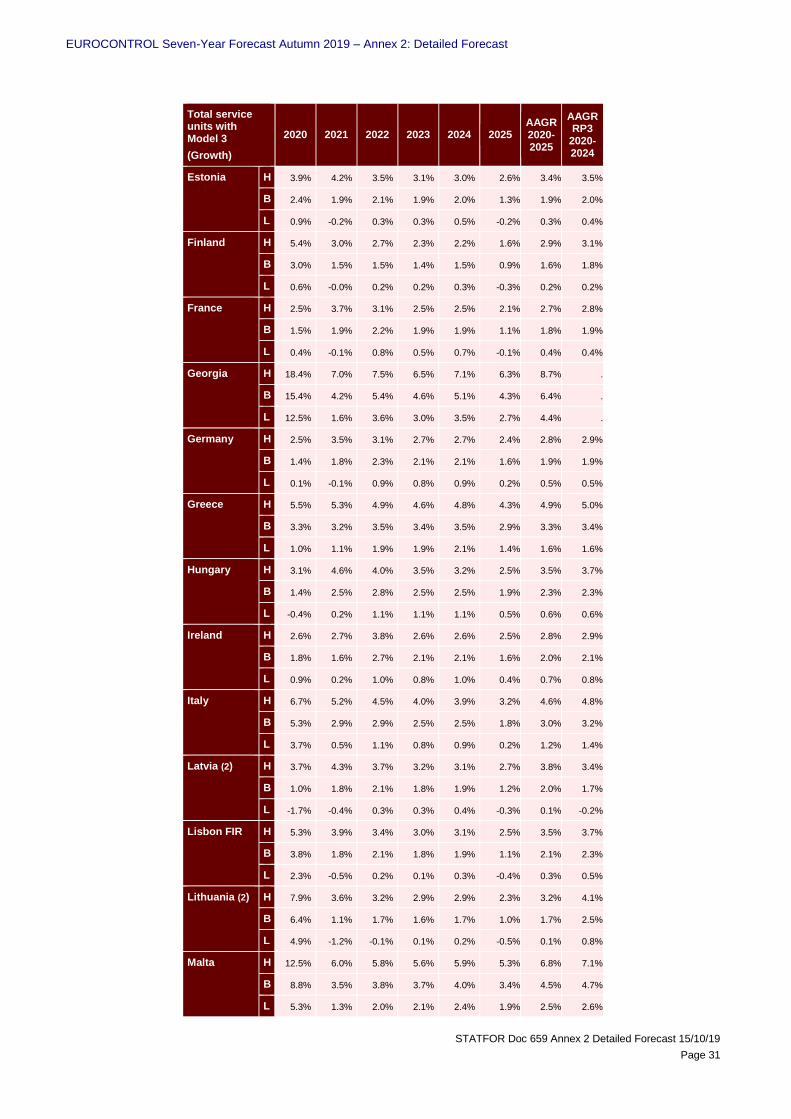
EUROCONTROL Seven-Year Forecast Autumn 2019 – Annex 2: Detailed Forecast
STATFOR Doc 659 Annex 2 Detailed Forecast 15/10/19
Page 31
Total service units with Model 3
(Growth)
2020 2021 2022 2023 2024 2025 AAGR 2020-2025
AAGR RP3
2020-2024
Estonia H 3.9% 4.2% 3.5% 3.1% 3.0% 2.6% 3.4% 3.5%
B 2.4% 1.9% 2.1% 1.9% 2.0% 1.3% 1.9% 2.0%
L 0.9% -0.2% 0.3% 0.3% 0.5% -0.2% 0.3% 0.4%
Finland H 5.4% 3.0% 2.7% 2.3% 2.2% 1.6% 2.9% 3.1%
B 3.0% 1.5% 1.5% 1.4% 1.5% 0.9% 1.6% 1.8%
L 0.6% -0.0% 0.2% 0.2% 0.3% -0.3% 0.2% 0.2%
France H 2.5% 3.7% 3.1% 2.5% 2.5% 2.1% 2.7% 2.8%
B 1.5% 1.9% 2.2% 1.9% 1.9% 1.1% 1.8% 1.9%
L 0.4% -0.1% 0.8% 0.5% 0.7% -0.1% 0.4% 0.4%
Georgia H 18.4% 7.0% 7.5% 6.5% 7.1% 6.3% 8.7% .
B 15.4% 4.2% 5.4% 4.6% 5.1% 4.3% 6.4% .
L 12.5% 1.6% 3.6% 3.0% 3.5% 2.7% 4.4% .
Germany H 2.5% 3.5% 3.1% 2.7% 2.7% 2.4% 2.8% 2.9%
B 1.4% 1.8% 2.3% 2.1% 2.1% 1.6% 1.9% 1.9%
L 0.1% -0.1% 0.9% 0.8% 0.9% 0.2% 0.5% 0.5%
Greece H 5.5% 5.3% 4.9% 4.6% 4.8% 4.3% 4.9% 5.0%
B 3.3% 3.2% 3.5% 3.4% 3.5% 2.9% 3.3% 3.4%
L 1.0% 1.1% 1.9% 1.9% 2.1% 1.4% 1.6% 1.6%
Hungary H 3.1% 4.6% 4.0% 3.5% 3.2% 2.5% 3.5% 3.7%
B 1.4% 2.5% 2.8% 2.5% 2.5% 1.9% 2.3% 2.3%
L -0.4% 0.2% 1.1% 1.1% 1.1% 0.5% 0.6% 0.6%
Ireland H 2.6% 2.7% 3.8% 2.6% 2.6% 2.5% 2.8% 2.9%
B 1.8% 1.6% 2.7% 2.1% 2.1% 1.6% 2.0% 2.1%
L 0.9% 0.2% 1.0% 0.8% 1.0% 0.4% 0.7% 0.8%
Italy H 6.7% 5.2% 4.5% 4.0% 3.9% 3.2% 4.6% 4.8%
B 5.3% 2.9% 2.9% 2.5% 2.5% 1.8% 3.0% 3.2%
L 3.7% 0.5% 1.1% 0.8% 0.9% 0.2% 1.2% 1.4%
Latvia (2) H 3.7% 4.3% 3.7% 3.2% 3.1% 2.7% 3.8% 3.4%
B 1.0% 1.8% 2.1% 1.8% 1.9% 1.2% 2.0% 1.7%
L -1.7% -0.4% 0.3% 0.3% 0.4% -0.3% 0.1% -0.2%
Lisbon FIR H 5.3% 3.9% 3.4% 3.0% 3.1% 2.5% 3.5% 3.7%
B 3.8% 1.8% 2.1% 1.8% 1.9% 1.1% 2.1% 2.3%
L 2.3% -0.5% 0.2% 0.1% 0.3% -0.4% 0.3% 0.5%
Lithuania (2) H 7.9% 3.6% 3.2% 2.9% 2.9% 2.3% 3.2% 4.1%
B 6.4% 1.1% 1.7% 1.6% 1.7% 1.0% 1.7% 2.5%
L 4.9% -1.2% -0.1% 0.1% 0.2% -0.5% 0.1% 0.8%
Malta H 12.5% 6.0% 5.8% 5.6% 5.9% 5.3% 6.8% 7.1%
B 8.8% 3.5% 3.8% 3.7% 4.0% 3.4% 4.5% 4.7%
L 5.3% 1.3% 2.0% 2.1% 2.4% 1.9% 2.5% 2.6%
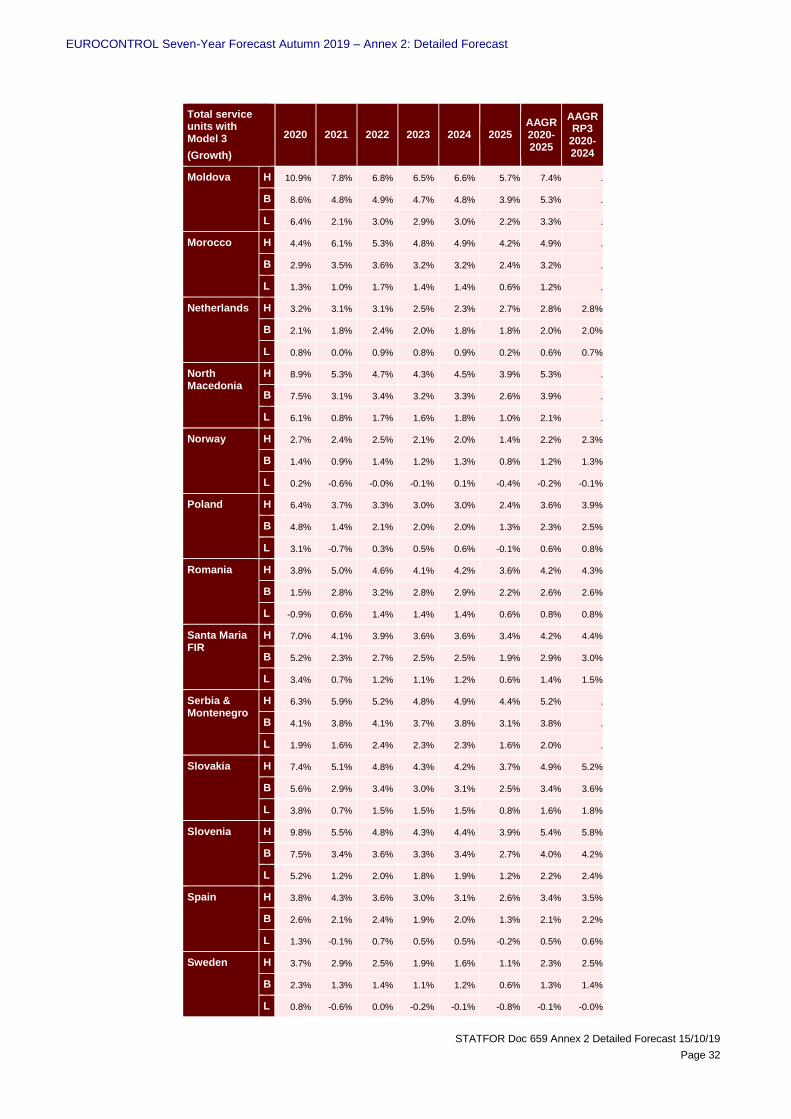
EUROCONTROL Seven-Year Forecast Autumn 2019 – Annex 2: Detailed Forecast
STATFOR Doc 659 Annex 2 Detailed Forecast 15/10/19
Page 32
Total service units with Model 3
(Growth)
2020 2021 2022 2023 2024 2025 AAGR 2020-2025
AAGR RP3
2020-2024
Moldova H 10.9% 7.8% 6.8% 6.5% 6.6% 5.7% 7.4% .
B 8.6% 4.8% 4.9% 4.7% 4.8% 3.9% 5.3% .
L 6.4% 2.1% 3.0% 2.9% 3.0% 2.2% 3.3% .
Morocco H 4.4% 6.1% 5.3% 4.8% 4.9% 4.2% 4.9% .
B 2.9% 3.5% 3.6% 3.2% 3.2% 2.4% 3.2% .
L 1.3% 1.0% 1.7% 1.4% 1.4% 0.6% 1.2% .
Netherlands H 3.2% 3.1% 3.1% 2.5% 2.3% 2.7% 2.8% 2.8%
B 2.1% 1.8% 2.4% 2.0% 1.8% 1.8% 2.0% 2.0%
L 0.8% 0.0% 0.9% 0.8% 0.9% 0.2% 0.6% 0.7%
North Macedonia
H 8.9% 5.3% 4.7% 4.3% 4.5% 3.9% 5.3% .
B 7.5% 3.1% 3.4% 3.2% 3.3% 2.6% 3.9% .
L 6.1% 0.8% 1.7% 1.6% 1.8% 1.0% 2.1% .
Norway H 2.7% 2.4% 2.5% 2.1% 2.0% 1.4% 2.2% 2.3%
B 1.4% 0.9% 1.4% 1.2% 1.3% 0.8% 1.2% 1.3%
L 0.2% -0.6% -0.0% -0.1% 0.1% -0.4% -0.2% -0.1%
Poland H 6.4% 3.7% 3.3% 3.0% 3.0% 2.4% 3.6% 3.9%
B 4.8% 1.4% 2.1% 2.0% 2.0% 1.3% 2.3% 2.5%
L 3.1% -0.7% 0.3% 0.5% 0.6% -0.1% 0.6% 0.8%
Romania H 3.8% 5.0% 4.6% 4.1% 4.2% 3.6% 4.2% 4.3%
B 1.5% 2.8% 3.2% 2.8% 2.9% 2.2% 2.6% 2.6%
L -0.9% 0.6% 1.4% 1.4% 1.4% 0.6% 0.8% 0.8%
Santa Maria FIR
H 7.0% 4.1% 3.9% 3.6% 3.6% 3.4% 4.2% 4.4%
B 5.2% 2.3% 2.7% 2.5% 2.5% 1.9% 2.9% 3.0%
L 3.4% 0.7% 1.2% 1.1% 1.2% 0.6% 1.4% 1.5%
Serbia & Montenegro
H 6.3% 5.9% 5.2% 4.8% 4.9% 4.4% 5.2% .
B 4.1% 3.8% 4.1% 3.7% 3.8% 3.1% 3.8% .
L 1.9% 1.6% 2.4% 2.3% 2.3% 1.6% 2.0% .
Slovakia H 7.4% 5.1% 4.8% 4.3% 4.2% 3.7% 4.9% 5.2%
B 5.6% 2.9% 3.4% 3.0% 3.1% 2.5% 3.4% 3.6%
L 3.8% 0.7% 1.5% 1.5% 1.5% 0.8% 1.6% 1.8%
Slovenia H 9.8% 5.5% 4.8% 4.3% 4.4% 3.9% 5.4% 5.8%
B 7.5% 3.4% 3.6% 3.3% 3.4% 2.7% 4.0% 4.2%
L 5.2% 1.2% 2.0% 1.8% 1.9% 1.2% 2.2% 2.4%
Spain H 3.8% 4.3% 3.6% 3.0% 3.1% 2.6% 3.4% 3.5%
B 2.6% 2.1% 2.4% 1.9% 2.0% 1.3% 2.1% 2.2%
L 1.3% -0.1% 0.7% 0.5% 0.5% -0.2% 0.5% 0.6%
Sweden H 3.7% 2.9% 2.5% 1.9% 1.6% 1.1% 2.3% 2.5%
B 2.3% 1.3% 1.4% 1.1% 1.2% 0.6% 1.3% 1.4%
L 0.8% -0.6% 0.0% -0.2% -0.1% -0.8% -0.1% -0.0%
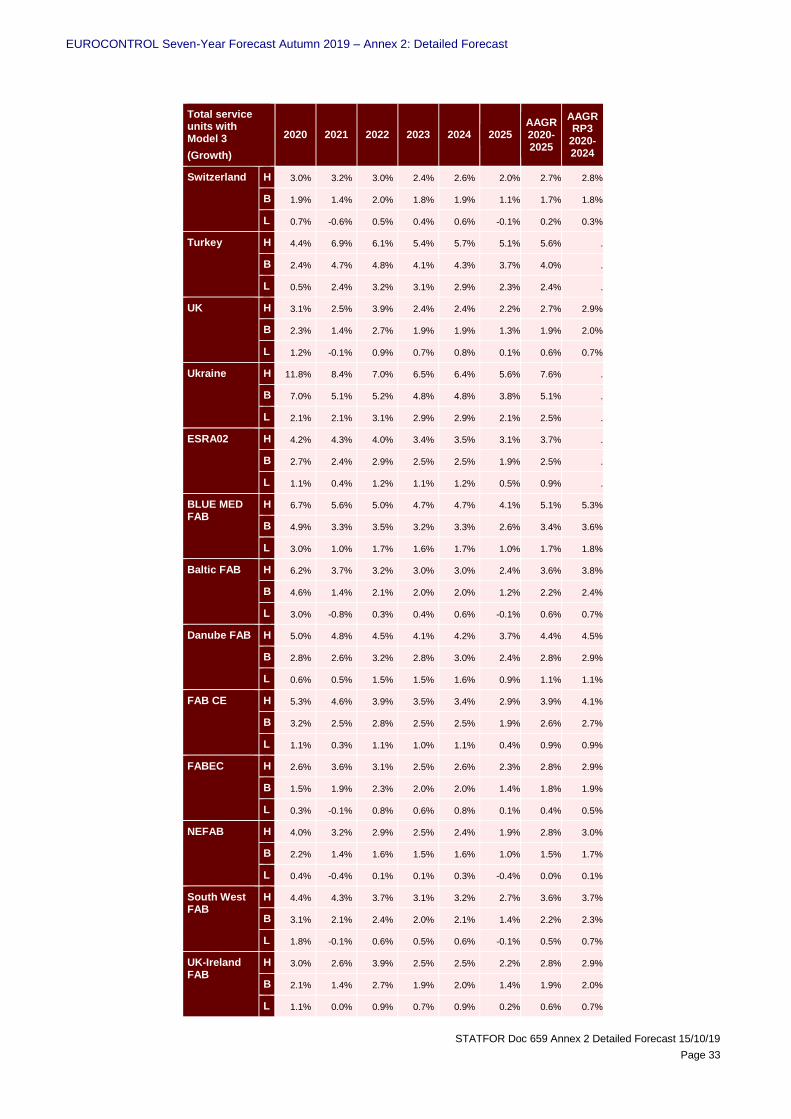
EUROCONTROL Seven-Year Forecast Autumn 2019 – Annex 2: Detailed Forecast
STATFOR Doc 659 Annex 2 Detailed Forecast 15/10/19
Page 33
Total service units with Model 3
(Growth)
2020 2021 2022 2023 2024 2025 AAGR 2020-2025
AAGR RP3
2020-2024
Switzerland H 3.0% 3.2% 3.0% 2.4% 2.6% 2.0% 2.7% 2.8%
B 1.9% 1.4% 2.0% 1.8% 1.9% 1.1% 1.7% 1.8%
L 0.7% -0.6% 0.5% 0.4% 0.6% -0.1% 0.2% 0.3%
Turkey H 4.4% 6.9% 6.1% 5.4% 5.7% 5.1% 5.6% .
B 2.4% 4.7% 4.8% 4.1% 4.3% 3.7% 4.0% .
L 0.5% 2.4% 3.2% 3.1% 2.9% 2.3% 2.4% .
UK H 3.1% 2.5% 3.9% 2.4% 2.4% 2.2% 2.7% 2.9%
B 2.3% 1.4% 2.7% 1.9% 1.9% 1.3% 1.9% 2.0%
L 1.2% -0.1% 0.9% 0.7% 0.8% 0.1% 0.6% 0.7%
Ukraine H 11.8% 8.4% 7.0% 6.5% 6.4% 5.6% 7.6% .
B 7.0% 5.1% 5.2% 4.8% 4.8% 3.8% 5.1% .
L 2.1% 2.1% 3.1% 2.9% 2.9% 2.1% 2.5% .
ESRA02 H 4.2% 4.3% 4.0% 3.4% 3.5% 3.1% 3.7% .
B 2.7% 2.4% 2.9% 2.5% 2.5% 1.9% 2.5% .
L 1.1% 0.4% 1.2% 1.1% 1.2% 0.5% 0.9% .
BLUE MED FAB
H 6.7% 5.6% 5.0% 4.7% 4.7% 4.1% 5.1% 5.3%
B 4.9% 3.3% 3.5% 3.2% 3.3% 2.6% 3.4% 3.6%
L 3.0% 1.0% 1.7% 1.6% 1.7% 1.0% 1.7% 1.8%
Baltic FAB H 6.2% 3.7% 3.2% 3.0% 3.0% 2.4% 3.6% 3.8%
B 4.6% 1.4% 2.1% 2.0% 2.0% 1.2% 2.2% 2.4%
L 3.0% -0.8% 0.3% 0.4% 0.6% -0.1% 0.6% 0.7%
Danube FAB H 5.0% 4.8% 4.5% 4.1% 4.2% 3.7% 4.4% 4.5%
B 2.8% 2.6% 3.2% 2.8% 3.0% 2.4% 2.8% 2.9%
L 0.6% 0.5% 1.5% 1.5% 1.6% 0.9% 1.1% 1.1%
FAB CE H 5.3% 4.6% 3.9% 3.5% 3.4% 2.9% 3.9% 4.1%
B 3.2% 2.5% 2.8% 2.5% 2.5% 1.9% 2.6% 2.7%
L 1.1% 0.3% 1.1% 1.0% 1.1% 0.4% 0.9% 0.9%
FABEC H 2.6% 3.6% 3.1% 2.5% 2.6% 2.3% 2.8% 2.9%
B 1.5% 1.9% 2.3% 2.0% 2.0% 1.4% 1.8% 1.9%
L 0.3% -0.1% 0.8% 0.6% 0.8% 0.1% 0.4% 0.5%
NEFAB H 4.0% 3.2% 2.9% 2.5% 2.4% 1.9% 2.8% 3.0%
B 2.2% 1.4% 1.6% 1.5% 1.6% 1.0% 1.5% 1.7%
L 0.4% -0.4% 0.1% 0.1% 0.3% -0.4% 0.0% 0.1%
South West FAB
H 4.4% 4.3% 3.7% 3.1% 3.2% 2.7% 3.6% 3.7%
B 3.1% 2.1% 2.4% 2.0% 2.1% 1.4% 2.2% 2.3%
L 1.8% -0.1% 0.6% 0.5% 0.6% -0.1% 0.5% 0.7%
UK-Ireland FAB
H 3.0% 2.6% 3.9% 2.5% 2.5% 2.2% 2.8% 2.9%
B 2.1% 1.4% 2.7% 1.9% 2.0% 1.4% 1.9% 2.0%
L 1.1% 0.0% 0.9% 0.7% 0.9% 0.2% 0.6% 0.7%
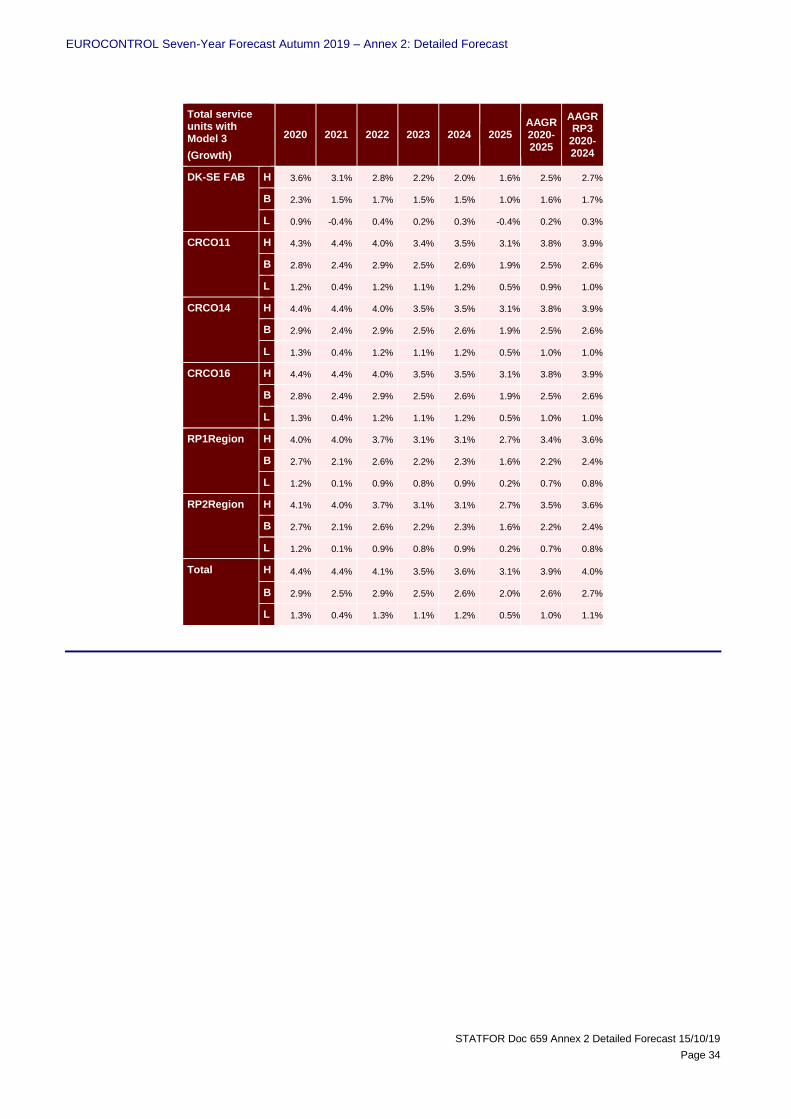
EUROCONTROL Seven-Year Forecast Autumn 2019 – Annex 2: Detailed Forecast
STATFOR Doc 659 Annex 2 Detailed Forecast 15/10/19
Page 34
Total service units with Model 3
(Growth)
2020 2021 2022 2023 2024 2025 AAGR 2020-2025
AAGR RP3
2020-2024
DK-SE FAB H 3.6% 3.1% 2.8% 2.2% 2.0% 1.6% 2.5% 2.7%
B 2.3% 1.5% 1.7% 1.5% 1.5% 1.0% 1.6% 1.7%
L 0.9% -0.4% 0.4% 0.2% 0.3% -0.4% 0.2% 0.3%
CRCO11 H 4.3% 4.4% 4.0% 3.4% 3.5% 3.1% 3.8% 3.9%
B 2.8% 2.4% 2.9% 2.5% 2.6% 1.9% 2.5% 2.6%
L 1.2% 0.4% 1.2% 1.1% 1.2% 0.5% 0.9% 1.0%
CRCO14 H 4.4% 4.4% 4.0% 3.5% 3.5% 3.1% 3.8% 3.9%
B 2.9% 2.4% 2.9% 2.5% 2.6% 1.9% 2.5% 2.6%
L 1.3% 0.4% 1.2% 1.1% 1.2% 0.5% 1.0% 1.0%
CRCO16 H 4.4% 4.4% 4.0% 3.5% 3.5% 3.1% 3.8% 3.9%
B 2.8% 2.4% 2.9% 2.5% 2.6% 1.9% 2.5% 2.6%
L 1.3% 0.4% 1.2% 1.1% 1.2% 0.5% 1.0% 1.0%
RP1Region H 4.0% 4.0% 3.7% 3.1% 3.1% 2.7% 3.4% 3.6%
B 2.7% 2.1% 2.6% 2.2% 2.3% 1.6% 2.2% 2.4%
L 1.2% 0.1% 0.9% 0.8% 0.9% 0.2% 0.7% 0.8%
RP2Region H 4.1% 4.0% 3.7% 3.1% 3.1% 2.7% 3.5% 3.6%
B 2.7% 2.1% 2.6% 2.2% 2.3% 1.6% 2.2% 2.4%
L 1.2% 0.1% 0.9% 0.8% 0.9% 0.2% 0.7% 0.8%
Total H 4.4% 4.4% 4.1% 3.5% 3.6% 3.1% 3.9% 4.0%
B 2.9% 2.5% 2.9% 2.5% 2.6% 2.0% 2.6% 2.7%
L 1.3% 0.4% 1.3% 1.1% 1.2% 0.5% 1.0% 1.1%

EUROCONTROL Seven-Year Forecast Autumn 2019 – Annex 2: Detailed Forecast
STATFOR Doc 659 Annex 2 Detailed Forecast 15/10/19
Page 35
8. TERMINAL NAVIGATION SERVICE UNITS FORECAST PER STATE (THOUSANDS)
This section presents the forecast of the terminal navigation service units based on the terminal charging zones as defined in 2018 for RP2 and the use of a 0.7 exponent in the terminal service unit definition (to be used as of 2015). The historical values up to 2018 have been reconstructed based on CRCO data with the TCZ definitions and the exponent used to compute the TNSU as applicable by states according to their RP1 performance plans up to 2014 and to the definition of RP2 from 2015 with a 0.7 exponent.
For this forecast, the TCZ definitions available at end of September 2019 were used (see Annex 1 - Traffic Region Definitions)
Figure 9. Forecast of the total number of Terminal service units (thousands) per Terminal Charging Zone.
Terminal Navigation Service Units
(Thousands) 2015 2016 2017 2018 2019 2020 2021 2022 2023 2024 2025
Total Growth 2019-2025
Austria LO_TCZ H . . . . 207.9 228.5 232.7 233.1 233.1 233.3 233.3 18%
B 180.7 181.5 183.4 197.2 207.8 222.8 226.2 230.7 231.1 230.8 230.4 17%
L . . . . 207.7 218.1 216.9 217.0 216.2 215.5 213.8 8%
Belgium EB_TCZ_EBAW H . . . . 3.0 3.1 3.2 3.3 3.4 3.5 3.6 27%
B 2.6 2.8 2.4 2.8 3.0 3.1 3.1 3.1 3.2 3.3 3.3 17%
L . . . . 3.0 3.0 3.0 3.0 3.0 3.0 3.0 7%
EB_TCZ_EBBR H . . . . 160.5 166.5 173.0 179.1 186.1 193.1 199.0 24%
B 154.6 145.9 157.8 161.1 159.9 162.9 166.3 169.4 172.9 176.6 180.2 12%
L . . . . 159.3 159.3 158.3 159.4 160.8 161.7 161.6 0%
EB_TCZ_EBCI H . . . . 33.9 35.4 36.9 38.4 39.8 41.3 42.9 32%
B 29.1 30.3 31.0 32.4 33.6 34.7 35.4 36.3 37.1 37.9 38.5 19%
L . . . . 33.5 33.8 33.8 33.9 34.2 34.4 34.4 6%
EB_TCZ_EBLG H . . . . 34.7 36.4 38.4 40.3 42.6 44.7 46.6 33%
B 27.6 28.7 30.8 35.2 33.5 35.6 36.8 38.3 39.6 41.1 42.7 21%
L . . . . 33.4 34.9 35.2 36.2 37.1 38.0 38.8 10%
EB_TCZ_EBOS H . . . . 3.7 4.0 4.1 4.3 4.4 5.0 5.2 53%
B 2.3 3.3 3.0 3.4 3.7 3.9 4.0 4.1 4.2 4.3 4.4 31%
L . . . . 3.7 3.8 3.8 3.9 4.0 4.0 4.1 20%
Bulgaria LB_TCZ H . . . . 33.5 34.7 36.9 38.7 40.6 42.7 45.0 29%
B 24.1 28.6 33.0 34.9 33.3 33.7 34.8 36.1 37.1 38.2 39.0 12%
L . . . . 33.1 32.8 32.8 33.2 33.4 33.8 33.8 -3%
Croatia LD_TCZ H . . . . 21.9 22.6 23.5 24.3 25.2 26.1 26.0 24%
B 17.4 18.3 19.6 21.0 21.8 22.0 22.4 22.9 23.3 24.0 24.4 16%
L . . . . 21.7 21.5 21.3 21.3 21.3 21.4 21.3 1%
Cyprus LC_TCZ H . . . . 55.5 56.0 59.8 63.5 67.1 70.3 74.3 31%
B 40.4 47.3 54.2 56.7 55.3 54.5 56.5 58.3 60.7 62.9 64.5 14%
L . . . . 54.9 53.2 53.3 53.6 54.1 54.4 55.0 -3%
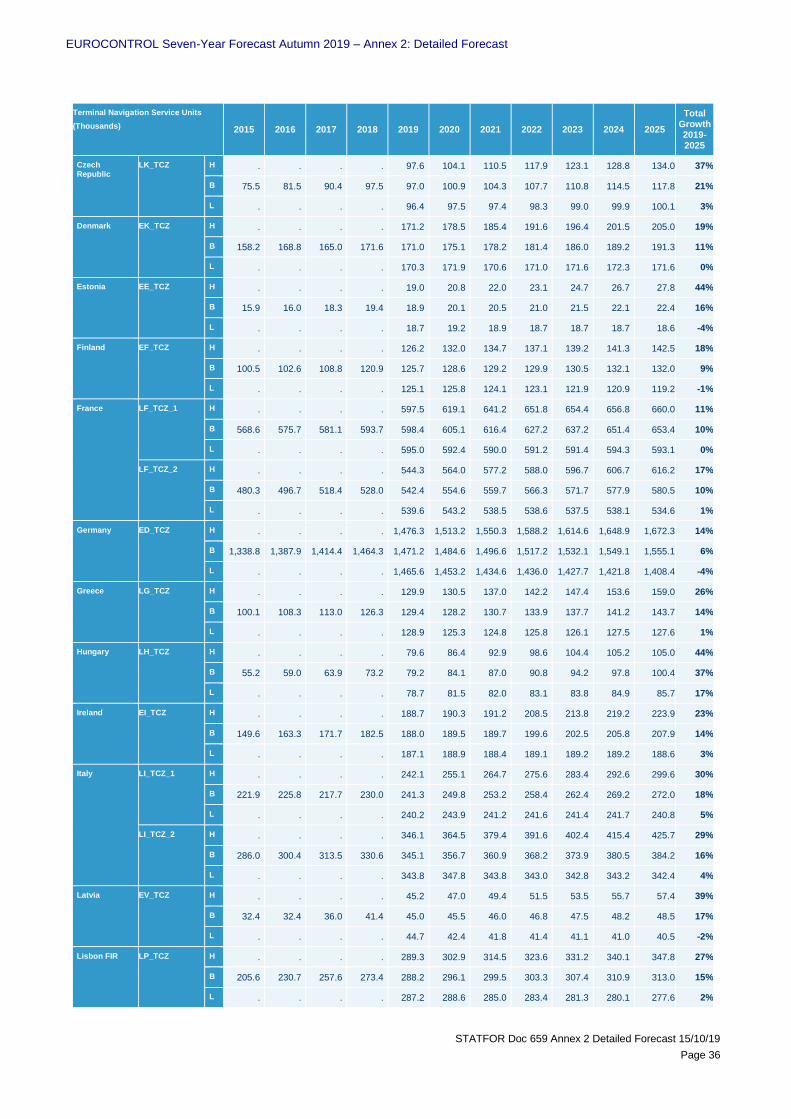
EUROCONTROL Seven-Year Forecast Autumn 2019 – Annex 2: Detailed Forecast
STATFOR Doc 659 Annex 2 Detailed Forecast 15/10/19
Page 36
Terminal Navigation Service Units
(Thousands) 2015 2016 2017 2018 2019 2020 2021 2022 2023 2024 2025
Total Growth 2019-2025
Czech Republic
LK_TCZ H . . . . 97.6 104.1 110.5 117.9 123.1 128.8 134.0 37%
B 75.5 81.5 90.4 97.5 97.0 100.9 104.3 107.7 110.8 114.5 117.8 21%
L . . . . 96.4 97.5 97.4 98.3 99.0 99.9 100.1 3%
Denmark EK_TCZ H . . . . 171.2 178.5 185.4 191.6 196.4 201.5 205.0 19%
B 158.2 168.8 165.0 171.6 171.0 175.1 178.2 181.4 186.0 189.2 191.3 11%
L . . . . 170.3 171.9 170.6 171.0 171.6 172.3 171.6 0%
Estonia EE_TCZ H . . . . 19.0 20.8 22.0 23.1 24.7 26.7 27.8 44%
B 15.9 16.0 18.3 19.4 18.9 20.1 20.5 21.0 21.5 22.1 22.4 16%
L . . . . 18.7 19.2 18.9 18.7 18.7 18.7 18.6 -4%
Finland EF_TCZ H . . . . 126.2 132.0 134.7 137.1 139.2 141.3 142.5 18%
B 100.5 102.6 108.8 120.9 125.7 128.6 129.2 129.9 130.5 132.1 132.0 9%
L . . . . 125.1 125.8 124.1 123.1 121.9 120.9 119.2 -1%
France LF_TCZ_1 H . . . . 597.5 619.1 641.2 651.8 654.4 656.8 660.0 11%
B 568.6 575.7 581.1 593.7 598.4 605.1 616.4 627.2 637.2 651.4 653.4 10%
L . . . . 595.0 592.4 590.0 591.2 591.4 594.3 593.1 0%
LF_TCZ_2 H . . . . 544.3 564.0 577.2 588.0 596.7 606.7 616.2 17%
B 480.3 496.7 518.4 528.0 542.4 554.6 559.7 566.3 571.7 577.9 580.5 10%
L . . . . 539.6 543.2 538.5 538.6 537.5 538.1 534.6 1%
Germany ED_TCZ H . . . . 1,476.3 1,513.2 1,550.3 1,588.2 1,614.6 1,648.9 1,672.3 14%
B 1,338.8 1,387.9 1,414.4 1,464.3 1,471.2 1,484.6 1,496.6 1,517.2 1,532.1 1,549.1 1,555.1 6%
L . . . . 1,465.6 1,453.2 1,434.6 1,436.0 1,427.7 1,421.8 1,408.4 -4%
Greece LG_TCZ H . . . . 129.9 130.5 137.0 142.2 147.4 153.6 159.0 26%
B 100.1 108.3 113.0 126.3 129.4 128.2 130.7 133.9 137.7 141.2 143.7 14%
L . . . . 128.9 125.3 124.8 125.8 126.1 127.5 127.6 1%
Hungary LH_TCZ H . . . . 79.6 86.4 92.9 98.6 104.4 105.2 105.0 44%
B 55.2 59.0 63.9 73.2 79.2 84.1 87.0 90.8 94.2 97.8 100.4 37%
L . . . . 78.7 81.5 82.0 83.1 83.8 84.9 85.7 17%
Ireland EI_TCZ H . . . . 188.7 190.3 191.2 208.5 213.8 219.2 223.9 23%
B 149.6 163.3 171.7 182.5 188.0 189.5 189.7 199.6 202.5 205.8 207.9 14%
L . . . . 187.1 188.9 188.4 189.1 189.2 189.2 188.6 3%
Italy LI_TCZ_1 H . . . . 242.1 255.1 264.7 275.6 283.4 292.6 299.6 30%
B 221.9 225.8 217.7 230.0 241.3 249.8 253.2 258.4 262.4 269.2 272.0 18%
L . . . . 240.2 243.9 241.2 241.6 241.4 241.7 240.8 5%
LI_TCZ_2 H . . . . 346.1 364.5 379.4 391.6 402.4 415.4 425.7 29%
B 286.0 300.4 313.5 330.6 345.1 356.7 360.9 368.2 373.9 380.5 384.2 16%
L . . . . 343.8 347.8 343.8 343.0 342.8 343.2 342.4 4%
Latvia EV_TCZ H . . . . 45.2 47.0 49.4 51.5 53.5 55.7 57.4 39%
B 32.4 32.4 36.0 41.4 45.0 45.5 46.0 46.8 47.5 48.2 48.5 17%
L . . . . 44.7 42.4 41.8 41.4 41.1 41.0 40.5 -2%
Lisbon FIR LP_TCZ H . . . . 289.3 302.9 314.5 323.6 331.2 340.1 347.8 27%
B 205.6 230.7 257.6 273.4 288.2 296.1 299.5 303.3 307.4 310.9 313.0 15%
L . . . . 287.2 288.6 285.0 283.4 281.3 280.1 277.6 2%

EUROCONTROL Seven-Year Forecast Autumn 2019 – Annex 2: Detailed Forecast
STATFOR Doc 659 Annex 2 Detailed Forecast 15/10/19
Page 37
Terminal Navigation Service Units
(Thousands) 2015 2016 2017 2018 2019 2020 2021 2022 2023 2024 2025
Total Growth 2019-2025
Lithuania EY_TCZ H . . . . 34.0 35.7 38.7 40.8 42.7 44.7 46.3 40%
B 25.1 26.8 29.1 33.2 33.8 34.7 35.6 37.5 38.6 39.6 40.1 21%
L . . . . 33.6 34.2 33.9 34.5 34.7 34.9 35.1 6%
Luxembourg EL_TCZ H . . . . 55.5 57.3 59.3 61.6 64.0 65.6 67.6 24%
B 41.1 45.8 51.2 54.7 55.2 56.1 57.1 58.5 59.8 61.3 62.5 14%
L . . . . 55.0 55.2 55.0 55.3 55.8 56.5 56.8 4%
Malta LM_TCZ H . . . . 36.5 39.0 41.5 43.8 46.1 48.4 50.5 44%
B 25.4 26.9 31.2 35.1 36.4 38.0 39.3 40.7 42.0 43.7 44.7 27%
L . . . . 36.1 36.8 37.2 37.7 37.9 38.3 38.5 10%
Netherlands EH_TCZ H . . . . 407.6 420.9 428.5 429.9 431.3 432.7 451.8 9%
B 369.2 390.2 406.1 412.9 406.5 413.5 418.6 424.9 428.1 428.8 439.4 6%
L . . . . 404.9 404.8 401.6 401.3 400.8 401.1 397.9 -4%
Norway EN_TCZ H . . . . 257.0 264.8 271.4 276.1 281.4 284.4 285.4 13%
B 241.7 242.1 246.2 252.6 256.3 261.3 263.5 266.6 269.0 271.9 280.8 11%
L . . . . 255.6 257.2 255.3 254.8 253.9 260.7 258.0 2%
Poland EP_TCZ_EPWA H . . . . 108.2 115.5 120.9 122.7 124.6 124.8 125.4 22%
B 70.8 78.7 90.7 102.6 107.8 113.0 115.8 118.6 121.3 123.3 123.8 21%
L . . . . 107.4 110.1 110.9 111.1 111.8 113.0 113.0 10%
EP_TCZ_OTHR H . . . . 134.6 142.0 147.8 153.5 158.2 163.7 168.1 29%
B 96.4 103.9 113.4 130.9 134.2 139.7 143.0 146.7 150.3 153.5 156.0 19%
L . . . . 133.7 137.1 137.7 139.5 140.4 142.2 143.1 9%
Romania LR_TCZ H . . . . 72.7 77.3 82.5 86.2 90.5 93.8 96.9 34%
B 54.6 61.6 67.5 72.2 72.5 75.5 77.7 81.2 83.3 86.3 87.6 21%
L . . . . 72.1 72.4 72.5 73.3 74.0 74.0 73.9 2%
Slovakia LZ_TCZ H . . . . 12.5 13.3 14.5 15.4 16.2 17.1 18.2 46%
B 9.4 10.3 11.1 12.5 12.4 12.9 13.7 14.3 14.9 15.5 15.9 28%
L . . . . 12.4 12.6 12.7 13.0 13.5 13.9 14.2 14%
Slovenia LJ_TCZ H . . . . 12.9 13.5 15.0 15.7 16.6 17.3 17.9 28%
B 12.0 11.6 13.0 13.9 12.7 12.8 14.5 15.0 15.4 16.1 16.5 18%
L . . . . 12.6 12.6 13.6 13.8 14.0 14.2 14.5 4%
Spain LE_TCZ H . . . . 950.1 993.1 1,037.4 1,078.7 1,113.4 1,149.1 1,183.2 43%
B 680.5 741.1 781.5 825.3 946.6 971.2 994.6 1,019.1 1,039.5 1,058.6 1,071.9 30%
L . . . . 942.9 949.1 950.3 954.6 959.4 964.3 961.5 17%
Sweden ES_TCZ_A H . . . . 185.2 187.9 193.9 199.4 204.7 207.1 208.2 7%
B 137.1 143.9 193.0 194.2 184.7 185.0 187.1 190.0 192.4 195.3 197.1 2%
L . . . . 184.0 181.0 179.4 179.3 179.0 179.1 177.6 -9%
Switzerland LS_TCZ H . . . . 293.1 305.3 312.1 319.6 326.1 334.8 341.4 17%
B 266.6 279.8 283.8 291.0 292.1 300.1 303.6 308.5 312.1 317.7 320.4 10%
L . . . . 291.0 294.5 293.5 295.0 295.2 297.5 296.5 2%

EUROCONTROL Seven-Year Forecast Autumn 2019 – Annex 2: Detailed Forecast
STATFOR Doc 659 Annex 2 Detailed Forecast 15/10/19
Page 38
Terminal Navigation Service Units
(Thousands) 2015 2016 2017 2018 2019 2020 2021 2022 2023 2024 2025
Total Growth 2019-2025
UK EG_TCZ_B H . . . . 1,318.8 1,343.4 1,370.1 1,408.4 1,430.7 1,453.3 1,465.9 12%
B 1,187.0 1,256.1 1,292.6 1,304.1 1,315.3 1,331.1 1,342.3 1,367.7 1,384.9 1,400.9 1,406.8 8%
L . . . . 1,309.2 1,298.1 1,299.3 1,303.4 1,305.2 1,309.3 1,304.0 0%
EG_TCZ_C H . . . . 992.8 1,008.4 1,027.4 1,059.1 1,075.5 1,092.3 1,100.6 12%
B 907.6 946.8 964.9 982.4 990.4 1,001.6 1,010.5 1,032.3 1,045.7 1,059.1 1,064.7 8%
L . . . . 985.7 977.4 980.0 985.3 988.9 993.8 991.8 1%

EUROCONTROL Seven-Year Forecast Autumn 2019 – Annex 2: Detailed Forecast
STATFOR Doc 659 Annex 2 Detailed Forecast 15/10/19
Page 39
9. TERMINAL NAVIGATION SERVICE UNITS FORECAST PER STATE (GROWTH)
This section presents the same data as the previous section, but displayed as annual growth rather than counts of terminal navigation service units. The high growth observed for Spain in 2019 is linked to the addition of two airports (Alicante LEAL and Ibiza LEIB) in LE_TCZ from 2019.
Figure 10. Forecast of the total number of Terminal service units (Growth) per Terminal Charging Zone.
Terminal Navigation Service Units
(Growth) 2015 2016 2017 2018 2019 2020 2021 2022 2023 2024 2025 AAGR 2019-2025
RP2 2015-2019
RP3 2020-2024
Austria LO_TCZ H . . . . 5.5% 9.9% 1.9% 0.1% -0.0% 0.1% 0.0% 2.4% 3.1% 2.3%
B 1.3% 0.5% 1.0% 7.5% 5.4% 7.2% 1.5% 2.0% 0.2% -0.1% -0.2% 2.2% 3.1% 2.1%
L . . . . 5.3% 5.0% -0.6% 0.1% -0.4% -0.3% -0.8% 1.2% 3.1% 0.6%
Belgium EB_TCZ_EBAW H . . . . 7.9% 3.0% 2.6% 3.2% 2.3% 3.6% 2.0% 3.5% 12.5% 3.4%
B 56.1% 6.2% -13.8% 17.0% 7.2% 2.1% 1.1% 1.1% 1.3% 2.1% 0.9% 2.2% 12.4% 1.7%
L . . . . 6.8% -0.4% -0.5% 0.3% 0.2% 0.7% -0.4% 0.9% 12.3% 0.0%
EB_TCZ_EBBR H . . . . -0.4% 3.7% 3.9% 3.5% 3.9% 3.8% 3.1% 3.1% 1.8% 4.4%
B 5.5% -5.6% 8.1% 2.1% -0.8% 1.8% 2.1% 1.9% 2.0% 2.1% 2.0% 1.6% 1.8% 2.4%
L . . . . -1.1% 0.0% -0.6% 0.7% 0.9% 0.6% -0.1% 0.0% 1.7% 0.3%
EB_TCZ_EBCI H . . . . 4.4% 4.6% 4.2% 3.9% 3.9% 3.6% 3.9% 4.1% 3.8% 4.8%
B 3.8% 3.9% 2.3% 4.7% 3.7% 3.2% 2.1% 2.4% 2.2% 2.3% 1.6% 2.5% 3.7% 2.8%
L . . . . 3.3% 0.9% -0.0% 0.4% 0.7% 0.8% -0.0% 0.9% 3.6% 0.6%
EB_TCZ_EBLG H . . . . -1.4% 4.8% 5.4% 5.0% 5.7% 5.1% 4.2% 4.1% 7.0% 6.1%
B 11.4% 4.2% 7.2% 14.3% -4.7% 6.3% 3.2% 4.0% 3.6% 3.7% 3.9% 2.8% 6.3% 4.9%
L . . . . -5.1% 4.4% 1.0% 2.7% 2.5% 2.6% 1.9% 1.4% 6.2% 3.0%
EB_TCZ_EBOS H . . . . 9.2% 6.8% 3.7% 4.6% 3.3% 12.0% 4.2% 6.2% 9.5% 6.9%
B -3.3% 46.5% -11.2% 14.6% 8.9% 4.9% 2.3% 2.6% 3.2% 2.8% 2.8% 3.9% 9.4% 3.7%
L . . . . 8.4% 2.8% 1.1% 2.0% 1.9% 1.5% 1.3% 2.7% 9.3% 2.1%
Bulgaria LB_TCZ H . . . . -4.1% 3.7% 6.2% 5.1% 4.8% 5.3% 5.4% 3.7% -5.4% 6.1%
B -45.6% 18.8% 15.3% 5.8% -4.6% 1.4% 3.3% 3.5% 2.8% 3.1% 2.0% 1.6% -5.5% 3.2%
L . . . . -5.1% -0.8% -0.2% 1.3% 0.6% 1.2% 0.0% -0.5% -5.6% 0.4%
Croatia LD_TCZ H . . . . 4.0% 3.3% 4.2% 3.2% 3.7% 3.6% -0.2% 3.1% 6.0% 3.6%
B 6.2% 5.2% 7.2% 7.4% 3.6% 1.2% 1.6% 2.4% 1.7% 2.8% 1.7% 2.1% 5.9% 2.3%
L . . . . 3.1% -1.0% -0.7% 0.1% -0.1% 0.2% -0.4% 0.2% 5.8% -0.4%
Cyprus LC_TCZ H . . . . -2.0% 0.9% 6.8% 6.2% 5.6% 4.8% 5.6% 3.9% 6.8% 6.0%
B 1.0% 17.0% 14.7% 4.5% -2.4% -1.4% 3.7% 3.1% 4.1% 3.6% 2.5% 1.9% 6.7% 3.1%
L . . . . -3.1% -3.2% 0.2% 0.7% 0.9% 0.5% 1.0% -0.4% 6.6% 0.0%
Czech Republic
LK_TCZ H . . . . 0.1% 6.7% 6.1% 6.7% 4.4% 4.6% 4.0% 4.6% 6.0% 6.5%
B 3.6% 7.9% 11.0% 7.9% -0.6% 4.0% 3.4% 3.2% 2.9% 3.3% 2.9% 2.7% 5.9% 4.0%
L . . . . -1.2% 1.2% -0.1% 0.8% 0.8% 0.8% 0.2% 0.4% 5.7% 0.8%
Denmark EK_TCZ H . . . . -0.3% 4.2% 3.9% 3.4% 2.5% 2.6% 1.7% 2.6% 2.1% 3.7%
B 2.4% 6.7% -2.3% 4.0% -0.4% 2.4% 1.7% 1.8% 2.5% 1.7% 1.1% 1.6% 2.0% 2.3%
L . . . . -0.8% 0.9% -0.8% 0.2% 0.4% 0.4% -0.4% -0.0% 2.0% 0.2%
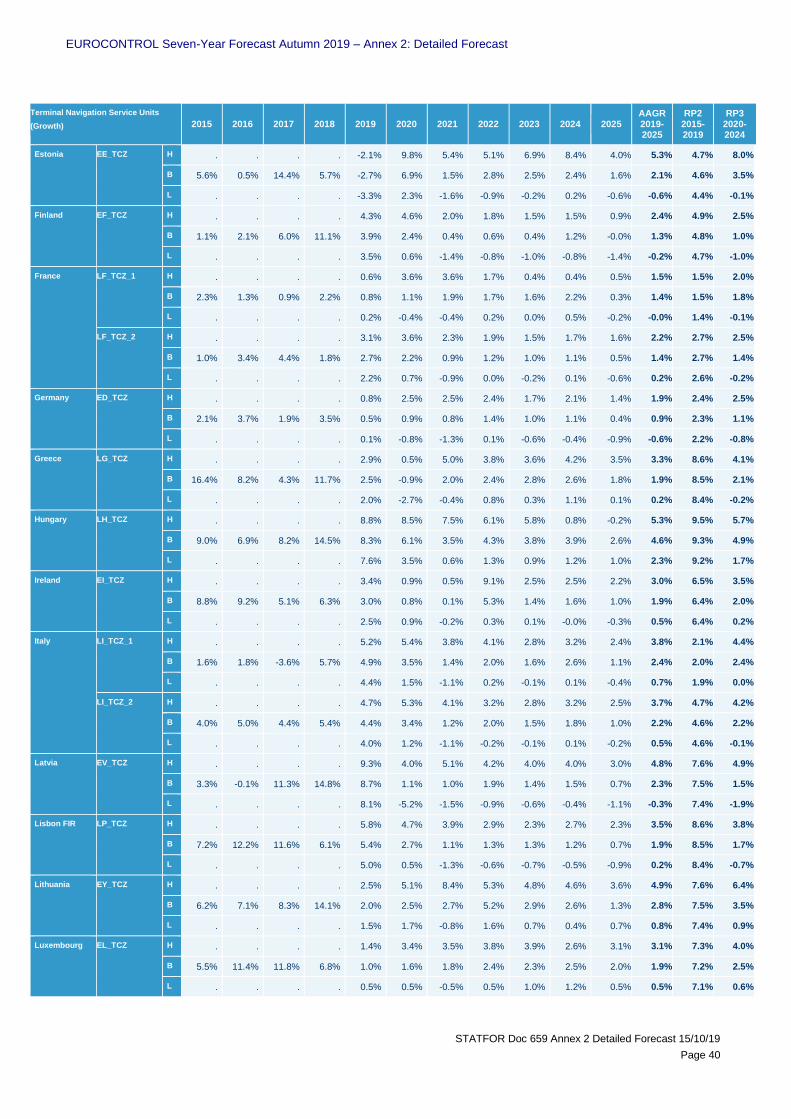
EUROCONTROL Seven-Year Forecast Autumn 2019 – Annex 2: Detailed Forecast
STATFOR Doc 659 Annex 2 Detailed Forecast 15/10/19
Page 40
Terminal Navigation Service Units
(Growth) 2015 2016 2017 2018 2019 2020 2021 2022 2023 2024 2025 AAGR 2019-2025
RP2 2015-2019
RP3 2020-2024
Estonia EE_TCZ H . . . . -2.1% 9.8% 5.4% 5.1% 6.9% 8.4% 4.0% 5.3% 4.7% 8.0%
B 5.6% 0.5% 14.4% 5.7% -2.7% 6.9% 1.5% 2.8% 2.5% 2.4% 1.6% 2.1% 4.6% 3.5%
L . . . . -3.3% 2.3% -1.6% -0.9% -0.2% 0.2% -0.6% -0.6% 4.4% -0.1%
Finland EF_TCZ H . . . . 4.3% 4.6% 2.0% 1.8% 1.5% 1.5% 0.9% 2.4% 4.9% 2.5%
B 1.1% 2.1% 6.0% 11.1% 3.9% 2.4% 0.4% 0.6% 0.4% 1.2% -0.0% 1.3% 4.8% 1.0%
L . . . . 3.5% 0.6% -1.4% -0.8% -1.0% -0.8% -1.4% -0.2% 4.7% -1.0%
France LF_TCZ_1 H . . . . 0.6% 3.6% 3.6% 1.7% 0.4% 0.4% 0.5% 1.5% 1.5% 2.0%
B 2.3% 1.3% 0.9% 2.2% 0.8% 1.1% 1.9% 1.7% 1.6% 2.2% 0.3% 1.4% 1.5% 1.8%
L . . . . 0.2% -0.4% -0.4% 0.2% 0.0% 0.5% -0.2% -0.0% 1.4% -0.1%
LF_TCZ_2 H . . . . 3.1% 3.6% 2.3% 1.9% 1.5% 1.7% 1.6% 2.2% 2.7% 2.5%
B 1.0% 3.4% 4.4% 1.8% 2.7% 2.2% 0.9% 1.2% 1.0% 1.1% 0.5% 1.4% 2.7% 1.4%
L . . . . 2.2% 0.7% -0.9% 0.0% -0.2% 0.1% -0.6% 0.2% 2.6% -0.2%
Germany ED_TCZ H . . . . 0.8% 2.5% 2.5% 2.4% 1.7% 2.1% 1.4% 1.9% 2.4% 2.5%
B 2.1% 3.7% 1.9% 3.5% 0.5% 0.9% 0.8% 1.4% 1.0% 1.1% 0.4% 0.9% 2.3% 1.1%
L . . . . 0.1% -0.8% -1.3% 0.1% -0.6% -0.4% -0.9% -0.6% 2.2% -0.8%
Greece LG_TCZ H . . . . 2.9% 0.5% 5.0% 3.8% 3.6% 4.2% 3.5% 3.3% 8.6% 4.1%
B 16.4% 8.2% 4.3% 11.7% 2.5% -0.9% 2.0% 2.4% 2.8% 2.6% 1.8% 1.9% 8.5% 2.1%
L . . . . 2.0% -2.7% -0.4% 0.8% 0.3% 1.1% 0.1% 0.2% 8.4% -0.2%
Hungary LH_TCZ H . . . . 8.8% 8.5% 7.5% 6.1% 5.8% 0.8% -0.2% 5.3% 9.5% 5.7%
B 9.0% 6.9% 8.2% 14.5% 8.3% 6.1% 3.5% 4.3% 3.8% 3.9% 2.6% 4.6% 9.3% 4.9%
L . . . . 7.6% 3.5% 0.6% 1.3% 0.9% 1.2% 1.0% 2.3% 9.2% 1.7%
Ireland EI_TCZ H . . . . 3.4% 0.9% 0.5% 9.1% 2.5% 2.5% 2.2% 3.0% 6.5% 3.5%
B 8.8% 9.2% 5.1% 6.3% 3.0% 0.8% 0.1% 5.3% 1.4% 1.6% 1.0% 1.9% 6.4% 2.0%
L . . . . 2.5% 0.9% -0.2% 0.3% 0.1% -0.0% -0.3% 0.5% 6.4% 0.2%
Italy LI_TCZ_1 H . . . . 5.2% 5.4% 3.8% 4.1% 2.8% 3.2% 2.4% 3.8% 2.1% 4.4%
B 1.6% 1.8% -3.6% 5.7% 4.9% 3.5% 1.4% 2.0% 1.6% 2.6% 1.1% 2.4% 2.0% 2.4%
L . . . . 4.4% 1.5% -1.1% 0.2% -0.1% 0.1% -0.4% 0.7% 1.9% 0.0%
LI_TCZ_2 H . . . . 4.7% 5.3% 4.1% 3.2% 2.8% 3.2% 2.5% 3.7% 4.7% 4.2%
B 4.0% 5.0% 4.4% 5.4% 4.4% 3.4% 1.2% 2.0% 1.5% 1.8% 1.0% 2.2% 4.6% 2.2%
L . . . . 4.0% 1.2% -1.1% -0.2% -0.1% 0.1% -0.2% 0.5% 4.6% -0.1%
Latvia EV_TCZ H . . . . 9.3% 4.0% 5.1% 4.2% 4.0% 4.0% 3.0% 4.8% 7.6% 4.9%
B 3.3% -0.1% 11.3% 14.8% 8.7% 1.1% 1.0% 1.9% 1.4% 1.5% 0.7% 2.3% 7.5% 1.5%
L . . . . 8.1% -5.2% -1.5% -0.9% -0.6% -0.4% -1.1% -0.3% 7.4% -1.9%
Lisbon FIR LP_TCZ H . . . . 5.8% 4.7% 3.9% 2.9% 2.3% 2.7% 2.3% 3.5% 8.6% 3.8%
B 7.2% 12.2% 11.6% 6.1% 5.4% 2.7% 1.1% 1.3% 1.3% 1.2% 0.7% 1.9% 8.5% 1.7%
L . . . . 5.0% 0.5% -1.3% -0.6% -0.7% -0.5% -0.9% 0.2% 8.4% -0.7%
Lithuania EY_TCZ H . . . . 2.5% 5.1% 8.4% 5.3% 4.8% 4.6% 3.6% 4.9% 7.6% 6.4%
B 6.2% 7.1% 8.3% 14.1% 2.0% 2.5% 2.7% 5.2% 2.9% 2.6% 1.3% 2.8% 7.5% 3.5%
L . . . . 1.5% 1.7% -0.8% 1.6% 0.7% 0.4% 0.7% 0.8% 7.4% 0.9%
Luxembourg EL_TCZ H . . . . 1.4% 3.4% 3.5% 3.8% 3.9% 2.6% 3.1% 3.1% 7.3% 4.0%
B 5.5% 11.4% 11.8% 6.8% 1.0% 1.6% 1.8% 2.4% 2.3% 2.5% 2.0% 1.9% 7.2% 2.5%
L . . . . 0.5% 0.5% -0.5% 0.5% 1.0% 1.2% 0.5% 0.5% 7.1% 0.6%

EUROCONTROL Seven-Year Forecast Autumn 2019 – Annex 2: Detailed Forecast
STATFOR Doc 659 Annex 2 Detailed Forecast 15/10/19
Page 41
Terminal Navigation Service Units
(Growth) 2015 2016 2017 2018 2019 2020 2021 2022 2023 2024 2025 AAGR 2019-2025
RP2 2015-2019
RP3 2020-2024
Malta LM_TCZ H . . . . 4.1% 6.7% 6.5% 5.6% 5.2% 4.9% 4.5% 5.3% 8.8% 6.7%
B 6.1% 6.1% 15.8% 12.5% 3.6% 4.5% 3.4% 3.7% 3.2% 3.9% 2.3% 3.5% 8.7% 4.2%
L . . . . 3.0% 1.9% 1.1% 1.2% 0.6% 1.2% 0.6% 1.3% 8.6% 1.3%
Netherlands EH_TCZ H . . . . -1.3% 3.3% 1.8% 0.3% 0.3% 0.3% 4.4% 1.3% 2.7% 2.1%
B 3.5% 5.7% 4.1% 1.7% -1.6% 1.7% 1.2% 1.5% 0.7% 0.2% 2.5% 0.9% 2.6% 1.6%
L . . . . -1.9% -0.0% -0.8% -0.1% -0.1% 0.1% -0.8% -0.5% 2.6% -0.4%
Norway EN_TCZ H . . . . 1.8% 3.0% 2.5% 1.7% 1.9% 1.1% 0.3% 1.8% 0.7% 2.1%
B -2.5% 0.1% 1.7% 2.6% 1.5% 1.9% 0.8% 1.1% 0.9% 1.1% 3.3% 1.5% 0.7% 1.8%
L . . . . 1.2% 0.6% -0.7% -0.2% -0.3% 2.6% -1.0% 0.3% 0.6% 0.2%
Poland EP_TCZ_EPWA H . . . . 5.4% 6.7% 4.7% 1.4% 1.6% 0.1% 0.5% 2.9% 9.4% 3.0%
B 2.6% 11.3% 15.2% 13.2% 5.0% 4.8% 2.5% 2.4% 2.3% 1.6% 0.4% 2.7% 9.3% 2.8%
L . . . . 4.6% 2.5% 0.7% 0.2% 0.6% 1.0% -0.0% 1.4% 9.3% 1.0%
EP_TCZ_OTHR H . . . . 2.8% 5.5% 4.1% 3.9% 3.1% 3.5% 2.7% 3.6% 9.0% 4.6%
B 10.2% 7.8% 9.2% 15.4% 2.5% 4.1% 2.4% 2.5% 2.5% 2.1% 1.6% 2.5% 8.9% 3.1%
L . . . . 2.2% 2.5% 0.4% 1.3% 0.7% 1.3% 0.6% 1.3% 8.9% 1.4%
Romania LR_TCZ H . . . . 0.8% 6.3% 6.7% 4.4% 5.0% 3.7% 3.3% 4.3% 7.7% 5.9%
B 8.6% 12.9% 9.5% 6.9% 0.4% 4.3% 2.8% 4.5% 2.7% 3.6% 1.5% 2.8% 7.6% 3.9%
L . . . . -0.0% 0.3% 0.3% 1.1% 0.9% 0.0% -0.1% 0.3% 7.5% 0.5%
Slovakia LZ_TCZ H . . . . 0.4% 6.5% 9.2% 6.0% 4.9% 5.9% 6.4% 5.6% 8.6% 7.8%
B 12.9% 9.6% 8.5% 12.0% -0.2% 4.0% 6.2% 4.5% 4.0% 3.9% 2.8% 3.6% 8.4% 5.1%
L . . . . -0.7% 2.1% 0.9% 2.1% 4.0% 3.0% 1.8% 1.9% 8.3% 2.8%
Slovenia LJ_TCZ H . . . . -7.3% 4.5% 10.8% 5.2% 5.2% 4.5% 3.4% 3.6% 3.1% 6.7%
B 8.0% -3.3% 12.4% 7.0% -8.9% 1.0% 13.0% 3.4% 2.8% 4.1% 2.6% 2.4% 2.7% 5.3%
L . . . . -9.3% -0.7% 8.3% 1.6% 1.4% 1.6% 1.6% 0.5% 2.6% 2.7%
Spain LE_TCZ H . . . . 15.1% 4.5% 4.5% 4.0% 3.2% 3.2% 3.0% 5.3% 7.8% 4.5%
B 4.5% 8.9% 5.4% 5.6% 14.7% 2.6% 2.4% 2.5% 2.0% 1.8% 1.3% 3.8% 7.8% 2.5%
L . . . . 14.3% 0.7% 0.1% 0.5% 0.5% 0.5% -0.3% 2.2% 7.7% 0.4%
Sweden ES_TCZ_A H . . . . -4.7% 1.5% 3.1% 2.8% 2.7% 1.2% 0.6% 1.0% 6.4% 2.4%
B 1.1% 4.9% 34.1% 0.7% -4.9% 0.2% 1.1% 1.6% 1.2% 1.5% 0.9% 0.2% 6.4% 1.3%
L . . . . -5.3% -1.6% -0.9% -0.0% -0.1% 0.0% -0.8% -1.3% 6.3% -0.7%
Switzerland LS_TCZ H . . . . 0.7% 4.2% 2.2% 2.4% 2.0% 2.7% 2.0% 2.3% 2.3% 3.1%
B 1.7% 4.9% 1.4% 2.5% 0.4% 2.8% 1.2% 1.6% 1.1% 1.8% 0.8% 1.4% 2.2% 1.9%
L . . . . 0.0% 1.2% -0.4% 0.5% 0.1% 0.8% -0.3% 0.3% 2.1% 0.4%
UK EG_TCZ_B H . . . . 1.1% 1.9% 2.0% 2.8% 1.6% 1.6% 0.9% 1.7% 2.9% 2.1%
B 3.9% 5.8% 2.9% 0.9% 0.9% 1.2% 0.8% 1.9% 1.3% 1.2% 0.4% 1.1% 2.9% 1.4%
L . . . . 0.4% -0.8% 0.1% 0.3% 0.1% 0.3% -0.4% -0.0% 2.8% -0.1%
EG_TCZ_C H . . . . 1.1% 1.6% 1.9% 3.1% 1.5% 1.6% 0.8% 1.6% 2.5% 2.1%
B 3.5% 4.3% 1.9% 1.8% 0.8% 1.1% 0.9% 2.1% 1.3% 1.3% 0.5% 1.2% 2.5% 1.5%
L . . . . 0.3% -0.8% 0.3% 0.5% 0.4% 0.5% -0.2% 0.1% 2.4% 0.1%

EUROCONTROL Seven-Year Forecast Autumn 2019 – Annex 2: Detailed Forecast
STATFOR Doc 659 Annex 2 Detailed Forecast 15/10/19
Page 42
10. ECAC FORECAST SUMMARY
Figure 11. Growth in Europe (ECAC).
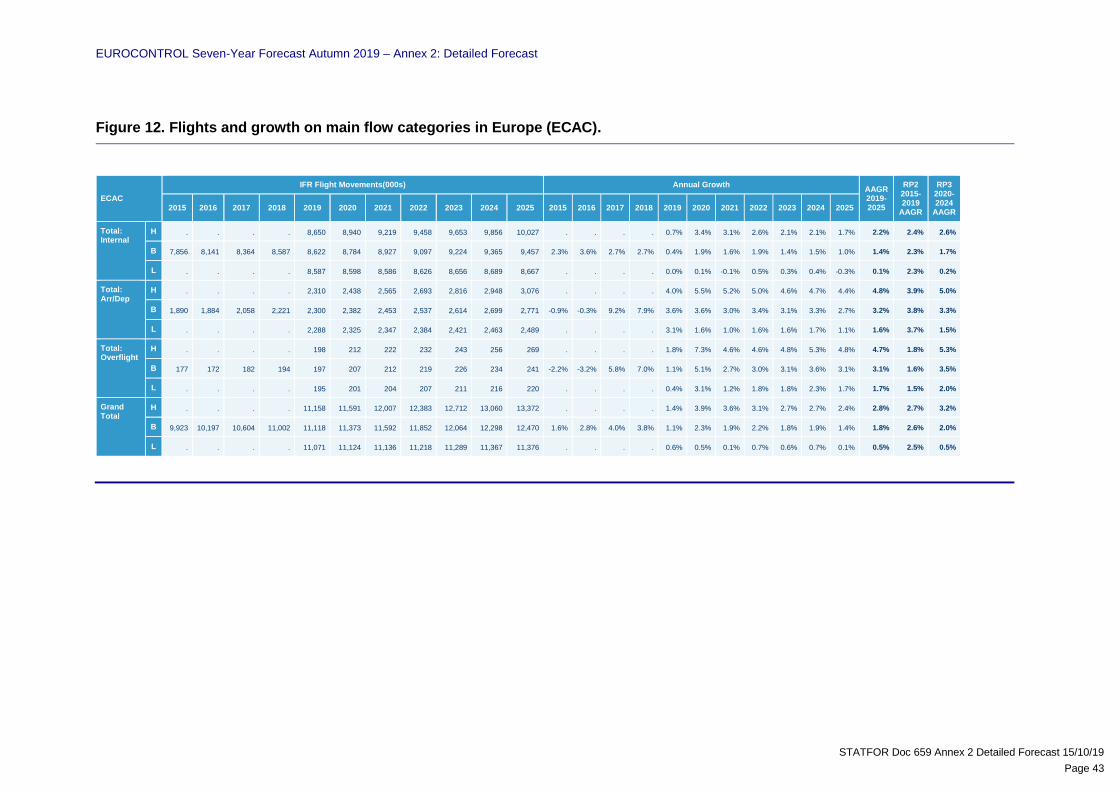
EUROCONTROL Seven-Year Forecast Autumn 2019 – Annex 2: Detailed Forecast
STATFOR Doc 659 Annex 2 Detailed Forecast 15/10/19
Page 43
Figure 12. Flights and growth on main flow categories in Europe (ECAC).
ECAC
IFR Flight Movements(000s) Annual Growth AAGR 2019-2025
RP2 2015-2019
AAGR
RP3 2020-2024
AAGR 2015 2016 2017 2018 2019 2020 2021 2022 2023 2024 2025 2015 2016 2017 2018 2019 2020 2021 2022 2023 2024 2025
Total: Internal
H . . . . 8,650 8,940 9,219 9,458 9,653 9,856 10,027 . . . . 0.7% 3.4% 3.1% 2.6% 2.1% 2.1% 1.7% 2.2% 2.4% 2.6%
B 7,856 8,141 8,364 8,587 8,622 8,784 8,927 9,097 9,224 9,365 9,457 2.3% 3.6% 2.7% 2.7% 0.4% 1.9% 1.6% 1.9% 1.4% 1.5% 1.0% 1.4% 2.3% 1.7%
L . . . . 8,587 8,598 8,586 8,626 8,656 8,689 8,667 . . . . 0.0% 0.1% -0.1% 0.5% 0.3% 0.4% -0.3% 0.1% 2.3% 0.2%
Total: Arr/Dep
H . . . . 2,310 2,438 2,565 2,693 2,816 2,948 3,076 . . . . 4.0% 5.5% 5.2% 5.0% 4.6% 4.7% 4.4% 4.8% 3.9% 5.0%
B 1,890 1,884 2,058 2,221 2,300 2,382 2,453 2,537 2,614 2,699 2,771 -0.9% -0.3% 9.2% 7.9% 3.6% 3.6% 3.0% 3.4% 3.1% 3.3% 2.7% 3.2% 3.8% 3.3%
L . . . . 2,288 2,325 2,347 2,384 2,421 2,463 2,489 . . . . 3.1% 1.6% 1.0% 1.6% 1.6% 1.7% 1.1% 1.6% 3.7% 1.5%
Total: Overflight
H . . . . 198 212 222 232 243 256 269 . . . . 1.8% 7.3% 4.6% 4.6% 4.8% 5.3% 4.8% 4.7% 1.8% 5.3%
B 177 172 182 194 197 207 212 219 226 234 241 -2.2% -3.2% 5.8% 7.0% 1.1% 5.1% 2.7% 3.0% 3.1% 3.6% 3.1% 3.1% 1.6% 3.5%
L . . . . 195 201 204 207 211 216 220 . . . . 0.4% 3.1% 1.2% 1.8% 1.8% 2.3% 1.7% 1.7% 1.5% 2.0%
Grand Total
H . . . . 11,158 11,591 12,007 12,383 12,712 13,060 13,372 . . . . 1.4% 3.9% 3.6% 3.1% 2.7% 2.7% 2.4% 2.8% 2.7% 3.2%
B 9,923 10,197 10,604 11,002 11,118 11,373 11,592 11,852 12,064 12,298 12,470 1.6% 2.8% 4.0% 3.8% 1.1% 2.3% 1.9% 2.2% 1.8% 1.9% 1.4% 1.8% 2.6% 2.0%
L . . . . 11,071 11,124 11,136 11,218 11,289 11,367 11,376 . . . . 0.6% 0.5% 0.1% 0.7% 0.6% 0.7% 0.1% 0.5% 2.5% 0.5%

EUROCONTROL Seven-Year Forecast Autumn 2019 – Annex 2: Detailed Forecast
STATFOR Doc 659 Annex 2 Detailed Forecast 15/10/19
Page 44
Figure 13. Flights and growth on main flow categories in Europe (ECAC).
IFR Movements (000s) Annual Growth AAGR
2019- 2025 2015 2016 2017 2018 2019 2020 2021 2022 2023 2024 2025 2015 2016 2017 2018 2019 2020 2021 2022 2023 2024 2025
1 ESRA North-W
ESRA North-W
H . . . . 3,441 3,504 3,538 3,575 3,592 3,609 3,619 . . . . -0.9% 1.8% 1.0% 1.0% 0.5% 0.5% 0.3% 0.6%
B 3,463 3,494 3,487 3,470 3,432 3,460 3,467 3,493 3,505 3,520 3,519 -0.1% 0.9% -0.2% -0.5% -1.1% 0.8% 0.2% 0.7% 0.3% 0.4% 0.0% 0.2%
L . . . . 3,421 3,402 3,369 3,355 3,337 3,326 3,293 . . . . -1.4% -0.6% -0.9% -0.4% -0.5% -0.3% -1.0% -0.7%
2 ESRA Mediter
ESRA North-W
H . . . . 2,136 2,224 2,304 2,370 2,425 2,482 2,530 . . . . 2.7% 4.1% 3.6% 2.9% 2.3% 2.4% 1.9% 2.8%
B 1,829 1,930 2,005 2,080 2,129 2,181 2,221 2,267 2,303 2,341 2,365 3.6% 5.5% 3.9% 3.8% 2.3% 2.5% 1.8% 2.1% 1.6% 1.7% 1.0% 1.8%
L . . . . 2,119 2,127 2,124 2,135 2,142 2,150 2,143 . . . . 1.8% 0.4% -0.1% 0.5% 0.3% 0.4% -0.3% 0.4%
3 ESRA Mediter
ESRA Mediter
H . . . . 1,514 1,557 1,630 1,690 1,742 1,803 1,857 . . . . -1.0% 2.8% 4.7% 3.7% 3.1% 3.5% 3.0% 2.8%
B 1,373 1,428 1,465 1,529 1,509 1,529 1,572 1,618 1,651 1,691 1,724 4.5% 4.0% 2.6% 4.4% -1.3% 1.3% 2.8% 2.9% 2.0% 2.4% 2.0% 1.7%
L . . . . 1,504 1,499 1,511 1,535 1,558 1,575 1,584 . . . . -1.7% -0.3% 0.8% 1.6% 1.6% 1.1% 0.6% 0.5%
4 ESRA East
ESRA North-W
H . . . . 705 746 781 809 834 857 876 . . . . 5.1% 5.9% 4.7% 3.6% 3.1% 2.7% 2.2% 3.9%
B 547 592 634 671 702 730 750 770 788 805 818 6.0% 8.3% 7.1% 5.8% 4.7% 3.9% 2.8% 2.7% 2.3% 2.2% 1.6% 2.9%
L . . . . 699 711 715 721 727 733 734 . . . . 4.3% 1.6% 0.5% 0.9% 0.7% 0.9% 0.2% 1.3%
5 ESRA North-W
North Atlantic
H . . . . 350 360 369 381 389 397 405 . . . . 1.7% 3.1% 2.3% 3.3% 2.1% 2.0% 2.1% 2.4%
B 311 325 335 344 349 357 361 370 376 382 387 3.9% 4.4% 3.0% 2.6% 1.5% 2.2% 1.3% 2.3% 1.6% 1.7% 1.3% 1.7%
L . . . . 348 350 351 352 353 355 355 . . . . 1.2% 0.8% 0.1% 0.4% 0.3% 0.6% -0.1% 0.5%

EUROCONTROL Seven-Year Forecast Autumn 2019 – Annex 2: Detailed Forecast
STATFOR Doc 659 Annex 2 Detailed Forecast 15/10/19
Page 45
© EUROCONTROL 2019 This document is published by EUROCONTROL for information purposes. It may be copied in whole or in part, provided that EUROCONTROL is mentioned as the source and it is not used for commercial purposes (i.e. for financial gain). The information in this document may not be modified without prior written permission from EUROCONTROL. For further information please contact STATFOR, the EUROCONTROL Statistics and Forecast Service. [email protected] https://www.eurocontrol.int/forecasting