
EUROCONTROL EXPERIMENTAL CENTRE EXPERIMENTAL CENTRE CDM LANDSIDE M ... The information contained in...
86
EUROPEAN ORGANISATION FOR THE SAFETY OF AIR NAVIGATION EUROCONTROL EUROCONTROL EXPERIMENTAL CENTRE CDM LANDSIDE MODELLING PROJECT PHASE I: INITIAL SCENARIOS EEC Note No. 12/06 Project APT-ACP Issued: September 2006 The information contained in this document is the property of the EUROCONTROL Agency and no part should be reproduced in any form without the Agency’s permission. The views expressed herein do not necessarily reflect the official views or policy of the Agency.
Transcript of EUROCONTROL EXPERIMENTAL CENTRE EXPERIMENTAL CENTRE CDM LANDSIDE M ... The information contained in...

EUROPEAN ORGANISATION FOR THE SAFETY OF AIR NAVIGATION
EUROCONTROL
EUROCONTROL EXPERIMENTAL CENTRE
CDM LANDSIDE MODELLING PROJECT PHASE I: INITIAL SCENARIOS
EEC Note No. 12/06
Project APT-ACP
Issued: September 2006
The information contained in this document is the property of the EUROCONTROL Agency and no part should be reproduced in any form without the Agency’s permission.
The views expressed herein do not necessarily reflect the official views or policy of the Agency.


REPORT DOCUMENTATION PAGE
Reference: EEC Note No. 12/06
Security Classification: Unclassified
Originator: EEC - APT (Airport)
Originator (Corporate Author) Name/Location: EUROCONTROL Experimental Centre Centre de Bois des Bordes B.P.15 F - 91222 Brétigny-sur-Orge Cedex FRANCE Telephone : +33 (0)1 69 88 75 00Internet : www.eurocontrol.int
Sponsor: EEC – APT (Airport)
Sponsor (Contract Authority) Name/Location: EUROCONTROL Experimental Centre Centre de Bois des Bordes B.P.15 F - 91222 Brétigny-sur-Orge Cedex FRANCE Telephone: +32 2 729 90 11 WEB Site: www.eurocontrol.int
TITLE: CDM LANDSIDE MODELLING - PROJECT PHASE 1: INITIAL SCENARIOS
Authors Uta KHOSE
(Airport Research Centre GmbH - Germany)
Date 09/2006
Pages x + 76
Figures 53
Tables 19
Annexes -
References -
EEC Contact Louis Sillard
Project APT - ACP
Task No. Sponsor A15PT- 2005
Period 2005/2006
Distribution Statement:
(a) Controlled by: Head of APT (b) Special Limitations: None
Descriptors (keywords):
Abstract:
This technical note identifies the results obtained utilising the CAST Landside simulator on various scenarios involving passenger handling and movement. An important consideration to the project is the consideration of the ACARE vision 2020 and the Second Strategic Research Agenda (SRA-2) launched by ACARE in 2004. This first phase of the project involves the creation of a baseline airport, Frankfurt Terminal 2.


CDM Landside Modelling EUROCONTROL
Project APT-ACP – EEC Note No. 12/06 v
FOREWORD
A study by the Advisory Council for Aeronautical Research in Europe (ACARE) suggests that a three-fold increase of air traffic can be anticipated during the next 30 years. The European aviation industry will face a number of challenges to manage a traffic increase of this magnitude. The airport is an integral part of the air transport system managing a large number of processes. A key process is the management of the flows of passengers through the terminal to achieve optimum performance of the aircraft turn-around within airport operations.
The need for better prediction of the completion of aircraft turn-around has been identified as essential element of improving airport performance and is the subject of a study by the EUROCONTROL Airport Collaborative Decision Making (CDM) project. In this study, the Landside Modelling project incorporates the analysis of airport landside processes, their future evolution and subsequent development within airside CDM applications. This includes (but is not limited to) more accurate prediction of aircraft ready time resulting in improved prediction of take-off time, downstream sector load and arrival time at the destination airport.
Within the context of Airport CDM, the EUROCONTROL Experimental Centre is cooperating with available partners to participate in studying and modelling these airport passenger processes. The aim is to understand the interaction with other airport processes, and more importantly, how, using new technology and redefined processes, they could be better integrated in the overall management of the airport, e.g. reduce process time and increase predictability, thus reducing the negative impact on departure delay.
In the search for study partners, it was clear that such cooperation would require existing research experience in airport operations and the availability of a model already developed and validated so that research activities could start immediately.
The Airport Research Centre (ARC) was selected to conduct the study using the CAST simulation software as an investigation tool. CAST is a 3D multi-agent based simulation tool developed for the simulation of airport landside and airside processes.
FRAPORT (Frankfurt Airport Authority) will ensure the validation of data used and the validation of the elements of the project.
This note contains a description of the baseline simulation model representing the status quo situation of the airport passenger processes. For validation purposes real input data of a reference airport have been used. With this model several simulation runs have been performed to investigate the effects of various modifications that may improve today’s performance and efficiency of the passenger processes in a terminal building.
The next step will expand the Landside Model to become one component of a model of all major airport processes with a view to using such a model, not only for validation of processes, but in the strategic planning process of airports, possibly also supporting the pre-tactical planning process.
The study shall later look into the feasibility of operational use of such models.
Louis SILLARD Project Manager APT

EUROCONTROL CDM Landside Modelling
vi Project APT-ACP - EEC Note No. 12/06
Page intentionally left blank

CDM Landside Modelling EUROCONTROL
Project APT-ACP – EEC Note No. 12/06 vii
TABLE OF CONTENTS
LIST OF FIGURES .......................................................................................................... VIII
LIST OF TABLES.............................................................................................................. IX
1. INTRODUCTION...........................................................................................................1 1.1. BACKGROUND.............................................................................................................. 1 1.2. PROJECT PHASES ....................................................................................................... 2 1.3. DOCUMENT OVERVIEW .............................................................................................. 4
2. METHODOLOGY..........................................................................................................5 2.1. OVERVIEW PROJECT METHODOLOGY..................................................................... 5 2.2. EVALUATION METHOD: MULTI-AGENT SIMULATION SYSTEM CAST .................... 7 2.3. PROCESS OF LANDSIDE SIMULATION...................................................................... 8
2.3.1. Overview............................................................................................................8 2.3.2. Required Input Data ........................................................................................10 2.3.3. Model Set-up ...................................................................................................12 2.3.4. Simulation and Analysis ..................................................................................15
3. BASELINE SIMULATION ...........................................................................................17 3.1.1. Input Data ........................................................................................................17 3.1.2. Simulation Runs ..............................................................................................25 3.1.3. Results.............................................................................................................25 3.1.4. Conclusions .....................................................................................................26
4. SCENARIO SIMULATION ..........................................................................................27 4.1. OVERVIEW .................................................................................................................. 27 4.2. CUSS SCENARIO........................................................................................................ 28
4.2.1. Scenario Description and Objective ................................................................28 4.2.2. Scenario Assumptions.....................................................................................28 4.2.3. Input Data ........................................................................................................29 4.2.4. Simulation Runs ..............................................................................................32 4.2.5. Specification of Key Performance Indicators...................................................33 4.2.6. Results and Interpretation ...............................................................................33
4.3. RETAIL YIELD SCENARIO.......................................................................................... 38 4.3.1. Scenario Description and Objective ................................................................38 4.3.2. Scenario Assumptions.....................................................................................39 4.3.3. Input Data ........................................................................................................40 4.3.4. Simulation Runs ..............................................................................................44 4.3.5. Specification of Key Performance Indicators...................................................44 4.3.6. Results and Interpretation ...............................................................................45 4.3.7. Conclusions .....................................................................................................49
4.4. LATE PASSENGER SCENARIO ................................................................................. 50 4.4.1. Scenario Description and Objective ................................................................50 4.4.2. Scenario Assumptions.....................................................................................51 4.4.3. Input Data ........................................................................................................54 4.4.4. Specification of Key Performance Indicators...................................................58 4.4.5. Simulation Runs ..............................................................................................58 4.4.6. Exercise A - Baseline ......................................................................................59 4.4.7. Exercise B – Late Passengers ........................................................................60 4.4.8. Exercise C – Fast Track ..................................................................................63

EUROCONTROL CDM Landside Modelling
viii Project APT-ACP - EEC Note No. 12/06
4.4.9. Exercise D – Increased Traffic Demand..........................................................66
5. SUMMARY AND CONCLUSIONS..............................................................................70
6. GLOSSARY ................................................................................................................73
LIST OF FIGURES Figure 1: Overview: Intended Phases of the Project CDM Landside Modelling ............................ 2 Figure 2: Overview Project Methodology....................................................................................... 5 Figure 3: Overview Process of Simulation Modelling .................................................................... 9 Figure 4: Setting transaction times for services........................................................................... 12 Figure 5: Setting rules for check-in counter allocation................................................................. 13 Figure 6: Setting passenger properties in PaxGen, Example: Walking Speed............................ 14 Figure 7: Example: PaxGen definition of Reporting Profile for Entry Time.................................. 15 Figure 8: Applied Method for the Validation Process................................................................... 16 Figure 9: Input data: terminal layout CAD plan loaded as ’ground layer’ behind the model ........ 17 Figure 10: Simulation Model Layout of Terminal 2 – Functional Areas (Screenshot).................... 18 Figure 11: Input data: check-in counter allocation for terminal area D and E................................ 20 Figure 12: Flight Schedule 27.08.2004 –Aircraft Movements (Gliding Hour) ................................ 23 Figure 13: Baseline: Passenger Process Definition....................................................................... 24 Figure 14: Variants for Transfer-Passengers, Example of a passenger flow (Case 4).................. 25 Figure 15: CUSS Scenario: Check-In Area Baseline (for comparison) ......................................... 30 Figure 16: CUSS Scenario: Adapted Layout of Check-In Area according to the CUSS Scenario 30 Figure 17: CUSS Scenario – Check-In Process Diagram ............................................................. 32 Figure 18: CUSS Scenario – Possible Re-organisation of Check-In Area (Isometric view) .......... 34 Figure 19: CUSS Scenario: Utilisation of Check-In hall compared to baseline ............................. 35 Figure 20: CUSS Scenario: Reduced staff demand (1)................................................................. 35 Figure 21: CUSS Scenario: Smoothening of peaks and reduced staff demand (1) ...................... 36 Figure 22: CUSS Scenario: Smoothening of peaks and reduced staff demand (2) ...................... 36 Figure 23: CUSS Scenario: Traffic Increase and development of queues .................................... 37 Figure 24: Baseline & Retail Yield Scenario - Definition of Retail Behaviour ................................ 40 Figure 25: Retail Yield Scenario – Gate Reporting Profile for Retail Yield Baseline ..................... 41 Figure 26: Retail Yield Scenario – Gate Reporting Profiles for Retail Yield Scenarios ................. 41 Figure 27: Retail Yield Baseline: Passenger Process Diagram..................................................... 43 Figure 28: Retail Yield Scenario RY_40min_40% Passenger Process Diagram .......................... 43 Figure 29: Retail Yield Scenario: Increase of Potential Retail Time .............................................. 45 Figure 30: Retail Yield Scenario: Accumulated Retail Time per scenario variation....................... 46 Figure 31: Retail Yield Scenario: Comparison Pax Time in % Spent in Different Terminal Areas 46 Figure 32: Retail Yield Scenario: Comparison Pax Hours in % Spent in Different Terminal Areas47 Figure 33: Retail Yield Scenario: Potential for Improved Gate Lounge Use.................................. 47 Figure 34: Retail Yield with CUSS Scenario: Passenger Process time in different terminal areas 48 Figure 35: Walking times from check-in to gate lounge................................................................. 52 Figure 36: Walking times from Check-in to Gate ........................................................................... 53 Figure 37: Interrelation of number of delayed passengers in combination with airline tolerance .. 54 Figure 38: Late Pax Scenario: Shift in reporting Profile by 15 min ................................................ 55 Figure 39: Late Pax Scenario: Passenger Process Definition Exercise A and B (and D) ............. 57 Figure 40: Late Pax Scenario: Passenger Process Definition Exercise C (and D)........................ 57 Figure 41: Late Pax Scenario: Delayed Flights in the Baseline Scenario...................................... 59 Figure 42: Late Pax Scenario: Exercise B – av. Number of late passengers in Pax List .............. 61 Figure 43: Late Pax Scenario: Exercise B – Check-in Hall Utilisation ........................................... 61 Figure 44: Late Pax Scenario: Exercise B – Passenger Throughput Times.................................. 62 Figure 45: Late Pax Scenario: Exercise B – Effects of Shifted Entry Times.................................. 63 Figure 46: Benefit of Fast Track only visible without check-in restriction policy ............................ 64

CDM Landside Modelling EUROCONTROL
Project APT-ACP – EEC Note No. 12/06 ix
Figure 47: Late Pax Scenario Exercise C: Passenger throughput times (only Fast Track)........... 64 Figure 48: Late Pax Scenario Exercise C: Passenger throughput times (Fast Track and CUSS) 65 Figure 49: Late Pax Scenario Exercise C: Check-In Hall (compare CUSS and Baseline) ............ 65 Figure 50: Exercise D: Check-in hall utilisation with increased traffic loads .................................. 66 Figure 51: Traffic Increase 70%: Security Control Non-Schengen................................................ 67 Figure 52: Passenger throughput times for scenarios with traffic increase ................................... 68 Figure 53: Flight delays of scenarios with increased traffic ........................................................... 69
LIST OF TABLES
Table 1: IATA - Level of Service Maximum Waiting Time Guidelines ........................................ 10 Table 2: Input data: transaction times for services ..................................................................... 19 Table 3: Level of Service Criteria for Security, Passport and Immigration Control..................... 19 Table 4: Input data: extract from the check-in counter allocation schedule................................ 21 Table 5: Passenger Properties (Extract) .................................................................................... 21 Table 6: Traffic structure ............................................................................................................ 23 Table 7: Share of passengers using the different Check-In Types............................................. 29 Table 8: Degree of automation................................................................................................... 29 Table 9: Share of Check-In types............................................................................................... 29 Table 10: CUSS Scenario: Max Queue Length............................................................................ 31 Table 11: Overview CUSS Simulation Scenarios......................................................................... 32 Table 12: CUSS Scenario: Required Check-In Facilities ............................................................. 33 Table 13: Gate Reporting Profile Retail Yield Baseline (GRT_90min) ......................................... 41 Table 14: Gate Reporting Profile Retail Yield 40min (GRT_40min) and 30min (GRT_30min).. 42 Table 15: Overview Retail Yield Simulation Scenarios................................................................. 44 Table 16: Late Pax Scenario: Exercise C: Variations of check-in types for CUSS and Internet
Check-in ....................................................................................................................... 55 Table 17: Late Pax Scenario: Exercise C: Transaction Times for different Check-In Types........ 55 Table 18: Level of Service Criteria for Security, Passport and Immigration Control..................... 56 Table 19: Late Pax Scenario: Overview of Scenario Names for Simulation Runs ....................... 58

EUROCONTROL CDM Landside Modelling
x Project APT-ACP - EEC Note No. 12/06
Page intentionally left blank

CDM Landside Modelling EUROCONTROL
Project APT-ACP - EEC Note No. 12/06 1
1. INTRODUCTION
1.1. BACKGROUND
Following a study of the Advisory Council for Aeronautical Research in Europe (ACARE), that imagines a three-fold increase of air traffic in the future, the European aviation industry will face a lot of challenges how to manage and operate the air transport system in future. The ACARE formulated in this context a paper of the “Vision 2020”.
Summarised for the operational point focusing on system efficiency and performance the view of the vision 2020 is quantified by the following thesis:
Considering a 3 times higher volume of passengers 99% of all flights are arriving and departing within 15 minutes of the published time-table and the time spent in airports is not more than 15 minutes in the airport before departure and after arrival for short-haul flights and 30 minutes for long-haul flights.1
In particular at large airports, this very ambitious goal will require several changes, adaptation and innovations in respect to the airport processes and airport infrastructure.
Generally focusing on air traffic management and airport airside issues, EUROCONTROL has recognized the need to take a holistic view on the air transport system, when investigating solutions for improvement.
Also considering the ACARE vision, the Airport CDM project has identified the need for better predicting the completion of aircraft turn-around as a key element of improved airport operations. It is assumed that aircraft turn-around and airport passenger processes can be managed in a way that will allow for a more accurate prediction of aircraft ready time, and therefore improve prediction of take-off time, downstream sector load and arrival time at the destination airport.
The Second ACARE Strategic Research Agenda (SRA-2)2 has identified a number of scenarios where the airport landside processes play an important role for the development of the future air transport system. The CDM project is concerned with the testing and validation of the above concepts. With the objective to reach the implementation stage, a need for development of airport landside models has been identified.
Therefore, the EUROCONTROL Experimental Centre (EEC) issued this research project dealing with an analysis of landside processes, their future evolvement and their interrelation to the airside CDM applications. The project is part of a long-term research initiative called Airport CDM (Collaborative Decision Making) also taking into consideration the airport landside processes.
The objective of the study is to develop a model of the airport landside that can be used to analyse the impact on airside operations, but also to analyse the impact on the landside resulting from new requirements or the introduction of new technology, which will have an impact on the air transport system as a whole.
1 ACARE: European Commission / Group of personalities:European aeronautics: A Vision for 2020 [2004] 2 ACARE SRA-2 - The Second Strategic Research Agenda [2004]

EUROCONTROL CDM Landside Modelling
2 Project APT-ACP - EEC Note No. 12/06
The method for evaluation is based on a sophisticated landside simulation system. The Airport Research Center (ARC) has developed the landside multi-agent-simulation system CAST (Comprehensive Airport Simulation Technology). Based on CAST a baseline simulation model representing the status quo situation of the passenger processes taking place at an airport is generated. For validation purposes real input data of a reference airport are used. With this model several simulation runs are performed to investigate the effects of changes on the performance and efficiency of a terminal building.
As a reference airport Frankfurt Airport has been involved in the project. With Fraport’s expertise and input, a baseline simulation model is created and validated. Based on the baseline model potential future changes to traffic, layout and operational concepts are tested concerning their effects on performance and efficiency of passenger handling processes.
1.2. PROJECT PHASES
The project CDM Landside Modelling project consists of four project phases.
Baseline AirportCreation &
Validation of a Landside
Simulation Model
Simulation of Scenarios
Second AirportModelling of
second airport and conduct
scenarios(Redo parts of phase 1 and 2 with another
airport terminal)
ACARE ScenarioSimulation of
Baseline Airport according to the ACARE vision
Re-Engineering of airport layout and
processes
Airside-Integration
Integration of Airside into the Landside Model
Phase 1 Phase 2 Phase 3 Phase 4
Planned ProjectsFinished Project
BAA InvolvementFraport
InvolvementBAA and/or Fraport
InvolvementFraport
Terminal 2
Figure 1: Overview: Intended Phases of the Project CDM Landside Modelling
This report deals with the description and evaluation of Phase 1. The following description gives an overview of the initial and the planned project phases.
Phase 1: Initial Scenarios
The main purpose of Phase 1 is to create a baseline simulation model that is verified and validated and that is based on real structural and organisational data of a major European airport. For the baseline model of the project the Terminal 2 of Frankfurt Airport has been selected. The baseline model has been analysed regarding relevant performance indicators such as flow rates, utilisation of facilities, waiting times and queuing length at passenger handling services, or space occupation of functional terminal areas.
In the scope of the scenario modelling (see chapters 4), the baseline model has been adapted and modified according to the scenario specifications. After the scenario evaluations, the comparison of performance indicators of the baseline and of the scenario models has shown the effects of the modifications. From the analysis, conclusions on the added value of the investigated scenarios could be drawn. The consequences of operational and structural measures can be shown in advance – and thus, the efficiency of the measures can be evaluated.
CDM Landside Modelling EUROCONTROL
Project APT-ACP - EEC Note No. 12/06 3
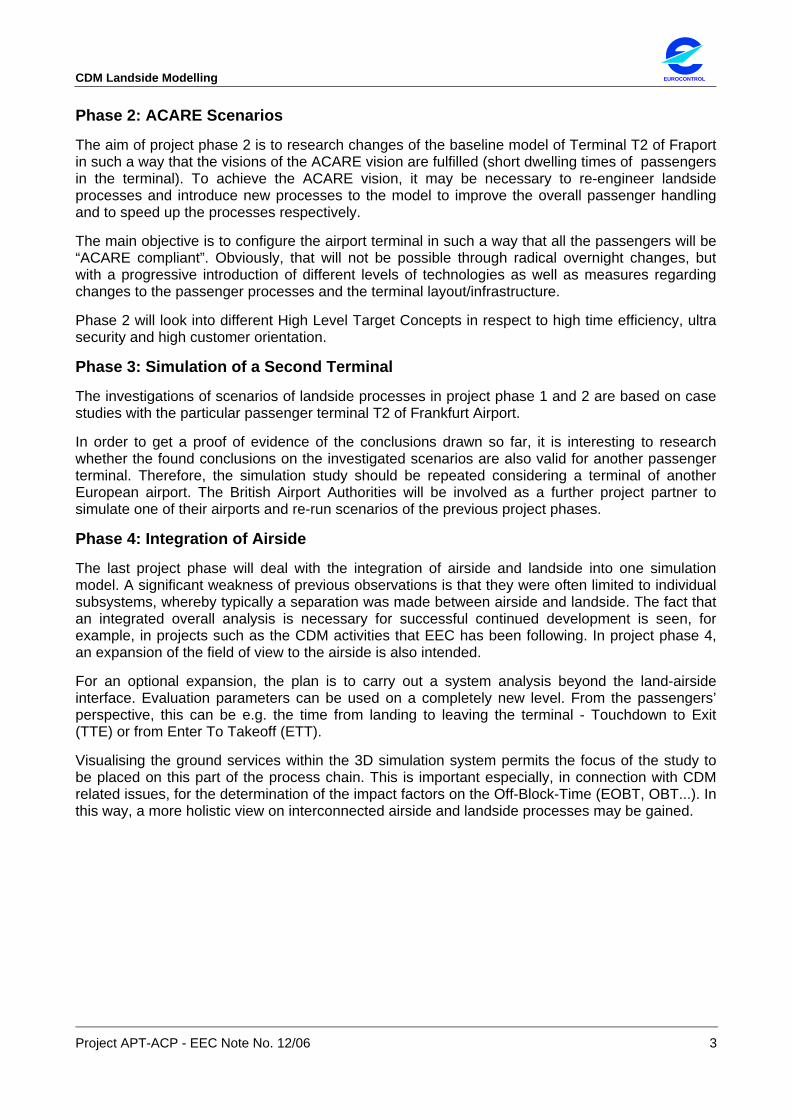
Phase 2: ACARE Scenarios
The aim of project phase 2 is to research changes of the baseline model of Terminal T2 of Fraport in such a way that the visions of the ACARE vision are fulfilled (short dwelling times of passengers in the terminal). To achieve the ACARE vision, it may be necessary to re-engineer landside processes and introduce new processes to the model to improve the overall passenger handling and to speed up the processes respectively.
The main objective is to configure the airport terminal in such a way that all the passengers will be “ACARE compliant”. Obviously, that will not be possible through radical overnight changes, but with a progressive introduction of different levels of technologies as well as measures regarding changes to the passenger processes and the terminal layout/infrastructure.
Phase 2 will look into different High Level Target Concepts in respect to high time efficiency, ultra security and high customer orientation.
Phase 3: Simulation of a Second Terminal
The investigations of scenarios of landside processes in project phase 1 and 2 are based on case studies with the particular passenger terminal T2 of Frankfurt Airport.
In order to get a proof of evidence of the conclusions drawn so far, it is interesting to research whether the found conclusions on the investigated scenarios are also valid for another passenger terminal. Therefore, the simulation study should be repeated considering a terminal of another European airport. The British Airport Authorities will be involved as a further project partner to simulate one of their airports and re-run scenarios of the previous project phases.
Phase 4: Integration of Airside
The last project phase will deal with the integration of airside and landside into one simulation model. A significant weakness of previous observations is that they were often limited to individual subsystems, whereby typically a separation was made between airside and landside. The fact that an integrated overall analysis is necessary for successful continued development is seen, for example, in projects such as the CDM activities that EEC has been following. In project phase 4, an expansion of the field of view to the airside is also intended.
For an optional expansion, the plan is to carry out a system analysis beyond the land-airside interface. Evaluation parameters can be used on a completely new level. From the passengers’ perspective, this can be e.g. the time from landing to leaving the terminal - Touchdown to Exit (TTE) or from Enter To Takeoff (ETT).
Visualising the ground services within the 3D simulation system permits the focus of the study to be placed on this part of the process chain. This is important especially, in connection with CDM related issues, for the determination of the impact factors on the Off-Block-Time (EOBT, OBT...). In this way, a more holistic view on interconnected airside and landside processes may be gained.
EUROCONTROL CDM Landside Modelling
4 Project APT-ACP - EEC Note No. 12/06
1.3. DOCUMENT OVERVIEW
The document at hand presents the results of project phase 1: Initial scenarios. The document has the following structure:
Chapter 2: provides information on the objectives and the methodology applied in the study to fulfil them. The simulation technology that has been used as the main investigation instrument is introduced. The process of creating the baseline simulation as well as the process for the scenario simulations is described. In this context the process for setting up the model is described. In addition, the used validation method is presented that has been concerned with the verification and validation of the baseline model.
Chapter 3: gives a description of the baseline model investigation that has been based on Fraport’s Terminal 2. The input data used for the baseline is presented as well as the validation result data.
Chapter 4: first gives a brief overview of the different scenarios that investigate the effects when introducing new technologies or changes in the operational passenger handling process in order to increase the efficiency of terminal concepts. The sub-chapters 4.1, 4.2 and 4.3 present the investigated scenarios. In each chapter a description on the objective of the scenario is given. The main scenario settings and assumptions are described followed by the specification of the main analysis parameters. The scenario results are compared to the baseline and the main results are interpreted and summarised.
Chapter 5: Summarises the results of the investigations as well as it gives recommendations and an outlook on the following project phase 2: Simulation of ACARE Scenarios.
The Chapter Glossary provides descriptions of frequently used terminology and abbreviations.

CDM Landside Modelling EUROCONTROL
Project APT-ACP - EEC Note No. 12/06 5
2. METHODOLOGY
This chapter describes the methodology that was applied within this study. First the project methodology will be presented explaining the steps followed in the project in chapter 2.1.
Simulation has been the major evaluation method used to fulfil the objectives of the project. Therefore, the airport simulation tool CAST used within this study is briefly introduced in chapter 2.2.
In order to provide insight, how landside processes are modelled with CAST the methodology how to set-up and simulate a passenger terminal is described in chapter 2.3. In this context the required input data, the process of the simulation model set-up, the analysis and validation process as well as the process of scenario modelling and simulation is explained.
2.1. OVERVIEW PROJECT METHODOLOGY
Figure 2 provides an overview of the project methodology and the steps followed in the project.
1. Objective
2. Baseline Model Set-up
4. Validation of Baseline Model
5. Definition of Scenarios
6. Scenario Model Set-up
8. Analysis / Comparison to Baseline
9. Conclusions and recommendations for next project phase
Reference Airport Parameters
Reference Airport
Database
Baseline Model
3. Simulation of Baseline Scenario
7. Simulation of Scenarios Assumptions
Figure 2: Overview Project Methodology
1. Objective: In the first project phase Initial Scenarios, a landside simulation model of a reference airport is created as baseline. Based on the validated landside model, adaptations to certain landside parameters and processes are investigated by means of scenarios. The objective is to gain insight in important system parameters of airport landside processes and to investigate the consequences of changes of landside processes emerging from new requirements, trends and the application of advanced technologies. The analysis is conducted with a simulation model based on real input data of Terminal 2 of Frankfurt airport as reference airport.

EUROCONTROL CDM Landside Modelling
6 Project APT-ACP - EEC Note No. 12/06
2. Baseline Model Set-up: Fraport, the operator of Frankfurt Airport, has provided all kinds of input data required to set-up the landside simulation model of Terminal 2 in the CAST environment. The raw input data is transformed to data that is importable to CAST through the interfaces available. The terminal geometry and all the passenger processes taking place in Terminal 2 are modelled in the CAST environment (please refer to chapter 2.3 for a description of the methodology). Passenger flows are created based on the flight schedule of the 27.08.2004.
3. Validation of Baseline Model: Several tests are performed with the baseline model to verify and validate the model set-up. The analysis of the simulation runs focuses on the investigation of analysis parameters of landside simulation, such as flow rates, waiting times, and queue lengths. Together with the simulation experts of Fraport, the simulation results of the baseline model are evaluated and compared to TOFAS simulation results that are based on the same set of input data. The baseline model set-up is calibrated and adjusted until the model is regarded as valid to be used for scenario experiments.
4. Definition of Scenarios: After validating the baseline simulation model, it is used for the conduction of scenario experiments. Within a brainstorming process involving EEC, Fraport, ARC and terminal experts from other German Airports in the scope of an airport workshop, scenarios are defined that investigate changes of landside parameters to gain experience on the effects on terminal operation. Within the simulation a lot of factors and parameters are investigated. To concentrate on the main aspects of the results, key performance indicators are defined which are used to measure the differences between the baseline and the investigated scenarios and their effects on terminal operation.
5. Scenario Model Set-up: Based on the scenario assumptions, for each scenario the baseline model of Fraport’s terminal 2 is adapted regarding landside parameters such as re-organisation of the passenger process, adapting rules for passenger generation, transaction times, and terminal layout.
6. Simulation of Scenarios: After setting up the scenario models within the simulation environment, several simulation runs are performed to ensure that the model works properly. Due to the complexity of the interrelated processes and the various input parameters first sub model tests are performed before the whole model runs. In this phase the calibration and the check of parameters is done. After getting insight in the effects of the calibrated model, some parameters are varied in order to test the impact on the results and to gain more insight in the behaviour of the passenger processes under changed conditions. Factors and parameters for variation are for instance the increase of traffic loads or the variation of passenger shares with certain scenario characteristics.
7. Scenario Analysis / Comparison to Baseline Model: The simulation results of the scenarios are analysed regarding the specific key performance indicators of the scenarios. By comparing the results with the results of the baseline scenario, conclusions are drawn regarding the effect of changes of landside parameters on terminal operations.
8. Conclusions and recommendations for the next project phase: Based on the insight gained with the scenario investigations, the results are summarised and recommendations are formulated for the following project phases.

CDM Landside Modelling EUROCONTROL
Project APT-ACP - EEC Note No. 12/06 7
2.2. EVALUATION METHOD: MULTI-AGENT SIMULATION SYSTEM CAST
In the course of development of powerful computers, computer modelling and simulation has proven an effective tool for system analysis. Based on a system structure (layout), system charges (traffic / passengers) and control equipment (chains of processes, possible methods, bodies of rules and regulations), flows in a real or planned system are re-enacted. Analysis and evaluations are done based on real time charts, animation and log data post processing.
According to resolution, in fast-time simulations there is a spectre between macroscopic and microscopic approaches. In macroscopic simulations, systems are more intensely abstracted and passengers are for instance calculated as flows. In microscopic systems, more details are illustrated, for example movements of single passengers. Although a passenger may move freely in the plane, in the past the simulation of airport terminals has been based on a simplifying knot-link-network, i.e. passengers were moved in a path-bound way. According to the level of abstraction required, this procedure could not illustrate the use of terminal space in the required accuracy.
Therefore ARC developed the multi-agent simulation system CAST3, where any single object is illustrated according to its real objective and capacities. This means a passenger moves freely through the terminal according to objectives and while doing so will dynamically react to the environment. With this type of simulation, the search of a path through the terminal is illustrated - taking into consideration all obstacles, tips, or restrictions - in the same way as the passengers making way for one another. Because of the possibility to specify the behaviour of any single person, the typical behavioural patterns to be observed in the airport may be simulated. For instance, it is a fact that business passengers move in a more target-oriented and faster way than families, which are focused, to remain together as a group. Also crowd behaviour can be modelled and illustrated in a much more realistic way – people may take alternative routes to avoid being stuck in a crowd.
The essential advantages of this model approach are:
• Passenger processes may be illustrated essentially more closely to reality and may thus provide more exact and valid results than path-based simulation models.
• If anything is modified in the layout of spaces in the passenger terminal, movement paths do not have to be defined anew, as passenger objects may adjust in real time and dynamically to a modified layout. Up to now, this has not been possible in path-based systems.
• Structure and modification of the model are essentially simpler, more transparent and time saving.
• The validity of a model may be understood by users intuitively and close to reality in a real time 3D VR environment.
• Cause and Effect of modified system parameters may be evaluated in real time.
• The model approach permits a highly dynamical and integrated planning and evaluation, different layout alternatives with various charge demands (traffic structures) and modifying important parameters of operation may be modelled rapidly and simply and be analysed concerning their performance and validity.
3 CAST: Comprehensive Airport Simulation Tool, developed by ARC in coop. with BAA (British Airport Authorities)

EUROCONTROL CDM Landside Modelling
8 Project APT-ACP - EEC Note No. 12/06
The described simulation environment of CAST serves within the scope of this project as a base for the model structure. In the individual project phases, different components taken into consideration may be integrated into the model and be simulated in scalable exactness. This means that first of all the terminal is modelled, but at the same time – because of the overall concept of the simulation software – the basis for an extension of the model on the airside is considered (traffic of aircraft, ground handling at the plane, ground handling traffic on the airport, aircraft cabin, baggage handling). In further steps, an overall analysis of interacting airside and landside processes may be done in the same simulation model.
2.3. PROCESS OF LANDSIDE SIMULATION
This chapter describes the methodology of the model set-up and the simulation and analysis process used for the simulation models of this study.
Before setting up a simulation model, the intention of the model has to be specified with respect to the questions to be solved. For instance, the intention of the baseline simulation model is to retrieve a verified and validated landside model that is based on real input data of a reference airport terminal. It is necessary to model the entire passenger handling process of arriving, departing and of passenger transfers taking place in the passenger terminal. With these processes properly modelled it is feasible to analyse the processes regarding the key performance indicators, driving the efficiency of landside processes, such as flow rates, queue length and waiting times at service stations, the overall throughput time of passengers, or the level of service standards of the terminal.
The system boundaries of the model are represented by the physical boundaries of the exemplary evaluation terminal (in this case Frankfurt-Airport’s Terminal 2) including the terminal entries on the landside and the gate exits on the airside.
2.3.1. Overview
Generating the baseline simulation model comprises three major activities: first the gathering of the required input data, second the model set-up within the simulation environment and third the simulation and analysis process to make sure that the model works correctly and with the required degree of accuracy.
These activities are not performed in a pure sequential way; rather they represent parallel recurring tasks that are connected via continuous feedback loops until a valid state of the model has been achieved.
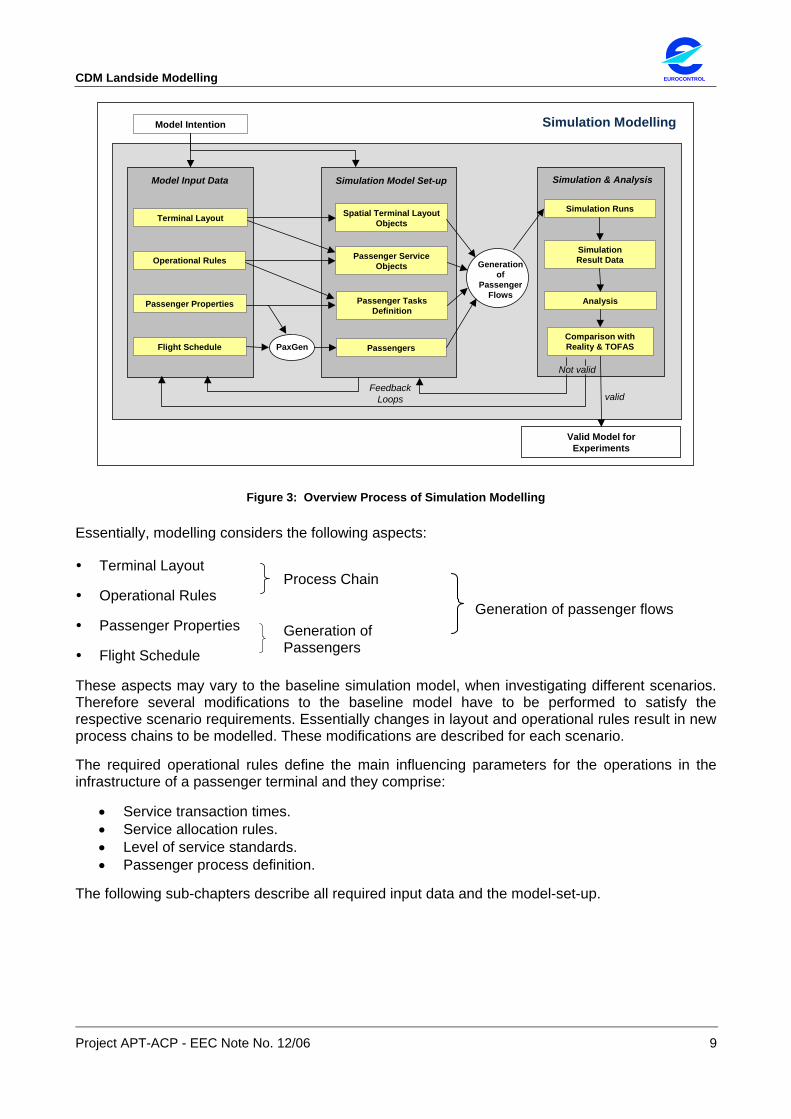
Figure 3 provides an overview of the activities that are performed to create a landside simulation model.
CDM Landside Modelling EUROCONTROL
Project APT-ACP - EEC Note No. 12/06 9
Flight Schedule
Passenger Properties
Operational Rules
Terminal Layout
Analysis
Simulation Result Data
Simulation Runs
Model Input Data
PaxGen Passengers
Passenger Service Objects
Spatial Terminal Layout Objects
Simulation & AnalysisSimulation Model Set-up
Generation of
Passenger Flows
Simulation Modelling
Valid Model for Experiments
Feedback Loops
Model Intention
valid
Not valid
Comparison with Reality & TOFAS
Passenger Tasks Definition
Figure 3: Overview Process of Simulation Modelling
Essentially, modelling considers the following aspects:
Terminal Layout
Operational Rules Process Chain
Passenger Properties
Flight Schedule Generation of Passengers
Generation of passenger flows
These aspects may vary to the baseline simulation model, when investigating different scenarios. Therefore several modifications to the baseline model have to be performed to satisfy the respective scenario requirements. Essentially changes in layout and operational rules result in new process chains to be modelled. These modifications are described for each scenario.
The required operational rules define the main influencing parameters for the operations in the infrastructure of a passenger terminal and they comprise:
• Service transaction times. • Service allocation rules. • Level of service standards. • Passenger process definition.
The following sub-chapters describe all required input data and the model-set-up.

EUROCONTROL CDM Landside Modelling
10 Project APT-ACP - EEC Note No. 12/06
2.3.2. Required Input Data
2.3.2.1. Terminal Layout
CAD drawings containing information on the geometric terminal layout and the location of handling services are required to model the spatial terminal layout in the 3D interface of CAST. The drawings should comprise floor plans of all building levels where passengers have access.
2.3.2.2. Service Transaction Times
A transaction time defines the time it takes in average to serve a passenger at a specific handling facility, such as check-in, boarding pass control, security control, passport control, and immigration control.
The transaction times and the available number of service stations combined with the passenger loads drive the occurrence of waiting queues depending on the passenger loads generated from a flight schedule. Although the handling of individual passengers might vary considerably, usually average values are applicable to the transaction times.
2.3.2.3. Service Allocation Rules
The demand on passenger handling services varies with the load of passengers arriving at the service stations for being processed over the day. An airport provides as much service stations within its infrastructure as needed to handle the traffic peaks. But not all service stations that are available at an airport are staffed all the time all the day, because staffing needs are planned with the demand driven by the flight schedule.
Allocation rules correspond to a flight schedule of a specific weekday defining the expected load of passengers. Therefore staffing schedule corresponding to the simulated flight schedule is required to open and close facilities over the day. Allocation schedules can be used in CAST for check-in and security, passport and immigration controls.
For this study, Fraport provided only a check-in counter allocation schedule. The allocation of control stations has been modelled by controlling them via level of service standards.
Level of Service Standards
Typical level of service standards is e.g. waiting times and queue length for services. For example the IATA gives guidelines for level of service criteria for waiting times.
Table 1: IATA - Level of Service Maximum Waiting Time Guidelines4
Facility Short to acceptable [min] Acceptable to long [min]
Check-In eco pax 0 - 12 12 – 30
Check-In first, business class 0 - 3 3 – 5
Security Control 0 - 3 3 – 7
Passport Control Inbound 0 -7 7 – 15
Passport Control Outbound 0 - 5 5 – 10
Baggage Claim 0 - 12 12 – 18
4 IATA Airport Development Reference Manual [2004]

CDM Landside Modelling EUROCONTROL
Project APT-ACP - EEC Note No. 12/06 11
These standards may be used for different purposes:
• As input for a requirement analysis to estimate the number of required resources needed to handle a specific traffic load.
• As analysis parameter to evaluate the quality standard of handling processes at an airport.
• As control data for the allocation of services depending on the current demand, e.g. to open and close passport or security controls in the simulation, because not all available services are staffed all the day.
2.3.2.4. Passenger Properties
In order to create passengers from a flight schedule, their properties need to be specified based on statistical distributions. Some data can be extracted from the flight schedule other data is based on surveys provided by the airport. Some of the important passenger properties are:
• Flight type (e.g. scheduled / charter). • Domestic Status (Schengen / Non-Schengen). • Passenger Type (direct / transfer). • Travel Class (ECO / CIP). • Reporting profiles / times (entry time, scheduled time of departure/arrival, exit time). • Number of hold bags and handbags. • Walking speed. • ….
Reporting profiles are one of the most important drivers for the simulation, because they define when passengers enter the terminal and thus define the demand on resources at certain times of the day. For instance, passengers on a departing flight do not arrive all at once for check-in. Rather they are distributed over certain time intervals before the scheduled time of departure. These distributions vary for different flight types; e.g. passengers booked on a long haul or charter flight tend to be at the airport much earlier than passengers booked on a domestic or short-haul flight.
2.3.2.5. Flight Schedule
A flight schedule is required to generate the passenger load for the simulation. Based on the flight schedule and on the set of user-defined passenger properties, passenger lists can be generated that will be loaded into the simulation model. Within this study the same flight schedule was applied for each scenario to guarantee comparability and consistency.
2.3.2.6. Passenger Process Definition
Information about all the different passenger process flows is required regarding arriving, departing and transfer passenger flows through the terminal geometry. Each of these flows through a terminal might be differentiated depending on the flight types and individual passenger properties as well.
For instance, a passenger on a Non-Schengen flight has another route through the terminal than a Schengen passenger and they are using services located in different areas of the terminal, such as Schengen and Non-Schengen gate areas or different baggage reclaim areas.
For that purpose terminal layout drawings are useful to illustrate the different flows through the terminal geometry.

EUROCONTROL CDM Landside Modelling
12 Project APT-ACP - EEC Note No. 12/06
2.3.3. Model Set-up
2.3.3.1. Set-up of Terminal Geometry and Services
The layout plans of the example terminal are imported into CAST through an interface, which serves to import CAD files, and are used as a ‘ground layer’ to position the functional areas and service objects into the model with geometrical correctness. The terminal is modelled by means of predefined service objects from the CAST 3D object library (rooms, walls, check-in counters, baggage belts etc) in a 3D simulation environment.
The terminal areas in the model itself are structured with walls/borders defining and limiting the space where passenger freely can move through the areas. The service facilities (check-in counters, security controls, baggage belts, etc.) are inserted as predefined 3D objects into the model and are arranged at the corresponding locations in the terminal areas.
2.3.3.2. Operational Parameter Settings of Services
When the layout of the terminal has been modelled and the service stations are arranged in the layout, in the next step the operational parameters are specified.
Setting Transaction Times of Services
The definition of transaction times in CAST can be performed for each individual service object via an object dialogue. Figure 4 displays an example for transaction time setting for a passport control service.
If a passport control service is selected in the model, the object dialogue will be opened. There the transaction time can be set depending on different conditions of passenger properties. (Example here: depending on the passenger property ‘Passport’ is EU or NonEU citizen).
Figure 4: Setting transaction times for services
CDM Landside Modelling EUROCONTROL
Project APT-ACP - EEC Note No. 12/06 13
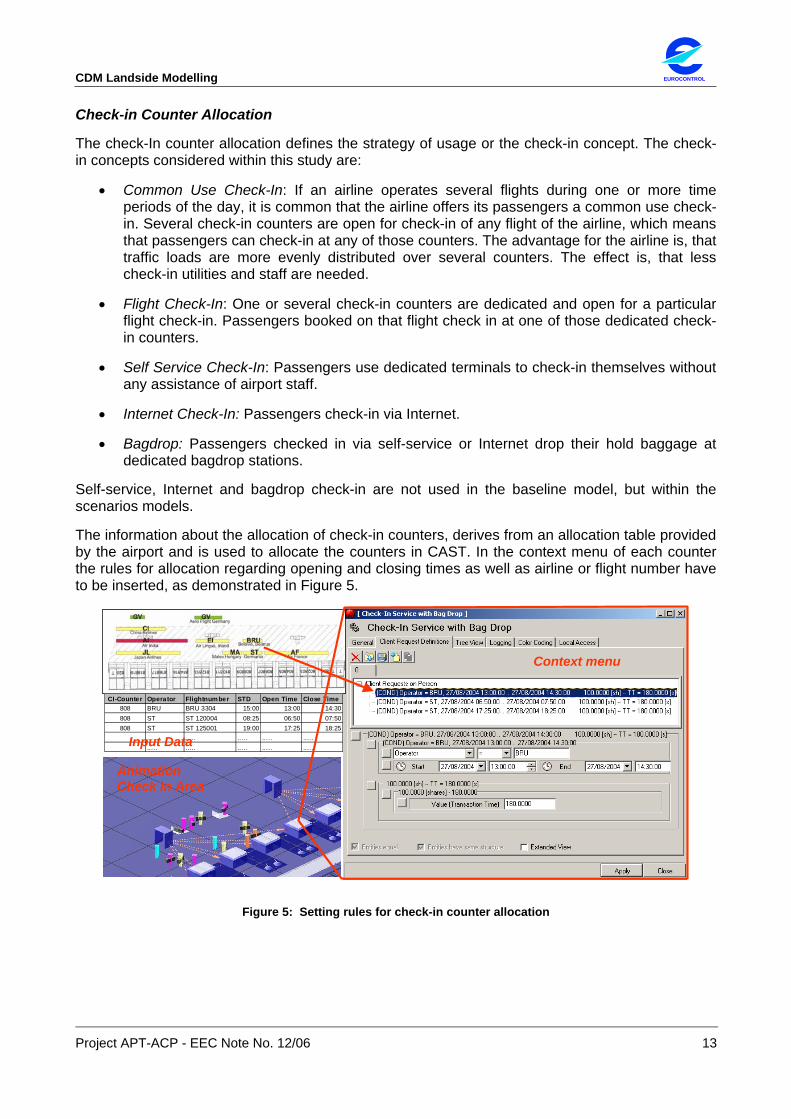
Check-in Counter Allocation
The check-In counter allocation defines the strategy of usage or the check-in concept. The check-in concepts considered within this study are:
• Common Use Check-In: If an airline operates several flights during one or more time periods of the day, it is common that the airline offers its passengers a common use check-in. Several check-in counters are open for check-in of any flight of the airline, which means that passengers can check-in at any of those counters. The advantage for the airline is, that traffic loads are more evenly distributed over several counters. The effect is, that less check-in utilities and staff are needed.
• Flight Check-In: One or several check-in counters are dedicated and open for a particular flight check-in. Passengers booked on that flight check in at one of those dedicated check-in counters.
• Self Service Check-In: Passengers use dedicated terminals to check-in themselves without any assistance of airport staff.
• Internet Check-In: Passengers check-in via Internet.
• Bagdrop: Passengers checked in via self-service or Internet drop their hold baggage at dedicated bagdrop stations.
Self-service, Internet and bagdrop check-in are not used in the baseline model, but within the scenarios models.
The information about the allocation of check-in counters, derives from an allocation table provided by the airport and is used to allocate the counters in CAST. In the context menu of each counter the rules for allocation regarding opening and closing times as well as airline or flight number have to be inserted, as demonstrated in Figure 5.
CI-Counter Operator Flightnumber STD Open Time Close Time808 BRU BRU 3304 15:00 13:00 14:30808 ST ST 120004 08:25 06:50 07:50808 ST ST 125001 19:00 17:25 18:25
..... ..... .....
..... ..... .......... .......... .....Input Data
Context menu
Animation Check in Area
Figure 5: Setting rules for check-in counter allocation

EUROCONTROL CDM Landside Modelling
14 Project APT-ACP - EEC Note No. 12/06
Allocation of Control Services
In case an allocation schedule for the opening and closing time of control services is available, it may be specified for the services.
In case an allocation schedule is not available, the level of service criteria is used as input in the simulation to control the opening and closing of service stations.
Usually, the level of service is measured with maximum waiting times or maximum queue lengths. For instance, passengers should not wait longer than 10 minutes at security control before being processes.
In order to control the number of used service stations, CAST offers the opportunity of using a controller object that automatically opens and closes stations. This depends on the current demand during simulation and is expressed by average or maximum waiting times or queue lengths.
2.3.3.3. Generation of Passenger Lists
Based on the flight schedule and a set of passenger properties, passenger lists are generated with the tool PaxGen. The passenger list has to be loaded into CAST to simulate passenger processes. PaxGen allows the definition of several properties, such as entry time distribution of passengers, walking speed, travel class, number of bags etc...
In PaxGen, for each property certain passenger groups can be specified that receive a property based on absolute values or based on probability distributions (e.g. percentage distribution or Gauss distribution).
The figure exemplarily demonstrates the definition of the walking speed by a Gauss distribution in PaxGen. During the passenger generation, for each passenger of a flight listed in the flight schedule, the properties defined in the tree are calculated according to the distributions. For each passenger PaxGen allocates a random value for the walking speed that is by probability retrieved from the specified Gauss distribution.
Figure 6: Setting passenger properties in PaxGen, Example: Walking Speed
Properties that are related to time, such as the entry time or exit time of passengers into the simulation, are allocated via so-called Reporting Profiles.
Figure 7 shows an example for the definition of the passenger property Entry Time that reflects the reporting time when passengers are entering the terminal for check-in. Time intervals are defined that relate to the scheduled time of departure. This time is derived from the flight schedule. The percentage of passengers of the respective flight is then allocated to the specified time intervals. In this way it is defined how many percent of the passengers have entered the terminal at what time for check-in.

CDM Landside Modelling EUROCONTROL
Project APT-ACP - EEC Note No. 12/06 15
Figure 7: Example: PaxGen definition of Reporting Profile for Entry Time
2.3.3.4. Passenger Task Definition
To generate the passenger flows in the simulation model, two further steps are required. First, the passenger lists generated by PaxGen need to be imported into the model. In a second step the tasks the passengers have to perform in the simulation (such as check-in, security control, or picking up baggage) need to be allocated to the passengers.
Passengers are generated according to their entry time within the terminal. Before they enter the terminal, they are sorted according to their properties that are relevant for their path through the terminal. Within the simulation model the distribution criteria for passengers used in the simulation are flight direction (arrival or departure), passenger type (direct or transfer) and the property Schengen or Non-Schengen.
Then they receive a task list defining the tasks they have to perform within the passenger handling process depending on their properties. Based on the defined tasks, the passengers are searching their path through the terminal on their own.
The paths of the passengers and the tasks they have to perform are different depending on the individual passenger’s properties. In order to model all the passenger flows like they occur in the real terminal, an accurate analysis of all the passenger flows is required. All relevant passenger flows have been derived in discussion with Fraport and specified in process diagrams before implementing them to the model.
2.3.4. Simulation and Analysis
After setting up the simulation model, simulation runs are executed. During a simulation run, simulation results may be displayed in charts, as the number of persons within a terminal area or the actual waiting time at a service object. The passenger flows and the queues can be observed in the 3D user interface.
In addition, for service objects and terminal areas, analysis parameters are logged per time interval every 5 minutes. The log data files that have been recorded during every simulation run are evaluated afterwards and the single service logs are investigated in groups (e.g. all security controls, all check-in counters).
EUROCONTROL CDM Landside Modelling
16 Project APT-ACP - EEC Note No. 12/06
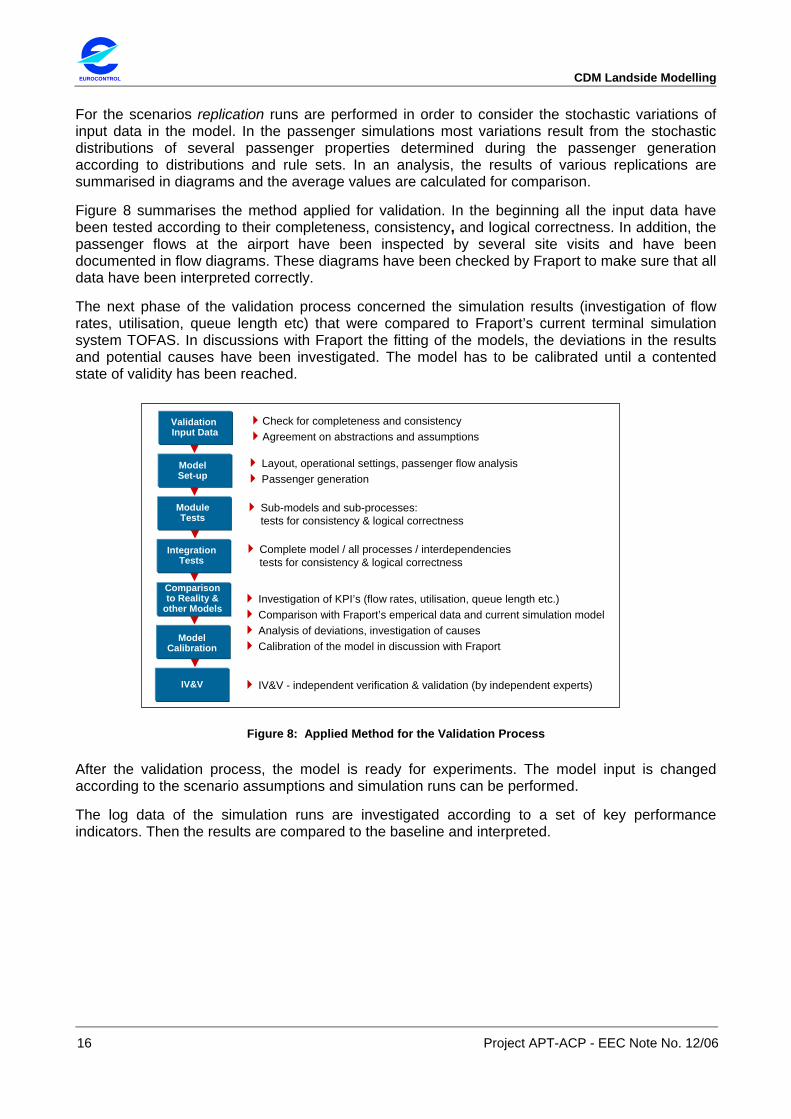
For the scenarios replication runs are performed in order to consider the stochastic variations of input data in the model. In the passenger simulations most variations result from the stochastic distributions of several passenger properties determined during the passenger generation according to distributions and rule sets. In an analysis, the results of various replications are summarised in diagrams and the average values are calculated for comparison.
Figure 8 summarises the method applied for validation. In the beginning all the input data have been tested according to their completeness, consistency, and logical correctness. In addition, the passenger flows at the airport have been inspected by several site visits and have been documented in flow diagrams. These diagrams have been checked by Fraport to make sure that all data have been interpreted correctly.
The next phase of the validation process concerned the simulation results (investigation of flow rates, utilisation, queue length etc) that were compared to Fraport’s current terminal simulation system TOFAS. In discussions with Fraport the fitting of the models, the deviations in the results and potential causes have been investigated. The model has to be calibrated until a contented state of validity has been reached.
LayPa
out, operational settings, passenger flow analysisssenger generation
ModelSet-up
ModuleTests
IntegrationTests
Comparisonto Reality &
other Models
Model Calibration
Validation Input Data
heck for completeness and consistencyreement on abstractions and assumptions
-models and sub-processes: tests for consistency & logical correctness
Complete model / all processes / interdependenciestests for consistency & logical correctness
Investigation of KPI’s (flow rates, utilisation, queue length etc.)Comparison with Fraport’s emperical data and current simulation modelAnalysis of deviations, investigation of causesCalibration of the model in discussion with Fraport
IV&V - independent verification & validation (by independent experts)
CAg
Sub
IV&V
Figure 8: Applied Method for the Validation Process
After the validation process, the model is ready for experiments. The model input is changed according to the scenario assumptions and simulation runs can be performed.
The log data of the simulation runs are investigated according to a set of key performance indicators. Then the results are compared to the baseline and interpreted.

CDM Landside Modelling EUROCONTROL
Project APT-ACP - EEC Note No. 12/06 17
3. BASELINE SIMULATION
This chapter describes the input data and the results of the validation and analysis process of the baseline model of the passenger terminal T2 of Frankfurt Airport5.
All input data and process descriptions have been embedded in the simulation model with the goal to model a similar passenger process like Fraport does with its existing simulation system TOFAS. This was required to compare the results of both Fraport’s and ARC’s simulation tool within the validation process.
The validation process has to be seen in a close context to the gathering and transformation of the input data as well as to the process of the model set-up. During this process all the data used has been verified and validated by ARC in cooperation with Fraport.
3.1.1. Input Data
The following input data has been provided by Fraport as input for the baseline scenario:
• Terminal layout. • Transaction times of services. • Check-in counter allocation. • Passenger properties. • Flight schedule. • Passenger process definition.
3.1.1.1. Terminal Layout
Fraport has provided CAD plans of all the building levels of Terminal 2, where passengers have access to and that are relevant for the modelling of the passenger processes. Figure 9 shows a CAD plan loaded as ground layer in CAST.
Figure 9: Input data: terminal layout CAD plan loaded as ’ground layer’ behind the model
5 Fraport officially confirms that all investigation parameters are based on Fraport’s operational knowledge and experience. The set-up and calibration of the simulation models has been approved by Fraport experts.

EUROCONTROL CDM Landside Modelling
18 Project APT-ACP - EEC Note No. 12/06
Figure 10 shows the building levels with all the different terminal areas modelled in CAST.
Check-In Area
Immigration E
Schengen Gate Area ESchengen Gate Area D
Retail Area
Level 2
Level 3
Boarding Pass & Security ControlSchengen
Baggage Area D Baggage Area E
Immigration D
Boarding Pass & Passport & Security Control NonSchengen
Non Schengen Gate Area D
Non Schengen Gate Area E
PTS
Retail Area
Food HallLevel 4
Level 4
US & GB Security Control US & GB Security Control
Area D Area E
Figure 10: Simulation Model Layout of Terminal 2 – Functional Areas (Screenshot)
The building levels, which are most relevant for the modelling of the passenger processes, are level 2 and level 3.
• On level 2 most of the terminal functions are located: the central check-in hall, boarding pass and security control for Schengen passengers, a retail area as well as the Schengen gate areas. In addition, level 2 also accommodates all facilities for arriving passengers: the immigration control, baggage reclaim areas, customs control and the meet and greet area.
• Level 3 is dedicated for Non-Schengen flights: boarding pass control, passport control and security control are arranged in the central area of the level 3 connected to the check-in hall via escalators. The gate area comprises the gate hold rooms, airline business lounges as well as duty-free retail areas. The gates in the extended pier located on the west side of the terminal, contains stairs to access the gate hold rooms on level 2. Although the gates in level 2 are dedicated for Schengen flights, in this area they may be used as swing gates, also being used for Non-Schengen flights.
• On level 4 the access to the PTS (passenger transport system) is provided. The PTS is an internal elevated transport train that connects Terminal 2 with Terminal 1 of Frankfurt Airport. For instance, direct passengers arriving by train at the railway station in Terminal 1 take the PTS for a fast and convenient access of Terminal 2. In addition, also transfer passengers use the PTS in order to transfer from Terminal 1 to Terminal 2 and vice versa. For the transfer of Non-Schengen passengers the PTS provides a separated wagon where the station directly is connected with the Non-Schengen gate area via a corridor.
The service facilities (check-in counters, security controls, baggage belts, etc.) have been placed as predefined 3D terminal objects into the model and are arranged at the corresponding locations in the terminal areas.

CDM Landside Modelling EUROCONTROL
Project APT-ACP - EEC Note No. 12/06 19
3.1.1.2. Service Transaction Times
Table 2 lists all the primary passenger services with ranges for the transaction times in seconds per passenger as well as the number of service stations provided in Terminal 2.
Table 2: Input data: transaction times for services
Service Number of services in T2 Transaction Times
Ticket Counter 52 30 – 50 sec/pax
Hold Baggage Control before Check-In 18 5 – 15 sec/pax
Check-In Counter 132 60 – 180 sec/pax
Boarding Pass Control - Schengen
- Non Schengen Security Control
- Schengen
- Non Schengen
4 (2) (2) 19 (6) (13)
3 – 7 sec/pax
25 – 35 sec/pax
Passport Control Non Schengen 14 EU: 5 – 10 sec/pax NonEU: 20 – 30 sec/pax
Gate Control - Schengen
- Non Schengen Immigration Control
- Area D
- Area E
39 (18) (11) 28
(14) (14)
20 – 30 sec/pax
EU: 7 – 14 sec/pax NonEU: 20 - 30 sec/pax
Customs Control - Area D
- Area E
3 green, 3 red 3 green, 3 red
red: 60 – 180 sec/pax green: 0 sec/pax
Allocation of Control Stations
The demand on passenger handling services varies with the load of passengers arriving at the service stations for being processed at the same time over the day. Not all service stations are staffed all the time during the day. Fraport did not provide a schedule when services are open or closed. Therefore, Service Level Criteria is used to automatically open and close service stations depending on the current passenger loads during the simulation.
The used Service Level Criteria applied have been discussed with Fraport and specified within the controller definitions for passport, security and immigration controls.
Table 3: Level of Service Criteria for Security, Passport and Immigration Control
Service MaxQueueLength [pax]
Security Control 15
Passport Control 15
Immigration Control 20

EUROCONTROL CDM Landside Modelling
20 Project APT-ACP - EEC Note No. 12/06
In the beginning of the simulation, only one of all available service station is open. The criteria MaxQueueLength has been used in the simulation to open further service stations when the queue length of all open stations exceeds this level.
3.1.1.3. Service Allocation Rules
Check-In Counter Allocation
The check-in counters are allocated to airlines. Airlines that operate several flights from the airport every day, such as British Airways or Air France, have dedicated check-in counter groups. Several airlines with less flights share the same counters during different times of the day. Figure 11 shows the allocation of airlines to check-in counters within the check-in areas D and E of Terminal 2.
LTE
LX
PS
TP
KM
GV
GF
TE
OGE
GV GV GV
FVMH AI
SHY
VIM
KZR
BI
BRUAI
MAJL AF
EI
ST
CI
GV GV
KE
Tap Portugal
Ukraine Int.
Swiss
Air Malta
LTE Internat. (Spain)
Korean Air
Malaysian
Air Astrana
Via Bulgaria
Aero Flight Germany
Aero Flight Germany
Gulf Air
Atlas Internat.
Lithuanian
Sky Airlines
Royal Brunei
Air India
Pulkaova, RUS
Aero Flight Germany
China Airlines
Japan Airlines
Air India Air Lingus, Irland Belavia, Belarus
Air FranceMalev,Hungary Germania
CI D5
CI D1
CI D3
CI D2
CI D4
DLDelta
GV new GV new
Check In Area D
TS
BA
IB
LA
Check In Area E
CX
QF
ABLT
LA
NW KL SBIFI
AY
BUC
Northwest KLM Finnair Sibir Airlines
Iceland Air
Bulgarian Air Charter
Con
tinen
tal
Air
Tran
sat,
CA
British Airways Cathey Pacific
Iberia Quantas
Air Berlin
LTU
Lan Airlines, Chile
Lan Airlines, Chile CI E2
CI E1
CI E3CI E4
CI E5
LT
SHYSky Airlines
Figure 11: Input data: check-in counter allocation for terminal area D and E
The counters have opening and closing times that are related to the departure time (STD = scheduled time of departure) and the destination of the flight. The following rules are applicable to most of the flights:
• For European or domestic travel the counters open 120 minutes before STD. • For intercontinental and charter traffic the counters open 180 minutes before STD. • Usually the check-in counters for a flight close 30 minutes before STD.
In addition, the kind of use of the check-in counters is relevant. The two common concepts of check-in counter use can be found at Terminal 2: the flight check-in and the common use check-in.
CDM Landside Modelling EUROCONTROL
Project APT-ACP - EEC Note No. 12/06 21
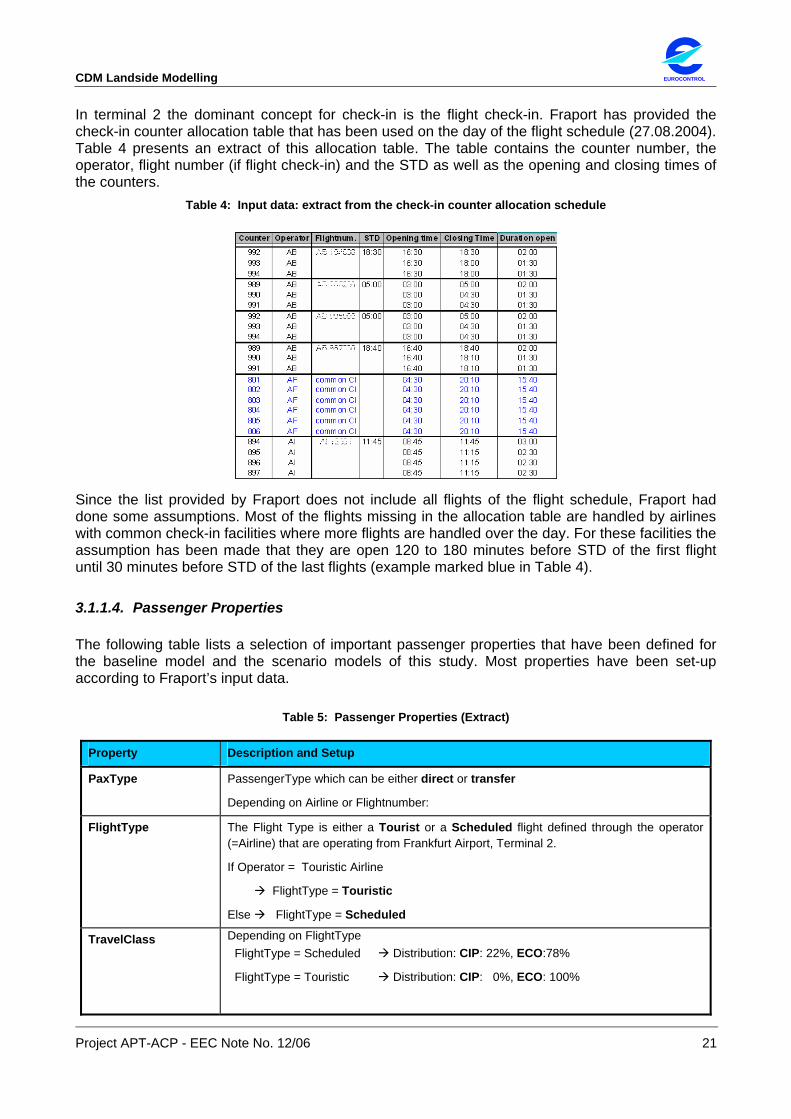
In terminal 2 the dominant concept for check-in is the flight check-in. Fraport has provided the check-in counter allocation table that has been used on the day of the flight schedule (27.08.2004). Table 4 presents an extract of this allocation table. The table contains the counter number, the operator, flight number (if flight check-in) and the STD as well as the opening and closing times of the counters.
Table 4: Input data: extract from the check-in counter allocation schedule
Since the list provided by Fraport does not include all flights of the flight schedule, Fraport had done some assumptions. Most of the flights missing in the allocation table are handled by airlines with common check-in facilities where more flights are handled over the day. For these facilities the assumption has been made that they are open 120 to 180 minutes before STD of the first flight until 30 minutes before STD of the last flights (example marked blue in Table 4).
3.1.1.4. Passenger Properties
The following table lists a selection of important passenger properties that have been defined for the baseline model and the scenario models of this study. Most properties have been set-up according to Fraport’s input data.
Table 5: Passenger Properties (Extract)
Property Description and Setup
PaxType PassengerType which can be either direct or transfer
Depending on Airline or Flightnumber:
FlightType The Flight Type is either a Tourist or a Scheduled flight defined through the operator (=Airline) that are operating from Frankfurt Airport, Terminal 2.
If Operator = Touristic Airline
FlightType = Touristic
Else FlightType = Scheduled
TravelClass Depending on FlightTypeFlightType = Scheduled Distribution: CIP: 22%, ECO:78%
FlightType = Touristic Distribution: CIP: 0%, ECO: 100%

EUROCONTROL CDM Landside Modelling
22 Project APT-ACP - EEC Note No. 12/06
Property Description and Setup
WalkingSpeed WalkingSpeed of Passengers in meter per sec. Gauss Distribution:
MarketGroup Criteria to further specify the criteria FlightType.
If FlightType = Touristic MarketGroup = Touristic
If FlightType = Scheduled
State = DE MarketGroup = Domestic State = Europa MarketGroup = EU State = US Marketgroup = US State = others Marketgroup = Intercont
DomStatus Domestic Status (Schengen or NonSchengen)
If State = AT, BE, DE, DK, ES, FI, FR, GR, IS, IT, LU, ML, NO. PT or SE
DomStatus = Schengen
Else: DomStatus = NonSchengen
Bags Number of holdbags, depending on PaxType and MarketGroups
EntryTime Entry Reporting Profiles: when passengers arrive in Terminal (related to STD & STA)
Departure: depending on STD (scheduled time of departure) different distributions depending on MarketGroup
Arrival Flight: EntryTime = Scheduled Time of Arrival (STA)
Passport Percentage of EU and NonEU
Derived from flight schedule and Fraport’s Input data
Airlines = US Continent = Europe Continent = others Distribution:
Distribution: Distribution:

CDM Landside Modelling EUROCONTROL
Project APT-ACP - EEC Note No. 12/06 23
3.1.1.5. Flight Schedule
Fraport has provided a flight schedule of the day 27.08.2004. The flight schedule includes the number of passengers per flight arrived and departed this day within Terminal 2 of Fraport.
Aircraft Movements FRA Terminal 2(Flight schedule analysis)
0
5
10
15
20
25
30
00:0
0
00:4
0
01:2
0
02:0
0
02:4
0
03:2
0
04:0
0
04:4
0
05:2
0
06:0
0
06:4
0
07:2
0
08:0
0
08:4
0
09:2
0
10:0
0
10:4
0
11:2
0
12:0
0
12:4
0
13:2
0
14:0
0
14:4
0
15:2
0
16:0
0
16:4
0
17:2
0
18:0
0
18:4
0
19:2
0
20:0
0
20:4
0
21:2
0
22:0
0
22:4
0
23:2
0
time
A/C
Mov
emen
ts /
hour
SumArrivalDeparture
Selected Flight Schedule of 27.08.2005
249 Flights
122 Departure Flights 127 Arrival Flights
30.605 Pax
18.197 arriving pax 87% direct 13% transfer 13.411 departing pax 83% direct 17% transfer 78% ECO, 22% CIP
(business and 1st class)
Figure 12: Flight Schedule 27.08.2004 –Aircraft Movements (Gliding Hour)
Although Frankfurt Airport is a typical hub airport handling a considerable share of transfer passengers through its main carrier Lufthansa and the Star Alliance partners, the main proportion of transfer passengers is handled in the larger Terminal 1 that has not been modelled within the simulation model. The investigated flight schedule of Terminal 2 is relatively small with 13% transfer passengers on departure flights and 17% on arriving flights.
Within Terminal 2 a traffic mixture of several scheduled and charter carriers is handled.
Table 6: Traffic structure
Flights Pax av number Pax/flight
All flights 249 100% 31608 100% 127
Charter 66 27% 11447 36% 173 Scheduled 183 73% 20161 64% 110
NonSchengen 158 63% 22700 72% 144
Schengen 91 37% 8908 28% 98
Around one third of all flights is handled via charter airlines with European and intercont destinations. The scheduled traffic operates the European business travel destination as well as intercontinental traffic (mainly US and Asia).
The majority of the passengers (72%) are Non-Schengen passengers.
EUROCONTROL CDM Landside Modelling
24 Project APT-ACP - EEC Note No. 12/06
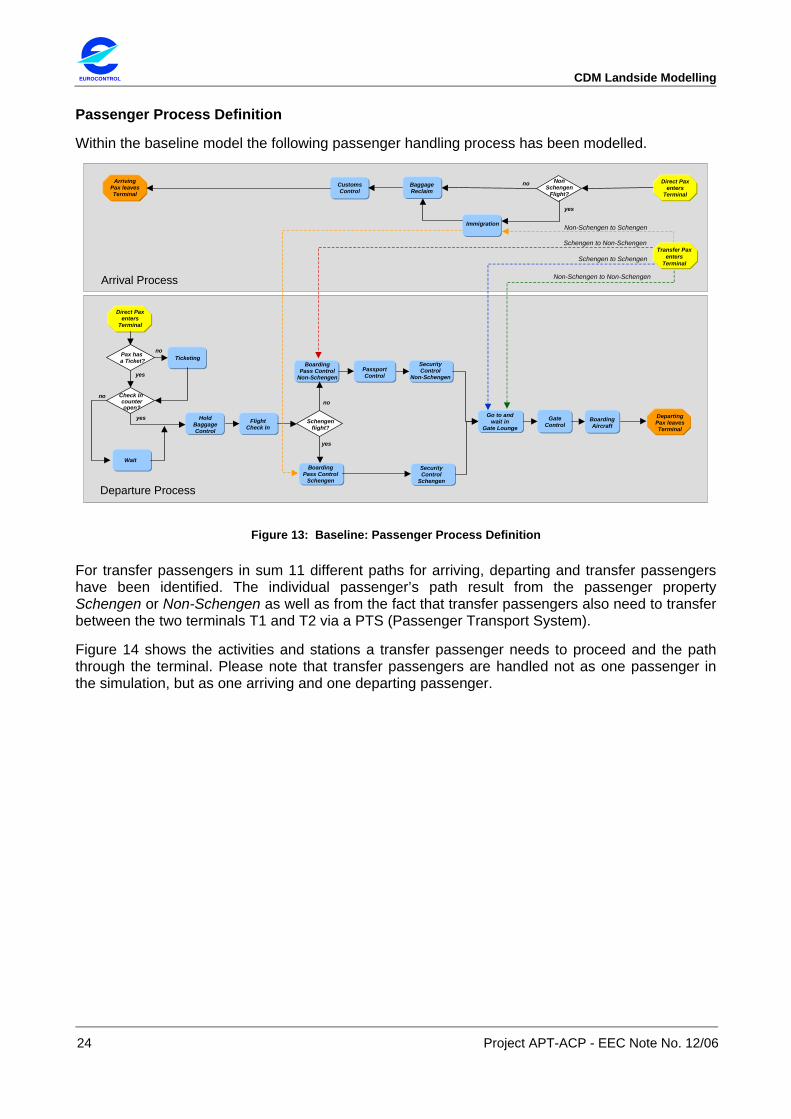
Passenger Process Definition
Within the baseline model the following passenger handling process has been modelled.
Gate Control
FlightCheck In
BoardingPass Control
Schengen
Go to andwait in
Gate Lounge
HoldBaggage Control
TicketingPax hasa Ticket?
yes
no
Direct Pax enters
Terminal
Schengen flight?
yes
no
Security Control
Schengen
Security Control
Non-SchengenPassportControl
Boarding Aircraft
Wait
Check In counteropen?
yes
no
BoardingPass Control
Non-Schengen
Immigration
NonSchengen
Flight?
yes
noBaggage Reclaim
Customs Control
ArrivingPax leavesTerminal
Arrival Process
Departure Process
Departing Pax leavesTerminal
Non-Schengen to Schengen
Schengen to Non-Schengen
Non-Schengen to Non-Schengen
Schengen to SchengenTransfer Pax
enters Terminal
Direct Pax enters
Terminal
Figure 13: Baseline: Passenger Process Definition
For transfer passengers in sum 11 different paths for arriving, departing and transfer passengers have been identified. The individual passenger’s path result from the passenger property Schengen or Non-Schengen as well as from the fact that transfer passengers also need to transfer between the two terminals T1 and T2 via a PTS (Passenger Transport System).
Figure 14 shows the activities and stations a transfer passenger needs to proceed and the path through the terminal. Please note that transfer passengers are handled not as one passenger in the simulation, but as one arriving and one departing passenger.

CDM Landside Modelling EUROCONTROL
Project APT-ACP - EEC Note No. 12/06 25
Figure 14: Variants for Transfer-Passengers, Example of a passenger flow (Case 4)
3.1.2. Simulation Runs
Setting up the baseline model has been split through building sub-models (one model for level 2 and one model for level 3 and 4). For these sub-models several test cases have been defined and processed. This comprised the variation of passenger lists (only 10 passengers up to all 30.605 passengers), flight directions (only arrival, only departure and both), of passenger types (only direct, only transfer, both) etc. For all these test cases, cross checks and observations of the simulation process by means of animation and data evaluation have been used. Then the sub models have been merged together and the mentioned tests have been performed again.
During the validation process with Fraport several model adaptations have been performed and the model has been re-run several times until it delivered results that have been accepted in the validation process.
For the comparison with the scenarios, some slight adaptations are done again in the baseline model and the baseline scenario has been re-run with other passenger lists again to create baseline simulation data for comparison.
3.1.3. Results
Fraport has been the reference airport for the Project Phase 1 and has been fully involved in the steps of the project. By providing real input data and operational expert knowledge the practical relevance is ensured.
The validation process is characterised through an iterative process where the model has been validated step-by-step. It is obvious, that a 100% proof cannot be attained, because a simulation model is an abstraction of reality considering input data based on random values and statistical distributions.

EUROCONTROL CDM Landside Modelling
26 Project APT-ACP - EEC Note No. 12/06
Also CAST and TOFAS are based on different simulation technologies (link-node versus free-flow) and different methods to process the input and output data. Therefore, not all aspects can be validated by means of comparing the output of the two systems. It is also obvious, that no identity can be attained, rather similarities can be demonstrated.
In addition, there is an essential difference how log data have been generated. TOFAS creates person logs. CAST logs have been based on service objects and rooms. TOFAS calculates waiting times as proportions how long passengers have waited in average according to different time intervals, CAST calculates waiting times and queues for each individual service object.
The validation process focuses on the flow rates at the entry of the terminal as well as on the processes just after check-in as security and passport controls. When the flow rates are similar, the model is regarded to work appropriate.
3.1.4. Conclusions
The comparison with TOFAS shows a very good similarity, but certainly no identity between the simulation results of both models. The reasons are the following:
• First, the input data are not completely identical. A 100% input data use is not attainable because both models require an enormous amount and partly different input data. Thus, the most relevant but also additional input data have been used, that was required in CAST but not asked for in TOFAS (e.g. geometrical information). Some deviations are therefore acceptable.
• Second, the passenger flows in both models are not identical. Since the simulation systems use different technologies, the passenger flows are represented with different degree of accuracy. While the passenger flows in TOFAS are modelled based on link-node technology, on straight path directly between different handling services, in CAST intelligent agents in a free-flow environment represent the passengers.
• Third, there are differences due to random variables and due to the algorithm creating the random numbers. Both models use e.g. different statistical algorithms for the generation of passengers.
The simulation experts of Fraport see the high similarity of the comparable results and n regard the baseline model as valid. Thus, a valid model has been created, which can be used for experiments with scenarios.
The simulation and analysis of the baseline scenario demonstrates that Terminal 2 still has a high level of service standard regarding the capacity.
Even during peak hour, at the main control stations such as passport, security and immigration controls, no serious congestions have been detected and there is still extra capacity to handle future traffic increase.
The check-in facilities are also sufficient. In particular for flight check-in of charter airlines and some scheduled airlines, longer queues and waiting times have been observed.
In summary, Fraport agrees with the conclusion, that terminal 2 still has enough capacity on the landside of the terminal. However, Fraport states that the bottleneck of the airport has to be seen rather on the airport airside in respect to stand positions and slot capacity.

CDM Landside Modelling EUROCONTROL
Project APT-ACP - EEC Note No. 12/06 27
4. SCENARIO SIMULATION
4.1. OVERVIEW
After the baseline simulation model has been validated, it can be used for the conduction of scenario experiments.
In the beginning of the initial project phase a brainstorming process has been executed involving EEC, Fraport, ARC and terminal experts from other German Airports in the scope of an airport workshop.
Several scenarios have been defined identifying changes of landside processes, such as:
1. Increased automation of check-in processes by CUSS services and Internet to reduce staff cost and increase passenger throughput.
2. Announcement of gate information only 30 or 40 min. before departure to increase retail yield potentials.
3. Late passenger priority handling to test effects of late passengers on flight delays (first-come-first-serve principle is abandoned).
4. Increased automation of identity checks (like passport control) via biometric technology to reduce the number of security staff and to increase the security quality.
5. Increased security measures to regain passenger trust (security already at terminal entries, more effective, non-intrusive security control equipment, and/or increased transaction times).
6. Changed traffic structure and traffic loads to test the robustness of terminal layouts and operational concepts testing e.g. increased hub traffic or point-to-point traffic.
Within the scope of the current project phase 1: Initial Scenarios, the first three scenarios ‘CUSS’, ‘Retail Yield’ and ‘Late Passenger’ have been selected to deduce major effects on terminal operations.
The CUSS Scenario investigates the impact of technological concept of check-in automation within the check-in process by CUSS (common use self-service) and Internet check-in.
The Retail Yield Scenario investigates changes of the operational setting in the announcement of gate information 30 or 40 minutes before departure only to test the potentials to increase the retail yield.
The Late Passenger Scenario investigates the consequences of passengers arriving later than in the baseline scenario at the airport and offering them dedicated fast track facilities to faster proceed through the handling process. Variations with increased share of check-in automation and increase in traffic loads are investigated as well. This scenario has to be regarded in the context of CDM and ACARE that demands a high degree of punctuality and very time efficient handling process in order to minimise flight delays.
The following three sub-chapters will discuss the scenarios. For each scenario the background and objective is described first. Then the general scenario assumptions are specified. To reflect realistic scenario settings, all scenario assumptions have been defined in close cooperation with Fraport. The description of the input data focuses on the model input that differs from the baseline. An overview is given to the simulation runs and their variations followed by the specification of the investigated key performance indicators.

EUROCONTROL CDM Landside Modelling
28 Project APT-ACP - EEC Note No. 12/06
The key performance indicators have been selected according to the question the scenario focuses on. Then the most relevant results are presented and interpreted. Finally a conclusion summarises the main findings for each scenario.
4.2. CUSS SCENARIO
4.2.1. Scenario Description and Objective
Self-service check-in kiosks are already in operation today. They are mainly used by frequent travellers and usually dedicated to customers of certain airlines or airline alliances. However, the traditional staff check-in is still the dominant concept at airports.
There is a trend to use so-called CUSS stations (common use self service) that are open for the check-in of all passengers of any airline. In addition to this, there is a trend of more and more airlines offering their passengers to check-in via Internet, where passengers can select their seat and print out their boarding pass themselves. Passengers already checked in via Internet do not need to use the CUSS check-in any more. In the case they have hold baggage, they only need to drop their baggage at dedicated bagdrop stations before directly proceeding to the security control to enter the airside of the terminal without any further check-in processes.
The objective of the CUSS scenario is to test the effect of automation of the check-in process for a growing share of self-service up to 80% of all passengers. The effects are analysed regarding CUSS check-in, bagdrop services and the traditional staffed check-in.
The assumed potential benefits lie in reducing staff cost and increasing the passenger throughput to be handled in a certain time period.
Considering the fact that the low-cost traffic segment has strongly increased during the recent years, the scenario considers that airlines also could use automation of check-in services as an instrument for product diversification (concentrating staff support only for CIP passengers (commercially important passengers, as business and 1st class), ECO passengers more self-service and less staff support).
4.2.2. Scenario Assumptions
In the baseline all passengers have been served at staffed check-in facilities whereas the CUSS scenario is assuming a distribution of three different check-in types for two degrees of automation. The three check-in types are:
• CUSS Check-In: the passenger checks in at a self-service kiosk to get his boarding pass and seat reservation. In case he has hold baggage he needs to go to a self-service bagdrop station to tag and drop his hold baggage.
• Internet Check-In: the passenger has already checked in via Internet and already has his boarding pass and seat reservation. In case he has hold baggage he needs to go to a self-service bagdrop station to tag and drop his hold baggage.
• Traditional Staffed Check-In: the passenger uses the traditional staffed check-in, gets his boarding pass and seat reservation served by an airline’s staff member. The staff member also receives and tags the passenger’s hold baggage.

CDM Landside Modelling EUROCONTROL
Project APT-ACP - EEC Note No. 12/06 29
With Fraport the following assumptions regarding the shares of passengers using the different check-in types have been agreed upon:
Table 7: Share of passengers using the different Check-In Types
Check-In Type Share
CUSS check-in 50%
Internet check-in 30% Staffed check-in 20%
Within the scenario the degree of automation depends upon the travel class. The travel class is based on the following assumptions regarding product diversification:
• ECO passengers are regarded as low cost traffic segment. They get less service for lower ticket prices. Consequently, for ECO passengers the rate of supporting staff is very low and the rate of automation is very high. Staff check-in is only the exception for problem cases.
• CIP passengers pay more for their tickets and are therefore getting a lot of attention by supporting staff. The level of service is very high (short waiting times and waiting queues, location of services in centre of the terminal with short walking distances).
The percentage of CIP passengers checked in at staffed check-in stations is assumed to be much higher than the rate for ECO passengers checking in at staffed check-in stations. Table 8 gives the shares for staffed check-in. The degree of automation via Internet and CUSS check-in has been set within the scenario:
Table 8: Degree of automation Table 9: Share of Check-In types
Travel Class ECO CIP
Automated check-in (Internet and CUSS) 90% 20%
Staffed check-in 10% 80%
Travel Class ECO CIP
CUSS check-in 55% 12% Internet check-in 35% 8% Staffed check-in 10% 80%
Combining the percentages for different check-in types with the degree of automation regarding the travel classes of CIP and ECO passengers, the shares for check-in type per travel class have been derived (Table 9).
4.2.3. Input Data
4.2.3.1. Terminal Layout
The check-in hall layout has been changed for the introduction of the new check-in concept. This input is at the same time also an output of the scenario. Before setting-up the new layout, several simulation and replication runs were needed to estimate the required demand on the different check-in service facilities for bagdrops, CUSS kiosks and traditional check-in counters for ECO and CIP passengers.
Since only a limited number of check-in facilities is needed to handle the same demand as in the baseline, even parts of the check-in hall have been cut off as shown in Figure 16.

EUROCONTROL CDM Landside Modelling
30 Project APT-ACP - EEC Note No. 12/06
All Check in counters are flight used
132 staffed CI Counter
Figure 15: CUSS Scenario: Check-In Area Baseline (for comparison)
Area not used
Area not used
ECO ECOCIP CIP
ECO CUSS Kiosks ECO CUSS Kiosks
ECO BagdropsECO Bagdrops
CIP Staffed CheckIn
CIP CUSS CheckIn
ECO Check In facilities common used, CIP Check In facilities Airline Alliance used
Figure 16: CUSS Scenario: Adapted Layout of Check-In Area according to the CUSS Scenario
In addition, the hold baggage control stations in front of the check-in counters have been removed. According to Fraport these facilities will be removed in the near future when the baggage handling system is renewed. The control stations have been modelled in the baseline, because they also have been considered in the TOFAS model. The validation process required to consider these facilities to model the same passenger process as in TOFAS.
4.2.3.2. Passenger Properties
The passenger properties need to be adapted regarding the check-in type. In the baseline scenario this property has not been used so far.
The shares specified in Table 9 are set in the passenger generation tool PaxGen. They are applied to each flight depending on the travel class of a passenger. To simulate the CUSS scenario, new passenger lists have to be generated.
4.2.3.3. Service Transaction Times
In the baseline scenario, the average transaction time for check-in has been set for staffed as well as for automated check-in via CUSS to 120 seconds and for bagdrop-service to 80 seconds per passenger. Within the CUSS scenario the transaction times are set for CIP and ECO check-in facilities.
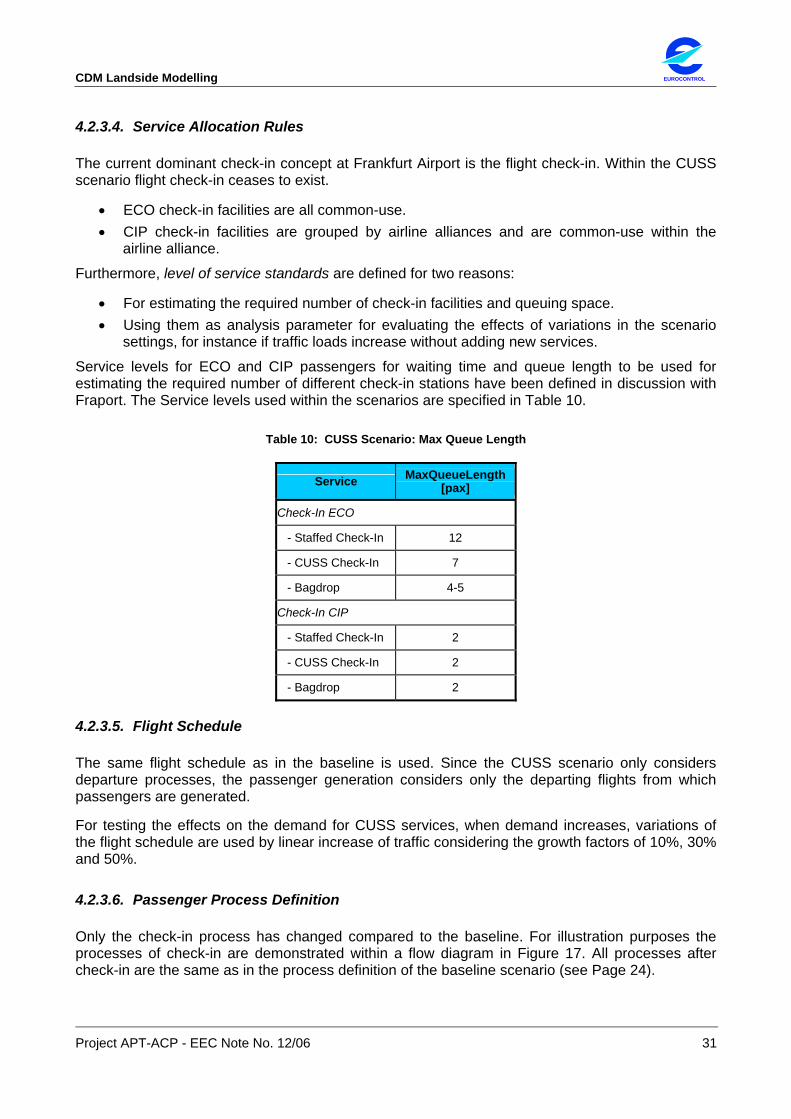
CDM Landside Modelling EUROCONTROL
Project APT-ACP - EEC Note No. 12/06 31
4.2.3.4. Service Allocation Rules
The current dominant check-in concept at Frankfurt Airport is the flight check-in. Within the CUSS scenario flight check-in ceases to exist.
• ECO check-in facilities are all common-use. • CIP check-in facilities are grouped by airline alliances and are common-use within the
airline alliance.
Furthermore, level of service standards are defined for two reasons:
• For estimating the required number of check-in facilities and queuing space. • Using them as analysis parameter for evaluating the effects of variations in the scenario
settings, for instance if traffic loads increase without adding new services.
Service levels for ECO and CIP passengers for waiting time and queue length to be used for estimating the required number of different check-in stations have been defined in discussion with Fraport. The Service levels used within the scenarios are specified in Table 10.
Table 10: CUSS Scenario: Max Queue Length
Service MaxQueueLength [pax]
Check-In ECO
- Staffed Check-In 12
- CUSS Check-In 7
- Bagdrop 4-5
Check-In CIP
- Staffed Check-In 2
- CUSS Check-In 2
- Bagdrop 2
4.2.3.5. Flight Schedule
The same flight schedule as in the baseline is used. Since the CUSS scenario only considers departure processes, the passenger generation considers only the departing flights from which passengers are generated.
For testing the effects on the demand for CUSS services, when demand increases, variations of the flight schedule are used by linear increase of traffic considering the growth factors of 10%, 30% and 50%.
4.2.3.6. Passenger Process Definition
Only the check-in process has changed compared to the baseline. For illustration purposes the processes of check-in are demonstrated within a flow diagram in Figure 17. All processes after check-in are the same as in the process definition of the baseline scenario (see Page 24).

EUROCONTROL CDM Landside Modelling
32 Project APT-ACP - EEC Note No. 12/06
Figure 17: CUSS Scenario – Check-In Process Diagram
4.2.4. Simulation Runs
Various simulation runs have been performed to calibrate the model with the passenger loads of different replications generated from the flight schedule.
Among others, the following CUSS scenarios have been investigated:
Table 11: Overview CUSS Simulation Scenarios
Scenarios Description
CUSS Scenario Several simulation runs are performed to determine the number of required check-in facilities for the different check-in types.
Calibration of the number of facilities according to the specified service levels and the flight schedule of 27.08.2004.
After calibration, simulation runs are performed to compare the simulation results with the FRA baseline model.
Variations
10% traffic increase
30% traffic increase
50% traffic increase
Variations have been run with linear traffic increase by growth factors of 10%, 30% and 50% with the given simulation model, but increased traffic loads through a linear modified flight schedule.
Add new check-in services
Figure out the number of service stations required to resolve a system break down at a service (e.g. ECO CUSS kiosks in scenario 50% traffic increase)
Failure of check-in services
Simulation of failure of service stations, e.g. 2, 3, 4 Bagdrop stations fail. This allows the impact analysis on the change in level of service (queue length and waiting time) and also shows when the system fails due to exponential delays.

CDM Landside Modelling EUROCONTROL
Project APT-ACP - EEC Note No. 12/06 33
4.2.5. Specification of Key Performance Indicators
The analysis of the simulation runs concentrates on the KPIs that depend upon the questions to be answered with the simulation of the CUSS scenario:
• How many check-in facilities are needed to handle the same traffic load as in the baseline? • How is the utilisation of space in the check-in hall compared to the baseline? • What influence has the CUSS scenario on the throughput of passengers? • What is the effect on the following services as security or passport control?
With this background the following KPIs have been identified:
• Number of check-in facilities needed to handle same traffic load as in baseline. • Utilisation of check-in hall measured in passengers counted there per time interval. • Flow rates – arrived clients and finished clients per time interval at passport and security
controls.
4.2.6. Results and Interpretation
The introduction of automated check-in by CUSS and Internet offers a lot of benefits for the efficiency of terminal operations. The results of the investigated scenario with a share of 80% automation, lead to the following conclusions:
1. Reduced number of Check-In facilities by 50%
The number of check-in facilities may be reduced by more than 50% (from 132 down to 63 check-in facilities).
The passenger load created from the flight schedule defines the amount of passengers per check-in type and their chronological distribution over the day. This load combined with the defined level of service determines the facility requirements, i.e. the number of required counters for each check-in type.
In the first step the number of the different check-in facilities are estimated by considering the level of service criteria defined by Fraport (queue length and waiting times).
In the second step the facilities are integrated into the layout of the simulation model. With several replication runs the number of required facilities has been verified. For the simulated flight day of 27.08.2004 the following facility requirements have been derived:
Table 12: CUSS Scenario: Required Check-In Facilities
Check-In facilities Staffed Check-In CUSS kiosks Bagdrops Sum
ECO 3 to 4 14 15 33
CIP6 22 8 0 30
SUM 26 22 15 63
6 For the CIP check-in facilities airlines have been grouped according to alliances

EUROCONTROL CDM Landside Modelling
34 Project APT-ACP - EEC Note No. 12/06
Comparison to Baseline
In the baseline the number of check-in facilities is 132 staffed check-in counters. The CUSS scenario has the minimum requirement to handle the same investigated traffic loads with 63 check-in services only. The CUSS scenario needs at least 63 check-in facilities (>50% less).
Since the number of counters is much lower than in Terminal 2 as it exists today, parts of the terminal check-in hall have been cut off in the simulation model. The check-in counters for ECO and CIP passengers, staffed check-in counters, CUSS kiosks and bagdrops have been arranged in the remaining hall.
ECO CUSS Kiosks Area D
ECO BagdropsArea D
ECO CUSS KiosksArea E
ECO BagdropsArea E
CIP Staffed CheckInStarAlliance
CIP CUSS CheckIn of Airline Alliances
CIP Staffed CheckInOneWorld
CIP Staffed CheckInSkyTeam
CIP Staffed CheckInOther Airlines
Area not used
Area not used
ECO CUSS Kiosks Area D
ECO BagdropsArea D
ECO CUSS KiosksArea E
ECO BagdropsArea E
CIP Staffed CheckInStarAlliance
CIP CUSS CheckIn of Airline Alliances
CIP Staffed CheckInOneWorld
CIP Staffed CheckInSkyTeam
CIP Staffed CheckInOther Airlines
ECO CUSS Kiosks Area D
ECO BagdropsArea D
ECO CUSS KiosksArea E
ECO BagdropsArea E
CIP Staffed CheckInStarAlliance
CIP CUSS CheckIn of Airline Alliances
CIP Staffed CheckInOneWorld
CIP Staffed CheckInSkyTeam
CIP Staffed CheckInOther Airlines
Area not used
Area not used
Figure 18: CUSS Scenario – Possible Re-organisation of Check-In Area (Isometric view)
2. Check-In Process: Improved Throughput of Passengers / Flattened Peaks
Even if the overall transaction time for the CUSS check-in process with CUSS kiosks and bagdrops is increased, the effect on the overall throughput in this scenario is improved.
This effect results from a combination of the following factors:
• Passengers do not need to wait until a certain counter opens for check-in as in the baseline scenario. Thus, within the CUSS scenario passengers can receive immediate service, which results in the fact that they are more evenly distributed over a longer time interval than in the baseline. In the baseline scenario passengers have to wait until check-in counters open, respectively they have to wait in a queue if they come after opening of the check-in counter. Such kinds of delays are eliminated with the CUSS scenario.
• CUSS services are available 24 hours a day and thus offer all-time service. This has an essential impact on the queues and waiting times if e.g. 20 kiosks are all time available for check-in compared to 20 check-in desks that are only open and staffed during certain time periods.
• The fact that the check-in facilities are common used and not flight used any more as in the baseline offers large potentials for better utilisation of check-in services and space.
• The high amount of passengers checked in via Internet (30%) already offers a release of the Check-in facilities, because they only use the bagdrops. Note: If passengers can check-in any time when they want to, it is recommended to also investigate the
effects or shifts of loads in the baggage handling system.
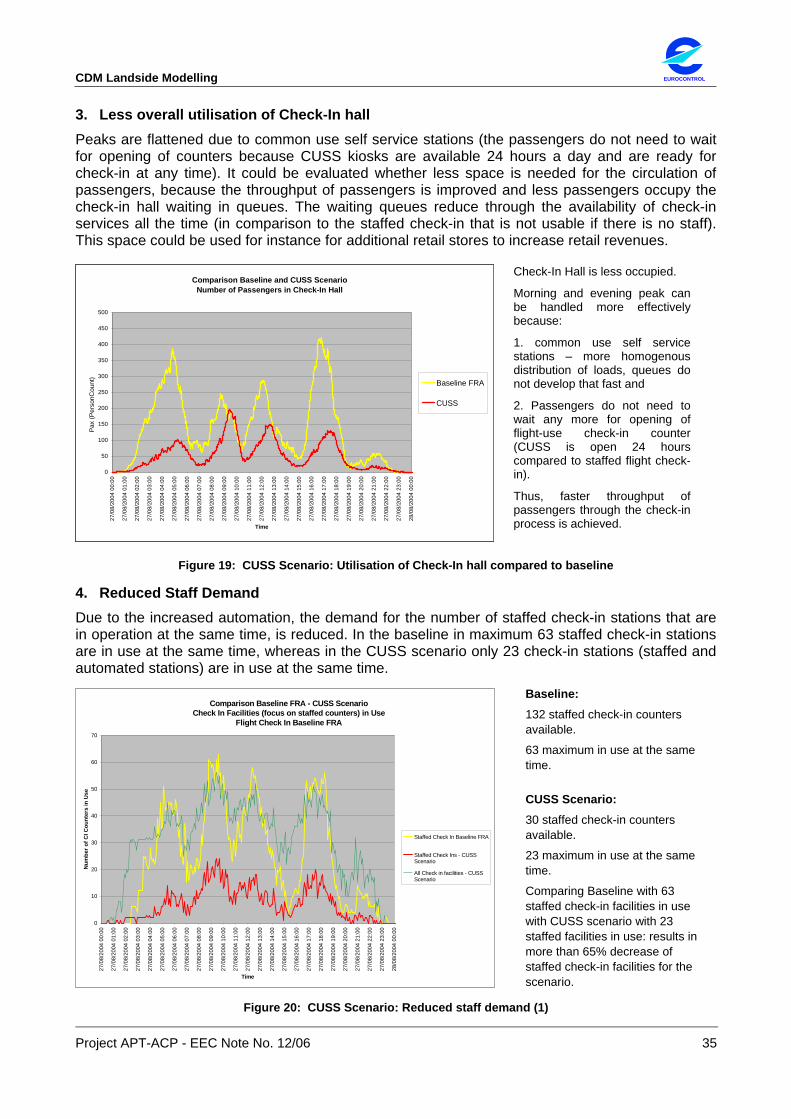
CDM Landside Modelling EUROCONTROL
Project APT-ACP - EEC Note No. 12/06 35
3. Less overall utilisation of Check-In hall Peaks are flattened due to common use self service stations (the passengers do not need to wait for opening of counters because CUSS kiosks are available 24 hours a day and are ready for check-in at any time). It could be evaluated whether less space is needed for the circulation of passengers, because the throughput of passengers is improved and less passengers occupy the check-in hall waiting in queues. The waiting queues reduce through the availability of check-in services all the time (in comparison to the staffed check-in that is not usable if there is no staff). This space could be used for instance for additional retail stores to increase retail revenues.
Comparison Baseline and CUSS ScenarioNumber of Passengers in Check-In Hall
0
50
100
150
200
250
300
350
400
450
500
27/0
8/20
04 0
0:00
27/0
8/20
04 0
1:00
27/0
8/20
04 0
2:00
27/0
8/20
04 0
3:00
27/0
8/20
04 0
4:00
27/0
8/20
04 0
5:00
27/0
8/20
04 0
6:00
27/0
8/20
04 0
7:00
27/0
8/20
04 0
8:00
27/0
8/20
04 0
9:00
27/0
8/20
04 1
0:00
27/0
8/20
04 1
1:00
27/0
8/20
04 1
2:00
27/0
8/20
04 1
3:00
27/0
8/20
04 1
4:00
27/0
8/20
04 1
5:00
27/0
8/20
04 1
6:00
27/0
8/20
04 1
7:00
27/0
8/20
04 1
8:00
27/0
8/20
04 1
9:00
27/0
8/20
04 2
0:00
27/0
8/20
04 2
1:00
27/0
8/20
04 2
2:00
27/0
8/20
04 2
3:00
28/0
8/20
04 0
0:00
Time
Pax
/ 5 m
in.
Baseline FRA
CUSS
Pax
(Per
sonC
ount
)
Check-In Hall is less occupied.
Morning and evening peak can be handled more effectively because:
1. common use self service stations – more homogenous distribution of loads, queues do not develop that fast and
2. Passengers do not need to wait any more for opening of flight-use check-in counter (CUSS is open 24 hours compared to staffed flight check-in).
Thus, faster throughput of passengers through the check-in process is achieved.
Figure 19: CUSS Scenario: Utilisation of Check-In hall compared to baseline
4. Reduced Staff Demand Due to the increased automation, the demand for the number of staffed check-in stations that are in operation at the same time, is reduced. In the baseline in maximum 63 staffed check-in stations are in use at the same time, whereas in the CUSS scenario only 23 check-in stations (staffed and automated stations) are in use at the same time.
Comparison Baseline FRA - CUSS ScenarioCheck In Facilities (focus on staffed counters) in Use
Flight Check In Baseline FRA
0
10
20
30
40
50
60
70
27/0
8/20
04 0
0:00
27/0
8/20
04 0
1:00
27/0
8/20
04 0
2:00
27/0
8/20
04 0
3:00
27/0
8/20
04 0
4:00
27/0
8/20
04 0
5:00
27/0
8/20
04 0
6:00
27/0
8/20
04 0
7:00
27/0
8/20
04 0
8:00
27/0
8/20
04 0
9:00
27/0
8/20
04 1
0:00
27/0
8/20
04 1
1:00
27/0
8/20
04 1
2:00
27/0
8/20
04 1
3:00
27/0
8/20
04 1
4:00
27/0
8/20
04 1
5:00
27/0
8/20
04 1
6:00
27/0
8/20
04 1
7:00
27/0
8/20
04 1
8:00
27/0
8/20
04 1
9:00
27/0
8/20
04 2
0:00
27/0
8/20
04 2
1:00
27/0
8/20
04 2
2:00
27/0
8/20
04 2
3:00
28/0
8/20
04 0
0:00
Time
Num
ber o
f CI C
ount
ers
in U
se
Staffed Check In Baseline FRA
Staffed Check Ins - CUSSScenario
All Check in facilities - CUSSScenario
Baseline: 132 staffed check-in counters available.
63 maximum in use at the same time. CUSS Scenario: 30 staffed check-in counters available.
23 maximum in use at the same time.
Comparing Baseline with 63 staffed check-in facilities in use with CUSS scenario with 23 staffed facilities in use: results in more than 65% decrease of staffed check-in facilities for the scenario.
Figure 20: CUSS Scenario: Reduced staff demand (1)

EUROCONTROL CDM Landside Modelling
36 Project APT-ACP - EEC Note No. 12/06
5. Relief of following services as Security and Passport Control A smoothening/flattening of peaks (20 to 30% less during extreme peaks) has been observed at Security and Passport Control. Passengers arrive earlier at the controls and are distributed more evenly than in the baseline. Thus, potentials for less staff demand at security and passport control are possible.
Comparison Baseline FRA with CUSS ScenarioPassport Control Arrived Clients
0
10
20
30
40
50
60
70
80
90
100
110
120
27/0
8/20
04 0
0:00
27/0
8/20
04 0
1:00
27/0
8/20
04 0
2:00
27/0
8/20
04 0
3:00
27/0
8/20
04 0
4:00
27/0
8/20
04 0
5:00
27/0
8/20
04 0
6:00
27/0
8/20
04 0
7:00
27/0
8/20
04 0
8:00
27/0
8/20
04 0
9:00
27/0
8/20
04 1
0:00
27/0
8/20
04 1
1:00
27/0
8/20
04 1
2:00
27/0
8/20
04 1
3:00
27/0
8/20
04 1
4:00
27/0
8/20
04 1
5:00
27/0
8/20
04 1
6:00
27/0
8/20
04 1
7:00
27/0
8/20
04 1
8:00
27/0
8/20
04 1
9:00
27/0
8/20
04 2
0:00
27/0
8/20
04 2
1:00
27/0
8/20
04 2
2:00
27/0
8/20
04 2
3:00
28/0
8/20
04 0
0:00
Time
Pax
/ 5 m
in. Baseline FRA
(6 stations in use)
CUSS (5 stations in use)
Baseline FRA(max 6 stations in use)
CUSS(max 5 stations in use)
Smoothening of peaks.
At the same time reduced number of required passport controls (5 instead of 6).
Potential for staff reduction while handling the same amount of traffic.
Figure 21: CUSS Scenario: Smoothening of peaks and reduced staff demand (1)
Comparison Baseline FRA - CUSS ScenarioSecurity Control Schengen
Arrived Clients
0
10
20
30
40
50
60
27/0
8/20
04 0
0:00
27/0
8/20
04 0
1:00
27/0
8/20
04 0
2:00
27/0
8/20
04 0
3:00
27/0
8/20
04 0
4:00
27/0
8/20
04 0
5:00
27/0
8/20
04 0
6:00
27/0
8/20
04 0
7:00
27/0
8/20
04 0
8:00
27/0
8/20
04 0
9:00
27/0
8/20
04 1
0:00
27/0
8/20
04 1
1:00
27/0
8/20
04 1
2:00
27/0
8/20
04 1
3:00
27/0
8/20
04 1
4:00
27/0
8/20
04 1
5:00
27/0
8/20
04 1
6:00
27/0
8/20
04 1
7:00
27/0
8/20
04 1
8:00
27/0
8/20
04 1
9:00
27/0
8/20
04 2
0:00
27/0
8/20
04 2
1:00
27/0
8/20
04 2
2:00
27/0
8/20
04 2
3:00
28/0
8/20
04 0
0:00
Time
Pax
/ 5 m
in.
Baseline FRA
CUSS Scenario
Baseline FRA
CUSS
Smoothening of peaks.
(most extreme peaks by 20 to 30%).
Passengers arrive earlier and more distributed at security Control.
Less staff demand.
Figure 22: CUSS Scenario: Smoothening of peaks and reduced staff demand (2)
6. Variations: Effects on Passenger Load Increase Attention must be paid regarding contingency effects and change in traffic load when calculating the number of CUSS stations. As the service level reaches an unacceptable level, a volatile system behaviour has been observed. Delay and queuing effects became visible under changed conditions in respect to the number of available stations while traffic loads have been increased.

CDM Landside Modelling EUROCONTROL
Project APT-ACP - EEC Note No. 12/06 37
ECO CUSS kiosks: MaxAverage Waiting Time:
CUSS Baseline: 10min maxAvWT
Increase of max Av. Waiting time with 14 CUSS kiosks
MQL and maxAvWT gets bigger and shift more to the right howolder the day gets. How older the day gets,consequences are getting worse, extreme long waiting times are the result.
Factor 1.5 with 10% traffic growth
Factor 4 with 30% traffic growth
Factor 11 with 50% traffic growth
ECO CUSS kiosks: Max Queue Length:
CUSS Baseline: 7 pax MQL
Increase of max Queue Length with 14 CUSS kiosks
Service Level are exceeded enourmous!
Factor 1.3 with 10% traffic growth
Factor 3 with 30% traffic growth
Factor 8 with 50% traffic growth
Comparison CUSS Baseline with Linear Traffic Growth ScenariosECO CUSS Check In
Maximum Queue Length
0
10
20
30
40
50
60
27/0
8/20
04 0
0:00
27/0
8/20
04 0
1:00
27/0
8/20
04 0
2:00
27/0
8/20
04 0
3:00
27/0
8/20
04 0
4:00
27/0
8/20
04 0
5:00
27/0
8/20
04 0
6:00
27/0
8/20
04 0
7:00
27/0
8/20
04 0
8:00
27/0
8/20
04 0
9:00
27/0
8/20
04 1
0:00
27/0
8/20
04 1
1:00
27/0
8/20
04 1
2:00
27/0
8/20
04 1
3:00
27/0
8/20
04 1
4:00
27/0
8/20
04 1
5:00
27/0
8/20
04 1
6:00
27/0
8/20
04 1
7:00
27/0
8/20
04 1
8:00
27/0
8/20
04 1
9:00
27/0
8/20
04 2
0:00
27/0
8/20
04 2
1:00
27/0
8/20
04 2
2:00
27/0
8/20
04 2
3:00
28/0
8/20
04 0
0:00
Time
Pax
/ 5 m
in.
10% Traffic Increase30% Traffic Increase50% Traffic IncreaseCUSS Baseline
Comparison CUSS Baseline with Linear Traffic Growth ScenariosECO CUSS Check In
Maximum Average Waiting Time
0
20
40
60
80
100
120
27/0
8/20
04 0
0:00
27/0
8/20
04 0
1:00
27/0
8/20
04 0
2:00
27/0
8/20
04 0
3:00
27/0
8/20
04 0
4:00
27/0
8/20
04 0
5:00
27/0
8/20
04 0
6:00
27/0
8/20
04 0
7:00
27/0
8/20
04 0
8:00
27/0
8/20
04 0
9:00
27/0
8/20
04 1
0:00
27/0
8/20
04 1
1:00
27/0
8/20
04 1
2:00
27/0
8/20
04 1
3:00
27/0
8/20
04 1
4:00
27/0
8/20
04 1
5:00
27/0
8/20
04 1
6:00
27/0
8/20
04 1
7:00
27/0
8/20
04 1
8:00
27/0
8/20
04 1
9:00
27/0
8/20
04 2
0:00
27/0
8/20
04 2
1:00
27/0
8/20
04 2
2:00
27/0
8/20
04 2
3:00
28/0
8/20
04 0
0:00
Time
Min
utes
10% TrafficIncrease
30% TrafficIncrease
50% Traffic Increase
CUSSBaseline
Figure 23: CUSS Scenario: Traffic Increase and development of queues
Increasing the traffic loads by 30% and 50%, without adding new self service check-in stations results in a fast decrease of the level of service. When reducing the number of self service stations under the same traffic load, a volatile system behaviour also might be observed, which may result in a system break down.
Another scenario has the objective to investigate a 50% traffic increase while at the same time six new CUSS kiosks are added. This measure brings the level of service back to the desired level of service standard. 20 CUSS kiosks instead of 14 make the system stable again.
The volatile behaviour regarding changes in traffic loads or availability of services requires careful investigation of facility requirements. Attention must be paid in order to plan enough stations against contingency effects.
Conclusions
The use of automated check-in concepts with CUSS and Internet check-in offers a lot of benefits regarding terminal operations. The results of the investigated scenario with a 80% share of automation through CUSS and Internet check-in leads to the following conclusions:
1. Less overall utilisation and space demand of Check-In hall
• Faster and more homogenous throughput of passengers through check-in process. • The occupation of the check-in hall can be significantly decreased, and more space is
available for future increased demand or other facilities like additional retail.
2. Reduced number of Check-In facilities by 50%
• Number of check-in facilities can be reduced by more than 50% (from 132 down to 63 check-in facilities).

EUROCONTROL CDM Landside Modelling
38 Project APT-ACP - EEC Note No. 12/06
3. Smoothening/Flatten of peaks
• Smoothening of traffic peaks within the check-in area as well as at the following services of the passenger process chain, as at security and passport control.
• Peaks are flattened first at check-in due to common used self service stations (Pax do not need to wait for opening of counters because CUSS are available 24 hours a day and ready for check-in) and also have a positive effect on the following handling processes since traffic is distributed more homogeneously.
4. Reduced staff demand by 65%
• Number of staffed check-in counters in operation at the same time is reduced. In the Baseline more than 60 check-in stations have been in use at the same time, whereas in the CUSS scenario around 23 stations are needed to be staffed – mainly for CIP passengers. For ECO passengers only 4 staffed check-in counters are sufficient.
5. Relief of following services as security and passport control
• Smoothening/Flatten of peaks (20 to 30% less during extreme peaks) at Security and Passport Control Schengen, Passengers arrive earlier at security control and are distributed more evenly.
• Thus, potentials for less staff demand at security and passport control.
The analysis of scenario variations demonstrates the effects on decreased level of service. As in all queuing sensitive systems, the simulation results show the boundaries for an increase in traffic while not adding more self service stations. It is obvious, that a facility requirement analysis that is optimal for a specific load will fail under changed load.
In addition, the decrease of number of ECO self-service facilities has been investigated. As example a failure of bagdrops has been simulated. If the number of bagdrops is reduced from 15 down to 11 stations, the waiting times and queue length reach an unacceptable level and queues cannot be handled any more, because they add up between peaks.
An airport that introduces CUSS services as the dominant check-in concept should plan for system failure and simulation as a useful instrument to test the boundary conditions when a system exceeds capacity and creates a serious bottleneck in a terminal.
With the trend of increased use of CUSS and Internet services there is also a trend for a decrease in landside facility space demand. When planning new terminal facilities this trend has to be taken into account.
4.3. RETAIL YIELD SCENARIO
4.3.1. Scenario Description and Objective
Traditionally, the gate information is provided during the check-in process. The passenger receives the information of the gate number from where he will be boarded. Thus, the passenger has a final, predefined target to go to. A lot of passengers are concerned to be at the gate a considerable time before boarding starts and are sitting around in the waiting area.
The Retail Yield scenario looks for a way to investigate in the case of Fraport’s Terminal 2 to better use the time of passengers waiting in the gate lounge area for shopping activities. But how can this goal be attained?
Within the Retail Yield scenario a concept for Fraport’s Terminal 2 is investigated that lean on the “British Retail Concept” introduced successfully by the BAA (British Airport Authorities) at several British airports.

CDM Landside Modelling EUROCONTROL
Project APT-ACP - EEC Note No. 12/06 39
Within this concept the waiting time passengers usually spend in the gate lounge is transformed into spending time – and potential revenues – in the retail area. During the check-in process the boarding gate is not announced to the passengers. After the security control, the passengers enter a common waiting lounge which is located in a retail area (not vice versa). The gate number for boarding is only announced a limited time before boarding starts, for instance 30 to 40 minutes before departure. This animates the passenger to shop in a retail area that is combined with a common waiting lounge. Monitors with gate information are all over the place, so that passengers always can receive the information when and where their flight will be boarded.
Although the concept is not new, the effect of such a measure lies in the structure and characteristic of traffic, which is unique for each airport. The effect is a combination of traffic volume and several factors determined by the traffic structure as the mix of airlines, the variety and range of destinations, the accessibility of the airport and most important the typical distribution of passengers arriving a certain time before departure for check-in at the airport.
Objective
Due to cost pressure in the aviation business airports depend more and more on additional non-flight related revenues and are looking for ways how to increase them. Passengers should be animated to use their waiting time for shopping.
In this scope, the ‘British Gate Concept’ is tested with the simulation model of Terminal 2 of Fraport in order to investigate how much potentials are existing to increase retail yield under different parameter settings varying the Gate Reporting Time 30 min and 40 min. before departure as well as the shares of how many passenger will go shopping.
This scenario has been selected also for the reasons to consider the stakeholder interests of airports. When looking at the ACARE vision 2020, where the passenger process times should be reduced to a minimum, this would not be in the interest of airports, because they gain revenue with passengers spending spare time in the terminal. The scenario can be used to evaluate the spare time that is left for retailing under different scenario assumptions.
4.3.2. Scenario Assumptions
In the initial baseline model prepared for the validation process with Fraport, no retail concept has been implemented. Thus, after check-in, security and passport control, passengers proceed directly to their gate lounges and wait in the hold room until boarding starts.
In order to have a more realistic baseline of when passengers go to the gate after the controls, the baseline scenario is extended with retail functionality and the passenger process definition considers retail tasks. Therefore, the baseline scenario needs to be re-run again for comparisons with the scenario. This baseline scenario is called the Retail Yield Baseline.
The distribution of passengers arriving at the gates is determined by their reporting time within the terminal for check-in and the following handling processes like security and passport control, the walking distances and walking speed between the various passenger handling services as well as by the time passengers spend waiting in queues until they are being served and finally reach their gate lounge.
Whether a passengers is retailing after the security control, depends on his available time budget as well as on his retail behaviour.

EUROCONTROL CDM Landside Modelling
40 Project APT-ACP - EEC Note No. 12/06
Definition of the Retail Behaviour for the Retail Yield Baseline
The gate information is known by the time of check-in. For the baseline it is assumed that 40% of all ECO passengers go shopping if they have enough time. 60% of the ECO passengers will proceed directly to the gate lounge. 80% of all CIP passengers go to a dedicated business lounge before proceeding to the gate. The other 20% are assumed to be retail passengers.
Definition of the Retail Behaviour Retail Yield Scenario
All passengers get their gate information just 40 min. before departure. The time before, they stay in different areas of the terminal:
The behaviour of the CIP passengers does not change. 80% of the CIP are in the business lounges while 20% go shopping. According to their gate reporting time they go to their gate. ECO retail passengers are assumed to spend money in the retail area. Initially the share of retail passengers is set to 40% as same as in the baseline for more consistent comparison. The share of 60% non-retail passengers stay in common waiting areas located within the retail area.
It is assumed that the share of retail passengers increases when passengers, that did not plan to shop, are animated to shop, since they have to wait in the retail area. Thus, the share of retail passengers is a candidate for variation. Thus, variations for 40%, 60%, 70% and 80% of retail passengers are considered in different simulation runs.
60%don‘tshop
40% shop
ECO CIP
Baseline20% shop
80% Business Lounge
CIP
60%shop
40% don‘tshop
Retail Yield Scenario
ECO (4 variations)
70%shop
30% don‘tshop 60%
shop
20% don‘tshop
20% shop
80%BusinessLounge
CIP
60%don‘tshop
40% shop
Figure 24: Baseline & Retail Yield Scenario - Definition of Retail Behaviour
4.3.3. Input Data
4.3.3.1. Terminal Layout
The terminal layout of the baseline is used without changes. The baseline does already contain retail service objects, but the passengers only do not use them in the baseline scenario.
4.3.3.2. Passenger Properties
Two new passenger properties are introduced for the Retail Yield scenario:
• Retail Type. • Gate Reporting Time.
The Retail Type is set according the scenario assumptions specified in Figure 24. This requires the generation of 5 different passenger lists to run variations regarding the scenario parameter Retail Type.
To model a specific reporting time at the gate, a GateReportingTime (GRT) is introduced. The GateReportingTime is set according to an interval, e.g. 90 to 15 minutes before the scheduled departure time. In between this interval the passenger of a specific flight are scheduled to arrive at their gate.

CDM Landside Modelling EUROCONTROL
Project APT-ACP - EEC Note No. 12/06 41
During the simulation run, retail passengers check continuously if their time budget leaves time to go shopping or perform other leisure activities. The simulation model makes sure, that the passenger does not go earlier to his gate than set by his Gate Reporting Time. If a passenger has extra time in his time budget he spends his time in the retail area.
Within the passenger generation tool (PaxGen) the different reporting profiles for gate reporting are defined.
Check in Reporting (CI RP) and Gate Reporting Time RY 90min (GRT)
0
10
20
30
40
50
60
70
80
90
100
0-1515-30
30-4545-60
60-7575-90
90-105
105-120
120-135
135-150
150-165
165-180
180-195
195-210
210-225
225-240
240-255
255-270
270-285
285-300
300-315Minutes before Departure
%
CI-RT Intercont u. touristicCI-RT EuropeCI-RT DomesticGRT Intercont + touristicGRT EuropeGRT Domestic
The Retail Yield Baseline (RY_Baseline) considers a gate reporting profile that is related to the entry reporting profile of the different market groups.
The gate reporting profile refers also to the general opening of gates for flights from 90 minutes before STD.
Figure 25: Retail Yield Scenario – Gate Reporting Profile for Retail Yield Baseline
Passengers' Arrival Distribution at Gate
0.0%10.0%20.0%30.0%40.0%50.0%60.0%70.0%80.0%90.0%
100.0%
40-3838-35
30-2930-25
25-2020-15
15-1010-5
5-0
Minutes before Departure
100%90%80%70%60%50%40%30%20%10%
Reporting Profile: Gate Reporting Time (GRT) 40minRetail Yield Scenario
The Retail Yield Scenario considers a single gate reporting profile that is used for passengers of all market groups.
According to the entry reporting profiles, most passengers are already in the terminal 40 minutes before STD.
The gate reporting starts slowly around 40min. before departure when the gate information is announced.
Figure 26: Retail Yield Scenario – Gate Reporting Profiles for Retail Yield Scenarios
For the RY Baseline a typical Gate Reporting Profile is used when passengers arrive in their gates to determine the arrival of passengers retailing before going to their gate. The profile considers the time span of 90 to 15 minutes before departure. 90 minutes is set because gates are opened and at least are occupied for a certain flight, when an aircraft is parked on the respective gate stand.
Table 13: Gate Reporting Profile Retail Yield Baseline (GRT_90min)
% % %% % % %%

EUROCONTROL CDM Landside Modelling
42 Project APT-ACP - EEC Note No. 12/06
The Gate Reporting Profiles for the Retail Yield scenarios with 40 and 30 minutes gate announcement is defined as follows:
Table 14: Gate Reporting Profile Retail Yield 40min (GRT_40min) and 30min (GRT_30min)
%%
%%
Within the passenger generation each passenger gets a gate reporting time when he is scheduled to arrive in the gate lounge after the announcement of the gate information.
4.3.3.3. Service Transaction Times
No changes to transaction times of the baseline model.
4.3.3.4. Service Allocation Rules
No changes to Service Allocation Rules of the baseline model.
4.3.3.5. Flight Schedule
The same flight schedule as in the baseline is used. Since the Retail Yield scenario only considers departure processes, the passenger generation considers only the departing flights from which passengers are generated.
4.3.3.6. Passenger Process Definition
The tasks defining the processes different passengers have to perform, depend on the passengers’ properties, such as RetailType (Shopping or NoShopping), TravelClass (CIP or ECO) and the allocated GateReportingTime when passengers should arrive at the gate.
Since the Retail Yield baseline differs from the initial baseline in the consideration of retail activities, the process definition for the Retail Yield baseline as well as for the Retail Yield scenario is displayed. Compared to the initial baseline, the Retail Yield Baseline and the Retail Yield Scenario differ concerning the handling of departing passengers. After the security control, the Gate Reporting Time, the Retail Type and the Travel Class trigger the behaviour of the passengers (compare also with Figure 13).

CDM Landside Modelling EUROCONTROL
Project APT-ACP - EEC Note No. 12/06 43
Figure 27: Retail Yield Baseline: Passenger Process Diagram
40% of all ECO passengers go shopping before they proceed to their gates according their GateReportingTime, the other 60% directly proceed to their gates to wait in the gate lounges for boarding.
CIP: 80% of all CIP passengers go to the business lounges after security control to wait there before they proceed to their gate, 20% of CIP passengers go shopping before proceeding to the gate according their GateReportingTime.
Figure 28: Retail Yield Scenario RY_40min_40% Passenger Process Diagram

EUROCONTROL CDM Landside Modelling
44 Project APT-ACP - EEC Note No. 12/06
4.3.4. Simulation Runs
Within baseline model runs the average time is calculated that passengers spend in retail areas when getting the gate number information during the check-in process.
Within the scenario second run, passengers receive the gate information distributed according the GRT defined in PaxGen between 40 and 5 minutes before departure.
With the different scenario runs it has been evaluated how much time passengers are spending in different areas of the terminal depending on the variation of GRT (40 or 30) and the share of retail passengers. In this context it is interesting how the relation between time spend in retail areas and time spend in gate lounge areas changes.
Table 15: Overview Retail Yield Simulation Scenarios
Scenario Name Description
RY_GRT 90min_40% Retail Yield Baseline with a Gate Reporting Profile in the Interval of 90 until 10 minutes before departure.
RY_GRT 40min_40% Retail Yield Scenario with a Gate Reporting Profile in the Interval of 40 until 5 minutes before departure. 40% Retail passengers are considered for the comparison with the RY_GRT 90min_40% scenario
RY_GRT 40min_60%
RY_GRT 40min_70%
RY_GRT 40min_80%
Variations of the RY_GRT_40min scenario with variations in the number of retail passengers: 60%, 70% and 80%. This investigation is done, to test different assumptions about how many passengers more are animated to shop when waiting within the retail area instead of the gate lounge.
RY_GRT 30min_40% Retail Yield Scenario with a Gate Reporting Profile in the Interval of 30 until 5 minutes before departure. 40% Retail Passengers are considered.
RY_GRT 30min_60%
RY_GRT 30min_70%
RY_GRT 30min_80%
Variations of the RY_GRT_30min scenario with variations in the number of retail passengers: 60%, 70% and 80%. This investigation is done, to test different assumptions about how many passengers more are animated to shop when waiting within the retail area instead of the gate lounges.
RY_CUSS The CUSS scenario model will be run with the settings of the Retail Yield model with the Passenger list of the RY_GRT 40min_40% Scenario with 40% retail passengers.
4.3.5. Specification of Key Performance Indicators
The specification depends upon the questions to be answered: How much more time do passengers spend in the retail area in comparison to the baseline scenario? What is the difference in gate space and time utilisation between baseline and Retail Yield scenario?
To answer the questions the following KPIs have been identified:
• Accumulated time passengers spend in retail area before boarding (increase by x%) considering the whole flight day.
• Accumulated time passengers spend in gate lounges considering the whole flight day. • Number of passengers in retail area and gate lounges per time interval.

CDM Landside Modelling EUROCONTROL
Project APT-ACP - EEC Note No. 12/06 45
4.3.6. Results and Interpretation
The analysis focuses on the time passengers spend in different areas of the terminal, in particular retail and gate areas.
Since the scenario does not affect any control processes, as the retail activity takes place afterwards, no further analysis of service stations need to be executed, because they correspond to the initial baseline scenario.
1. Potential Increase of potential Retail Time from 50% to 200%
Comparing the baseline RY_90min_40% and the RY_40min_40% where a share of 40% of all passengers are retail passengers, the potential retail time increases about 50% (15% compared to 23%). The other passengers are assumed to wait somewhere in the retail area without spending any money.
Assuming that more passengers use the retail facilities and spend money instead of only waiting in the common retail area, the share of retail passengers may increase.
Considering a share of 80% passenger spending money in common retail areas, the potential retail time may increase up to 200%.
RY Scenario Variation in GRT before Departure (30min, 40min)and Variation in Rate of Retail Passengers (40%, 60%, 70%, 80%)
in Retail Area Schengen and NonSchengen
0
200
400
600
800
1,000
1,200
1,400
27/0
8/20
04 0
0:00
27/0
8/20
04 0
1:00
27/0
8/20
04 0
2:00
27/0
8/20
04 0
3:00
27/0
8/20
04 0
4:00
27/0
8/20
04 0
5:00
27/0
8/20
04 0
6:00
27/0
8/20
04 0
7:00
27/0
8/20
04 0
8:00
27/0
8/20
04 0
9:00
27/0
8/20
04 1
0:00
27/0
8/20
04 1
1:00
27/0
8/20
04 1
2:00
27/0
8/20
04 1
3:00
27/0
8/20
04 1
4:00
27/0
8/20
04 1
5:00
27/0
8/20
04 1
6:00
27/0
8/20
04 1
7:00
27/0
8/20
04 1
8:00
27/0
8/20
04 1
9:00
27/0
8/20
04 2
0:00
27/0
8/20
04 2
1:00
27/0
8/20
04 2
2:00
27/0
8/20
04 2
3:00
28/0
8/20
04 0
0:00
Time
Pax
(Per
sonC
ount
)
RY 40min GRT 80% Retail pax
RY 30min GRT 80% Retail pax
RY 40min GRT 70% Retail pax
RY 30min GRT 70% Retail pax
RY 40min GRT 60% Retail pax
RY 30min GRT 60% Retail pax
RY 40min GRT 40% Retail pax
RY 30min GRT 40% Retail pax
RY Baseline 90min GRT 40% Retail pax
RY 80% Retail Pax
RY 70% Retail Pax
RY 60% Retail Pax
RY 40% Retail Pax
Baseline FRA40% Retail Pax
Graph shows number of pax in retail area per time interval for different variations in % share of retail to non-retailing pax.
Comparison to Baseline FRA with 40% share retail pax.
Considering a share of 40% retail pax, the occupation of retail stores increases of 30%.
Considering a share of 80% retail pax, the occupation of retail stores increases by 200%.
Note: There are 2 data series per scenarios (thin line: 30min GRT, thick line: 40min GRT)
Figure 29: Retail Yield Scenario: Increase of Potential Retail Time
In order to compare the shares passengers spend in different areas of the terminal, time is accumulated over the day for all functional areas where passengers spend their time.
In this way a performance indicator can be tested which is set in relation to overall hours spent in the terminal.

EUROCONTROL CDM Landside Modelling
46 Project APT-ACP - EEC Note No. 12/06
RY Scenario Variation in GRT before Departure (30min, 40min)and Variation in Rate of Retail Passengers (40%, 60%, 70%, 80%)
in Retail Area Schengen and NonSchengen
0
1,000
2,000
3,000
4,000
5,000
6,000
7,000
8,000
9,000
10,000
11,000
12,000
27/0
8/20
04 0
0:00
27/0
8/20
04 0
1:00
27/0
8/20
04 0
2:00
27/0
8/20
04 0
3:00
27/0
8/20
04 0
4:00
27/0
8/20
04 0
5:00
27/0
8/20
04 0
6:00
27/0
8/20
04 0
7:00
27/0
8/20
04 0
8:00
27/0
8/20
04 0
9:00
27/0
8/20
04 1
0:00
27/0
8/20
04 1
1:00
27/0
8/20
04 1
2:00
27/0
8/20
04 1
3:00
27/0
8/20
04 1
4:00
27/0
8/20
04 1
5:00
27/0
8/20
04 1
6:00
27/0
8/20
04 1
7:00
27/0
8/20
04 1
8:00
27/0
8/20
04 1
9:00
27/0
8/20
04 2
0:00
27/0
8/20
04 2
1:00
27/0
8/20
04 2
2:00
27/0
8/20
04 2
3:00
28/0
8/20
04 0
0:00
Time
accu
mul
ated
Pax
Ret
ail H
ours
RY 40min GRT 80% Retail pax
RY 30min GRT 80% Retail pax
RY 40min GRT 70% Retail pax
RY 30min GRT 70% Retail pax
RY 40min GRT 60% Retail pax
RY 30min GRT 60% Retail pax
RY 40min GRT 40% Retail pax
RY 30min GRT 40% Retail pax
RY Baseline 90min GRT 40% Retail pax
Figure 30: Retail Yield Scenario: Accumulated Retail Time per scenario variation
Accumulating the time passengers spend in each individual area of the terminal enables an overall comparison of passenger time. The following table shows the evaluation for the different scenarios.
FACILITY BL_1 GRT 90 min RY GRT 40 min RY GRT 30 min
Accumulated PersonCount/day (without GRT) RY_BL_1 RY 40%_1 RY 60% RY 70% RY 80% RY_30min_40% RY_30min_60% RY_30min_70% RY_30min_80%
Check In Hall 17% 17% 17% 17% 17% 17% 17% 17% 17% 17%Security Areas 4% 4% 4% 4% 4% 4% 5% 5% 5% 4% - Security Area Schengen 1% 1% 1% 1% 1% 1% 1% 1% 1% 1% - Security Area NonSchengen 3% 3% 3% 3% 3% 3% 4% 4% 4% 4%
Retail Areas 0% 15% 23% 34% 39% 44% 24% 36% 41% 47% - Retail Schengen 0% 3% 6% 8% 9% 11% 6% 9% 10% 11% - Retail Non Schengen 0% 12% 17% 26% 29% 33% 18% 27% 30% 35%
Airline Business Lounges 0% 5% 6% 6% 6% 6% 6% 6% 6% 6% - Business Lounge Schengen 0% 1% 1% 1% 1% 1% 1% 1% 1% 1% - Business Lounge NonSchengen 0% 4% 5% 5% 5% 5% 5% 5% 5% 5%
Waiting Areas (Pax not shopping) 0% 0% 28% 19% 14% 9% 29% 19% 15% 10% - Waiting Area Schengen 0% 0% 7% 4% 3% 2% 7% 5% 4% 3% - Waiting Area NonSchengen 0% 0% 21% 14% 11% 7% 22% 15% 11% 8%
Gate Lounges 79% 59% 22% 21% 20% 19% 19% 17% 17% 16% - Gate Lounges Schengen 20% 16% 7% 6% 6% 6% 13% 5% 5% 5% - Gate Lounges NonSchengen 59% 43% 15% 14% 14% 13% 6% 12% 12% 11%
Sum Pax Hour in Facilities 100% 100% 100% 100% 100% 100% 100% 100% 100% 100%
Figure 31: Retail Yield Scenario: Comparison Pax Time in % Spent in Different Terminal Areas
The shares are visualised in the following figure with the GRT 40min Scenario compared to the initial baseline as well as to the Retail Yield Scenario baseline.
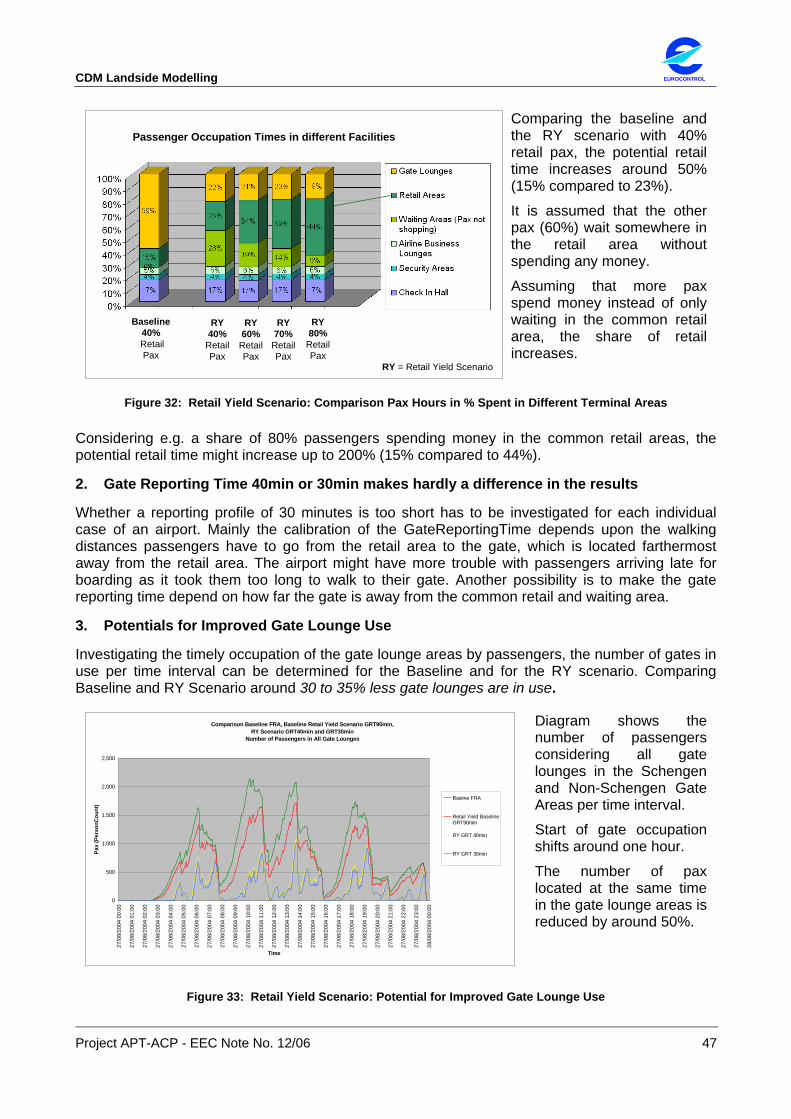
CDM Landside Modelling EUROCONTROL
Project APT-ACP - EEC Note No. 12/06 47
Baseline40%RetailPax
RY40%
Retail Pax
RY70%
Retail Pax
RY80%
Retail Pax
RY60%
Retail Pax
Passenger Occupation Times in different Facilities
RY = Retail Yield Scenario
Comparing the baseline and the RY scenario with 40% retail pax, the potential retail time increases around 50% (15% compared to 23%).
It is assumed that the other pax (60%) wait somewhere in the retail area without spending any money.
Assuming that more pax spend money instead of only waiting in the common retail area, the share of retail increases.
Figure 32: Retail Yield Scenario: Comparison Pax Hours in % Spent in Different Terminal Areas
Considering e.g. a share of 80% passengers spending money in the common retail areas, the potential retail time might increase up to 200% (15% compared to 44%).
2. Gate Reporting Time 40min or 30min makes hardly a difference in the results
Whether a reporting profile of 30 minutes is too short has to be investigated for each individual case of an airport. Mainly the calibration of the GateReportingTime depends upon the walking distances passengers have to go from the retail area to the gate, which is located farthermost away from the retail area. The airport might have more trouble with passengers arriving late for boarding as it took them too long to walk to their gate. Another possibility is to make the gate reporting time depend on how far the gate is away from the common retail and waiting area.
3. Potentials for Improved Gate Lounge Use
Investigating the timely occupation of the gate lounge areas by passengers, the number of gates in use per time interval can be determined for the Baseline and for the RY scenario. Comparing Baseline and RY Scenario around 30 to 35% less gate lounges are in use.
Comparison Baseline FRA, Baseline Retail Yield Scenario GRT90min, RY Scenario GRT40min and GRT30min
Number of Passengers in All Gate Lounges
0
500
1,000
1,500
2,000
2,500
27/0
8/20
04 0
0:00
27/0
8/20
04 0
1:00
27/0
8/20
04 0
2:00
27/0
8/20
04 0
3:00
27/0
8/20
04 0
4:00
27/0
8/20
04 0
5:00
27/0
8/20
04 0
6:00
27/0
8/20
04 0
7:00
27/0
8/20
04 0
8:00
27/0
8/20
04 0
9:00
27/0
8/20
04 1
0:00
27/0
8/20
04 1
1:00
27/0
8/20
04 1
2:00
27/0
8/20
04 1
3:00
27/0
8/20
04 1
4:00
27/0
8/20
04 1
5:00
27/0
8/20
04 1
6:00
27/0
8/20
04 1
7:00
27/0
8/20
04 1
8:00
27/0
8/20
04 1
9:00
27/0
8/20
04 2
0:00
27/0
8/20
04 2
1:00
27/0
8/20
04 2
2:00
27/0
8/20
04 2
3:00
28/0
8/20
04 0
0:00
Time
Pax
(Per
sonC
ount
)
Basline FRA
Retail Yield BaselineGRT90min
RY GRT 40min
RY GRT 30min
Diagram shows the number of passengers considering all gate lounges in the Schengen and Non-Schengen Gate Areas per time interval.
Start of gate occupation shifts around one hour.
The number of pax located at the same time in the gate lounge areas is reduced by around 50%.
Figure 33: Retail Yield Scenario: Potential for Improved Gate Lounge Use

EUROCONTROL CDM Landside Modelling
48 Project APT-ACP - EEC Note No. 12/06
In general aircrafts, occupying stands on the apron limit gate use. The occupation time of the stand is determined by the turnaround time of the aircraft. Nowadays the turnaround time comprised more than one hour to 90 minutes stand occupation. Thus, an empty gate lounge with an occupied stand by an aircraft does not add value.
At least the airport could take advantage and use the gate lounges for holding passengers on a flight where the aircraft is located on a remote position (use the lounge as bus gate lounge). This would be only possible if the gate has a connection to the ground level via a boarding bridge or stairs and to the bus station.
However, when considering that low-cost airlines aim to minimise the turnaround time of their aircraft down to 30 minutes the airport can use the gates that are occupied for around 90 minutes for one flight in general, for 2 flights. And then the retail yield scenario would have a second positive impact through the extra capacity of the gate lounges since passenger will only occupy the gate lounges for the duration of the maximum GateReportingTime (30 or 40 minutes).
4. More increase in Retail Yield: Integration of Retail Yield Scenario with CUSS Scenario
While both scenarios considered each different areas of the terminal, namely the landside of the terminal in the CUSS scenario and the airside of the terminal in the Retail Yield scenario, an integrated view on both scenarios offers an interesting insight.
Baseline40% Retail Pax
Retail Yield40%Retail Pax
With CUSS40%Retail Pax
Combined Retail Yield Scenario with CUSS Scenario
Investigation of a combined scenario with CUSS facilities using the Retail Yield gate reporting time (GRT) concept with 40min GRT and 40% Retail pax.
Result: around 60% check-in time is saved within the Check-in Process. With 40% Retail pax, potential retail time can be increased from 50% up to 80% compared to the Retail Yield scenario. Thus, the Retail Yield can be increased even more. Reason: passengers spend less time for check-in process, the time gain can be used for retailing.
Combined Retail Yield Scenario with CUSS Scenario
Baseline40% Retail Pax
Retail Yield40%Retail Pax
40%Retail Pax
With CUSS
Combined Retail Yield Scenario with CUSS Scenario
Baseline40% Retail Pax
Retail Yield40%Retail Pax
40%Retail Pax
With CUSS
Figure 34: Retail Yield with CUSS Scenario: Passenger Process time in different terminal areas
Combining the Retail Yield Scenario with the CUSS scenario shows that the potential retail yield can be increased even further, because passengers spend less time within the check-in process. This example demonstrates that an airport might even invest in more CUSS service stations than initially required, to serve the traffic with even higher level of service standards for ECO pax (such as 5 to 10 minutes average waiting time in the check-in process). If more CUSS services are installed than necessary, passengers will spend less time waiting in queues thus having more time to go shopping, which contributes to an increased retail yield per se. Thus the airport, airlines, passengers, retail businesses and other related stakeholder can profit from a) the higher throughput which increases reliability of service, b) improved passenger convenience and c) the contribution to an increased retail yield.

CDM Landside Modelling EUROCONTROL
Project APT-ACP - EEC Note No. 12/06 49
Thus, the potential time for retailing is increased, because in general passengers spend less time in the check-in hall.
Within the case of Fraport’s Terminal 2, the total time passenger stay in the check-in hall can be reduced from 17 to 7 percent; 10% more overall passenger time to shop or to spend money somewhere on the airport.
4.3.7. Conclusions
The Retail Yield scenario investigates the potentials for additional time passengers might spend in retail areas when the gate information is announced not with the check-in but only 30 to 40 minutes before departure. The main findings of the analysis are summarised below:
1. Increase of potential Retail Time from 50% up to 200%
The potential retail time increases from 50% up to 200% depending on the assumed share of passengers animated to spend their free time after check-in the retail area and spend money.
2. Gate Reporting Time 40min or 30 min hardly shows difference in potential retail time
The Gate Reporting Time (GRT) has been investigated for two cases: 30 minutes and 40 minutes before departure. Both scenarios indicated a big difference in increased retail time compared to the Retail Yield Baseline scenario where the gate information is announced during check-in already. The comparison of the variations of the GRT parameter 30 min. and 40 min. did not show a large impact on the retail time.
3. Potentials for Additional Gate Use
Comparing the number of gates in use between Retail Yield Baseline and the Retail Yield GRT 40 min scenario demonstrates the potentials for additional use of the gate lounges. Gate lounges for instance can be used as gate lounge for bus gates.
When considering the trends of low cost airlines with their aim to minimise turn around times down to 30 minutes, the potential of additional gate use gets more realistic. Gate Lounges could be used more effectively, since the traditionally 90 to 60 minute gate utilisation time can be reduced to 30 or 40 minutes. A further investigation in cooperation with airside experts is recommended to get an integral view on the potentials.
When interpreting the results of the Retail Yield scenario it has to be kept in mind that the results depend highly on the traffic structure and the reporting profiles that determine the distribution of passengers entering the terminal for check-in as well as on the assumed share of retail passengers.
4. Further Increase of Retail Potentials in Combination with CUSS Scenario
The simulation runs of the retail Yield and the CUSS scenario have demonstrated, that the potential retail time can even be further increased when assuming that more and more passengers use self-service facilities an the Internet for check-in. Assuming the reporting profiles will stay similar to what they are today, the increased throughput of passengers through the check-in process may lead to passengers spending even more time in the retail areas, because they have an additional time gain. The proportion of time passengers spend in the check-in is reduced from 17% down to 7% of overall process time.
EUROCONTROL CDM Landside Modelling
50 Project APT-ACP - EEC Note No. 12/06
4.4. LATE PASSENGER SCENARIO
4.4.1. Scenario Description and Objective
Whilst the CUSS-Internet and the Retail Yield scenario have concentrated on the investigation of current trends in changes of the passenger handling process, as increased self service automation within the check-in process as well as on concepts of airports introducing measures to increase the retail yield, the Late Passenger Scenario focuses on the investigation of “aircraft ready time” when boarding is completed and the aircraft is ready for off-block to depart from the airport.
During the daily airport operations all the involved stakeholders have to deal with flight delays which means a shift in aircraft ready for off-block time and/or ready for take-off time. The consequence is a permanent abolishment and adaptation of planned activities on short notice regarding e.g. gate and stand allocation, slot allocation, and airspace allocation of aircraft. Flight delays have a negative impact on the efficiency of the airport and on airspace capacity because the optimal planning and real time control of resources is disturbed.
The EEC is conducting research on how to improve the efficiency of air traffic control. Within the CDM research it has been identified that an improved predictability of aircraft-ready-time at the airport would help to improve air traffic control operations, because a better ad-hoc planning base would be available. At the airport, flight delays can have several reasons, on the airside and on the landside of the airport and are difficult to predict since they often arise from interrelated contingencies. Reasons could be late passengers, e.g. caused through capacity constraints in the infrastructure or staff shortages (congestions and delays at service stations) or through traffic jams or train delays when passengers try to access the airport. On the airside of the airport, flight delays may also occur due to capacity constraints in ground handling resources and through congestions on the apron, taxiway or the runway system itself.
Focussing on the passenger terminal as the interface between landside and airside, the predictability of aircraft ready time is related to the question whether all passengers arrive in time at the gate for boarding and thus enable a punctual off-block of the aircraft.
The objective of the scenario is to investigate the interrelation of different factors that have a negative or positive impact on the handling of late passengers arriving at the gate, thus creating flight delays. Measures are investigated that should help to minimise the impact of late passengers.
The following exercises have been performed within the scenario investigation process:7
Exercise A - Passengers on time at the airport (BL = Baseline)
Exercise B - Passengers being late at the airport (LP = Late Pax)
Exercise C - Fast track / priority handling of late passengers (with variations of increased self-service check-in)
(FT = Fast Track) (CU = CUSS)
Exercise D - Increased Traffic Demand (T = Traffic Increase)
Exercise A represents the Baseline for the Late Passenger Scenario the other exercises are compared with.
7 Please note: the abbreviations BL, LP_, FT_, CU_ and T_) are used to define the names for the simulation runs

CDM Landside Modelling EUROCONTROL
Project APT-ACP - EEC Note No. 12/06 51
Exercise B investigates the effects of late passengers in the terminal without any changes to the baseline simulation model but with passengers arriving later at the airport than in the baseline. Variations of the shift in time are represented by modified reporting profiles shifted by 5, 10 and 15 minutes.
Exercise C is concerned with a measure, where the “fist-come-first-serve principle” is abandoned and late passengers get priority handling at dedicated Fast Track check-in and security control to minimise the effect of late passengers arriving late at their gate for boarding.
In addition, variations of exercise C investigate the impact on the throughput of passengers by self-service check-in via Internet and CUSS kiosks considering variations in the share of passengers using such self-service facilities (50%, 70% and 90%).
Exercise D investigates the impact of higher traffic demand on the terminal system to simulate capacity constraints. Within this scenario exercise traffic demand is increased by 30% and 50% to research the impact on flight delays and facility needs under increased demand.
4.4.2. Scenario Assumptions
Flight delays occur due to manifold reasons, which rather result from airside issues like airspace, runway, taxiway capacity limitations and ground servicing problems, than through late passengers. Although the experts from Frankfurt Airport (reference airport) share the opinion that late passengers are not to be regarded as critical, this scenario focuses on the investigation of the impact of delayed passengers on flight delays.
The most important deviation to the before described scenarios is the shifting of the reporting profiles of the passengers. The late passenger scenario investigates the impact of reporting profiles shifted 5, 10, and 15 minutes towards STD (see input data of reporting profile, page 55).
In preparation of the conduction of the late passenger scenario exercises additional rules and parameters have been determined, which are relevant for all exercises. This affects in detail:
• Rejecting passengers to check-in. • Investigation of walking times from check-in to gate in relation to passenger delay. • Definition of final influence of late passengers on flight delays.
Rejection of passengers for check-in
In general check-in counters are closed 30 minutes before scheduled time of departure (STD) at Frankfurt Airport. Passengers arriving later are rejected for check-in or depend on the “good will” of the airline. Frankfurt Airport provides fast track facilities for CIP passengers who may be also used by late passengers. But even when late passengers can use these facilities, a minimum time remains to proceed through the security and passport processes and to walk to the gate.
This minimum time remaining is declared 20 min before STD for contact gates and 25 min before STD for remote/bus gates at Frankfurt Airport. Passengers arriving later are definitely rejected to check-in.
Investigation of a threshold value for walking times from check-in to gate
Another preparing investigation concerns the pure transaction times at service stations (check-in, security, passport control) PLUS the walking times from check-in to the gate, i.e. time from check-in to boarding completed without any waiting times in queues.
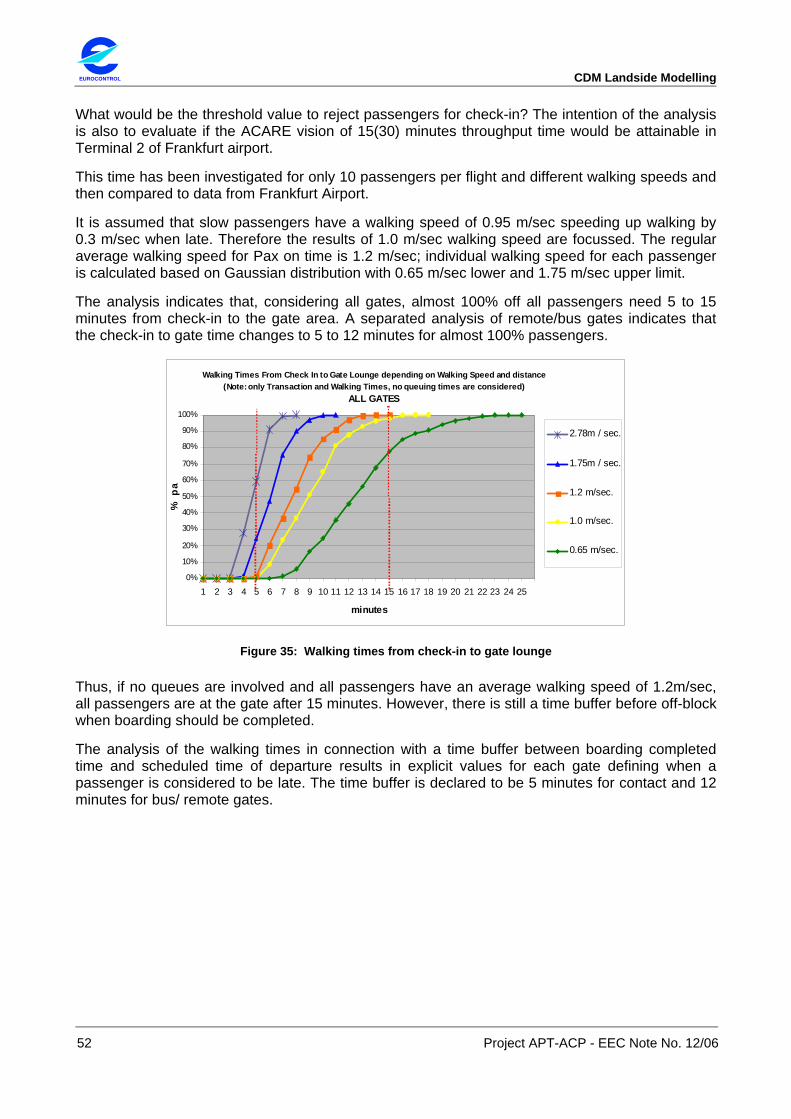
EUROCONTROL CDM Landside Modelling
52 Project APT-ACP - EEC Note No. 12/06
What would be the threshold value to reject passengers for check-in? The intention of the analysis is also to evaluate if the ACARE vision of 15(30) minutes throughput time would be attainable in Terminal 2 of Frankfurt airport.
This time has been investigated for only 10 passengers per flight and different walking speeds and then compared to data from Frankfurt Airport.
It is assumed that slow passengers have a walking speed of 0.95 m/sec speeding up walking by 0.3 m/sec when late. Therefore the results of 1.0 m/sec walking speed are focussed. The regular average walking speed for Pax on time is 1.2 m/sec; individual walking speed for each passenger is calculated based on Gaussian distribution with 0.65 m/sec lower and 1.75 m/sec upper limit.
The analysis indicates that, considering all gates, almost 100% off all passengers need 5 to 15 minutes from check-in to the gate area. A separated analysis of remote/bus gates indicates that the check-in to gate time changes to 5 to 12 minutes for almost 100% passengers.
Walking Times From Check In to Gate Lounge depending on Walking Speed and distance(Note: only Transaction and Walking Times, no queuing times are considered)
ALL GATES
0%
10%
20%
30%
40%
50%
60%
70%
80%
90%
100%
1 2 3 4 5 6 7 8 9 10 11 12 13 14 15 16 17 18 19 20 21 22 23 24 25
minutes
% p
ax
2.78m / sec.
1.75m / sec.
1.2 m/sec.
1.0 m/sec.
0.65 m/sec.
Figure 35: Walking times from check-in to gate lounge
Thus, if no queues are involved and all passengers have an average walking speed of 1.2m/sec, all passengers are at the gate after 15 minutes. However, there is still a time buffer before off-block when boarding should be completed.
The analysis of the walking times in connection with a time buffer between boarding completed time and scheduled time of departure results in explicit values for each gate defining when a passenger is considered to be late. The time buffer is declared to be 5 minutes for contact and 12 minutes for bus/ remote gates.
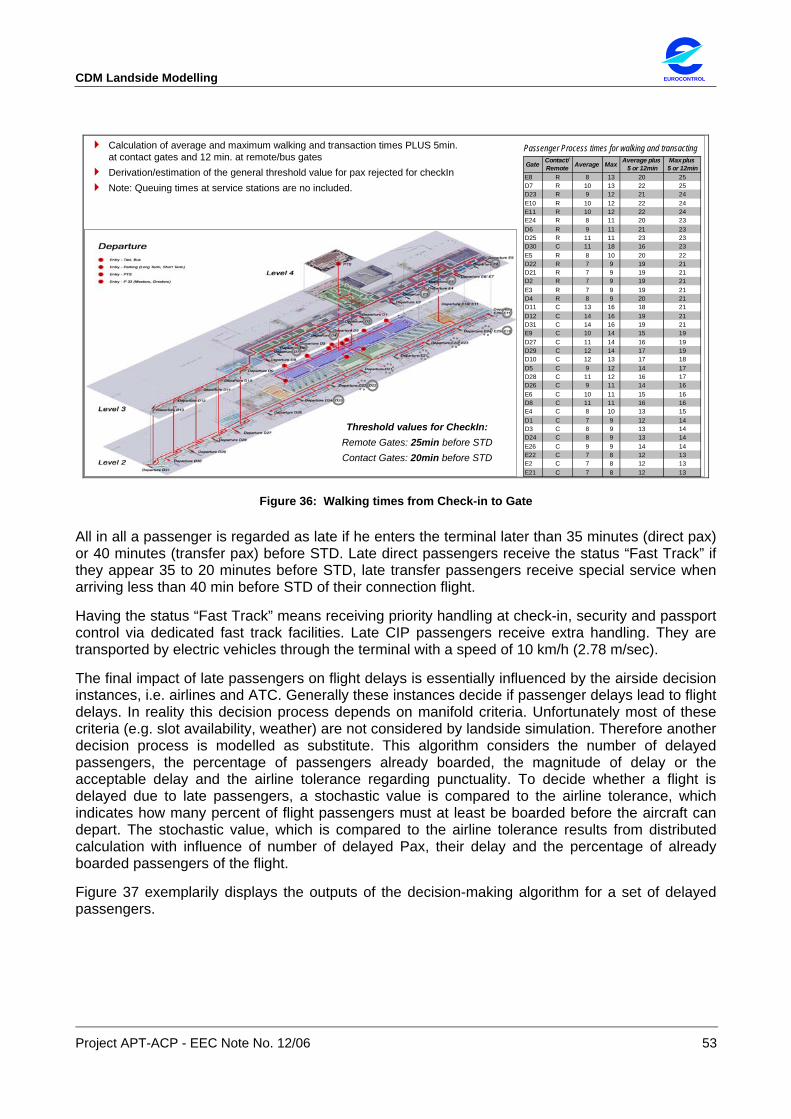
CDM Landside Modelling EUROCONTROL
Project APT-ACP - EEC Note No. 12/06 53
Calculation of average and maximum walking and transaction times PLUS 5min. at contact gates and 12 min. at remote/bus gatesDerivation/estimation of the general threshold value for pax rejected for checkInNote: Queuing times at service stations are no included.
Gate Contact/ Remote Average Max Average plus
5 or 12minMax plus
5 or 12minE8 R 8 13 20 25D7 R 10 13 22 25D23 R 9 12 21 24E10 R 10 12 22 24E11 R 10 12 22 24E24 R 8 11 20 23D6 R 9 11 21 23D25 R 11 11 23 23D30 C 11 18 16 23E5 R 8 10 20 22D22 R 7 9 19 21D21 R 7 9 19 21D2 R 7 9 19 21E3 R 7 9 19 21D4 R 8 9 20 21D11 C 13 16 18 21D12 C 14 16 19 21D31 C 14 16 19 21E9 C 10 14 15 19D27 C 11 14 16 19D29 C 12 14 17 19D10 C 12 13 17 18D5 C 9 12 14 17D28 C 11 12 16 17D26 C 9 11 14 16E6 C 10 11 15 16D8 C 11 11 16 16E4 C 8 10 13 15D1 C 7 9 12 14D3 C 8 9 13 14D24 C 8 9 13 14E26 C 9 9 14 14E22 C 7 8 12 13E2 C 7 8 12 13E21 C 7 8 12 13
Threshold values for CheckIn:Remote Gates: 25min before STDContact Gates: 20min before STD
Passenger Process times for walking and transacting
Figure 36: Walking times from Check-in to Gate
All in all a passenger is regarded as late if he enters the terminal later than 35 minutes (direct pax) or 40 minutes (transfer pax) before STD. Late direct passengers receive the status “Fast Track” if they appear 35 to 20 minutes before STD, late transfer passengers receive special service when arriving less than 40 min before STD of their connection flight.
Having the status “Fast Track” means receiving priority handling at check-in, security and passport control via dedicated fast track facilities. Late CIP passengers receive extra handling. They are transported by electric vehicles through the terminal with a speed of 10 km/h (2.78 m/sec).
The final impact of late passengers on flight delays is essentially influenced by the airside decision instances, i.e. airlines and ATC. Generally these instances decide if passenger delays lead to flight delays. In reality this decision process depends on manifold criteria. Unfortunately most of these criteria (e.g. slot availability, weather) are not considered by landside simulation. Therefore another decision process is modelled as substitute. This algorithm considers the number of delayed passengers, the percentage of passengers already boarded, the magnitude of delay or the acceptable delay and the airline tolerance regarding punctuality. To decide whether a flight is delayed due to late passengers, a stochastic value is compared to the airline tolerance, which indicates how many percent of flight passengers must at least be boarded before the aircraft can depart. The stochastic value, which is compared to the airline tolerance results from distributed calculation with influence of number of delayed Pax, their delay and the percentage of already boarded passengers of the flight.
Figure 37 exemplarily displays the outputs of the decision-making algorithm for a set of delayed passengers.

EUROCONTROL CDM Landside Modelling
54 Project APT-ACP - EEC Note No. 12/06
Waiting Probability for Late Pax
0.00
0.20
0.40
0.60
0.80
1.00
1.20
0.00 2.00 4.00 6.00 8.00 10.00 12.00 14.00 16.00 18.00 20.00 22.00 24.00
Flight Delay [min]
Pro
babi
lity
1 pax2 pax3 pax4 pax5 pax
for Not
Wai
ting
mbe
rs o
f Lat
e P
asfo
r di
ffere
nt N
us
6 pax7 pax8 pax9 pax10 pax11 pax12 pax13 pax14 pax15 pax16 pax17 pax18 pax19 pax20 pax21 pax22 pax23 pax24 pax25 pax26 pax27 pax28 pax29 pax30 paxTOLERANCE
Airline Tolerance = 0.9Passengers waited for
Passengers not waited for
Figure 37: Interrelation of number of delayed passengers in combination with airline tolerance
The described parameters build an essential baseline for all exercises of the late passenger scenario and also the main influence on CDM.
4.4.3. Input Data
4.4.3.1. Terminal Layout
Exercise A and B: terminal layout as in the initial baseline.
Exercise C: with the introduction of CUSS check-in and Internet check-in, the terminal has been equipped with additional CUSS kiosks and bagdrop stations.
4.4.3.2. Passenger Properties
Entry Reporting Profiles:
New Entry reporting profiles are applicable to all exercises, where late passengers are considered (B, C, and D).
The change of Reporting Profiles for passengers’ entry time is done in the passenger generation tool PaxGen. The distributions are set for each market group, shifted by 5, 10 and 15 minutes (3 different PaxGen-Scenarios). Also the distribution of transfer passengers from the baseline is shifted by these times. Figure 38 shows the shifts between baseline and Late Passenger Reporting Profiles for the 15-minute shift.

CDM Landside Modelling EUROCONTROL
Project APT-ACP - EEC Note No. 12/06 55
Figure 38: Late Pax Scenario: Shift in reporting Profile by 15 min
Check-in Type: Table 16: Late Pax Scenario: Exercise C: Variations of check-in types for CUSS and Internet Check-in
For exercise C the share of the check-in types varies from staffed flight check-in to 50%, 70%, 90% check-in automation.
For exercise D only the share of 50% check-in automation has been investigated.
For each variation new passenger lists are generated.
Shares have been defined as followed:
All ECO CIP50% Automation 50.0% 55.0% 20.0%
CUSS 31.2% 34.4% 12.5% Internet 18.8% 20.6% 7.5%
50% Staffed 50.0% 45.0% 80.0%
All ECO CIP70% Automation 70.0% 78.1% 20.0%
CUSS 43.8% 48.8% 12.5% Internet 26.2% 29.3% 7.5%
30% Staffed 30.0% 21.9% 80.0%
All ECO CIP90% Automation 90.0% 96.5% 50.0%
CUSS 56.2% 60.3% 31.3% Internet 33.8% 36.2% 18.8%
10% Staffed 10.0% 3.5% 50.0%
50% Automation
70% Automation
90% Automation
4.4.3.3. Service Transaction Times
Generally the transaction times from the baseline scenario are maintained.
Also the fast track facilities for dedicated late passenger check-in, security and passport control have the same transaction times as the regular services.
For Exercise C the CUSS and bagdrop facilities have the following transaction times:
Table 17: Late Pax Scenario: Exercise C: Transaction Times for different Check-In Types
check-in Type Transaction time
CUSS check-in 120 sec
Bagdrop 80 sec

EUROCONTROL CDM Landside Modelling
56 Project APT-ACP - EEC Note No. 12/06
4.4.3.4. Service Allocation Rules
To maintain the level of service as applied in the baseline scenario, the required number of facilities has been determined for each variation in the examples through accompanying simulation tests. As the number of facilities varies from exercise to exercise, it is mentioned at the respective stage.
For fast track facilities the following rules have been defined:
Table 18: Level of Service Criteria for Security, Passport and Immigration Control
Service MaxQueueLength [pax]
Check-In 2
Security Control 2
Passport Control 2
4.4.3.5. Flight Schedule
The same flight schedule as in the baseline is used. Since the Late Passenger Scenario only considers departure processes, the passenger generation considers only the departing flights from which passengers are generated.
For Exercise D, two additional flight schedules have been prepared with a linear increase of passenger loads of 30% and 50%. Larger aircraft sizes and higher seat load factors have been assumed.
4.4.3.6. Passenger Process Definition
As displayed in Figure 39, for exercise A and B the passenger initial baseline process definition is changed in respect to three aspects:
• Passengers are rejected for check-in when they arrive later than 30 minutes before STD.
• Late passengers are identified at the gate control if they are still on time. If not they are rejected to board.
• For exercise C (see Figure 41) the changes to the baseline process definition are:
• Late passengers may use fast track facilities if they arrive between 35 and 20(25) minutes before STD.
• If passengers become late during the check-in process, they are also allowed to use fast track facilities at security control and passport control.
• Transfer passengers are regarded as late when they enter the terminal later than 40 minutes before STD. In case the transfer process involves security and/or passport control checks, the transfer passenger may use fast track facilities.
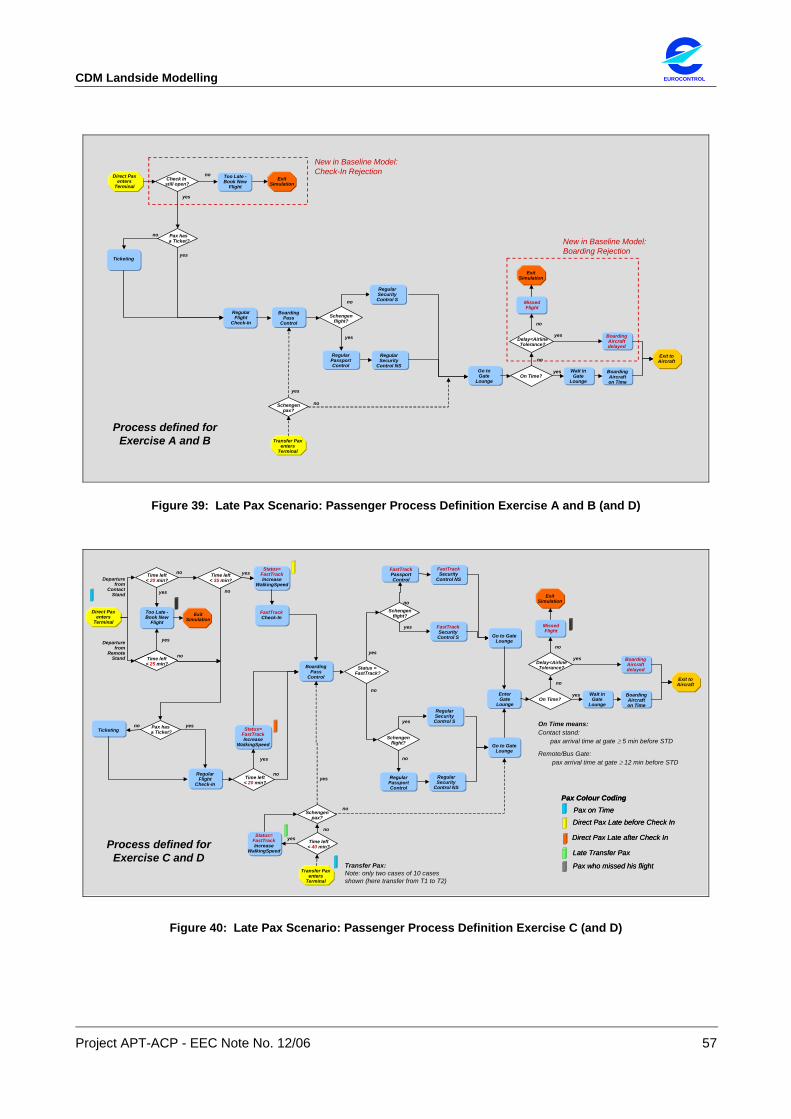
CDM Landside Modelling EUROCONTROL
Project APT-ACP - EEC Note No. 12/06 57
RegularFlight
Check-In
BoardingPass
Control
Ticketing
Pax hasa Ticket?
yes
no
Direct Pax enters
Terminal
Exit toAircraft
Schengen pax?
Transfer Pax enters
Terminal
Too Late -Book New
FlightCheck In still open?
yes
noExit
Simulation
Schengen flight?
yes
no
Regular Security Control S
Regular Security
Control NS
RegularPassport Control
Go to Gate
LoungeOn Time?
Delay<AirlineTolerance?
no
no
Missed Flight
Exit Simulation
Boarding Aircraft delayed
Boarding Aircraft on Time
yes
yes
New in Baseline Model: Check-In Rejection
New in Baseline Model: Boarding Rejection
Wait in Gate
Lounge
no
yes
Process defined for Exercise A and B
Figure 39: Late Pax Scenario: Passenger Process Definition Exercise A and B (and D)
RegularFlight
Check-In
BoardingPass
Control
Ticketing Pax hasa Ticket?
yesno
Direct Pax enters
Terminal
Schengen flight?
yes
no
FastTrackSecurity Control S
FastTrackSecurity
Control NS
FastTrackPassport Control
Exit toAircraft
Schengen pax?
Transfer Pax enters
Terminal
Too Late -Book New
Flight
Ti left?
me< 20 min
yes
no
Exit Simulation
Ti left?
me< 35 min
Status= FastTrackIncrease
WalkingSpeed
FastTrack
no
yes
Check-In
Ti left?
me< 20 min
Status= FastTrackIncrease
WalkingSpeed
no
yes
no
yes
Status =FastTrack?
Schengen flight?
yes
no
Regular Security Control S
Regular Security
Control NS
RegularPassport Control
Enter Gate
LoungeOn Time?
Delay<AirlineTolerance?
no
no
Missed Flight
Exit Simulation
Boarding Aircraft delayed
Boarding Aircraft on Time
yes
yes Wait in Gate
Lounge
Departure from
RemoteStand
Departure from
ContactStand
Go to GateLoungeyes
noTim leftn?
e< 25 miTim left
n?e
< 25 mi
Go to GateLounge
Tim leftn?
e< 40 mi
Status= FastTrackIncrease
WalkingSpeed
no
yes
no
yes
Pax on Time
Direct Pax Late before Check In
Direct Pax Late after Check In
Late Transfer Pax
Pax Colour CodingPax on Time
Direct Pax Late before Check In
Direct Pax Late after Check In
Late Transfer Pax
Pax Colour Coding
Pax who missed his flightPax who missed his flightTransfer Pax: Note: only two cases of 10 cases shown (here transfer from T1 to T2)
On Time means:Contact stand:
pax arrival time at gate ≥ 5 min before STD
Remote/Bus Gate: pax arrival time at gate ≥ 12 min before STD
Process defined for Exercise C and D
Figure 40: Late Pax Scenario: Passenger Process Definition Exercise C (and D)

EUROCONTROL CDM Landside Modelling
58 Project APT-ACP - EEC Note No. 12/06
4.4.4. Specification of Key Performance Indicators
According to the objective of this scenario, the main key performance indicator is the flight delay that results from the passenger boarding delays. Additional performance indicators are:
• Passenger throughput times from check-in to gate area (average, max, min). • Average Boarding Delay. • Number of stations required to satisfy demand.
4.4.5. Simulation Runs
The Table 19 provides an overview of the scenarios variations run for the Late Passenger Scenario.
Table 19: Late Pax Scenario: Overview of Scenario Names for Simulation Runs
ID Scenario Name Description Considered in Exercise
BL BASELINE All Pax are on time in the Terminal (Entry Reporting Time Profile as in FRA Baseline)
BL Baseline Run for Comparison A
LP Late Pax Model runs with shifted entry times (other PaxGen lists than in the baseline).If time until STD <30min: passengers are rejected at check-in (Exception LP_W_R Scenario). No FastTrack Facilities are provided.
LP_5m 5min shifted Entry Profile B
LP_10m 10min shifted Entry Time B
LP_15m 15min shifted Entry Time, without restriction for check-in counter closing 30min. before STD B
LP_15m_W_R15min shifted Passengers' Entry Time, without any restriction of check-in time.All Pax can check-in nonetheless how late they are (W_R = Without Restriction).The scenario is only relevant for the evaluation of delays caused through late passengers.
B
LP_15m_T30% With 15min shift in Passengers' Entry Time and 30% increased traffic volume D
LP_15m_T50% With 15min shift in Passengers' Entry Time and 50% increased traffic volume D
FT FAST TRACKModel runs with shifted entry times (same PaxGen lists as in Late Pax scenario)FAST TRACK facilities are provided, but only for passengers with left time until STD > 20(25) minutes at Contact (Remote) Gates.( Exception FT_W_R Scenario)
FT_5m FAST TRACK with 5min shifted Passengers' Entry Time C
FT_10m FAST TRACK with 10min shifted Passengers' Entry Time C
FT_15m FAST TRACK with 15min shifted Passengers' Entry Time C
FT_15m_W_RFAST TRACK with 15min shifted Passengers' Entry Time, without any restriction of check-in time.All Pax can check-in nonetheless how late they are (W_R = Without Restriction).The scenario is only relevant for the evaluation of delays caused through late passengers.
C
FT_15m_T30% FAST TRACK with 15min shift in Passengers' Entry Time and 30% increased traffic volume D
FT_15m_T50% FAST TRACK with 15min shift in Passengers' Entry Time and 50% increased traffic volume D
CU CUSS and Fast TrackModel runs with shifted entry times of 15min and with check-in automation (3 ifferent PaxGen lists)Variations of FAST TRACK scenario with increased share of check-in automation via CUSS and Internet (share of automation: 50%, 70% and 90% ).
CU_50 FAST TRACK with 15min shift in Passengers' Entry Time and 50% share of CUSS/Internet check-in C
CU_70 FAST TRACK with 15min shift in Passengers' Entry Time and 70% share of CUSS/Internet check-in C
CU_90 FAST TRACK with 15min shift in Passengers' Entry Time and 90% share of CUSS/Internet check-in C
CU_50_T30% FAST TRACK with 15min shift in Passengers' Entry Time, 50% share of CUSS/Internet check-in,and 30% increased traffic volume D
CU_50_T50% FAST TRACK with 15min shift in Passengers' Entry Time, 50% share of CUSS/Internet check-in,and 50% increased traffic volume D
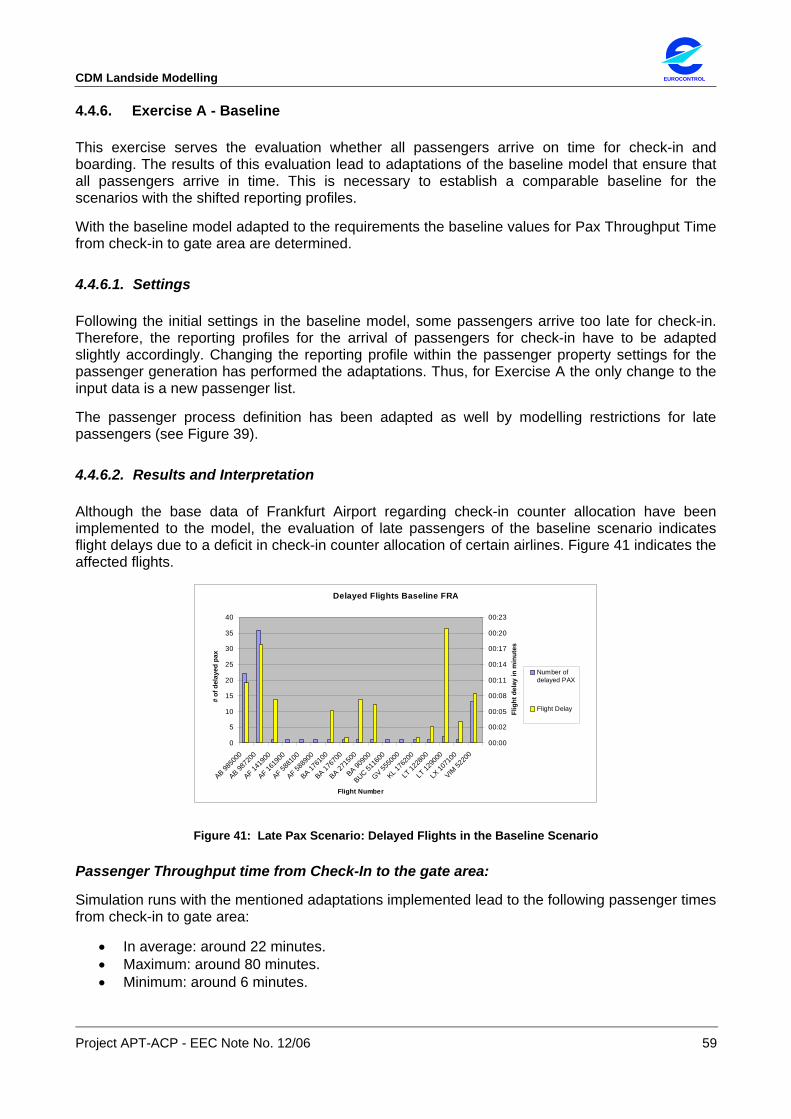
CDM Landside Modelling EUROCONTROL
Project APT-ACP - EEC Note No. 12/06 59
4.4.6. Exercise A - Baseline
This exercise serves the evaluation whether all passengers arrive on time for check-in and boarding. The results of this evaluation lead to adaptations of the baseline model that ensure that all passengers arrive in time. This is necessary to establish a comparable baseline for the scenarios with the shifted reporting profiles.
With the baseline model adapted to the requirements the baseline values for Pax Throughput Time from check-in to gate area are determined.
4.4.6.1. Settings
Following the initial settings in the baseline model, some passengers arrive too late for check-in. Therefore, the reporting profiles for the arrival of passengers for check-in have to be adapted slightly accordingly. Changing the reporting profile within the passenger property settings for the passenger generation has performed the adaptations. Thus, for Exercise A the only change to the input data is a new passenger list.
The passenger process definition has been adapted as well by modelling restrictions for late passengers (see Figure 39).
4.4.6.2. Results and Interpretation
Although the base data of Frankfurt Airport regarding check-in counter allocation have been implemented to the model, the evaluation of late passengers of the baseline scenario indicates flight delays due to a deficit in check-in counter allocation of certain airlines. Figure 41 indicates the affected flights.
Delayed Flights Baseline FRA
0
5
10
15
20
25
30
35
40
AB 9850
00
AB 9872
00
AF 1419
00
AF 1619
00
AF 5881
00
AF 5889
00
BA 1761
00
BA 1767
00
BA 2715
00
BA 9090
0
BUC 5116
00
GV 5550
00
KL 176
200
LT 12
2800
LT 12
9000
LX 10
7100
VIM 52
200
Flight Number
# of
del
ayed
pax
00:00
00:02
00:05
00:08
00:11
00:14
00:17
00:20
00:23
Flig
ht d
elay
in m
inut
es
Number ofdelayed PAX
Flight Delay
Figure 41: Late Pax Scenario: Delayed Flights in the Baseline Scenario
Passenger Throughput time from Check-In to the gate area:
Simulation runs with the mentioned adaptations implemented lead to the following passenger times from check-in to gate area:
• In average: around 22 minutes. • Maximum: around 80 minutes. • Minimum: around 6 minutes.

EUROCONTROL CDM Landside Modelling
60 Project APT-ACP - EEC Note No. 12/06
The calculation involves all departing passengers over the day. The minimum value has been observed for passengers arriving at the airport during day times when the terminal is relatively empty. These passengers arrive before the check-in counter opened and are boarded on the Schengen-Level at a gate with low walking distances. Thus, these pax are the first being handled without queuing and also passing control stations without queuing.
Maximum throughput times have been observed for passengers being served during traffic peaks and mainly on some international or charter flights with a low level of service regarding waiting times.
The average value seems small, but considering the fact, that Terminal T2 has a good level of service, longer queues only develop during traffic peaks in the terminal during a limited time on the day. The long walking distances and the short walking distances to gate areas are smoothened through the analysis.
4.4.6.3. Conclusions
Based on the results of the investigation of the baseline scenario, the check-in counter allocation has been adapted in discussion with Frankfurt Airport to calibrate the baseline model for the succeeding exercises. Specifically the opening times of flight check-in counters of some flights have been adapted, because they were not opened long enough to handle all passengers on time.
The minor adaptations concerning check-in counter service times do not noteworthy influence the common key performance indicators like check-in hall utilisation and level of service of control facilities.
4.4.7. Exercise B – Late Passengers
This Exercise B evaluates the influences of shifted passenger entry times on passenger handling services and finally on flight delays. Therefore the number of delayed flights is regarded in connection with delayed passenger arrivals in the gate lounges that result from shifting the entry times and resulting influences along the process chain.
4.4.7.1. Settings
All gate control services have been extended by a condition that checks if a passenger arrived on time for boarding or not. Boarding from a contact gate position is still possible 5 minutes before departure time and from a remote gate position 12 minutes before departure time.
All passengers arriving later are logged and the post processing of the simulation analyses how many passengers arrived too late for boarding. In addition, the potential delay is calculated assuming the aircraft waits for late passengers.
It is assumed that passengers arrive later than in the baseline in the terminal for check-in. The reporting profiles have been shifted accordingly (see input data Figure 38). All time intervals of the initial reporting profiles have been shifted for the variation of 5, 10 and 15 minutes later. For each variation passenger lists are generated.
The analysis of the three lists shows that only a small proportion of passengers is delayed in relation to all passengers. Large shares of the late passengers are transfer passengers. There are more transfer passengers with an entry time close to STD due to the distribution defined in the Frankfurt Airport input data for transfer passengers. Figure 42 indicates the distribution of the late passengers.
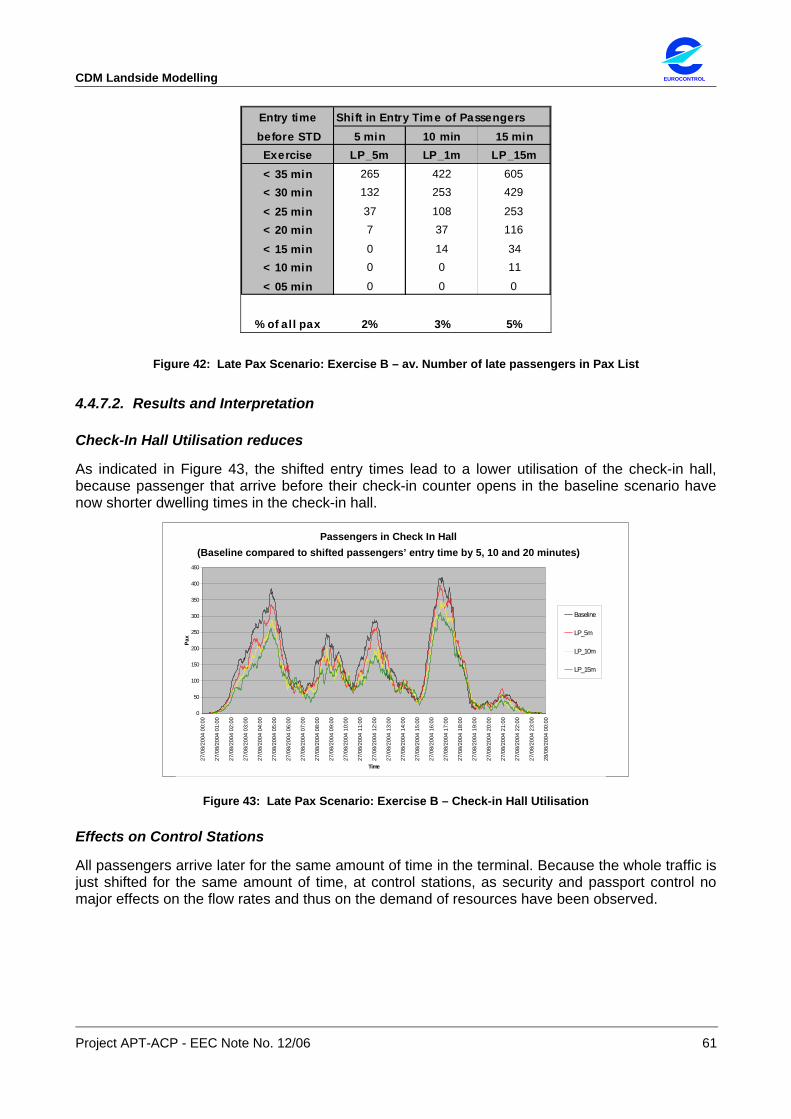
CDM Landside Modelling EUROCONTROL
Project APT-ACP - EEC Note No. 12/06 61
Entry time Shift in Entry Time of Passengers before STD 5 min 10 min 15 min
Exercise LP_5m LP_1m LP_15m< 35 min 265 422 605< 30 min 132 253 429
< 25 min 37 108 253< 20 min 7 37 116
< 15 min 0 14 34< 10 min 0 0 11
< 05 min 0 0 0
% of all pax 2% 3% 5%
Figure 42: Late Pax Scenario: Exercise B – av. Number of late passengers in Pax List
4.4.7.2. Results and Interpretation
Check-In Hall Utilisation reduces
As indicated in Figure 43, the shifted entry times lead to a lower utilisation of the check-in hall, because passenger that arrive before their check-in counter opens in the baseline scenario have now shorter dwelling times in the check-in hall.
Passengers in the Check In Hall(Baseline compared to shifted arrival profiles by 5, 10 and 20 minutes)
0
50
100
150
200
250
300
350
400
450
27/0
8/20
04 0
0:00
27/0
8/20
04 0
1:00
27/0
8/20
04 0
2:00
27/0
8/20
04 0
3:00
27/0
8/20
04 0
4:00
27/0
8/20
04 0
5:00
27/0
8/20
04 0
6:00
27/0
8/20
04 0
7:00
27/0
8/20
04 0
8:00
27/0
8/20
04 0
9:00
27/0
8/20
04 1
0:00
27/0
8/20
04 1
1:00
27/0
8/20
04 1
2:00
27/0
8/20
04 1
3:00
27/0
8/20
04 1
4:00
27/0
8/20
04 1
5:00
27/0
8/20
04 1
6:00
27/0
8/20
04 1
7:00
27/0
8/20
04 1
8:00
27/0
8/20
04 1
9:00
27/0
8/20
04 2
0:00
27/0
8/20
04 2
1:00
27/0
8/20
04 2
2:00
27/0
8/20
04 2
3:00
28/0
8/20
04 0
0:00
Time
Pax
Baseline
LP_5m
LP_10m
LP_15m
Passengers in Check In Hall(Baseline compared to shifted passengers’ entry time by 5, 10 and 20 minutes)
Figure 43: Late Pax Scenario: Exercise B – Check-in Hall Utilisation
Effects on Control Stations
All passengers arrive later for the same amount of time in the terminal. Because the whole traffic is just shifted for the same amount of time, at control stations, as security and passport control no major effects on the flow rates and thus on the demand of resources have been observed.

EUROCONTROL CDM Landside Modelling
62 Project APT-ACP - EEC Note No. 12/06
Passenger Throughput Times decreases
The simulations of exercise B show that the minimum throughput time does not mentionable deviate from the baseline scenario. This value balances around 6 minutes.
The maximum throughput time reduces successively depending on how late the passengers arrive. Passengers arriving according to the 5 minute shifted reporting profile have an average throughput time reduced by 8%. The 10 minutes shifted reporting profiles leads to 20% and the 15 minutes shifted profiles leads to 30% reduction of throughput times.
Obviously the maximum dwelling times correlate to the reporting time shift, thus it is apparent that a shift of entry times of this low magnitude does not essentially influence the common key performance indicators like level of service of control facilities.
Passenger Times from Check In to Gate Area
0:000:100:200:300:400:501:001:101:20
Baseline LP_5m LP_10m LP_15m
Exercises
min
max
av
Passenger Throughput Times from Check In to Gate Area(Shifted entry times by 5, 10, 15min))
Figure 44: Late Pax Scenario: Exercise B – Passenger Throughput Times
As indicated in Figure 45, the average passenger throughput times decrease up to 5% from baseline to the scenario with a shift of entry times of 15 minutes.
This results from the fact that passengers arrive later at the airport and spend in average less time in the check-in hall waiting at check-in.
Almost no Flight Delays because of Rejection of Late Passengers for Check-In
The shift of the reporting profile does not produce mentionable flight delays due to direct passengers, because of the restricting policy of this scenario of rejecting late passengers to check-in that arrived later than 30 minutes before STD. The number of rejected passengers at check-in increases with the increased entry time shift, due to the increase of passengers that are identified to be late.
The reporting profiles are shifted too few to have a large impact on flight delays. The measured effects on flight delays have been less than 1%. Only transfer passengers create slight flight delays for the 10 and 15 min shift in entry time.
Another influence concerns the rejections to check-in.
An additional simulation run (LP_15m_W_R) where the restrictive policy of rejecting passengers for check-in arriving later than 30 min before STD demonstrates that a large share of such passengers still could make it on time to their gate.

CDM Landside Modelling EUROCONTROL
Project APT-ACP - EEC Note No. 12/06 63
Effects of Shifted Entry Times on av. Number of Late Pax
33
64
99
029
30 30
0 1 1
25
0
20
40
60
80
100
120
LP_5m LP_10m LP_15m LP_15m_W_R
Example of Exercise B
pax
Pax Rejectedat CheckIntime<30min
LateTransfer Paxat Gate
LateDirect Paxat Gate
Figure 45: Late Pax Scenario: Exercise B – Effects of Shifted Entry Times
4.4.7.3. Conclusions
The slight shifts in reporting profile result in less occupation of the check-in hall, because passengers arrive later for check-in and spend relatively less time. Probably the effect is only caused through the fact that passengers wait less time until their check-in opens.
Since the shift in entry time is the same for all passengers, at the control stations almost the same flow rates occur. There is no indicator that the demand should change.
The investigations show that even a very small shift of entry times as in this exercise influences flight delays. However the flight delays are not significant due to the magnitude of the shift, but the results recommend further investigations especially according to ACARE’s specifications concerning the time efficiency. More significant results are expected when shifting the reporting profiles closer around the opening times of the check-in counters.
4.4.8. Exercise C – Fast Track
In addition to exercise B this exercise investigates fast track facilities and alternative check-in concepts like CUSS and Internet check-in, when the passenger reporting profiles are shifted towards STD. The effects on flight delays are investigated for several variations concerning the share of the introduced technologies.
4.4.8.1. Settings
The new passenger property FastTrack is introduced. After a passenger enters the terminal, the simulation checks if he is late for check-in. A passenger is regarded, as late if he arrives later than 30 minutes before the scheduled time of departure, he is rejected for check-in.
The same passenger lists generated for Exercise B (5, 10, 15 minutes shift) have been used as input for the scenario exercise. According to these PaxGen lists up to 5% of the passengers are subject to dedicated fast track handling.
New fast track facilities for check-in, bagdrops, security and passport control stations are inserted into the model, which are dedicated only for fast track passengers. The level of service of such stations is set to short waiting times – in average maximum 2 to 3 passengers are allowed to be in a queue. Thus, a fast handling of late passengers is guaranteed.
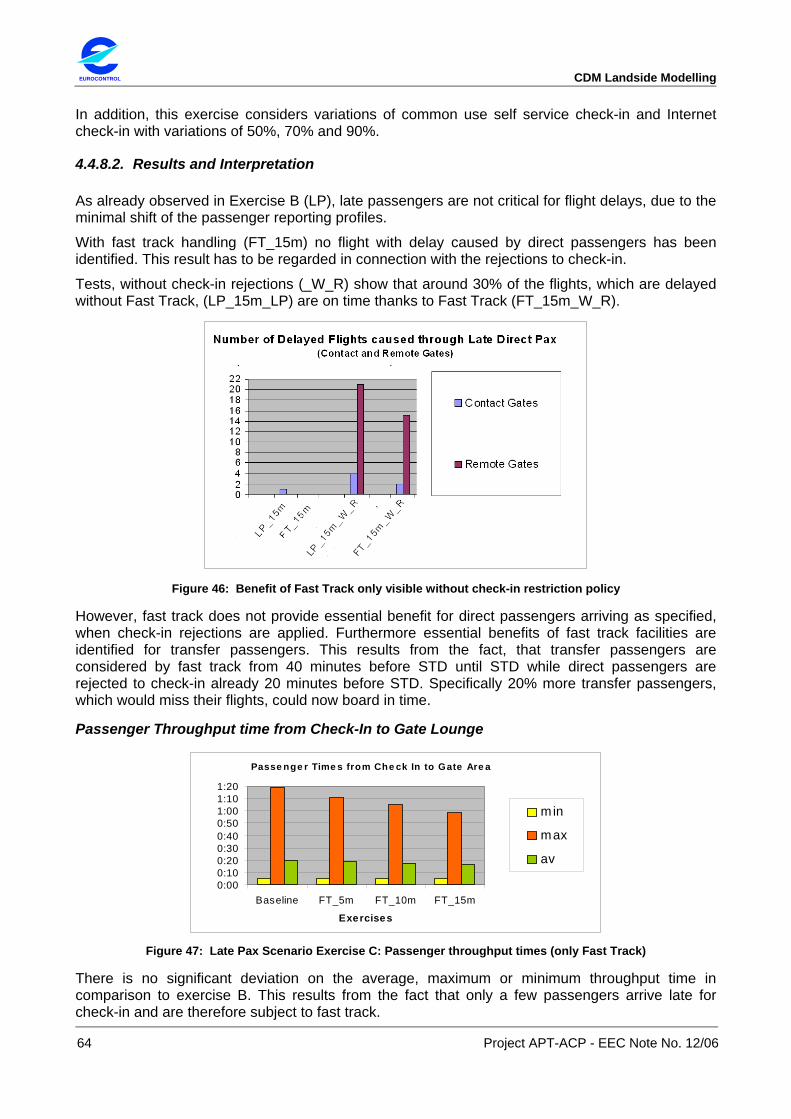
EUROCONTROL CDM Landside Modelling
64 Project APT-ACP - EEC Note No. 12/06
In addition, this exercise considers variations of common use self service check-in and Internet check-in with variations of 50%, 70% and 90%.
4.4.8.2. Results and Interpretation
As already observed in Exercise B (LP), late passengers are not critical for flight delays, due to the minimal shift of the passenger reporting profiles.
With fast track handling (FT_15m) no flight with delay caused by direct passengers has been identified. This result has to be regarded in connection with the rejections to check-in.
Tests, without check-in rejections (_W_R) show that around 30% of the flights, which are delayed without Fast Track, (LP_15m_LP) are on time thanks to Fast Track (FT_15m_W_R).
Figure 46: Benefit of Fast Track only visible without check-in restriction policy
However, fast track does not provide essential benefit for direct passengers arriving as specified, when check-in rejections are applied. Furthermore essential benefits of fast track facilities are identified for transfer passengers. This results from the fact, that transfer passengers are considered by fast track from 40 minutes before STD until STD while direct passengers are rejected to check-in already 20 minutes before STD. Specifically 20% more transfer passengers, which would miss their flights, could now board in time.
Passenger Throughput time from Check-In to Gate Lounge
Passe nge r Time s from Che ck In to Gate Are a
0:000:100:200:300:400:501:001:101:20
Baseline FT_5m FT_10m FT_15m
Exercises
min
max
av
Figure 47: Late Pax Scenario Exercise C: Passenger throughput times (only Fast Track)
There is no significant deviation on the average, maximum or minimum throughput time in comparison to exercise B. This results from the fact that only a few passengers arrive late for check-in and are therefore subject to fast track.

CDM Landside Modelling EUROCONTROL
Project APT-ACP - EEC Note No. 12/06 65
Use of CUSS leads to lower passenger throughput times
The second step of this exercise investigates the influence of having variations of check-in concepts (CUSS and Internet check-in) combined with fast track procedures when the passenger reporting profiles are shifted. With increased share of CUSS and Internet check-in a larger share of passengers with Internet-check-in is involved, that only need to drop their bag with a lower process time than CUSS or regular check-in.
These variations lead to a decrease of the average passenger throughput times up to 25%. This results from the availability of flexible check-in facilities.
Passenger Times from Check In to Gate Area
0:000:100:200:300:400:501:001:101:20
Baseline LP_15m CU_50 CU_70 CU_90Exercises
min
max
av
FT_15m
Figure 48: Late Pax Scenario Exercise C: Passenger throughput times (Fast Track and CUSS)
Furthermore the utilisation of the check-in hall is decreased through the CUSS variations, because passengers can immediately check-in at the CUSS stations and then directly proceed to the security control.
Therefore a slightly flattened demand at the following stations along the process chain has been identified.
Occupation of Check In HallCompare Baseline, LP_15m (as Shifted Baseline) to CU_50, CU_70 and CU_90
0
50
100
150
200
250
300
350
400
450
27/0
8/20
04 0
0:00
27/0
8/20
04 0
1:00
27/0
8/20
04 0
2:00
27/0
8/20
04 0
3:00
27/0
8/20
04 0
4:00
27/0
8/20
04 0
5:00
27/0
8/20
04 0
6:00
27/0
8/20
04 0
7:00
27/0
8/20
04 0
8:00
27/0
8/20
04 0
9:00
27/0
8/20
04 1
0:00
27/0
8/20
04 1
1:00
27/0
8/20
04 1
2:00
27/0
8/20
04 1
3:00
27/0
8/20
04 1
4:00
27/0
8/20
04 1
5:00
27/0
8/20
04 1
6:00
27/0
8/20
04 1
7:00
27/0
8/20
04 1
8:00
27/0
8/20
04 1
9:00
27/0
8/20
04 2
0:00
27/0
8/20
04 2
1:00
27/0
8/20
04 2
2:00
27/0
8/20
04 2
3:00
28/0
8/20
04 0
0:00
Time
BL
LP_15m
CU_50
CU_70
CU_90
Figure 49: Late Pax Scenario Exercise C: Check-In Hall (compare CUSS and Baseline)
The flattening of the utilisation of the facilities due to both fast track and alternative check-in concepts has the result that no flight delay occurs anymore. However, although only one flight is delayed without applying these technologies, the positive influence is obvious.
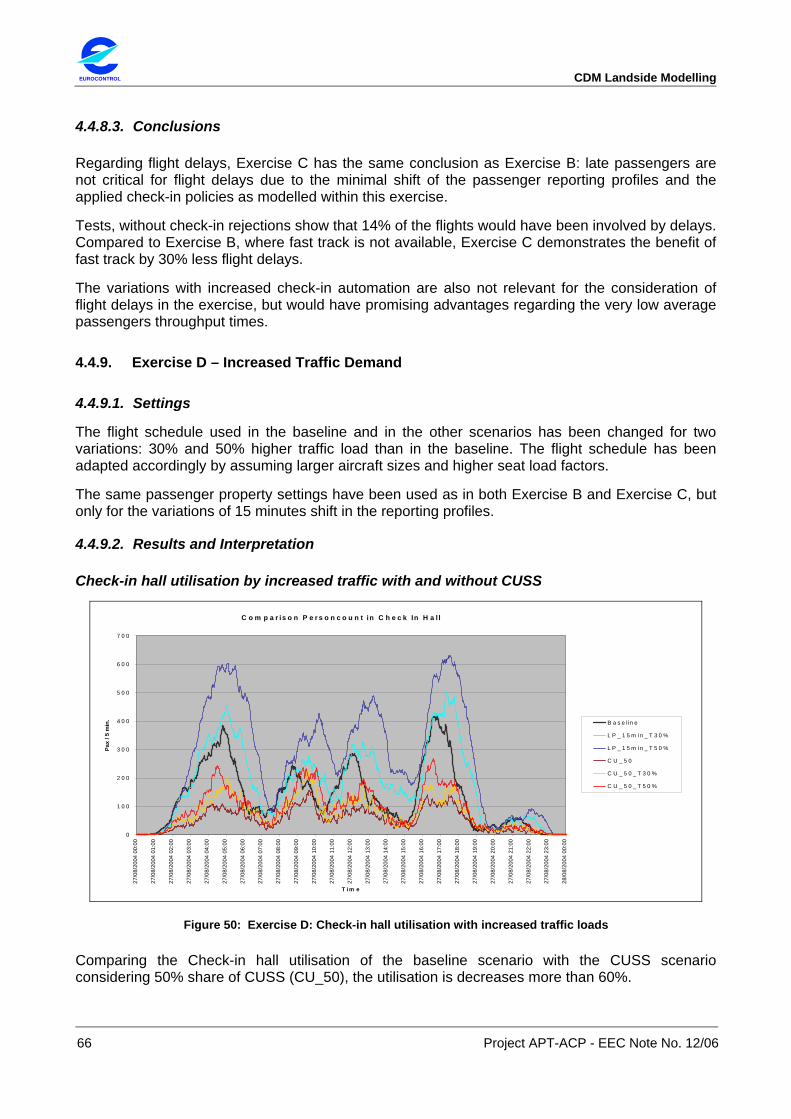
EUROCONTROL CDM Landside Modelling
66 Project APT-ACP - EEC Note No. 12/06
4.4.8.3. Conclusions
Regarding flight delays, Exercise C has the same conclusion as Exercise B: late passengers are not critical for flight delays due to the minimal shift of the passenger reporting profiles and the applied check-in policies as modelled within this exercise.
Tests, without check-in rejections show that 14% of the flights would have been involved by delays. Compared to Exercise B, where fast track is not available, Exercise C demonstrates the benefit of fast track by 30% less flight delays.
The variations with increased check-in automation are also not relevant for the consideration of flight delays in the exercise, but would have promising advantages regarding the very low average passengers throughput times.
4.4.9. Exercise D – Increased Traffic Demand
4.4.9.1. Settings
The flight schedule used in the baseline and in the other scenarios has been changed for two variations: 30% and 50% higher traffic load than in the baseline. The flight schedule has been adapted accordingly by assuming larger aircraft sizes and higher seat load factors.
The same passenger property settings have been used as in both Exercise B and Exercise C, but only for the variations of 15 minutes shift in the reporting profiles.
4.4.9.2. Results and Interpretation
Check-in hall utilisation by increased traffic with and without CUSS
C o m p a r is o n P e r s o n c o u n t in C h e c k In H a l l
0
1 0 0
2 0 0
3 0 0
4 0 0
5 0 0
6 0 0
7 0 0
27/0
8/20
04 0
0:00
27/0
8/20
04 0
1:00
27/0
8/20
04 0
2:00
27/0
8/20
04 0
3:00
27/0
8/20
04 0
4:00
27/0
8/20
04 0
5:00
27/0
8/20
04 0
6:00
27/0
8/20
04 0
7:00
27/0
8/20
04 0
8:00
27/0
8/20
04 0
9:00
27/0
8/20
04 1
0:00
27/0
8/20
04 1
1:00
27/0
8/20
04 1
2:00
27/0
8/20
04 1
3:00
27/0
8/20
04 1
4:00
27/0
8/20
04 1
5:00
27/0
8/20
04 1
6:00
27/0
8/20
04 1
7:00
27/0
8/20
04 1
8:00
27/0
8/20
04 1
9:00
27/0
8/20
04 2
0:00
27/0
8/20
04 2
1:00
27/0
8/20
04 2
2:00
27/0
8/20
04 2
3:00
28/0
8/20
04 0
0:00
T im e
Pax
/ 5 m
in. B a s e lin e
L P _ 1 5 m in _ T 3 0 %
L P _ 1 5 m in _ T 5 0 %
C U _ 5 0
C U _ 5 0 _ T 3 0 %
C U _ 5 0 _ T 5 0 %
Figure 50: Exercise D: Check-in hall utilisation with increased traffic loads
Comparing the Check-in hall utilisation of the baseline scenario with the CUSS scenario considering 50% share of CUSS (CU_50), the utilisation is decreases more than 60%.

CDM Landside Modelling EUROCONTROL
Project APT-ACP - EEC Note No. 12/06 67
Even when increasing traffic for the CUSS scenario up to 50%, it is obvious, that the check-in hall still is 30% less utilised than in the baseline.
When comparing Exercise B with the CUSS scenario with 50% traffic increase, the very same relation of Baseline to CUSS can be observed. It is apparent that CUSS facilitation decreases the utilisation of the check-in hall by more than 60% compared to the scenario with the same traffic volume.
Thus, the advantage of CUSS is not depending on traffic increase, as long enough CUSS stations are available.
Effects at control stations: up to 40% more stations to handle traffic increase of 50%
With the example of the security control Non-Schengen the effects on control stations is discussed.
As indicated in Figure 51 the maximum number of required counters increases from 8 in the baseline to 11 in the scenarios with 50% traffic increase. This increase of about 40% has also been observed in the daily average profile of the number of simultaneously opened security controls. With this increased utilisation the pre-defined level of service is guaranteed.
Security Control NonSchengen Fast Track with 50% Traffic Increase (FT_15m_T50%)
0
2
4
6
8
10
12
27/0
8/20
04 0
0:00
27/0
8/20
04 0
1:00
27/0
8/20
04 0
2:00
27/0
8/20
04 0
3:00
27/0
8/20
04 0
4:00
27/0
8/20
04 0
5:00
27/0
8/20
04 0
6:00
27/0
8/20
04 0
7:00
27/0
8/20
04 0
8:00
27/0
8/20
04 0
9:00
27/0
8/20
04 1
0:00
27/0
8/20
04 1
1:00
27/0
8/20
04 1
2:00
27/0
8/20
04 1
3:00
27/0
8/20
04 1
4:00
27/0
8/20
04 1
5:00
27/0
8/20
04 1
6:00
27/0
8/20
04 1
7:00
27/0
8/20
04 1
8:00
27/0
8/20
04 1
9:00
27/0
8/20
04 2
0:00
27/0
8/20
04 2
1:00
27/0
8/20
04 2
2:00
27/0
8/20
04 2
3:00
28/0
8/20
04 0
0:00
Time
Pax
/ 5 m
in.
0
2
4
6
8
10
12
num
ber o
f act
ive
stat
ions
av. Max QueueLength
number of activestations
Non-Schengen Security Control Traffic Increase 50%
Log Interval: 5 min.
maximum number of stations required: 11
Security Control Non-Schengen
0
2
4
6
8
10
12
27/0
8/20
04 0
0:00
27/0
8/20
04 0
1:00
27/0
8/20
04 0
2:00
27/0
8/20
04 0
3:00
27/0
8/20
04 0
4:00
27/0
8/20
04 0
5:00
27/0
8/20
04 0
6:00
27/0
8/20
04 0
7:00
27/0
8/20
04 0
8:00
27/0
8/20
04 0
9:00
27/0
8/20
04 1
0:00
27/0
8/20
04 1
1:00
27/0
8/20
04 1
2:00
27/0
8/20
04 1
3:00
27/0
8/20
04 1
4:00
27/0
8/20
04 1
5:00
27/0
8/20
04 1
6:00
27/0
8/20
04 1
7:00
27/0
8/20
04 1
8:00
27/0
8/20
04 1
9:00
27/0
8/20
04 2
0:00
27/0
8/20
04 2
1:00
27/0
8/20
04 2
2:00
27/0
8/20
04 2
3:00
28/0
8/20
04 0
0:00
Time
Pax
/ 5 m
in.
0
1
2
3
4
5
6
7
8
9
num
ber o
f act
ive
stat
ions
av MaxQueueLength
number of activestations
Non-Schengen Security Control Baseline
Log Interval: 5 min.
maximum number of stations required: 8
Figure 51: Traffic Increase 70%: Security Control Non-Schengen

EUROCONTROL CDM Landside Modelling
68 Project APT-ACP - EEC Note No. 12/06
Passengers have longer waiting times at check-in. Thus, over a longer time interval more passengers stay within the check-in process. Therefore, a greater proportion arrives later at the control stations.
Passenger throughput time from check-in to gate lounge
Depending on the dwelling times of passengers in the check-in hall, which is influenced by the check-in concepts, the overall throughput time of all passengers over the day varies. Generally it is increased by 23% (50% traffic increase) but decreased by 30% applying automated check-in.
It has been observed that, when traffic is increased by 50%, the average passenger throughput times from check-in to gate area increase by 30%. This results from longer waiting queues at flight check-in. This trend is reverse when introducing automated check-in (CUSS and Internet check) facilities. This concept leads to a decrease of the passenger dwelling times in the check-in hall and furthermore to a reduction of the overall throughput time of 30%. This behaviour of the dwelling times is more apparent regarding the maximum throughput times. This value varies from 20% increase without automated check-in to 40% decrease with application of these concepts. At this stage it has to be emphasised that all the values mentioned above result from investigations were fast track was available. Figure 52 provides an overview of the results observed.
Passenger Times from Check In to Gate Area
0:00
0:20
0:40
1:00
1:20
1:40
Baseline FT_15m_T30% FT_15m_T50% CU_50_T30% CU_50_T50%
Exercises
min
max
av
Passenger Throughput Times from Check In to Gate Area(increased traffic scenarios)
Figure 52: Passenger throughput times for scenarios with traffic increase
Increase of flight delays
Although the traffic is essentially increased it has been observed that it is possible to handle the demand without additional flight delays. To achieve such positive results it is necessary to facilitate automated check-in and fast track. These concepts guarantee a satisfying passenger flow from terminal entry to airlock. However when automated check-in is not applied essential delays occur at the check-in process.
In reality airlines, would probably offer enough flight check-in counters to prevent such delays, but under the boundary conditions defined for the exercises of this scenario this influence has not been taken into account in order to ensure comparability to the baseline scenario.
As indicated in Figure 53 the flight delays that occurred in the scenario with 50% traffic increase (LP_15m_T50%) could be decreased by 20% applying fast track (FT_15m_T50%) and 100% when combining fast track and automated check-in (CU_50_T50%). Furthermore it is apparent that remote gates are more involved by flight delays.
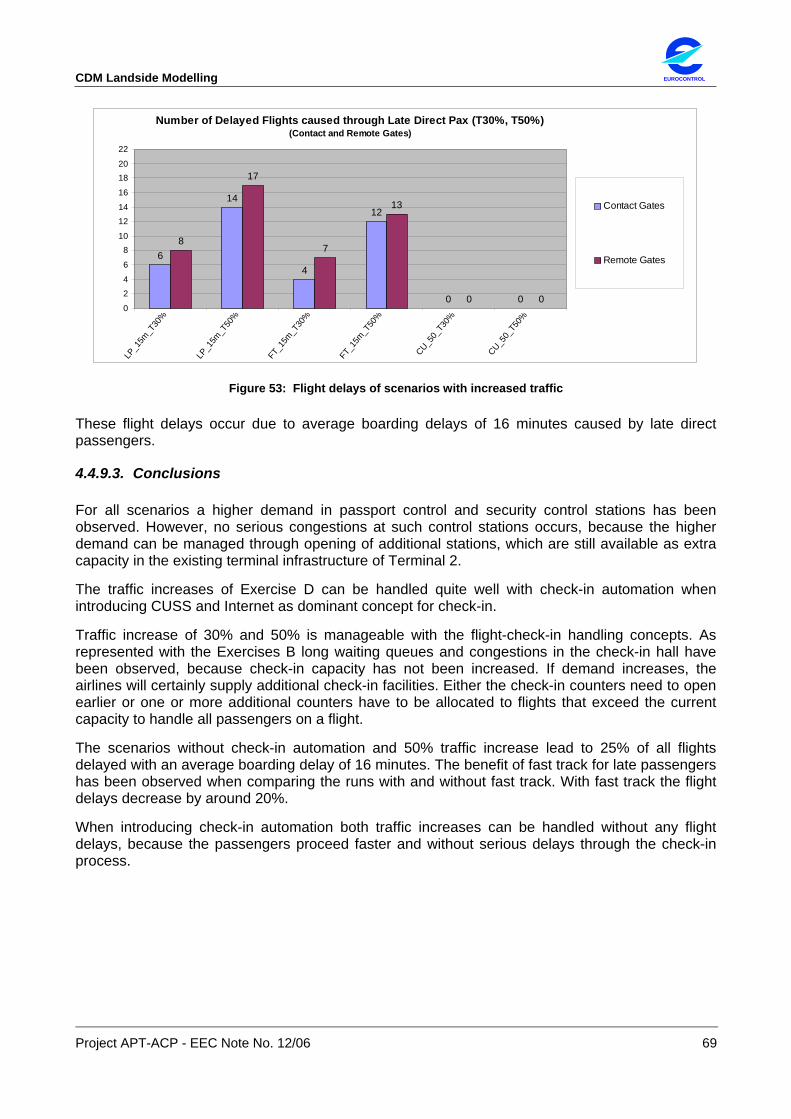
CDM Landside Modelling EUROCONTROL
Project APT-ACP - EEC Note No. 12/06 69
Number of Delayed Flights caused through Late Direct Pax (T30%, T50%)(Contact and Remote Gates)
6
14
4
12
0 0
8
17
7
13
0 00
24
6
810
1214
16
1820
22
LP_1
5m_T
30%
LP_1
5m_T
50%
FT_1
5m_T
30%
FT_1
5m_T
50%
CU_50_
T30%
CU_50_
T50%
Contact Gates
Remote Gates
Figure 53: Flight delays of scenarios with increased traffic
These flight delays occur due to average boarding delays of 16 minutes caused by late direct passengers.
4.4.9.3. Conclusions
For all scenarios a higher demand in passport control and security control stations has been observed. However, no serious congestions at such control stations occurs, because the higher demand can be managed through opening of additional stations, which are still available as extra capacity in the existing terminal infrastructure of Terminal 2.
The traffic increases of Exercise D can be handled quite well with check-in automation when introducing CUSS and Internet as dominant concept for check-in.
Traffic increase of 30% and 50% is manageable with the flight-check-in handling concepts. As represented with the Exercises B long waiting queues and congestions in the check-in hall have been observed, because check-in capacity has not been increased. If demand increases, the airlines will certainly supply additional check-in facilities. Either the check-in counters need to open earlier or one or more additional counters have to be allocated to flights that exceed the current capacity to handle all passengers on a flight.
The scenarios without check-in automation and 50% traffic increase lead to 25% of all flights delayed with an average boarding delay of 16 minutes. The benefit of fast track for late passengers has been observed when comparing the runs with and without fast track. With fast track the flight delays decrease by around 20%.
When introducing check-in automation both traffic increases can be handled without any flight delays, because the passengers proceed faster and without serious delays through the check-in process.

EUROCONTROL CDM Landside Modelling
70 Project APT-ACP - EEC Note No. 12/06
5. SUMMARY AND CONCLUSIONS
The investigation of the initial scenarios of project phase 1 and the discussion of the results with airport representatives helps to get an insight into landside processes and important parameters. Thus driving forward the use and the efficiency of a passenger terminal.
After creating and validating the baseline simulation model of Frankfurt Airport’s Terminal 2, three different scenarios have been simulated and investigated. This chapter summarises the main findings for each scenario.
CUSS Scenario
Considering the assumed share of automated check-in, where 80% of all passengers check-in via CUSS and Internet, the following key findings have been extracted:
• The overall utilisation of the check-in hall decreases. This results from faster and more homogeneous throughput of passengers through the check-in process, by more flexible distribution of passengers to the different check-in service types (staffed check-in, CUSS check-in, and Internet check-in). This distribution leads to a flattening of peaks within the check-in hall. Furthermore the required number of check-in facilities serving the check-in demand decreased by more than 50%. This emphasises the benefit of common check-in, not only at self service stations. Specifically the advantage of self-service check-in results from the unlimited opening times of these facilities.
• The application of CUSS-facilities leads to a reduced staff demand of 65% under the boundary conditions assumed. The number of staffed check-in counters simultaneously used, decreased from 63 in the baseline scenario to 23 in the CUSS scenario.
• In addition the succeeding services along the process chain (security control, passport control) are relieved. The flattening of peaks by 20 to 30% through automation of check-in processes results in the fact that passengers arrive more evenly at security and passport control. Thus there are additional potentialities of staff savings at these services.
• Check-in automation by CUSS and Internet check-in should be part of the investigations concerning ACARE related HLTC’s. There are potentialities concerning time efficiency, cost efficiency and customer convenience.
Retail Yield Scenario
The concepts to use a Gate Reporting Time (GRT) for gate announcement and to keep the passengers waiting and shopping in a common retail area show clear potentialities to increase the retail yield of an airport. Potentials for retail yield have been measured by the evaluation of the overall time, that passengers spend in retail areas compared to the baseline.
The investigations with an assumed GRT of 90 minutes for baseline and a GRT of 40 minutes considered shares of retail passengers from 40% to 80%. This leads to the findings below:
• The potential retail time is the sum of the times all passengers spent in retail areas. This time does increase by 50% considering a share of 40% retail passengers. Even 200% more retail time is determined increasing the passengers’ retail share to 80%. It is likely that more passengers are animated to do retail if they spend their spare time until boarding in a common retail area instead of waiting in the gate areas.

CDM Landside Modelling EUROCONTROL
Project APT-ACP - EEC Note No. 12/06 71
• The combination of Retail Yield and CUSS Scenario leads to a further increase of retail yield potentials. This results from the fact that in average passengers’ proceed in less than half of the time through the check-in process compared to the baseline scenario. Thus passengers will obviously spend more time on the airside of the terminal in the common retail areas, where they wait for the gate announcement.
• The amount of passengers occupying the gate areas at the same time decreases by 50% compared to the baseline. Thus the scenario offers potentials for the improved use of gate lounge areas too. The number of gate lounges simultaneously in use has been reduced about 35%. Assuming that turnaround time for aircraft may decrease in future, there are potentials to use gate lounges twice in a 90 minute interval, e.g. as bus gate lounge.
• Concerning the ACARE vision Retail Yield investigations should be regarded from the view of different stakeholders. In general retail yield involves the HLTC’s time efficiency and cost efficiency. However, from stakeholder to stakeholder these HLTC’s may be understood in a different way. For the airport cost efficiency might mean to have as much passengers in the retail area as possible and time efficiency as long as possible. Airlines would probably like to have the passengers ready for departure in the gate areas as soon as possible.
Late Passenger Scenario
This scenario investigates the effect of shifted reporting profiles of passengers arriving 5, 10 and 15 minutes later at the airport than in the baseline scenario and analyses the impact on boarding delays. The scenario comprises several exercises that demonstrate the effects of introducing fast track facilities, of increased shares of check-in automation via CUSS and Internet check-in by 50%, 70% and 90% as well as of increased traffic loads by 30% and 50%.
• Even the shift of reporting profiles by 15 minutes did not lead to mentionable boarding delays. The reasons are: first the shift of reporting profiles considered was not very extensive and led only to a minor proportion of passengers late for check-in. Second, the general policy of rejecting passengers for check-in arriving later than 20 minutes before the scheduled time of departure reduced the number of considered late passengers even further.
• Considering the introduction of fast track facilities for late passengers, in general the investigations figured out that such facilities have positive influence on flight delays. Even with the few passengers that were late, fast track leads to less flight delays. The positive impact of fast track became more obvious considering the passengers that normally would have been rejected for check-in. It was ascertained, that 33% of the passengers that would have had delays arriving at the gate were in time with fast track application.
• Essential benefit is achieved for transfer passengers. At Frankfurt Airport all transfer passengers transferring from Schengen to Non-Schengen have to pass security and passport control. They are not involved in check-in rejection and may receive fast track assistance whenever they are late. It was noticed that 20% more transfer passengers reached their connecting flight in time due to fast track application.
• Additional introduction of check-in automation has shown that waiting times in the check-in process are considerably reduced while at the same time less check-in facilities are required. Furthermore the check-in hall utilisation has been essentially decreased. Also the average passenger throughput time from check-in to gate can be reduced down to 25%.
EUROCONTROL CDM Landside Modelling
72 Project APT-ACP - EEC Note No. 12/06
• The investigation of the scenario variations under increased traffic loads by 30% and 50% demonstrates that Terminal 2 still has capacity at the security control and the passport control to handle such traffic increases. The main bottleneck has been identified in the check-in process when no additional check-in facilities are added for flight check-in. Thus, more late passengers were observed arriving late for boarding. When offering fast-track facilities for late passengers, in average 20% of such passengers could board in time. When introducing check-in automation, the traffic increases could be handled without any boarding delays.
• Concerning the ACARE vision it is recommended to investigate more essentially shifted reporting profiles. The benefits of automated check-in and fast track then will become more obvious.
The study investigated some aspects of changing the passenger handling process testing the effect on specific key performance indicators. However, these investigations can only be seen as preparatory steps towards the planned future project phases regarding the ACARE scenarios (phase 2), the simulation of another airport terminal (phase 3) and the identification of landside CDM aspects when looking at the integration of airside and landside (phase 4).
The next phase of the project will be considered with phase 2: the simulation of ACARE scenarios. The insight gained with the initial scenarios will be considered within the scenario definition and further considerations will be elaborated in discussion with airport representatives and technology experts.
CDM Landside Modelling EUROCONTROL
Project APT-ACP - EEC Note No. 12/06 73
6. GLOSSARY
Term Explanation
ACARE Advisory Council of Aeronautical Research in Europe
ACARE, was launched at the Paris Air Show in June 2001.
ACARE comprises about 30 members, including representation from the Member States of the EU, the Commission and stakeholders, including manufacturing
industry, airlines, airports, service providers, regulators, and academia
The ACARE plenary spawned a series of sub-organisations, which were tasked to develop the Strategic Research Agenda Issue 1, SRA-1 [launched October 2002] and SRA-2 [launched October 2004]
ACARE-SRA-2 Strategic Research Agenda, issued in 2004 by the ACARE (Advisory Council of Aeronautical Research in Europe).
Analysis Parameter Analysis parameters are parameters derived during a simulation such as flow rates, occupancy times, queue length etc. to analyse e.g. the efficiency of a terminal system or on its sub-components
Airport model Representation of a specific airport layout and passenger processes created within a simulation tool (e.g. specific airport scenario, defined by layout and its operational concept)
Baseline model Is a representation of a real terminal in a simulation model (here: Terminal 2 of Frankfurt Airport). The model represents the actual status quo of the terminal as it is currently operated. Based on the baseline model scenarios can be created by modifying certain parameters (layout, operational settings or traffic loads) to test the effects of changes.
Bagdrop A self-service station where a passenger can tag and drop his hold baggage on himself.
CAD Computer Aided Design
CAST Comprehensive Airport Simulation Tool. Here: The terminal module of ARC’s simulation system. Multi-agent-based airport simulation system developed by the Airport Research Center in cooperation with the British Airport Authorities.
CDM Collaborative Decision Making.
CDM is about improving the way Air Traffic Management, Airlines and Airports work together at an operational level, by increasing their mutual knowledge of the situation.
It is based on a sophisticated information management that provides everyone with adequate information to make the best decisions with the knowledge and overview of the current and following situation. The resulting situational awareness leads to an overall increase in capacity and punctuality as scarce resources such as runway capacity, gates and take-off slots can be used in a more efficient manner.
CIP Commercially Important passenger, such as business or first class passengers. Such passengers are treated with priority by the airlines and the airport.
Check-In Type Relevant for the CUSS/Internet Scenario, where different modes of check-in are investigated. Considered check-in types: CUSS check-in, Internet check-in, Staffed check-in (see more information in Chapter CUSS/Internet Scenario)
Common Use Check-In
If an airline operates several flights during one or more time periods of the day, it is common that the airline offers its passengers a common use check-in. Several check-in counters are open for check-in of any flight of the airline, what means passengers can check-in at any of those counters. The advantage for the airline is, that traffic loads are more evenly distributed between several counters. The effect is, that less check-in utilities and staff is needed.
(see for comparison also: Flight check-in)
Controller (CAST) The controller is an object that is able to open and close services (such as security control or immigration control) according to the actual status of the object (e.g. according to the queue length).
CUSS Common Use Self Service.

EUROCONTROL CDM Landside Modelling
74 Project APT-ACP - EEC Note No. 12/06
Term Explanation
Represents a service station, for instance a check-in kiosk or a bagdrop station, where a passenger interacts with a human machine interface for the check-in process without any staff support.
ECO pax Economy class passenger
EEC EUROCONTROL Experimental Centre
Fast Track A fast track defines a service, such as check-in, security control or passport control that is dedicated only for a certain group of passengers. In particular, during peak hours, the queues and waiting times are less compared to the regular service stations used by the common passengers. Dedicated Fast track facilities may be used by CIP passengers or passengers that are late and risk to miss their flight.
Flight Check-In One or usually several check-in counters are dedicated and open for a particular flight for check-in. A passenger booked on that flight checks in at one of those dedicated check-in counters. (see for comparison also: Common Use check-in)
Fraport The operator of Frankfurt Airport
Direct passenger In comparison to a transfer passenger, a direct passenger departs or terminates at the airport under consideration.
PaxGen Application of the CAST simulation system. The application creates passenger lists to load into the simulation model. The passenger lists are created from a flight schedule in combination with a rule set for passenger groups with certain passenger characteristics/ properties (e.g. passenger type: direct or transfer, flight type, number of hold bags, etc.)
Scenario General description of an assembly of different characteristics A scenario is a combination of
• Airport Layout • Operational concept • Passenger properties • Traffic load
Gate Reporting Time
CAST specific term that defines the time when a passenger arrives at the gate for waiting and until the boarding process starts. The time is only used when a passenger has the task to use his free time for retailing activities. If the passenger does not has any free-time tasks in the simulation, he will go to the gate just after he has finished all his mandatory processes, as check-in , security and passport control.
Time is set during passenger creation depending on a distribution of “time before departure” related to the STD (scheduled time of departure).
GRT = Gate Reporting Time
High Level Target Concept
Based on ACARE definitions (e.g. highly customer orientated, highly time efficient, cost efficient, Ultra Secure)
Defines a certain (extreme) characteristic a scenario is defined and modelled accordingly
HLTC = High Level Target Concept (defined within the ACARE SRA-2, see ACARE)
Key Performance Indicator
Key performance indicators are derived from a single or several analysis parameters in order to easily compare different scenarios regarding a specific aspect.
The definition and specification of KPI's depend on the purpose of a scenario and the specific question to investigate and might be identical or different for several scenarios.
Examples: Investigating capacity issues, the throughput of passengers in relation to queues and
delays is a relevant KPI At a hub airport the processing time of transfer passenger is critical, thus the "MCT
(minimum connecting time)" is a relevant KPI if comparing different terminal layout, "maximum or average walking distance" is a relevant
KPI
Level of Service Quality standard to evaluate the passenger’s comfort within a terminal. E.g. regarding waiting time at services, such as check-in, security and passport control or space standards

CDM Landside Modelling EUROCONTROL
Project APT-ACP - EEC Note No. 12/06 75
Term Explanation indicating the available space in an area of the terminal measured in m²/passenger.
IATA recommends guidelines for space standards and waiting times published in the Airport Terminal Development Reference Manual.
LOS = Level of Service
Operational concept Way of operating an airport terminal, (e.g. central or de-central operation of facilities, allocation scheme airlines to gate areas, etc.)
Passenger Object Simulation object that represents a passenger. The characteristics of the passenger are represented through properties.
Passenger Type Within CAST two generic passenger types are distinguished: transfer and direct (see also transfer passenger and direct passenger).
Pax Passenger
PaxGen Module of CAST to create the passenger list (input to the model) with all required properties from a flight schedule and data sets representing the passenger behaviour.
Property By properties the characteristics of the passengers are set. According to the properties the passenger is able to use specific services or will behave in a certain way. The properties of a passenger object are set through PaxGen.
Reporting profile Defines a distribution of reporting times for persons entering the simulation model
(see also: Reporting time)
Reporting time Time when the person enters the model.
The specification of the reporting profile is determined by setting a time range (by min / max) during which a specific passenger load is expected. The exact time between the min/max values is set randomly.
Resource Allocation The assignment of resources to objects requiring resources; e.g. the assignment of baggage belts to flights or check-in counters to airlines or flight numbers
Service object
(CAST)
Any object where a person is handled according to the settings of the object. These can be services required to board a flight (e.g. check-in, security control) or additional services offered in the terminal (e.g. retail)
Simulation model Is a representation of the infrastructure layout and operational processes of a real system, here a passenger terminal, in a simulation environment.
Simulation system = simulation tool
Simulation tool General software environment for simulation (here: CAST)
Simulation scenario Representation of a specific scenario within the simulation environment (airport model plus traffic data plus operational settings)
STA Scheduled time of arrival.
(here used as on-block time, when the aircraft parks at the gate / stand position)
STD Scheduled time of departure.
(here used as off-block time, when the aircraft leaves the gate / stand position)
TOFAS Total Frankfurt Airport Simulator: name of Fraport’s Terminal Simulation System. In comparison to the multi-agent system CAST, TOFAS is based on a link-node-philosophy without any geographical representation of the terminal infrastructure.
Within the validation process of the baseline simulation model, the results TOFAS has been used for comparison and to evaluate if the baseline model works like it should work.
Transaction Time Time required by the persons for being handled at a service.
Travel Class Travel class of a passenger, e.g.: First / Business / Economy
Is set within PaxGen as input by a data distribution
Traffic Scenario Defines traffic loads to be handled within a terminal. A traffic scenario is represented by a flight schedule. In combination with passenger properties according to flight characteristics, in CAST passenger objects are dynamically created that are simulated and processed

EUROCONTROL CDM Landside Modelling
76 Project APT-ACP - EEC Note No. 12/06
Term Explanation within CAST.
A traffic scenario might represent another traffic volume and/or another traffic structure than the flight schedule of the initial baseline model.
Transfer passenger A transfer passenger arrives with one aircraft at the airport and leaves the airport again on another connecting flight to reach his final destination. The baggage of the passenger will be transferred automatically well via the baggage handling system.
PTS Passenger Transport System.
At Fraport, the PTS is an airport train that connects Terminal 1 and Terminal 2. Each train consists of two wagons: one for the transport of Schengen passengers and the public and a second one dedicated for NonSchengen transfer passengers.
Walking Speed Refers to the speed a person moves through the terminal in meter per seconds.
Is set within PaxGen as input by a Gauss distribution (e.g. 0.75 min, 1.5 max)


![EUROCONTROL EXPERIMENTAL CENTRE · EUROCONTROL EXPERIMENTAL CENTRE ... EEC Note No. 13/05 ... [20] Guldenmund, F.W. (2000) The Nature of Safety Culture: a review of theory and research.](https://static.fdocuments.net/doc/165x107/5b258e827f8b9acc7f8b4582/eurocontrol-experimental-centre-eurocontrol-experimental-centre-eec-note.jpg)


