EUROCONTROL EXPERIMENTAL CENTRE · 2019. 2. 18. · 2.1 Sector Capacity The sector hourly capacity...
27
EUROPEAN ORGANISATION FOR THE SAFETY OF AIR NAVIGATION EUROCONTROL EXPERIMENTAL CENTRE PESSIMISTIC SECTOR CAPACITY ESTIMATION EEC Note No. 21/03 Project COCA Issued: November 2003 The information contained in this document is the property of the EUROCONTROL Agency and no part should be reproduced in any form without the Agency’s permission. The views expressed herein do not necessarily reflect the official views or policy of the Agency. EUROCONTROL
Transcript of EUROCONTROL EXPERIMENTAL CENTRE · 2019. 2. 18. · 2.1 Sector Capacity The sector hourly capacity...

EUROPEAN ORGANISATION FOR THE SAFETY OF AIR NAVIGATION
EUROCONTROL EXPERIMENTAL CENTRE
PESSIMISTIC SECTOR CAPACITY ESTIMATION
EEC Note No. 21/03
Project COCA
Issued: November 2003
The information contained in this document is the property of the EUROCONTROL Agency and no part should be reproduced in any form without the Agency’s permission.
The views expressed herein do not necessarily reflect the official views or policy of the Agency.
EUROCONTROL

REPORT DOCUMENTATION PAGE
Reference: EEC Note No. 21/03
Security Classification: Unclassified
Originator: EEC - NCD (Network Capacity and Demand Management)
Originator (Corporate Author) Name/Location: EUROCONTROL Experimental Centre Centre de Bois des Bordes B.P.15 F - 91222 Brétigny-sur-Orge CEDEX FRANCE Telephone : +33 (0)1 69 88 75 00
Sponsor:
Sponsor (Contract Authority) Name/Location: EUROCONTROL Agency Rue de la Fusée, 96 B -1130 BRUXELLES Telephone : +32 2 729 9011
TITLE:
PESSIMISTIC SECTOR CAPACITY ESTIMATION
Author G.Flynn
A.Benkouar R.Christien
Date 11/03
Pages iv+ 23
Figures 15
Tables 7
Annex 1
References 7
Project COCA
Task No. Sponsor Period 2002-2003
Distribution Statement: (a) Controlled by: Head of NCD (b) Special Limitations: None (c) Copy to NTIS: YES / NO
Descriptors (keywords): Capacity, Workload, Conflicts, Level Change, Entry Flight, Complexity
Abstract: This note describes two capacity evaluation methods for ATC sectors. The first method is an improvement of CAPAN regression method. The second method uses ATCO workload evaluation (macroscopic level) linked with complexity impact.

EUROCONTROL Experimental Centre Network Capacity and demand management- NCD
Project COCA – EEC Note No. 21/03
iii
Table of Contents ABBREVIATIONS................................................................................................................................................ iv 1 INTRODUCTION................................................................................................................................1
1.1 OBJECTIVE ........................................................................................................................................... 2 1.2 SCOPE .................................................................................................................................................. 2
2 CAPACITY DEFINITION....................................................................................................................3 2.1 SECTOR CAPACITY............................................................................................................................... 3 2.2 DECLARED SECTOR CAPACITY............................................................................................................. 3
3 CAPAN METHODOLOGY .................................................................................................................4 3.1 WORKLOAD CONTROLLER ASSESSMENT............................................................................................... 4 3.2 CAPAN PEAK METHOD........................................................................................................................ 4 3.3 CAPACITY EVALUATION BY REGRESSION METHOD ............................................................................... 6
4 PESSIMISTIC REGRESSION METHOD: IMPROVEMENT OF CAPAN REGRESSION METHOD7 4.1 FIRST PESSIMISTIC METHOD ................................................................................................................. 7 4.2 SECOND PESSIMISTIC METHOD ............................................................................................................. 8 4.3 RESULTS .............................................................................................................................................. 9 4.4 AVERAGING THE TWO PESSIMISTIC METHODS .................................................................................... 11
5 INTRODUCTION TO A NEW METHODOLOGY TO ASSESS SECTOR CAPACITY AT A MACROSCOPIC LEVEL.................................................................................................................12 5.1 SIMPLIFIED FORMULA TO COMPUTE THE WORKLOAD ......................................................................... 12 5.2 DATA MANIPULATION ........................................................................................................................ 13 5.3 CAPACITY ASSESSMENT BY USING SIMPLIFIED FORMULA ................................................................... 14
6 CONCLUSION & NEXT STEPS ......................................................................................................16
7 BIBLIOGRAPHY..............................................................................................................................18
ANNEX: ...............................................................................................................................................19

EUROCONTROL Experimental Centre Network Capacity and demand management- NCD
Project COCA – EEC Note No. 21/03
iv
ABBREVIATIONS
ACC Area Control Centre AMOC ATFM Modelling Capacity tool ANSP Air Navigation Service Provider ATC Air Traffic Control ATM Air Traffic Management CAPAN ATC Capacity Analyser tool CFMU Central Flow Management Unit COCA Complexity and Capacity EEC EUROCONTROL Experimental Centre ES Elementary Sector FAP Future ATM Profile(set of simulation tools at EEC) FL Flight Level MIAC Maximum Instantaneous Aircraft Count NCD Network Capacity and demand management PFE Performance, Flows, Economy WOODSTOCK Wide Object-Oriented Data Standard Traffic Observable Complexity
Knowledge (complexity toolbox)

EUROCONTROL Experimental Centre Network Capacity and demand management- NCD
Project COCA – EEC Note No. 21/03
1
1 INTRODUCTION Delays to aircraft cause passenger dissatisfaction and a substantial cost to airlines (between €1.3 and €1.9 billion a year). Despite a temporary slowdown following the attacks on 11 September, estimates are that air traffic will grow by 4% a year over the next 15 years. Air traffic control delays are due to the inability of the system to cope with an increased demand. Airspace is divided into segments called sectors and air traffic controllers are responsible for the safety of flights within their sector. In areas of high demand, it is necessary to impose restrictions to ensure that the number of flights within a sector does not exceed a specified limit. This figure is called sector capacity: that is, the number of flights that can be handled by air traffic controllers in a given area, within a specified time, without infringing safety or causing overload. It is generally accepted that a fundamental constraint to increasing the capacity of the system is controller workload. As new airspace design, changes to air traffic control procedures, and new technologies are developed to address the predicted increase in traffic growth, it is important to be able to assess the effect of change on controller workload in order to assess new sector capacities. Methods used to determine sector capacities by assessing controller workload generally fall into two groups: perceived or measured estimates. In this paper, we will describe CAPAN, a mathematical model developed by EUROCONTROL to measure controller workload and define sector capacity, and how we propose to improve the method. Mathematical models used to assess sector capacity rely on estimating or predicting the controller’s workload and are based on a measuring pre-defined, event driven, controller tasks of a specified duration. CAPAN is a powerful methodology using a simulation engine and mathematical models to measure workload with high precision and define capacity. The disadvantage is that CAPAN is a complex and long process. The preparation required to compute workload is quite demanding. Furthermore, CAPAN uses two capacity values obtained by two methods, (peak and regression methods) relies on estimating controller workload, and requires several simulation runs. The two capacity values can be very different. Generally, the capacity value obtained by the regression method is overestimated. In this paper we will describe an improvement upon the regression method. This improvement to the CAPAN methodology is within the scope of the Complexity and Capacity, (COCA) project. One of the COCA objectives is to develop an easy, quick and precise workload and capacity estimation method that considers complexity as an intrinsic factor. We will describe a macroscopic workload model used by COCA to estimate controller workload and how we use this workload to evaluate capacity. This paper forms a part of a series of three papers ([4],[5]).

EUROCONTROL Experimental Centre Network Capacity and demand management- NCD
Project COCA – EEC Note No. 21/03
2
1.1 Objective The objective is to develop an efficient method to estimate sector capacity. Efficient means for us:
Adaptability: to be able to compute all needed parameters for a chosen geographical area (all European airspace, core area…) and a given time period.
Easy and fast to use: macroscopic parameters, simple workload models. Accuracy: Capacity assessment must be accurate.
This objective is achieved in four steps: 1. Computation of parameters (ATFM simulators: WOODSTOCK, AMOC) 2. Classification of all European sectors, according to their complexity1 (Ref.[4]) 3. Building a specific macroscopic workload model for each class given in first step. 4. Use of an improved rergression method to estimate sectors capacity. This note focuses on step 4, with a short description of the way we will use a specific macroscopic workload model to estimate sectors capacity. 1.2 Scope
To allow comparisons with the CAPAN method, the scope of this note is limited to Maastricht Upper Area Centre (UAC) as described in [2], including 14 sectors, and using the traffic demand of 2001 July 4.
1Generally, we say that a system is complex if it contains more than one element and if these elements interact together. The more elements in the system, the more different interactions and the more complex the system is.

EUROCONTROL Experimental Centre Network Capacity and demand management- NCD
Project COCA – EEC Note No. 21/03
3
2 CAPACITY DEFINITION The capacity for an Air Traffic Management System is its ability to provide Air navigation Services to a certain volume of air traffic, in line with the targeted high level of safety and without imposing significant operational, economic or environmental penalties under normal circumstances2. There are different notions of capacity that can be determined and measured in different ways and at different levels. Here, we use two capacity definitions
2.1 Sector Capacity
The sector hourly capacity is the maximum number of flight entries in an hour that can safely be assigned to sector controllers. That is, the sector controllers can process all these flights without exceeding the maximum amount of work, which is the predefined overload threshold described in Table 1.
2.2 Declared Sector Capacity The declared sector capacity is the number of flight entries per hour, assessed by the ANSP, and declared to CFMU, so that the sector can be protected from overload. For more capacity definitions see Ref. [6]. First, we describe the CAPAN methodology and then the way we have improved some aspects of this method. This method has not enough "Adaptability" nor the "Easy and fast to use" fashion. Then, we have built a second method in the context of the COCA project that overcomes these drawbacks by using macroscopic workload evaluations linked with complexity.
2see http://www.eurocontrol.be/activities/capacity/

EUROCONTROL Experimental Centre Network Capacity and demand management- NCD
Project COCA – EEC Note No. 21/03
4
3 CAPAN METHODOLOGY CAPAN (ATC Capacity Analyser tool) is a method of capacity assessment developed by EUROCONTROL ([1], [2]). This method is based on a simulation engine to compute an estimation of controller’s workload for a given traffic sample.
3.1 Workload controller assessment The controller workload is the time spent to process all tasks in an interval of time for one controller position. A large amount of data is required to compute an estimation of the controller workload:
Airspace environment description. Selection of a representative traffic sample with corresponding flight plans or radar tracks, and aircraft performances.
Control parameters (procedures and techniques) for ATC action, agreed by operational experts to reflect realistic working conditions.
Duration of predefined tasks (in seconds) (see Table 5-1 in [1]). During the simulation, occurrences of predefined discrete events trigger the allocation of the corresponding tasks to the planning or tactical controller (or both), according to the sector manning and the duties specified for each sector. These events may for instance include:
A flight enters or exits an ATC sector, Conflict search and resolution, New flight level requested, External, internal coordinations, etc.
Hence, each working position ends up with a list of tasks. As the duration of each of these has been set previously, one can compute the time spent in one hour upon ATC control tasks. This time is called hourly workload.
3.2 CAPAN peak method The workload threshold is the percent of time spent upon the hourly workload. For instance, an hourly workload of 30 minutes gives a 50% workload threshold. This workload is defined for each controller position. Some real time simulation studies and operational trial validated the quantitative threshold values and their qualitative interpretation as shown in the Table 1 used by CAPAN methodology (Ref. [2])

EUROCONTROL Experimental Centre Network Capacity and demand management- NCD
Project COCA – EEC Note No. 21/03
5
Threshold Interpretation Recorded Working Time during 1 hour
70 % or above Overload 42 minutes +
54 % - 69 % Heavy Load 32 - 41 minutes
30 % - 53 % Medium Load 18 - 31 minutes
18 % - 29% Light Load 11 - 17 minutes
0 % - 17 % Very Light Load 0 - 10 minutes
Table 1 For a given traffic sample, the CAPAN method performs several simulation runs of a 24 hour traffic sample , applying random variations to entry times and aircraft performance for each simulation. The workload generated for each control position is then averaged over the different simulations. Thus, it does not rely too much on the traffic sample peculiarities. The one-hour period during which maximum workload is recorded is called the peak hour. The workload curves (Figure 1, red curve) shows a workload peak at 17h15. If the peak hour, in terms of workload, reaches the predefined threshold of overload, then the sector capacity is the number of aircraft that produced this peak.
MAASUAC-CVSM-ORG-A 14 Sect.(DFL340) Wednesday 4 JULY 2001 - CVSM
TRAFFIC Vs WORKLOADS In Sector EDYRRUH - RUHR (FL245-660)
0
10
20
30
40
50
60
70
80
90
100
0 1 2 3 4 5 6 7 8 9 10 11 12 13 14 15 16 17 18 19 20 21 22 23
Hours
Flight EntryRate EC RUH Workload(%) PC RUH Workload(%)
Figure 1
The workload recorded during the peak hour can be greater (res. lower) than the predefined threshold. The traffic amount will then be decreased (res. increased) until the peak hour workload reaches this threshold. The flights to be added or removed must preserve the distribution of aircraft performance, as well as their temporal and space distribution. Users of CAPAN observed that a given number of flights could generate different workload figures. Controller workload is influenced by on complexity aspects, and is not merely a function of the number of flights. Complexity has a direct impact on capacity, which can even vary during the day. For these reasons, CAPAN needs complementary methods.

EUROCONTROL Experimental Centre Network Capacity and demand management- NCD
Project COCA – EEC Note No. 21/03
6
3.3 Capacity evaluation by regression method The spot cloud on Figure 2 shows the correspondence between the workload and the traffic amount (number of flights entering) that generated it. There are several spots on each column, because the same number of flights may generate different workloads. This is a consequence of complexity variations: when a situation is complex, the workload is higher for the same number of flights. The yellow line in Figure 2 is a parabolic regression between traffic demand and executive controller workload. The abscissa of the intersection between this curve and the predefined threshold is the sector capacity value by regression.
Figure 2
The CAPAN team analysed the differences between their threshold and regression methods, and concluded that:
The Capacity value by regression will generally be higher than the CAPAN capacity value when the peak hour of the sector corresponds to the most complex traffic situation of the sector. This is generally the case.
The capacity value by regression may be lower than the CAPAN value when the peak hour corresponds to a high traffic demand of “non-complex flights pattern” which only generates the standard ATC workloads.
When the capacity value by regression is close to the CAPAN value, it indicates that the peak hour of the sector is representative of the average traffic complexity of traffic during the day.
If the workload recorded during the 24-hour simulation is small, the capacity value by regression analysis may be too high. (Ref. [1])

EUROCONTROL Experimental Centre Network Capacity and demand management- NCD
Project COCA – EEC Note No. 21/03
7
4 PESSIMISTIC REGRESSION METHOD: IMPROVEMENT OF CAPAN REGRESSION METHOD
The feature of the regression method we want to draw attention to is that it gives the same weight to the greater and lesser complex traffic patterns that occur in the sector. However, controllers have a safety responsibility, and their duty demands that they are pessimistic in their expectations. Hence, we devised methods to select the more complex situations before estimating the capacity by a workload vs. number of flight regression.
4.1 First pessimistic method A pessimistic way to consider a workload/traffic point cloud is to look only at its upper half. In Figure 3, the yellow line is the standard parabolic regression curve from where the CAPAN method would directly take its capacity estimate. One can remove all the cloud points that are below this line, and then compute regression over the remaining upper half (mauve line). The abscissa of the intersection of this new regression line and predefined threshold is the new capacity evaluation.
Figure 3
It is clear that this method removes the simpler ATC situations that occurred during the simulations: that is, those where a given number of flights generated a lower-than-average workload.

EUROCONTROL Experimental Centre Network Capacity and demand management- NCD
Project COCA – EEC Note No. 21/03
8
4.2 Second pessimistic method Our next pessimistic capacity estimation is the other way around: for a given workload threshold, we keep only the points that correspond to the fewest number of flights that produced them. Figure 4 shows an instance of this method applied to simulations of EDYCOLO sector. We chose to keep the 3 lowest traffic amounts for each level of workload. Again, the resulting mauve regression line gives a lower estimate of this sector capacity than the standard yellow line.
Figure 4 As the CAPAN estimated value is usually higher than the CFMU declared capacity value, both our pessimistic methods improve the accuracy of the sector capacity prediction. The following results show this improvement in the context of simulations over EDYYUAC airspace.

EUROCONTROL Experimental Centre Network Capacity and demand management- NCD
Project COCA – EEC Note No. 21/03
9
4.3 Results In Table 2, we give a comparison between the capacity value calculated by regression using data given by CAPAN team (RegressWithPtsCapan) and the capacity value in their note (Ref. [1]) (regressCapan).
regressCapan
RegressWithPtsCapan
EBMALNL 52 51 EBMAWS2 49 49 EBMAWSL 47 50 EBMALUX 51 49 EDYCOHI 42 49 EDYCOLO 44 44 EBMALOH 56 56 EDYHALO 46 46 EDYEEHI 48 48 EDYSOLO 45 45 EDYYMNS 51 51 EDYYRHR 45 45 EHDELHI 44 44 EHDELMD 46 46
Table 2
We notice that there is a big difference between the two estimates for EDYCOHI sector, and a slight difference between the estimates for EBMALNL, EBMAWSL and EBMALUX sectors.
RegressWith PtsCapan
RegressPess FirstMethod
Capa Capan
Capa CFMU
RegressPess SecondMethod
EBMALNL 51 47 45 40 45
EBMAWS2 49 49 47 50 48
EBMAWSL 50 47 45 50 46 EBMALUX 49 42 36 - 39 EDYCOHI 49 43 42 33 44 EDYCOLO 44 41 38 37 40 EBMALOH 56 53 52 - 50 EDYHALO 46 43 42 44 41 EDYEEHI 48 41 45 40 42 EDYSOLO 45 42 46 44 44 EDYYMNS 51 47 44 45 42 EDYYRHR 45 42 45 45 41 EHDELHI 44 42 39 38 42 EHDELMD 46 41 43 40 42
Table 3 Table 3 compares the different capacity estimation methods described previously.

EUROCONTROL Experimental Centre Network Capacity and demand management- NCD
Project COCA – EEC Note No. 21/03
10
The pessimistic methods cause adjustments the regression, depending on the whether the cloud points are widely scattered. We note two cases:
Regular progression of the workload: each small interval in the values of the workload is reached by amounts of flights that are also in a small interval. In this case, the first pessimistic method gives the best results (see Figure 3).
Non-regular progression of the workload: there are small intervals in the values of workload that are generated by very different amounts of traffic. The second pessimistic method is more appropriate (see Figure 4)
Remark 1: The correction by the pessimistic methods depends on the width of the point cloud: the wider the cloud, the bigger the correction given by pessimistic methods. The correction also depends also upon the regularity of the cloud (see Table 4).
RegPtsCapans- FirstMethod
RegPtsCapans- SecondMethod
EBMALNL 4 6 EBMAWS2 1 1 EBMAWSL 3 4 EBMALUX 7 10 EDYCOHI 5 4 EDYCOLO 3 4 EBMALOH 4 7 EDYHALO 2 4 EDYEEHI 2 7 EDYSOLO 2 1 EDYYMNS 4 9 EDYYRHR 3 5 EHDELHI 2 2 EHDELMD 5 4
Table 4
For instance, consider EDYYMNS sector. The three capacity values obtained by the regression method and the two pessimistic ones are very different: 51 for the classic regression method, 47 for the first pessimistic method and 42 for the second pessimistic one. Because of the width of the cloud, the first pessimistic method “gains” 4 capacity points. However, we see that our cloud is non-regular: a small interval of workload percentage as [50, 55] corresponds to widely different traffic amounts, between 29 and 51 flights. This is why the second pessimistic method (blue line in Figure 5) gives such a sizeable capacity correction, 7 points.

EUROCONTROL Experimental Centre Network Capacity and demand management- NCD
Project COCA – EEC Note No. 21/03
11
Figure 5
Remark 2: When the sector point cloud is non-regular, the capacity adjustment obtained via the second pessimistic method is greater than that produced by the first one. As this effect may lead to very different capacity estimates, one has either to find a compromise between them, or to decide which is the more likely, by considering additional parameters such as sector history and statistics, or operational expertise. 4.4 Averaging the two pessimistic methods
A possible compromise is to take the mean of the two ‘pessimistic’ capacity values. If the left side of the point cloud is smooth (regular), then both methods give similar capacity evaluations. Otherwise, the second method bases its evaluation on the very worst cases, which could be too rare to be very meaningful. In this case, we use the two methods and take the average as a capacity evaluation. The values we obtained are presented in Table 5.
RegressWith PtsCapan
MeanPess Method
Capa Capan
Capa CFMU
EBMALNL 51 46 45 40 EBMAWS2 49 49 47 50 EBMAWSL 50 46 45 50
EBMALUX 49 41 36 - EDYCOHI 49 44 42 33 EDYCOLO 44 41 38 37 EBMALOH 56 51 52 - EDYHALO 46 42 42 44 EDYEEHI 48 43 45 40 EDYSOLO 45 43 46 44 EDYYMNS 51 45 44 45 EDYYRHR 45 41 45 45 EHDELHI 44 42 39 38 EHDELMD 46 42 43 40
Table 5

EUROCONTROL Experimental Centre Network Capacity and demand management- NCD
Project COCA – EEC Note No. 21/03
12
5 INTRODUCTION TO A NEW METHODOLOGY TO ASSESS SECTOR CAPACITY AT A MACROSCOPIC LEVEL
Workload evaluation, capacity assessments are cornerstones in many EUROCONTROL studies: for example, to test the efficiency of a new process, of a new route design... These evaluations have to be processed fast, at different time scales and different areas depending on the different requests. The preparation of a workload computing study by CAPAN process is quite demanding. One needs operational experts’ agreement on the definition of many predefined tasks, along with their timing in seconds, and all the control parameters to trigger the ATC action. CAPAN is a complex and long process, therefore, a simplified formula to compute the controller workload was developed (Ref. [3]). It is less accurate than the RAMS process, but can be refined by means of workload parameters optimisation (Ref. [5]) and sector classification by their traffic complexity (Ref. [4]). This simplified formula satisfies the conditions given in 2(Objective) and is suit to a new COCA methodology to assess capacity. We describe this formula and we present briefly this method.
5.1 Simplified formula to compute the workload The simplification is based on the assumption that, roughly speaking, every ATC action falls into one of these three task categories:
Routine task Level change monitoring task Conflict monitoring task
For each task, we need:
Task duration: weighted by a time in second to execute the task Task occurrences: the number of routine, climb/descent, and conflict tasks
O* t O* tO t WL ClClCnfCnfFlFl ++= *
ClCnfFl O ,O ,O respectively, are the occurrences of routine, climb/descent, and conflict tasks during the time period considered (one hour typically).
ClCnfFl t, t,t respectively, are the durations of routine, climb/descent and conflict tasks.

EUROCONTROL Experimental Centre Network Capacity and demand management- NCD
Project COCA – EEC Note No. 21/03
13
This formula has been developed in order: To be able to isolate the main workload drivers To be able to compute the necessary parameters for all of Europe To lose as little accuracy as possible, compared to RAMS
RAMS is an “ATC event generator that reports its discrete events, or triggers, thereby enabling the modeller to program a unique set of activities, including user-defined sets of ATC tasks and ATC participants as required, to perform a simulation study”. (Ref.[3]) To assess the weights of these 3 macro-tasks in the simplified workload formula, RAMS experts split each of their “elementary” tasks into three components (routine, level clearance and conflict resolution). Each of these components received an average of their sub-tasks weights as a workload coefficient (ti). Then, they compared two workload curves during a simulation: one resulting from the usual micro-tasks; the other using the correspondence between micro and macro-tasks. These curves, shown in Figure 6, validated the concept of a simplified formula.
Figure 6: Comparison of workload (RAMS / Simplified formula)
5.2 Data manipulation In order to satisfy the objectives of simplified formula development and more generally, to product appropriate data for complexity analysis, EEC has developed the WOODSTOCK toolbox (Ref. [3]) WOODSTOCK: Inputs:
Flight plan ACC configuration (e.g. sectorisation at different times of the day) Geometrical description of ACC structures (e.g. lists of waypoints and navaids)

EUROCONTROL Experimental Centre Network Capacity and demand management- NCD
Project COCA – EEC Note No. 21/03
14
Output:
Traffic counts Traffic density Number of sector entries per flight Number of conflicts Measures of flight level changes Average distance flown per flight Traffic distribution by aircraft type Etc.
WOODSTOCK produced an output in the from of a count of the three main tasks occurrences (flight entries, conflicts, and level changes) in the simplified formula for the fourteen sectors of Maastricht Upper Area Centre (UAC). For this study, we used “standard “ duration tasks. Standard duration tasks were defined as the average tasks’ duration computed for some representative ACC during the validation process in [3]. An improvement of the calculation of these duration tasks depending on complexity is in progress (Ref. [5]), as mentioned in the objectives. Standard task duration used (in seconds):
Routine task = 43 Climbs and descent monitoring task = 15 We introduce a specialisation of the conflict term, by dispatching them into three sets of conflict categories.
Crossing_Conflict monitoring task = 70 Along_Track_Conflict monitoring task = 10 Opposite_Track_Conflict monitoring task = 10
We apply the formula below, which gives the controller workload, assuming they are working with standard equipment and applying standard procedures.
WL = 43*nbFl + 70*nbCnfCross + 10*nbCnf (Tr + Opp) +15*nbMcl
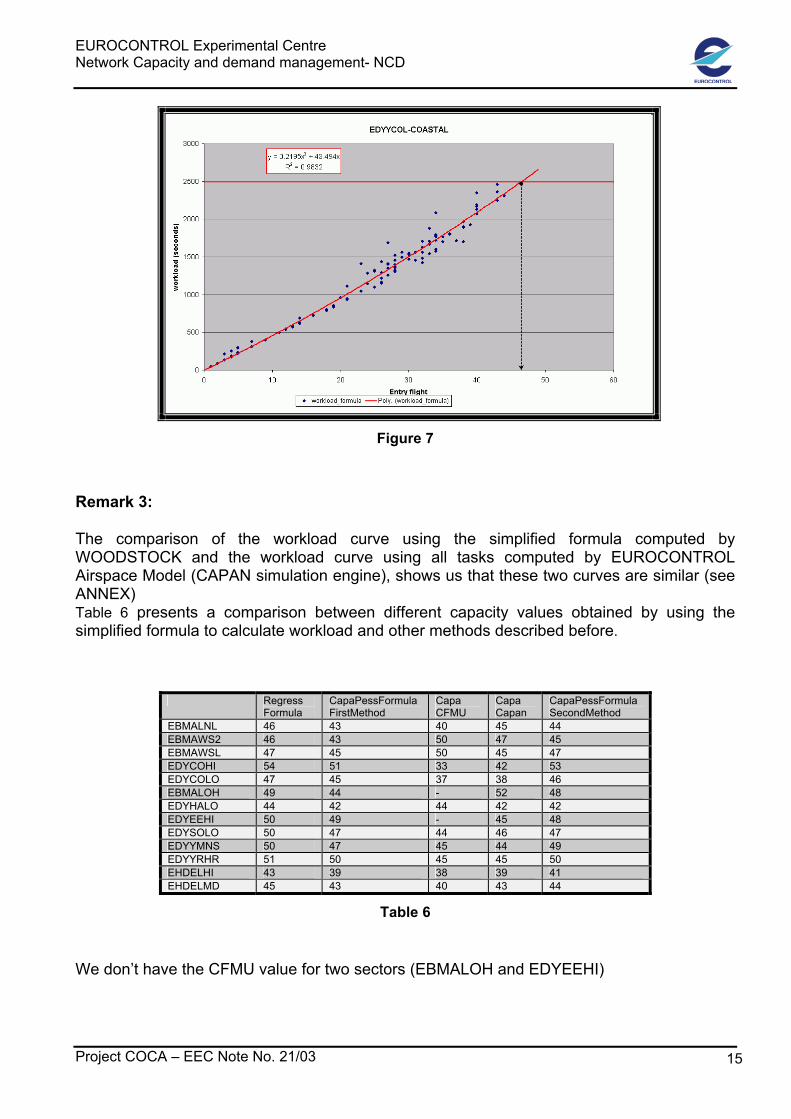
5.3 Capacity assessment by using simplified formula As we compute the workload by the simplified formula, we can plot the values (traffic demand / workload). Then, we draw a parabolic regression through the point cloud obtained. The abscissa of the intersection of this line and the predefined threshold is the sector capacity by regression.
EUROCONTROL Experimental Centre Network Capacity and demand management- NCD
Project COCA – EEC Note No. 21/03
15
Figure 7
Remark 3: The comparison of the workload curve using the simplified formula computed by WOODSTOCK and the workload curve using all tasks computed by EUROCONTROL Airspace Model (CAPAN simulation engine), shows us that these two curves are similar (see ANNEX) Table 6 presents a comparison between different capacity values obtained by using the simplified formula to calculate workload and other methods described before.
Regress Formula
CapaPessFormula FirstMethod
Capa CFMU
Capa Capan
CapaPessFormula SecondMethod
EBMALNL 46 43 40 45 44 EBMAWS2 46 43 50 47 45 EBMAWSL 47 45 50 45 47 EDYCOHI 54 51 33 42 53 EDYCOLO 47 45 37 38 46 EBMALOH 49 44 - 52 48 EDYHALO 44 42 44 42 42 EDYEEHI 50 49 - 45 48 EDYSOLO 50 47 44 46 47 EDYYMNS 50 47 45 44 49 EDYYRHR 51 50 45 45 50 EHDELHI 43 39 38 39 41 EHDELMD 45 43 40 43 44
Table 6
We don’t have the CFMU value for two sectors (EBMALOH and EDYEEHI)
EUROCONTROL Experimental Centre Network Capacity and demand management- NCD
Project COCA – EEC Note No. 21/03
16
Remark 4: When the capacity estimation by regression method is too low or too high, the pessimistic method does not bring an improvement. If this is so, then we have overestimated or underestimated the workload. Therefore, our standard task duration is not applicable to those sectors.
6 CONCLUSION & NEXT STEPS Pessimistic methods improve the quality of the capacity estimates obtained by the regression method. But, a higher quality level can be reached by using specific complexity based macroscopic workload models to replace the average tasks model. Three steps can refine these methods:
Classify the sectors into homogenous groups (in terms of complexity (Ref. [4]). If we use this classification, we can allocate the same duration tasks for all sectors in the same group resulting in good workload estimation.
Use an optimisation method developed by COCA team (Ref. [5]) to obtain good task durations for each group. The results will be published after some validation.

EUROCONTROL Experimental Centre Network Capacity and demand management- NCD
Project COCA – EEC Note No. 21/03
17
Acknowledgements This work has been done with the help of Thomas CHABOUD, especially for the macroscopic workload models [3]. We would like to thank Jean-Michel LENZY for the CAPAN data he provided, and Raymond DOWDALL for his operational remarks and suggestions.

EUROCONTROL Experimental Centre Network Capacity and demand management- NCD
Project COCA – EEC Note No. 21/03
18
7 BIBLIOGRAPHY [1] Maastricht UAC RCSM study final report, Technical Appendix [2] Maastricht UAC RCSM study [3] Investigating the Air Traffic Complexity, Potential impacts on workload and costs, EEC Note No. 11/00
[4] Air Traffic Complexity Indicators & ATC Sectors Classification, 21 st dasc October 2002 [5] Adaptation of Workload Model by Optimisation Algorithms and Sector Capacity Assessement, to be published as an EEC Note shortly [6] Assessing Future ATC Capacity Requirements- A User Guide, Version 1.1, July 2002 EUROCONTROL Capacity Enhancement Function [7] The FAP Methodology, EEC Note No.06/00

EUROCONTROL Experimental Centre Network Capacity and demand management- NCD
Project COCA – EEC Note No. 21/03
19
ANNEX: Comparison of the workload curve using the simplified formula computed by WOODSTOCK and the workload curve using all tasks computed by EUROCONTROL Airspace Model
Figure 8: Workload (CAPAN), EDYYCOL-COASTAL sector
Figure 9: Workload (Formula), EDYYCOL-COASTAL sector

EUROCONTROL Experimental Centre Network Capacity and demand management- NCD
Project COCA – EEC Note No. 21/03
20
Figure 10: Workload (CAPAN), EDYRRUH-RUHR sector
Figure 11: Workload (Formula), EDYRRUH-RUHR sector

EUROCONTROL Experimental Centre Network Capacity and demand management- NCD
Project COCA – EEC Note No. 21/03
21
Figure 12: Workload (CAPAN), EBMAWSH-WEST sector
Figure 13: Workload (Formula), EBMAWSH-WEST sector

EUROCONTROL Experimental Centre Network Capacity and demand management- NCD
Project COCA – EEC Note No. 21/03
22
Figure 14: Workload (CAPAN), EHDEDEL-DELTA sector
Figure 15: Workload (Formula), EHDEDEL-DELTA sector

EUROCONTROL Experimental Centre Network Capacity and demand management- NCD
Project COCA – EEC Note No. 21/03
23
CONTACTS
European Organisation EUROCONTROL for the Safety of Rue de la Fusée, 96 Air Navigation B-1130 Brussels ___________________ _________________ Organisation EUROCONTROL Experimental Centre européenne pour la Centre de Bois des Bordes B.P.15 sécurité de la F - 91222 Brétigny-sur-Orge CEDEX navigation aérienne FRANCE