Euro money market study 2014, April 2015
86
30° 53% 100% 3,5E 7,5E 6E E E E 80° 6E 6E E April 2015 Euro money market study 2014
Transcript of Euro money market study 2014, April 2015

30°
53%100%
3,5E
7,5E
6E
E
E
E
80°
6E
6E
E
April 2015
Euro money market study
2014

2Euro money market study, 2014
© European Central Bank, 2015
Postal address: 60640 Frankfurt am Main, GermanyTelephone: +49 69 1344 0Internet: www.ecb.europa.eu
All rights reserved. Reproduction for educational and non-commercial purposes is permitted provided that the source is acknowledged.
ISSN 1830-3781 (online)ISBN 978-92-899-1562-5 (online)Digital object identifier: 10.2866/937862 (online) EU catalogue number: QB-XX-15-001-EN-N (online)

3Euro money market study, 2014
Contents
Executive summary 5
1 Introduction 8
2 The monetary policy environment in 2013 and 2014 9
3 The unsecured market 16
3.1 Turnover analysis 16
3.2 Maturity analysis 18
3.3 Market structure 22
4 The secured market 28
4.1 Turnover analysis 28
4.2 Maturity analysis 30
4.3 Market structure 32
4.4 Triparty repos 35
5 Developments in the over-the-counter derivatives markets 44
5.1 Turnover analysis 44
5.2 Maturity analysis 44
5.3 Market structure 48
6. The short-term interest rate futures and options markets 52
6.1 EURIBOR-related instruments 52
6.1.1 Market developments and volatility 52
6.1.2 EURIBOR futures and options trading volumes 53
6.2 Bank for International Settlements data 54
6.3 Money Market Survey qualitative data 55
7. The short-term securities market 60
7.1 Analysis of turnover in the secondary market 60
7.2 Outstanding amounts and issuance 60
7.3 Efficiency and liquidity of the short-term securities market 61
7.4 Market structure 62
8. Cross-market segment analysis 67
8.1 Turnover analysis 67
8.2 Maturity analysis 70
8.3 Market structure 71

4Euro money market study, 2014
Boxes1 The latest ECB non-standard measures (June-September 2014) 10
2 Recent developments in the use of collateral in Eurosystem credit operations 14
3 The ECB’s position on the EURIBOR reform 19
4 The impact of the negative deposit facility rate on the euro money market: an initial assessment 23
5 Developments in secured money markets amid negative interest rates and regulatory requirements – evidence from GC Pooling 38
6 The FX swap market: some evidence of market access recovery after the crisis 50
7 Segmentation in the euro money market 56
8 The French commercial paper market in 2013-14 63
9 Money market funds regulation 66
Annexes1 Credit institutions participating in the EMMS 2014 75
2 Technical annex 79
3 Glossary 81

5Euro money market study, 2014
EXECUTIVE SUMMARY
This tenth study on the structure and functioning of the euro money market is based on a survey conducted by the European Central Bank (ECB) and the national central banks that are members of the European System of Central Banks (ESCB)1. The 2014 Euro Money Market Study was conducted by a working group comprising staff members from the ECB and national central banks which reported to the ESCB’s Market Operations Committee. The survey asked panel banks (listed in Annex 1) to indicate their total turnover in various money market instruments during the second quarters of 2013 and 2014 and to answer a number of qualitative questions, including those introduced in 2012, on the impact of banks’ counterparty limits on their money market activities.
The main findings of the study show that the euro money markets are in a healing phase following the deterioration identified in the 2012 study. The Eurosystem’s non-standard policy measures, in an environment where the euro money market remains fragmented, seem to have contributed to a stabilisation and recovery in market activities in a context of declining excess liquidity. This suggests that, overall, markets have been functioning better in 2014.
Aggregate turnover for all instruments in the euro money market expanded by 4% to €79 trillion in the second quarter of 2014 compared with the second quarter of the previous year, following an increase in turnover of 6% in 2013. The gradual recovery in money market activity in 2013 was, therefore, confirmed in 2014 thanks to a persisting improvement in risk perception. This allowed repayments of the three-year LTROs to gather speed prior to the maturity date, which led to a significant decline in surplus liquidity. The institutions which repaid their LTROs were able to replace the central bank funding with market sources of funding, despite the continued high level of market fragmentation.
The improvement in market functioning over the past two years is underpinned by the stabilisation in risk budgets in 2013 and further improvement in the 2014 survey reported by the survey participants. As in previous years, participants were asked to assess how their interbank trading volumes and the number of their counterparties were expected to develop in the light of expected changes to the risk limits. In 2013 banks expected that limits would not be changed in comparison to 2012. In 2014 the overall results suggest that the dynamics have improved: the number of banks expecting increasing risk limits rose significantly, albeit from low levels, while the number of respondents expecting tighter or unchanged risk limits fell. Similarly, perceived efficiency and liquidity improved in the unsecured and secured markets, despite the large divergence between the unsecured funding instruments and the secured market.
Local bias remains a structural factor for money market trading activity. Despite the broad improvements observed in the qualitative part of the survey, more granular data suggest that the higher activity in unsecured markets could essentially be attributed to non-distressed jurisdictions. Reporting banks in these countries
1 The ESCB consists of the ECB and the national central banks of the European Union (EU) Member States.

6Euro money market study, 2014
generally have satisfactory market access and can raise funds across different maturities. By contrast, banks from distressed jurisdictions still report low usage of unsecured funding instruments. On the borrowing side in particular, a limited number of banks are still active: the borrowed amounts are limited and transactions generally occur in shorter tenors than in non-distressed jurisdictions despite the remarkable spread compression since 2012. Also in the repo market the local bias, illustrated by the usage of national bonds as collateral in secured operations, remains significant – although it declined somewhat – as in a number of countries domestic bonds remain the main source of collateral for the secured money market transactions.
However, the improvements in market functioning were uneven across market segments. In the unsecured market, cash borrowing and lending by the banks in the panel increased by 39% to €4.58 trillion. The increase in total turnover in percentage terms should, however, be seen in the light of the low share of unsecured instruments, which still remains below its level in 2012 despite the significant rebound of activity in percentage terms. Total trading activity remained concentrated in maturities of one week or less. Overnight transactions accounted for 86% of all lending activity, where the maturity structure remained broadly stable. By comparison, borrowing activity became more concentrated in the overnight transactions, whose share rose from 67% in 2013 to 81% in 2014.
Owing to regulatory developments and risk aversion, the secured market remained the largest money market segment. Total turnover in secured lending and borrowing rose by 2% to €32 trillion, with a stable breakdown of the trading volumes across the maturities. Trading in longer maturities accounted for less than 7% of total secured trading. However, this modest rise in the overall turnover represents a consolidation of the secular trend at work since the last decade. This dominance of secured funding tools is further illustrated by the stable and very large share of secured trades concluded via a Central Clearing Counterparty (73% of bilateral trades versus a revised 74% share in 2013) that usually allows for lower capital consumption.
Higher activity was also visible in secondary markets for short-term papers, where volumes rose by 12% in the 2014 survey compared to 2013, although the increase was mainly linked to trading activities in short-term government securities, as secondary market activity in securities issued by banks declined in most jurisdictions. With regard to the maturity structure of the short-term paper market, structural shifts towards longer maturities were reported. The low interest rate environment in the euro area supported bank issuance and secondary market activity in longer tenors. In distressed jurisdictions, issuance and secondary market activity in longer maturities increased in an environment of a more active search for yields by money market investors.
Trading activity in various segments of the derivatives market in 2014 was subject to larger changes compared to previous years. Expressed in relative terms, the most significant changes in activity were observed in the OIS segment, where turnover increased by 47%. In the other IRSs segment, turnover in 2014 decreased by 21%, offsetting the 19% increase observed in 2013. FRA volumes decreased by 10%, whereas FX swap volumes increased by 9% and cross-currency volumes by 8%. Overall, the reporting banks attributed higher market volatility in the derivatives

7Euro money market study, 2014
market to an increase in hedging needs in the context of a lower liquidity surplus and market expectations of further ECB monetary policy measures.
Finally, money market activity cannot be disentangled from the broader monetary policy context and market environment. In 2013 and the first half of 2014, early repayments of the three-year LTROs led to a rapid decline in excess liquidity, which, at times, led to higher volatility of money market rates. However, the ECB monetary policy decisions of June 2014 and liquidity injections in the third quarter of 2014, as a result of the TLTROs and asset purchase programmes, led to a rapid decline in both short and long-term rates and supported market expectations of comfortable excess liquidity levels and low levels of money market rates in the longer term. At the same time, market credit risk sentiment improved and the spread compression initiated in 2013 continued in 2014, triggered in part by a number of rating upgrades for some distressed countries and in part by banks’ ongoing balance sheet repairs.
This more constructive environment led markets to anticipate a successful comprehensive assessment and asset quality review and, in turn, contributed to lower risk premia in 2014.

8Euro money market study, 2014
1 Introduction
In the second quarter of 2014, under the auspices of the Market Operations Committee of the European System of Central Banks (ESCB) and in cooperation with the Money Market Contact Group of the European Central Bank (ECB), the ECB and the 28 national central banks (NCBs) of the ESCB conducted a quantitative and qualitative survey on the euro money market among banks in the 28 EU countries and one non-EU country1. On the basis of that survey, the 2014 Euro Money Market Survey (hereinafter the EMMS) analyses the euro money market in terms of trends and developments in its integration and efficiency, following on from similar studies conducted in the second quarters of previous years on a biannual basis. The 2014 study covers the second quarters of 2013 and 2014, for which each participating bank reported the total turnover in each of the money market segments during these two periods. Each NCB selected a number of banks with a view to obtaining a representative coverage of euro money market activities. Altogether, a total of 154 banks participated in the survey. The country breakdown of the participating banks is shown in Table 1.
The methodological notes contained in the questionnaire can be found in Annex 1.
Compared with 2012, the panel of 154 banks represents a net decrease by 18 counterparties, with fewer banks in Portugal (-4 banks), Spain, Estonia and Greece (-2 banks each), Germany, Cyprus, Luxembourg, the Netherlands, Latvia, Bulgaria, Poland and Switzerland (-1 bank each).
The purpose of the study is to highlight the main trends affecting the structure of the euro money markets, and the way in which the different market segments reacted to the crisis. To this end, we use mainly quantitative data from the EMMS, based on the information provided by the participating banks on total turnover.
Results from the qualitative questions have also been used. The answers are weighted by the turnover data reported by each institution in a particular market segment.
The number of banks participating in each of the successive annual surveys varies considerably, and also changes from one market segment to another, as not all banks are active in all segments of the money market. Hence two types of samples were used for the analysis, depending on the time frame. The first sample group, which was used to analyse developments in the euro money market over the past two years, included all reporting banks (i.e. 154 banks). The second sample group, which was used for a longer-term analysis of the period since 2000, when the survey was first conducted, is referred to as “the constant panel of banks”. It comprises 101 banks in 2014, down from a peak of 114 banks in 2009, reflecting the sector’s ongoing consolidation. Nevertheless, the base year for the EMMS is 2003,
1 Two of the panel banks are from Switzerland.
Table 1Country breakdown of participating banks in 2014
Austria 8 Greece 5 Portugal 10
Belgium 3 Hungary 3 Romania 3
Bulgaria 3 Ireland 6 Slovakia 2
Cyprus 2 Italy 8 Slovenia 3
Czech Republic 8 Latvia 3 Spain 11
Denmark 1 Lithuania 3 Sweden 3
Estonia 1 Luxembourg 2 Switzerland 2
Finland 2 Malta 5 UK 16
France 9 Poland 11
Germany 16 Netherlands 5
Total 154

9Euro money market study, 2014
on account of the more representative nature of the enlarged panel. The effects of the changes in the constant panel of banks are detailed in Annex 1.
Finally, in addition to the results of the survey, other data sources have been used. The section on the monetary policy environment in 2013 and 2014 (Section 2) elaborates on data from the ECB on the use of collateral in Eurosystem operations; the section on the secured market (Section 4) also draws on data from the International Capital Market Association (ICMA) survey; the futures and options markets section (Section 6) relies on EURIBOR data published by Bloomberg, Intercontinental Exchange, NYSE Liffe and the BIS; the section on the short-term securities market (Section 7) analyses data from ECB securities issues statistics, STEP (short-term European paper); and the section on cross-market analysis (Section 8) includes data from Bloomberg and Reuters. Data from Eurex Repo and STOXX have been used in Box 2, Box 4, Box 5 and data from the Banque de France have been used in Box 6.
2 The monetary policy environment in 2013 and 2014
Over the past two years, the Eurosystem’s monetary policy has continued to operate in a challenging environment. In spite of some improvements in economic confidence, economic recovery has remained weak and uneven among euro area countries. Inflation as well as credit dynamics have remained subdued. In 2013 real GDP in the euro area declined by 0.4% for the year as a whole, while in the third quarter of 2014 it rose by 0.8% compared with the same quarter of the previous year. The annual growth rate of the broad monetary aggregate M3 decreased from 3.5% in January 2013 to 3.1% in November 2014. In addition, despite significantly improved funding conditions, mainly driven by the ECB non-standard monetary policy measures taken in the course of 2012, loans to the private sector, adjusted for loan sales and securitisation, remained negatively oriented (from – 0.9% in year-on-year terms in January 2013, to – 1.5% in August 2014, and – 0.9% in November 2014). Furthermore, continuous downward inflationary pressures have been affecting the euro area economy. Since January 2013, annual HICP inflation in the euro area has plummeted, decreasing from 2% to – 0.2% in December 2014 (flash estimate).
To ensure price stability over the medium term and to support the gradual economic recovery, the Governing Council cut the key ECB interest rates twice in 2013 and twice in 2014. In 2013 the interest rate on the main refinancing operations (MROs) was reduced from 0.75% to 0.25%, the rate on the marginal lending facility was lowered from 1.50% to 0.75%, while the rate on the deposit facility remained unchanged at 0.00%. On 5 June 2014, as part of a package of measures (see Box 1 entitled “The latest ECB non-standard measures – June-September 2014”), the Governing Council reduced the interest rate on the MROs by 10 basis points to 0.15% and the rate on the marginal lending facility by 35 basis points to 0.40%. The rate on the deposit facility was lowered by 10 basis points to – 0.10%, entering negative territory for the first time, and reintroducing a symmetric corridor system2
2 The negative deposit rate also applied to reserve holdings in excess of the minimum reserve requirements and other deposits held with the Eurosystem. For further details, see the ECB’s website.

10Euro money market study, 2014
(for an analysis of the effects of the negative deposit rate see Box 4 entitled “The impact of the negative deposit rate on the euro money market: an initial assessment”). On 4 September 2014, the Governing Council decided to further lower the interest rate on the MROs to 0.05%, on the marginal lending facility to 0.30% and on the deposit facility to – 0.20%. The current level of the key ECB interest rates is considered to be the lower bound.
Since July 2013, the Governing Council has been providing forward guidance on the future path of the ECB’s policy interest rates with the aim of aligning market expectations more firmly with the monetary policy stance and curbing interest rate volatility over the policy-relevant horizon. The forward guidance, in accordance with the ECB’s mandate and its monetary policy strategy, has been based on three main elements, namely that: (i) the expected path for the key interest rates is based on the medium-term outlook for inflation; (ii) the extended period of time referred to by the Governing Council is flexible and; (iii) the underlying conditions, upon which the expectations regarding the key ECB interest rates are based, reflect the ECB’s strategic two-pillar approach to assessing risks to price stability. The adoption of forward guidance led to an immediate flattening of the money market curve, and in the following months money market forward rates’ sensitivity to macroeconomic data releases also declined.3
In addition, the Governing Council decided to maintain all Eurosystem refinancing operations as fixed-rate full allotment tender procedures for as long as necessary, and at least until the end of the reserve maintenance period ending in December 2016. It was also decided that the existing eligibility of additional assets as collateral would be extended under the additional credit claims framework, at least until September 2018.
Box 1 The latest ECB non-standard measures (June-September 2014)
In line with forward guidance on the key ECB interest rates and in order to further enhance the functioning of the monetary policy transmission mechanism and support the provision of credit to the broad economy, additional non-standard measures were announced in June and September 2014.
On 5 June 2014, the Governing Council announced, as part of a package of measures,4 the conduct of a series of eight targeted longer-term refinancing operations (TLTROs) with the aim of supporting bank lending to households and non-financial corporations.5 All TLTROs will mature in September 2018. Counterparties were initially entitled to borrow 7% of the total amount of
3 For a further analysis of the forward guidance and its effects, see http://www.ecb.europa.eu/pub/pdf/other/art1_mb201404en_pp65-73en.pdf and Box 1 in the 2013 ECB Annual Report.
4 The package included the discontinuation of the Eurosystem’s special-term refinancing operations with a maturity of one maintenance period and the suspension of the weekly fine-tuning operation sterilising the liquidity injected under the SMP, in addition to the abovementioned reduction in the key ECB interest rates, the prolongation of fixed-rate full allotment tender procedures and the extension of the existing eligibility of additional assets as collateral.
5 For the operational modalities of the TLTROs, see https://www.ecb.europa.eu/press/pr/date/2014/html/pr140729.en.html

11Euro money market study, 2014
their loans to the euro area non-financial private sector, excluding loans to households for house purchases that were outstanding on 30 April 2014. The combined initial borrowing allowance for the euro area, applicable to the first two tender operations, was estimated to amount to some €400 billion. The first TLTRO was conducted on 18 September, allotting a total of €82.6 billion to 255 counterparties.6 The second operation was conducted on 11 December, allotting €129.8 billion to 306 counterparties, hence a total allotment of €212.4 billion for the two initial operations. In addition, from March 2015 to June 2016, all counterparties will be able to borrow, in the next six quarterly tender operations, up to three times the amount of their net lending to the euro area non-financial private sector over a specific period in excess of a specified benchmark. The benchmark is dependent on banks’ past lending behaviour in the 12-month period up to 30 April 2014. The interest rate on all TLTROs is fixed over the life span of each operation, at the rate on the Eurosystem’s main refinancing operations at the time of take-up, plus a fixed spread of 10 basis points. This fixed spread was removed on 22 January 2015. Starting 24 months after each TLTRO, and at a semi-annual frequency thereafter, counterparties will have the option to make early repayments. Those counterparties that have not fulfilled certain conditions regarding the volume of their net lending to the real economy will be required to pay back borrowings early in September 2016.
On 4 September 2014, the Governing Council announced the start of two new asset purchase programmes: an ABS purchase programme (ABSPP) and a new covered bond purchase programme (CBPP3). Both programmes will last for at least two years and are aimed at enhancing the transmission of monetary policy, supporting the provision of credit to the euro area economy and providing further monetary policy accommodation.7 The eligibility of assets to be bought under both programmes is based on the Eurosystem’s collateral framework, with some adjustments to take into account the difference between accepting assets as collateral and buying assets outright. In addition, to ensure that the programmes can include the whole of the euro area, ABSs and covered bonds from Greece and Cyprus that are currently not eligible as collateral for monetary policy operations are subject to specific rules with risk-mitigating measures. The Eurosystem will follow appropriate credit risk and due diligence procedures on the purchasable asset universe on an ongoing basis.
Under the ABSPP, the ECB decided to purchase a broad portfolio of simple and transparent euro-denominated asset-backed securities with underlying assets consisting of claims against the euro area non-financial private sector, supporting the ABS market in facilitating new credit flows to the economy. Senior and guaranteed mezzanine tranches are eligible to be purchased in both the primary and secondary markets. In addition, purchases of fully retained securities are subject to some participation by other market investors.
Under the CBPP3, the Eurosystem decided to purchase a broad portfolio of euro-denominated covered bonds issued by monetary financial institutions (MFIs) domiciled in the euro area. Unlike the two previous covered bond programmes, the CBPP3 does not have a pre-fixed purchase amount or a pre-set deadline. The purchases can be conducted in both the primary and secondary markets and are carried out by the ECB and the Eurosystem NCBs by means of direct purchases distributed across the euro area. Fully retained issues are eligible for CBPP3, while covered bonds
6 For further details on the first TLTRO, see Box 1 in the October 2014 ECB Monthly Bulletin. 7 For further operational details of the ABSPP and the CBPP3, see http://www.ecb.europa.eu/press/pr/
date/2014/html/pr141002_1.en.html

12Euro money market study, 2014
issued by entities suspended from Eurosystem credit operations are excluded for the duration of the suspension. In addition, the CBPP3 portfolio is available for lending.
The newly-decided measures are geared towards increasing the size of the Eurosystem’s balance sheet in line with its 2012 levels. At the end of 2014, the Eurosystem had purchased around €30 billion worth of bonds under the CBPP3 and €2 billion under the ABSPP.
Against this background, excess liquidity has decreased significantly over the past two years. As a consequence of improved financial market conditions resulting in early repayments of the amounts borrowed in the three-year longer-term refinancing operations (VLTROs) – available since January 2013 – excess liquidity in the banking system declined from more than €600 billion to less than €200 billion in the course of 2013. In 2014 participation in the Eurosystem refinancing operations decreased further, with excess liquidity dropping to around €100 billion. The decline in excess liquidity in the first half of 2014 contributed to an increase in both the level and volatility of overnight interest rates, with EONIA rates at times hovering above the MRO rate (see Chart 1). The risk of an undesired tightening of the monetary policy stance – inconsistent with the ECB’s forward guidance – arising from the high level and volatility of money market rates was mitigated by the ECB’s policy rate cut, the narrowing of the width of the ECB monetary policy corridor, thus restoring a symmetric corridor system around the MRO rate, and the announcement of additional measures in June 2014.
Over the past two years, the United States Federal Reserve’s monetary policy stance has remained highly accommodative, leaving the target range for the federal funds rate unchanged at 0.00% to 0.25%.
The Federal Reserve’s balance sheet further expanded owing to purchases of long-term Treasury bonds and mortgage-backed securities.
In May 2013, owing to the strengthening of the macroeconomic framework,8 the Fed announced the possibility of tapering its purchases. Since January 2014, tapering has led to an overall reduction in monthly purchases from USD 85 billion to USD 15 billion in October, when the Federal Open Market Committee (FOMC) decided to conclude its asset purchase program.
8 In 2013 US real GDP rose by 2.2% year on year, while in the second quarter of 2014 it increased at an annual rate of 4.6%, quarter on quarter, after decreasing by 2.1% in the first quarter.
Chart 1Developments in key ECB interest rates (left-hand scale) and excess liquidity (right-hand scale)(percentages and EUR billions)
0
100
200
300
400
500
600
700
800
900
-0.3
-0.1
0.3
0.1
0.5
0.7
0.9
1.1
1.3
1.5
Jan. Apr. July2013 2014
Oct. Jan. Apr. July Oct.
liquidity surplusEONIAmarginal lending facilitydeposit facilitymain refinancing operation
Source: ECB and EMMI

13Euro money market study, 2014
The FOMC has provided forward guidance for the future path of the federal funds rate based on its assessment of economic and financial conditions. The Committee’s forward guidance included quantitative thresholds related to the unemployment rate and inflation. In March 2014, as the unemployment rate almost reached its 6.5% threshold, the Committee decided to replace the quantitative threshold with a qualitative dimension, which considers a wide range of information on labour market conditions, inflation pressures and expectations, as well as readings on financial developments.
Since the beginning of 2014, differences in the monetary policy cycle between the United States and the euro area widened, as mirrored by the spread widening between the one-year to one-year EONIA forward rates for OISs and USD OISs, contributing to the depreciation of the euro against the US dollar (see Chart 2).
In order to overcome deflation, in January 2013, the Bank of Japan introduced an explicit inflation target of 2%. In the following April, it also introduced “quantitative and qualitative monetary easing” aimed at doubling the monetary base and the amounts outstanding of Japanese government bonds (JGBs) as well as exchange-traded funds (ETFs) within the next two years, and more than doubling the average remaining maturity of JGB purchases. The monetary base was turned into the new operational target, replacing the uncollateralised overnight call rate.
At the end of October 2014, the Bank of Japan decided to accelerate the pace of the increase of the monetary base and asset purchases. As a consequence of this decision, the monetary base would increase
at an annual pace of about JPY 80 trillion, the amount outstanding of the Bank’s JGB purchases would increase at an annual pace of about JPY 80 trillion, and the average remaining maturity would be about seven to ten years. The amount outstanding of the exchange-traded funds (ETFs) and Japan real estate investment trusts (J-REITs) purchases would increase at an annual pace of about JPY 3 trillion and about JPY 90 billion respectively. The Bank would maintain the amounts outstanding of Commercial Paper and corporate bonds at about JPY 2.2 trillion and about JPY 3.2 trillion respectively.
The Bank of England (BoE) has also kept its policy rate on hold at 0.5% since March 2009. It has pursued an asset purchase programme with the aim of boosting nominal demand. In 2013 and 2014, the BoE maintained the stock of purchased assets financed by the issuance of central bank reserves at GBP 375 billion.
At its meeting on 1 August 2013, the Monetary Policy Committee (MPC) decided to provide explicit guidance about the future path of monetary policy and keep
Chart 2One-year to one-year forward for Eonia OIS and USD OIS (left-hand scale) and spot EUR/USD exchange rate (right-hand scale)(percentage)
1.20
1.25
1.30
1.35
1.40
1.45
1.50
-1.5
-1.0
-0.5
0.0
0.5
1.0
1.5
Jan. Jan.Apr. July Oct. Apr. July2013 2014
spreadEONIA 1-year to 1-year forwardUSD OIS 1-year to 1-year forwardEUR-USD
Source: Bloomberg

14Euro money market study, 2014
policy rates steady, at least until the Labour Force Survey headline measure of the unemployment rate had fallen to 7%, subject to certain conditions regarding medium-term inflation expectations and financial stability.
In April 2013, the Funding for Lending Scheme9 was extended for one year to allow for participant borrowing until January 2015 and was adapted to provide incentives for lending to small- and medium-sized enterprises. In November 2013, direct incentives to expand household lending were removed in order to focus on business lending.
Box 2Recent developments in the use of collateral in Eurosystem credit operations
Since the last Euro Money Market Survey (EMMS) of December 2012, the amount of collateral posted with the Eurosystem has decreased, thereby broadly following the reduction in credit provided to Eurosystem counterparties. The average value of marketable and non-marketable assets deposited by counterparties as collateral for Eurosystem credit operations (which consists of liquidity-providing open market operations, the marginal lending facility and intraday credit) declined by around 20% between 2012 and the second quarter of 2014 (see Chart A). This partly reflects some improvement in euro area banks’ funding conditions, which contributed to a reduction in their credit outstanding with the Eurosystem (e.g. as a result of VLTRO repayments). The aggregate level of over-collateralization, measured as the difference between the amount of mobilised collateral and the amount of collateral used for credit operations, increased from 54%, on average in 2012, to 68% in the second quarter of 2014.10
9 The BoE and HM Treasury launched the Funding for Lending Scheme (FLS) on 13 July 2012 to entice banks and building societies to boost their lending to the UK real economy by providing funding (linked to their lending performance) for an extended period (http://www.bankofengland.co.uk/markets/Pages/FLS/default.aspx).
10 This is excluding intraday credit. When taking into account intraday credit, the aggregate level of over-collateralization was 55% in the second quarter of 2014.
Chart ACollateral mobilised with the Eurosystem
(value after haircuts; EUR billions)
0
500
1,000
1,500
2,000
2,500
3,000
2004 2005 2006 2007 2008 2009 2010 2011 2012 2013 2014Q1 Q2
2014
non-marketable assets
corporate bonds
regional government securities peak outstanding creditother marketable assets
covered bank bondscentral government securities
ABSuncovered bank bonds
average outstanding credit
Source: ECB

15Euro money market study, 2014
The composition of the collateral mobilised (see Chart B) has been rather stable over the past two years. Notwithstanding a slight decrease in relative terms, non-marketable assets (in particular credit claims) are still the largest single asset class mobilised, followed by covered bank bonds, central government securities and asset-backed securities (ABSs). When compared to 2008, the use of ABSs has decreased, both in absolute and relative terms. More generally, the share of less liquid assets deposited with the Eurosystem as collateral has stabilised.
The Eurosystem’s operational framework is designed with a view to ensuring the participation of a broad range of counterparties and allowing them to use a broad range of assets as collateral in large-scale monetary policy operations. With a view to protecting the Eurosystem from incurring financial losses in its credit operations, ensuring the equal treatment of counterparties, and enhancing operational efficiency and transparency, all Eurosystem credit operations need to be based on adequate collateral, which is to fulfil certain criteria. The Eurosystem further refined these criteria in the course of 2013 and 2014. The most significant changes were the following.
On 22 March 2013, the Governing Council decided that, as of 1 March 2015, the Eurosystem would no longer accept as collateral the use of uncovered government-guaranteed bank bonds (GGBBs) that had been issued by the counterparty itself or an entity closely linked to that counterparty. Until then, the amount of own-used GGBBs used as collateral is capped at the nominal value of the bonds that had been submitted as collateral on 3 July 2012 (phasing-out).
On 18 July 2013, the Governing Council decided to make some revisions to the Eurosystem’s risk control framework, in particular: (i) a revision of the haircut schedule applied to marketable and non-marketable assets; (ii) a lowering of the rating requirements at issuance (from triple A to single A) for ABSs that comply with loan-level information requirements; (iii) the application of a haircut valuation markdown for own-used covered bonds; and (iv) the adaptation of a common methodology to calculate haircuts for pools of additional credit claims (ACCs).
Chart BComposition of collateral mobilised with the Eurosystem by asset type
(as a percentage)
0
10
20
30
40
50
60
70
80
100
90
2004 2005 2006 2007 2008 2009 2010 2011 2012 2013 2014Q1 Q2
2014
non-marketable assetscorporate bonds
regional government securities
other marketable assets
covered bank bondscentral government securities
ABSuncovered bank bonds
Source: ECB

16Euro money market study, 2014
In order to support the effectiveness of the TLTROs and to ensure that sufficient collateral is available for banks to participate in the scheme, on 5 June 2014, the Governing Council decided to extend, at least until September 2018, the existing eligibility of additional assets as collateral, in particular under the ACC framework.
The changes to the Eurosystem collateral framework have had a limited impact on the aggregate amount of eligible collateral. Since 2012 the nominal amount of eligible marketable assets has remained broadly unchanged at €14 trillion. Collateral availability has been positively affected by reduced market tensions/higher market prices.
3 The unsecured market
3.1 Turnover analysis
In 2013, turnover figures for unsecured cash lending and borrowing continued to decline, falling to the lowest level observed in the period between 2003 and 2013 (see Chart 3). Unsecured lending contracted slightly (8% year on year), while borrowing activity declined substantially (47%). However, 2014 figures showed a partial recovery for both lending (24% with respect to 2013 – the first year-on-year increase since 2010) and borrowing activity (54% with respect to 2013 – the first year-on-year increase since 2011), although they are still a long way from their pre-crisis levels.
Chart 3Cumulative quarterly turnover in unsecured cash lending and borrowing
(index: cash lending volume in 2003 = 100)
0
50
100
150
200
250
300
2003 2004 2005 2006 2007 2008 2009 2010 2011 2012 2013 2014
lendingborrowing
Note: The panel comprised 101 credit institutions.

17Euro money market study, 2014
As reported by the banks participating in the survey, there are several underlying reasons for the decline of unsecured cash lending and borrowing in 2013.
First of all, a comfortable overall market liquidity environment reduced the demand for funds in the interbank market. As regards the lending side, the low interest rate environment provided incentives for banks to seek alternative instruments (such as currency swaps or Treasury bills (T-bills)) to unsecured lending.
Second, further tightening of credit limits among market participants, in combination with an overall balance sheet reduction and the ongoing shift to the secured segment, decreased the volume of unsecured transactions. Over the past two years, in a context of persisting risk aversion, cash trading has been replaced, to a greater extent, by repo transactions, which reached their highest levels in 2014 (see Chapter 4).
Furthermore, survey results suggest that new regulatory initiatives such as Basel III and EMIR may have also contributed to accelerating the deleveraging of banks’ balance sheets. By limiting their trading activities, banks also reduced their reliance on the unsecured money market.
Finally, for a few banks, the decline in the reported unsecured trading volumes is related to an increase in intragroup transactions, which are not included in the EMMS’s turnover. It is worth noting, however, that some participating banks reported an increase in their activity in 2013.
Conversely, the modest recovery during the second quarter of 2014 could be attributed both to the decline in excess liquidity (mainly due to three-year LTRO repayments), which motivated a demand for cash, on the one hand, and to the higher money market interest rates, which contributed to maintaining lending activity, on the other hand.11 Indeed, compared to the first half of 2013, daily average excess liquidity dropped from around €397 billion to around €134 billion, while EONIA rates increased, on average, from 8 to 17 basis points, and EONIA volumes rose from €19 billion to €27 billion (data are daily averages for the first half of 2013 compared with the first half of 2014).
Furthermore, the reduced segmentation in money markets (see Box 7 on money market segmentation) may have contributed to the increase in 2014 unsecured trading volumes. In addition, credit limit changes may also have played an important role, as banks representing 12% of total turnover in the 2014 EMMS reported an expansion in volumes owing to changes in credit limits in 2014 (it was 9% in 2013), while banks representing only 3% of total turnover (see Table 5) reported a contraction (it was 14% in 2013). A decline in risk aversion in 2014, as well as a reduction in counterparty and liquidity premia, may have also contributed to increased unsecured lending activity in 2014.12
11 The increase in the 2014 unsecured trading volumes is also confirmed by data from the e-MID market, which show a modest rise in trading turnover during the first few months of 2014.
12 For further details, see the ECB Financial Stability Review, May 2014, Chapter 2, Financial Markets.

18Euro money market study, 2014
3.2 Maturity analysis
As in the past few years, most of the turnover in the unsecured segment remained concentrated in the overnight tenor (see Charts 4 and 5). In 2014 overnight lending transactions accounted for roughly 85% of total lending (86% in 2013 – see Chart 6) and overnight borrowing transactions for 81% of total borrowing (68% in 2013 – see Chart 7). The increase in 2014 total turnover (with respect to 2013) can be
Chart 4Maturity breakdown for cumulative quarterly turnover in unsecured lending(index: cash lending volume in 2003 = 100)
0
20
40
60
80
100
120
140
2003 2005 2007 2009 2011 2013
T/N
less than 1 week
1 month to 3 months
6 months to 1 yearO/N
S/N
1 week to 1 month
3 to 6 months
more than 1 year
Note: The panel comprised 101 credit institutions.
Chart 5Maturity breakdown for cumulative quarterly turnover in unsecured cash borrowing(index: cash borrowing volume in 2003 = 100)
0
20
40
60
80
100
120
140
2003 2004 2005 2006 2007 2008 2009 2010 2011 2012 2013 2014
O/N
S/N
1 week to 1 month
3 to 6 months
more than 1 yearT/N
less than 1 week
1 month to 3 months
6 months to 1 year
Note: The panel comprised 101 credit institutions.
Chart 6Breakdown, by maturity, of cumulative quarterly turnover in unsecured lending(percentages of total)
0
20
40
60
80
100
O/N T/N S/N <1 w 1 wto1 m
1 mto3 m
3 mto6 m
6 mto 1 y
>1 y
20132014
Note: The panel comprised 154 credit institutions.
Chart 7Breakdown, by maturity, of cumulative quarterly turnover in unsecured borrowing(percentages of total)
0
20
40
60
80
100
O/N T/N S/N <1 w 1 w to1 m
1 mto3 m
3 mto 6 m
6 mto1 y
>1 y
20132014
Note: The panel comprised 154 credit institutions.

19Euro money market study, 2014
attributed mainly to the increase in the overnight tenor, while activity in the T/N maturity buckets decreased and in the S/N maturity buckets remained substantially unchanged (see Charts 6 and 7). Transactions in the “less than one week” maturity bucket globally showed a modest increase and this was the second highest maturity bucket in terms of percentage of total turnover in 2014 (9% and 10% of total lending and borrowing respectively). Turnover for maturities beyond three months remained negligible in 2013 and 2014, representing less than 1% of total turnover.
The maturity-weighted breakdown for average daily turnover, which reflects banks’ exposure to changes in money market rates, shows remarkable changes in the “more than one year” maturity bucket which may also be related to new regulatory initiatives. The decline in lending from 2013 to 2014 (see Chart 8) in the face of an increase in the borrowing at maturities of more than one year (see Chart 9) may have been triggered in part by the Basel III Net Stable Funding Ratio (NSFR) which distinctly favours longer-term funding of banks and penalises interbank lending with longer maturities (particularly those of more than one year).
Box 3 The ECB’s position on the EURIBOR reform
Since the introduction of reference interest rates in the 1980s, market conditions have evolved as a result of various market developments such as innovations and increased interconnectedness between markets. In this complex environment, reference rates have become an important element of the global financial system and an essential tool in the transmission of monetary policy decisions. The use of reference rates is widespread across several segments of the financial market and across an extensive range of products, ranging from bonds to loans and
Chart 8Maturity-weighted breakdown of cumulative quarterly turnover in unsecured lending(percentages of total)
0
5
10
15
20
25
30
35
O/N T/N S/N <1 w 1 wto3 m
1 mto3 m
3 mto6 m
6 mto 1 y
> 1 y
20132014
Note: The panel comprised 154 credit institutions.
Chart 9Maturity-weighted breakdown of cumulative quarterly turnover in unsecured borrowing(percentages of total)
0
5
10
15
20
25
30
35
20132014
O/N T/N S/N <1 w >1 y1 wto1 m
1 wto3 m
3 wto6 m
6 wto1 y
Note: The panel comprised 154 credit institutions.

20Euro money market study, 2014
even derivatives. They are also widely used in the valuation of financial instruments and as a basis for performance measurement and risk management. Reference rates based on unsecured interbank lending and borrowing (such as LIBOR, EURIBOR and TIBOR) have evolved into major benchmarks. This is partly because they were the first types of rates to be introduced and have thus emerged as the market standard over time.
The cases of attempted market manipulation and false reporting of global reference rates, together with the post-crisis decline in liquidity in interbank unsecured funding markets, have raised a number of questions as regards the reliability and robustness of existing benchmark interest rates. Uncertainty surrounding the integrity of these reference rates represents a potentially serious source of vulnerability for the financial system given their importance.
The EURIBOR (Euro Interbank Offered Rate) is a contributions-based reference rate and is administered by the European Money Markets Institute (EMMI).13 It reflects the euro interbank unsecured deposit rate offered by one prime bank to another prime bank, and is the main reference rate for many euro transactions:
• Almost 90% of all new loans extended during the course of 2013 in the euro area to non-financial corporations were floating rate loans (i.e. over €2.2 trillion), which are usually linked to the EURIBOR. At the same time, the proportion of floating rate loans that were newly extended in the course of 2013 to households in the euro area is lower but still considerable at 35% (equivalent to around €314 billion). In several euro area countries, the share is as high as 90%.
• According to the latest data available from the BIS (November 2014), single-currency OTC interest rate derivatives such as FRAs, swaps and options have reached an equivalent of over USD 563 trillion in notional amounts outstanding at the end of the first half of 2014. Of this total, references to euro interest rates were the largest share by currency representing almost 40%, (equivalent to over USD 222 trillion). With regard to exchange-traded interest rate derivatives, the total notional amount of the three-month EURIBOR futures contracts traded on Liffe amounted, in 2013, to €238.3 trillion and that of options on EURIBOR futures to €50.1 trillion.
The allegations surrounding the manipulation of key reference rates that emerged as early as 2008 have resulted in intense supervisory scrutiny and have triggered reference rate reforms as well as stricter governance frameworks. Fines and settlements of over several billion have been levied on banks by a number of authorities, revealing serious vulnerabilities, and investigations are still ongoing. In the aftermath of the scandal, a number of contributing banks decided to exit the submission panel of EURIBOR. Reasons relate, for instance, to reputational risk, potential costs of litigation, increased regulatory requirements and the challenging submission environment given the low amount of unsecured interbank activity. For example, in the case of EURIBOR, since September 2012, 19 banks have left the panel, leaving the current panel with 25 contributors. At the same time, a smaller number of nine banks have left the EONIA panel, resulting in a panel
13 The European Money Markets Institute (EMMI), formerly the Euribor-European Banking Federation, is an international non-profit-making association that was founded in 1999 with the launch of the euro. Its members are the national banking associations of those EU Member States that have adopted the euro.

21Euro money market study, 2014
size of 35 banks. Unlike EURIBOR, EONIA14 is not quote-based but relies exclusively on actual transactions. The higher number of banks suspending EURIBOR submissions rather than EONIA submissions is likely a reflection of the different degree of ambiguity in determining the contributing rate. On the one hand, in the case of survey-based indices such as EURIBOR, the uncertainty and the potential risks faced by panel banks in providing submissions is considered to be significant, as a thorough, but often not easy to provide, justification of the contributions is needed. On the other hand, in the case of a transaction-based index, such as EONIA, the submission is transparently determined, as contributions refer to actual transactions that fit the definition of the benchmark rate.
The increased risks perceived by banks participating in EURIBOR and EONIA panels led not only to a panel reduction, but it also severely affected other euro benchmark rates. In the case of the EONIA swap index, the reference rate was discontinued as of 1 July 2014 owing to a critical number of panel withdrawals. In the case of the EUREPO, the administrator announced in early November 2014 that the index would be discontinued as of 2 January 2015, as, with the decline in the panel size to nine contributors, the representativeness and robustness of the index was at risk.
In the case of the EURIBOR, in particular, the withdrawal of a number of banks has raised considerable concerns that a further drop in the panel size could force an abrupt discontinuation of the EURIBOR. In view of the large systemic relevance of EURIBOR, the impact of a sudden discontinuation could be remarkable, not only in terms of financial stability, but also for the monetary policy implementation. Hence, the robustness of the reference rate-setting framework (i.e. their calculation methodology, their contingency provisions, or the panel of contributors) is key for monetary policy transmission. As a result, the ECB has taken an active role in the reform process of reference rates – particularly of the EURIBOR:15
1 The ECB has actively supported the reform discussion at the international level. It has expressed its views in various discussion forums such as the Financial Stability Board (FSB) work stream related to financial benchmarks and the International Organization of Securities Commissions (IOSCO) and the European Banking Authority – European Securities and Markets Authority (EBA-ESMA) consultation on benchmarks.
2 The ECB has expressed its support for the European Commission draft regulation on financial benchmarks, which was published in September 2013 and is under review by the European Parliament and the European Council. The regulation envisages a common set of rules for the whole benchmark-setting process which would be applicable for a wide range of benchmarks. As a result, the ECB considers that the regulation would make the benchmark-setting process more resilient to manipulation, protecting investors and consumers. It would also fill the legislative void in the EU in this field, which seems particularly acute for the euro area and its main reference rates, where the regulatory uncertainty has likely encouraged banks to leave the EURIBOR panel.
14 The EONIA is the reference rate for the euro overnight unsecured interbank money market and is administered by EMMI.
15 See the article entitled “Reference interest rates: role, challenges and outlook”, Monthly Bulletin, ECB, October 2013.

22Euro money market study, 2014
3 The ECB is currently supporting the private sector effort to move towards a transaction-based EURIBOR. With concrete underlying transactions, reference rates would be more reflective of funding conditions and be more able to guard against manipulation. With more accountable submissions, banks’ managements and the relevant supervisors can more easily detect and identify misbehaviour. In cooperation with the benchmark administrator EMMI, the ECB has collected transaction data on unsecured wholesale activity from a panel of almost 60 banks, in two rounds over the course of 2013. An EMMI task force and some members of the FSB’s Markets Participants Group (MPG) have developed, with the support of the ECB, a proposal for a methodology for a transaction-based reference rate for the unsecured wholesale money market. The analysis of the data and a proposal were presented in June 2014 at an EMMI stakeholder meeting to all banks that participated in the collection round. A second meeting took place on 10 October 2014, in which the proposal for a methodology was presented to end users of the benchmark.
3.3 Market structure
The geographical counterparty breakdown shows a decreased reliance on national counterparties which accounted for 41% of total turnover in 2014 compared with more than 50% in 2013 (see Charts 10 and 11), as the figures reverted back to the same level as in 2012. Unsecured transactions with euro area counterparties rose from 26% in 2013 to 38% in 2014. This development reflects a partial reduction in the money market fragmentation across euro area banking systems (see Box 7 on money market segmentation), as well as increased confidence in the unsecured money market. The share of participating banks that considered the unsecured market to be at least “sufficiently efficient” increased from 16% in 2013 to 27% in 2014, and the share of banks that thought the unsecured market was “significantly
Chart 10Geographical counterparty breakdown of unsecured market in 2013(percentages of total)
national(51.7)
euro area(25.7)
other(22.6)
Note: The panel comprised 154 credit institutions.
Chart 11Geographical counterparty breakdown of unsecured market in 2014(percentages of total)
national(41.2)
euro area(38.2)
other(20.6)
Note: The panel comprised 154 credit institutions.

23Euro money market study, 2014
efficient” increased from 1% to 6% (see Chart 12). Nonetheless, most of the banks (more than 70%) still consider the unsecured market to be “limitedly efficient” or “not efficient”. However, there was a sizeable reduction in the share of banks which thought that market liquidity in the unsecured market had worsened (from 30% to 10%), while most respondents thought that market liquidity had not changed (67% in 2014 – see Chart 13).
As for the trading structure of unsecured transactions, after two consecutive declines, the percentage of voice broker trading increased in 2014 to the detriment of direct trading, while the share of electronic trading continued its declining trend (see Chart 14).
Box 4The impact of the negative deposit facility rate on the euro money market: an initial assessment16
On 5 June 2014, the Governing Council decided to reduce the key ECB interest rates, setting the deposit rate in negative territory17 for the first time in its history (see Chapter 2 entitled “The monetary policy environment”). On 4 September 2014, the Governing Council decided to further reduce official interest rates: the deposit rate was decreased to – 0.20%. The aim of this box is to analyse the impact of this on the euro money markets and to try to provide an initial assessment.18
16 This box makes reference to data as of end-October 2014.17 The negative rate also applies to average reserve holdings in excess of the minimum reserve
requirements and other deposits held with the Eurosystem (for further details, see the press release at http://www.ecb.europa.eu/press/pr/date/2014/html/pr140605_3.en.html).
18 For an additional analysis of the ECB negative deposit rate, see also Benoît Coeuré’s speech at the annual dinner of the ECB’s Money Market Contact Group (https://www.ecb.europa.eu/press/key/date/2014/html/sp140909.en.html).
Chart 13Has the market liquidity in the unsecured market changed with respect to last year?(percentages of total)
0
20
40
60
80
100
2003 2005 2007 2009 2011 2013
has worsened has worsened significantly*has worsened slightly* has not changedhas improved slightly has improved significantly
* Reporting started in 2012Note : The panel comprised 101 credit institutions.
Chart 12Is the unsecured market efficient?
(percentages of total)
0
40
20
60
80
100
2003 2005 2007 2009 2011 2013
limited and not efficient not efficient*limitedly efficient* sfficiently efficientsignificantly efficent extremely efficient
* Reporting started in 2012Note : The panel comprised 101 credit institutions.
Chart 14Trading structure of unsecured transactions
(percentages of total)
0
20
40
60
80
100
2003 2005 2007 2009 2011 2013
direct tradingvoice brokerelectronic trading
Note : The panel comprised 101 credit institutions.

24Euro money market study, 2014
There have been several effects of the negative deposit rate on the euro money market in terms of the level and the volatility of money market rates, expectations of future interest rates, the turnover in the money market, and liquidity distribution in the banking system. However, it is not possible to completely disentangle the effects of the policy rate cuts from other effects, including the announcement and the implementation of other ECB measures (such as the suspension of the weekly fine-tuning operation sterilising the liquidity created through the Securities Markets Programme (SMP)).
Impact on the level and the volatility of money market rates
Following the June decision to cut the deposit facility rate to -10 basis points and restore a symmetric corridor width around the MRO rate, both the level and volatility of interbank market rates have decreased significantly, in the unsecured as well as in the secured segment, interrupted only by the month-end volatility.
The lower policy rates were transmitted effectively to the overnight money market rates, which decreased first towards and then below zero. Following the June decision, the EONIA decreased from about 24 basis points (average of the previous two maintenance periods before the June rate cut) to about 3.9 basis points (average of the next two after the June rate cut). The EONIA remained, on average, at this level even after the September rate cut (see Chart A). The interest rates in the secured money market segment reacted faster and in a more pronounced way to the negative deposit rate by comparison with the EONIA. The STOXX GC Pooling O/N (ECB basket) rate decreased from 18 to 1 basis point (average of the two maintenance periods before and after the June rate cut) and was already quoted at negative levels in the first two weeks following the rate cut in June. After being mainly at a positive level in July, the STOXX GC Pooling O/N (ECB basket) rate turned negative again at the beginning of August and, apart from the end-month peak, it remained at these levels before further declining following the September interest rate
Chart AECB rates, EONIA and excess liquidity (right-hand scale)(percentages and EUR billion)
-100
0
100
200
300
400
500
600
700
800
-0.3
-0.1
0.1
0.3
0.5
0.7
0.9
1.1
1.3
1.5
Jan. Mar. May July Sep. Nov. Jan. Mar. May July Sep.2013 2014
liquidity surplus
EONIA
marginal lending
deposit facility
main refinancing operation
Source: ECB and EMMI
Chart BOvernight Repo rates (five day moving average) and ECB rates(percentages)
-0.2
-0.1
0.0
0.1
0.2
0.3
0.4
0.5
0.6
0.7
Jan. Feb. Mar. Apr. May June July Aug. Sep. Oct.2014
main refinancing operation
deposit facility
REPO CG MTS ON
STOXX GC ON
STOXX GC EXT ON
Source: STOXX

25Euro money market study, 2014
cut (see Chart B).19 Since the end of August, both the EONIA and the repo rates20 have frequently traded in negative territory.21 The fall in money market rates has been associated with a broadly constant level of excess liquidity, which fluctuated around €130 billion during the last quarter22 of 2014 (see Chart A), as the liquidity “injected” by virtue of the suspension of the SMP absorption operations23 had been mostly offset by less recourse to Eurosystem refinancing operations. Following the September policy rate changes, the overnight rates fell less than in June.
As far as the volatility of money market rates is concerned, it increased during the first half of 2014, mainly owing to declining excess liquidity. However, following the June rate cut and the restoration of a narrower and symmetric corridor, the volatility of all money market rates significantly declined.
The lower policy rates were also transmitted to longer maturities and other market segments. EURIBOR rates fell following the June decision and again following the September decision, as well as the rates implied by 3-month EURIBOR futures (see Chart C) and yields on euro area Treasury bills. In particular, EURIBOR rates fell after each interest rate cut, with the one-week rate remaining at a negative level since 5 September, the one-month rate currently standing at around zero and the three-month rate declining from 30 (end of May) to 8 basis points (end of September). The developments in the implied rates in three-month EURIBOR futures contracts, which had already begun to decline before the announcement, show that market participants had already priced such decisions, particularly the June rate cut. At the end of September, futures with maturities in March 2015 and in June 2015 priced the three-month EURIBOR at about 6/7 basis points, increasing to around 10 basis points at the end of October 2014.
With regard to the impact on Treasury bills (see Chart D), it is interesting to highlight some differences between the effects of the first and the second rate cuts. On the one hand, the June rate cut was accompanied (and to some extent anticipated) by a substantial decline in the Treasury bill rates, particularly for the Italian and Spanish Treasury bills, which converged toward the levels of the other major euro area countries, plausibly as a consequence of a search for high yields. On the other hand, in September, the pattern was different: while rates for non-
19 The MTS Repo GC O/N and STOXX GC O/N (EXTended basket) followed a similar pattern with some differences arising from the different underlying collaterals.
20 RepoFunds Rates have also decreased since the deposit rate turned negative. Initially, repos with German collateral traded with negative interest rates, French collateral traded around zero and Italian collateral still traded with positive interest rates. Since the beginning of August, all three rates have turned negative. However, it is difficult to draw any conclusions with regard to liquidity, because, on the observed trading platforms, ICAP BrokerTec and MTS, almost every repo is collateral-driven.
21 According to anecdotal evidence, market participants are becoming increasingly used to the negative deposit rate and the 0% basis point no longer constitutes a psychological trading limit.
22 In the maintenance reserve period of May/June, the last period before the interest rate cut, average excess liquidity amounted to €117 billion, 24% as the deposit facility and 76% as excess reserves (i.e. central bank accounts minus minimum reserve requirements). In the following maintenance periods, excess liquidity amounted, on average, to around €130 billion, 18% as the deposit facility and 82% as excess reserves. Therefore, the preference for holding excess reserves instead of the deposit facility increased following the interest rate cut.
23 On 5 June 2014, the Governing Council decided to suspend the weekly fine-tuning operation sterilising the liquidity injected by means of the SMP. This led to an increase in excess liquidity by around €110 billion.

26Euro money market study, 2014
stressed countries declined further and stabilised in negative territory, rates for Italy and Spain did not decrease but actually rose slightly, accelerating an upward trend which had started in early August. Rising up from extraordinarily low levels, this increase may be partly explained by investors’ search for yields in longer maturities.
Impact on money market expectations
After the rate cut in June, forward-EONIA swap rates decreased significantly, reaching negative levels following the September ECB interest rate cut (see Chart E). Chart F shows the EONIA OIS term structure on different dates. It is interesting to note that after the June rate cut, the OIS curve (6 June 2014) shifted downwards and became negatively sloped when compared with the beginning of the year. However, at that time, there were no negative quotes for any maturities. This movement was well anticipated by the market, as the OIS curve at the end of May had almost the same shape as the one on 6 June 2014. Since the rate cut in September, the EONIA OIS curve shifted significantly further downwards with OIS rates being quoted in negative territory for all the maturities up to two years. In addition to the rate cuts, the announcement of additional non-standard monetary policy measures (TLTROs, ABSPP and CBPP3) and, as a consequence, the expected increase in excess liquidity, have also contributed to the strong decrease in both forward and OIS rates.
Chart CEURIBOR rates and three-month EURIBOR future implied rates(percentages)
-0.2
-0.1
0.0
0.1
0.2
0.3
0.4
0.5
0.6
Jan. Feb. Mar. Apr. May June July Aug. Sep. Oct.2014
3-month EURIBOR futures – 15 June
futures – 15 March
1-week EURIBOR
1-month EURIBOR
6-month EURIBOR deposit facility
Source: Bloomberg
Chart DSix-month Treasury-bill rates for selected euro area countries(percentages)
-0.2
-0.1
0.0
0.1
0.2
0.3
0.4
0.5
0.6
0.7
0.8
Jan. Feb. Mar. Apr. May June July Aug. Sep. Oct.2014
IT DE FR ES BE deposit facility
Source: Bloomberg

27Euro money market study, 2014
Notwithstanding this development, in October 2014 forward EONIA swap rates began to increase, following the upward trend of EONIA spot rates, and the OIS curve shifted upwards. This could also be related to some uncertainties as to the expected liquidity injection that could result from the TLTROs and the asset purchase programmes.
Impact on trading volumes
Chart F shows the developments in the rate and turnover for the EONIA and the STOXX GC Pooling EUR Funding Rate.24 Based on a preliminary assessment, it seems that trading volumes rose, albeit marginally, following the introduction of the negative deposit rate. Indeed, the EONIA turnover rose slightly, from a daily average turnover of around €26 billion in the first half of the year to €29 billion since 11 June onwards. Trading volumes for the STOXX GC Pooling EUR Funding Rate show a larger increase, particularly since September 2014.25 This may also be connected to the decrease in excess liquidity (see Chart G), which decreased from about €120 billion (10 September 2014) to about €80 billion (23 September 2014 – the day before the allotment of the first TLRO). Indeed, trading activity seems to be somehow strongly connected to any changes in excess liquidity.
24 The STOXX GC Pooling EUR Funding Rate uses broadly defined GC Pooling baskets including reusable eligible securities with instantaneous refinancing capacity within the framework of ECB/Bundesbank open market operations (for further information, see http://www.stoxx.com/indices/rates/eur_reference_rates.html).
25 Looking at the traded maturities at GC Pooling, it is noticeable that before the interest rate cut in June, traded maturities became considerably longer (one and two years were traded). Many traders seemed to be trying to obtain positive long-term interest rates, as they were uncertain about the effects of negative interest rates on the market environment and the yield curve. Since the rate cut, the trading volume in the longer maturities has returned to its previous levels.
Chart FEONIA OIS curve on different dates
(percentages)
-0.10
-0.05
0.00
0.05
0.10
0.15
0.20
0.25
1 2 1 2 3 4 5 6 7 8 9 10 11 1 2weeks months years
1 January 2014
6 June 201430 October 201430 May 20145 September 2014
Source: Bloomberg
Chart EForward EONIA swap rates
(percentages)
-0.2
-0.1
0.0
0.1
0.2
0.3
0.4
0.5
0.6
Jan. Mar. May July Sep. Nov. Jan. Mar. May July Sep.2013 2014
3-month forward starting OIS (3 x 6)
6-month forward starting OIS (6 x 12) 1-year forward starting OIS (12 x 24)
deposit facility
Source: Bloomberg

28Euro money market study, 2014
Conclusions
In general, lower policy rates were effectively transmitted to the money market rates, and, in line with ECB forward guidance, uncertainty about the future path of policy rates has been reduced, with the explicit reference to ECB policy rates reaching the lower bound. However, there seems to be some differences between the June and September rate cuts: the former significantly affected spot money market rates in the unsecured as well as in the secured segment, reducing both their level and volatility; the latter rate cut had a more significant impact on expectations of the future path of money market rates (owing also to the announcement of other ECB policy measures), as well as a more visible impact on declining excess liquidity and increasing trading volumes, while short-term rates responded less significantly in that respect.
4 The secured market
4.1 Turnover analysis
This year’s survey shows a slight increase in the secured market segment following considerable growth in 2013, confirming its position as the largest segment of the euro money market, which represents 41% of total turnover (see Chart 15). Lending and borrowing, taken together, grew by 2% in 2014 compared with 24% in 2013. However, this 2% increase is the result of a 7% decline in reverse repo transactions (cash lending against securities), which was offset by a 9% increase in repo transactions (cash borrowing against securities) in 2014.
Chart GEONIA and STOXX GC funding rates and volumes(percentages ; EUR millions)
0
10,000
20,000
30,000
40,000
50,000
60,000
70,000
80,000
90,000
100,000
-0.2
-0.1
0.0
0.1
0.2
0.3
0.4
0.5
0.6
0.7
0.8
STOXX GC funding rate volumeEONIA volume (5 day MA)
EONIASTOXX GC funding ratemain refinancing operationdeposit facility
Nov. Jan. Mar. May July Sep.2013 2014
Source: STOXX and ECB
Chart HEONIA and STOXX GC funding volumes and excess liquidity(EUR millions)
0
50,000
100,000
150,000
200,000
250,000
300,000
0
10,000
20,000
30,000
40,000
50,000
60,000
70,000
80,000
90,000
100,000
Nov.2013 2014
Jan. Mar. May July Sep.
STOXX GC funding rate volume (5 day MA; left-hand scale) EONIA volume (5 day MA; left-hand scale) liquidity surplus (5 day MA; right-hand scale)
Source: STOXX and ECBNote: The blue bars represent the dates for the announcements of the June and September deposit rate cuts.

29Euro money market study, 2014
The volume recorded in the secured market in 2014 is at a relatively high level. This suggests that overall, the structural reasons for the broad use of repo transactions are fairly intact, and remain so in the low interest rate environment as well, as, since June 2014, in the context of a negative deposit rate. In particular, liquidity-providing counterparties still tend to prefer collateralised transactions, because they help to limit credit risk exposure and to avoid constraints arising from regulatory requirements. Current repo market activity may also have benefited from the renewed upturn in confidence among market participants, improved ratings – mostly for non-core countries – and looser requirements for margin collateral through central counterparties (CCPs) amid relatively stable markets.
The impact of the low interest rate policy, which contributed to a flatter yield curve and may have caused trading opportunities to dry up for some counterparties, was partly offset by the lower liquidity surplus compared with 2013. Indeed, the increase in VLTRO early repayments pushed down excess liquidity levels,
encouraging market participants to increase their activity. With the suspension of the SMP absorption opening up greater scope for transactions in the interbank market, banks had to switch their lending operations to reverse repo transactions.
On the other hand, some counterparties are already adjusting their funding decisions ahead of forthcoming regulatory changes such as the Liquidity Coverage Ratio (LCR). Market participants are already anticipating the implementation of the LCR, even though it will only be binding from October 2015 onwards. Counterparties also pressed ahead with balance sheet adjustments, encouraged by the comprehensive assessment conducted before the launch of the Single Supervisory Mechanism.
Much like the patterns identified in the unsecured market, borrowing activities in the secured market outweighed lending activities during the second quarter of 2014 (see Chart 16). This could be related to the fact that the panel banks tend to be relatively large and may, for structural reasons, have a greater need for funding from market sources than other banks that are less active in the wholesale euro money market but are not captured in the survey.
The semi-annual survey published by the European Repo Council (ERC) of the International Capital Market Association (ICMA) in June 2014 reflected a decline in the European secured market. The panel of institutions participating in the ERC survey reported an aggregate decrease in outstanding amounts of around 4.6% compared with June 2013, in contrast to the increase recorded in this survey (2%). However, these diverging rates might be explained by the different samples of banks and non-banks and by the considerable methodological differences between the two surveys.26
26 ICMA takes outstanding positions at certain cut-off dates, while the EMMS uses turnover data during the entire quarter.
Chart 15Cumulative quarterly turnover in the euro money market(EUR trillions; annual data)
0
10
20
30
40
50
60
70
80
90
2003 2005 2007 2009 2011 2013
secured Xccy swaps
ST securitiesFX swaps
unsecured
OISs
other IRSs
FRAs
Note: The panel comprised 101 credit institutions.

30Euro money market study, 2014
4.2 Maturity analysis
A maturity breakdown for the “constant” panel of 101 banks shows that, for both repo and reverse repo transactions, turnover was still concentrated in the overnight to up to one week buckets. The share of these short-term buckets in overall secured lending and borrowing remains at a very high level (93.6% in 2014), hence maturities of more than one week are of minor importance. However, changes occurred within the maturities of up to one week. Chart 17 shows that a decline in overnight lending and borrowing as a percentage of total secured market turnover, which fell from 18.6% in 2013 to 16.8% in 2014, was offset by a growing share of mainly T/N and up to one week maturities. Looking at participants’ statements, one explanation for the decline in overnight transactions could be a lower need for daily surplus balancing, especially due to excess liquidity. By contrast, T/N, S/N and up to one week (included) increased, probably because banks focused more on avoiding any prolongation issues owing to possible settlement risks
which are more likely to happen in overnight maturities. If an overnight repo cannot be settled, an intraday credit might be necessary. In the context of regulation, this shift could be seen as a diversification of settlement risks.
The comparison of maturity-weighted volumes for repo and reverse repo transactions between 2013 and 2014 also provides evidence of a higher demand for transactions with longer maturities (see Charts 18 and 19).
Chart 16Cumulative quarterly turnover in secured cash lending and borrowing
(index: cash lending volume in 2003 = 100)
0
50
100
150
200
250
2003 2004 2005 2006 2007 2008 2009 2010 2011 2012 2013 2014
lendingborrowing
Note: The panel comprised 101 credit institutions.
Chart 17Maturity breakdown for short-term secured lending and borrowing activity from 2008 to 2014(overnight to one week; percentages of total)
0
5
10
15
20
25
30
35
40
45
O/N T/N S/N Up to 1 week(included)
Q2 2008Q2 2010Q2 2012Q2 2014
Q2 2009Q2 2011Q2 2013
Note: The panel comprised 154 credit institutions.

31Euro money market study, 2014
While the share of maturities in the one month to three months and six months to more than one year buckets increased slightly on the lending side, the more than one year maturity bucket on the borrowing side nearly doubled its share to 11% in the second quarter of 2014 (6% in 2013). In an environment broadly characterised by low interest rates, demand for longer maturities could be explained by expectations of negative interest rates, which make it easier for large borrowers to perform long-term operations, thereby allowing lenders to lock in positive rates. In addition, the anticipation of stricter LCR requirements could account for the higher demand for longer maturities, even though the market has not yet implemented the regulatory requirements in full.
Chart 18Maturity-weighted breakdown of cumulative quarterly turnover in secured lending
(percentages of total)
0
5
10
15
20
25
30
O/N T/N S/N Less than1 week
1 week to1 month
1 month to3 months
3 to 6 months 6 monthsto 1 year
More than1 year
20132014
Note: The panel comprised 154 credit institutions.
Chart 19Maturity-weighted breakdown of cumulative quarterly turnover in secured borrowing
(percentages of total)
0
5
10
15
20
25
30
O/N T/N S/N Less than1 week
1 week to1 month
1 month to3 months
3 to 6 months 6 monthsto 1 year
More than1 year
20132014
Note: The panel comprised 154 credit institutions.

32Euro money market study, 2014
A comparison with the maturity structure of the June 2014 European Repo Council (ERC) survey shows some discrepancies, which could be attributed to the fact that the ECB survey is based on flows and initial maturities, while the ERC survey focuses on outstanding volumes and residual maturities on a certain reference date. The ECB survey (“constant” panel data) finds that 76.4% of overall secured activity had an initial one-business day maturity in 2014 (including overnight, tomorrow/next and spot/next maturities), as illustrated in Charts 18 and 19, while the ERC survey reports a smaller figure of 20.9%.
4.3 Market structure
Feedback from the qualitative section of the survey shows a strong increase in market efficiency. In 2014, a majority of respondents (56.3%) found the secured market to be significantly or extremely efficient (compared with 45.1% in 2013) (see Chart 20). The efficiency improvements could be explained by the ongoing growth in the use of electronic trading platforms for conducting secured market transactions, although the CCP share has not increased. The heightened efficiency might also be the outcome of increased interbank market activity.
The secured market also seems to be more liquid than in 2013 (see Chart 21): 61.9% of the respondents evaluated its liquidity as “slightly improved” or “significantly improved” in 2014. The relatively large turnover in the very low interest rate environment and expectations of negative interest rates in the second quarter of 2014 (particularly in the less liquid longer terms) could be one explanatory factor, as could the entry of new participants into the repo market via electronic platforms or increased activity on the part of established participants.
Chart 20Is the secured market efficient?
(percentages of total)
0
20
40
60
80
100
2003 2004 2005 2006 2007 2008 2009 2010 2011 2012 2013 2014
sufficiently efficientsignificantly efficientextremely efficientlimited and not efficient
not efficient*limitedly efficient*
Note: The panel comprised 101 credit institutions.* Reporting started in 2012.

33Euro money market study, 2014
After dropping slightly from 62.6% in 2012 to 57.6% in 2013, the share of transactions in the secured market conducted via electronic trading platforms reached a new high of 64.3% in 2014. The repo market thus remains the money market segment with the highest share of electronic trading. This could be explained by the sustained demand for standardised general collateral (GC) repos, which makes them easily tradable on electronic platforms.
A geographical breakdown of the collateral used in overall activity in the secured market shows that the share of euro area collateral shrank from 2012 to 2013 and remained rather stable in 2014. The bulk of collateral was still issued by entities located in the euro area (see Charts 22 and 23). However, in countries with safe haven collateral, the share of the national component tended to be higher. Since 2012 the share of non-domestic collateral has risen again significantly, particularly so for collateral from outside the euro area (see Chart 24). This development is consistent with recent statements by the Bank for International Settlements (BIS) on the worldwide increase in cross-border interbank activity, and shows that confidence in foreign markets has picked up again noticeably.
The persistent relatively large share of euro area collateral is still indicative of the high levels of integration in the repo market across the euro area, something which is also facilitated by the use of international central securities depositories (ICSDs) such as Clearstream and Euroclear, and CCPs such as Eurex Clearing, LCH.Clearnet S.A., Cassa di Compensazione a Garanzia (CC&G) and BME Clearing. However, its share appears to have stagnated at around 61%, which would indicate that, despite all the efforts that have been made and the new bridges that have been created, interconnectivity problems still persist between national central securities depositories (CSDs) and ICSDs. There is still scope for improving the efficiency of cross-border securities transfers. A further step in this direction is the cross-border reuse of collateral among NCBs, which came into force on 29 September 2014 (for
Chart 21Has the market liquidity in the secured market changed with respect to last year?
(percentages of total)
0
20
40
60
80
100
2003 2004 2005 2006 2007 2008 2009 2010 2011 2012 2013 2014
has worsened
significantly*slightly*
has not changedhas improved slightlyhas improved significantly
Note: The panel comprised 101 credit institutions.* Reporting started in 2012.

34Euro money market study, 2014
further details see Box 5 entitled “Developments in secured markets amid negative interest rates and regulatory requirements – evidence from GC Pooling”).
The geographical breakdown of counterparties changed significantly between 2013 and 2014. While the share of euro area counterparties grew in 2013, after having dropped sharply from 45.0% in 2011 to 33.1% in 2012 as national counterparties took their place, the 2014 figures show a considerable shift away from national and euro area counterparties towards other counterparties
Chart 23Geographical breakdown of collateral in the bilateral repo market in 2014(percentages of total)
other(4.7)
euro area(60.5)
national(34.8)
Note: The panel comprised 154 credit institutions.
Chart 24Geographical breakdown of collateral in bilateral secured borrowing
(percentages of total)
0
20
40
60
80
100
2003 2004 2005 2006 2007 2008 2009 2010 2011 2012 2013 2014
nationaleuro areaother
Note: The panel comprised 101 credit institutions.
Chart 22Geographical breakdown of collateral in the bilateral repo market in 2013(percentages of total)
other(3.3)
national (35.6)
euro area(61.1)
Note: The panel comprised 154 credit institutions.

35Euro money market study, 2014
(see Charts 25 and 26). This supports the notion of growing financial system integration beyond the borders of the euro area. However, bearing in mind that the “other counterparties” category may also include anonymous counterparties, this development should not be overestimated.
After market concentration levels had continued their decline in 2012 and 2013, levels for bilateral reverse repos and repos improved again slightly in 2014. In the second quarter of 2014, the five largest banks accounted for 39.7% of the total turnover of bilateral secured transactions, compared with 37.3% in 2013. Mirroring this development, the top ten banks’ share of turnover also climbed from 59.5% (2013) to 63.2%. This leads us to assume that the crisis has been a catalyst for greater concentration within the banking industry (see Table 2 in the section entitled “Triparty repos”).
4.4 Triparty repos
Following the decline in triparty repo27 business in 2012, total turnover remained broadly stable in 2013 and 2014, unlike the overall upward trend shown by bilateral repos (see Charts 27 and 28). In fact, triparty transactions on the borrowing side (triparty reverse repo transactions still did not play a significant role) decreased by 1% in 2014 for the “constant” panel of 101 banks, compared with an increase of 10% in bilateral repos. These divergent trends have reduced the relative importance of this market.
27 A triparty repo is a repo that involves a third party, usually a custodian bank or an ICSD, acting as an agent for both the collateral taker and the collateral provider. These two parties outsource their back office and middle office functions to the triparty agent, which handles the settlement as well as collateral management during the life of the trade.
Chart 25Breakdown, by geographical counterparty, of the secured market in 2013(percentages of total)
national(29.6)
other(20.2)
euro area(50.2 )
Note: The panel comprised 154 credit institutions
Chart 26Breakdown, by geographical counterparty, of the secured market in 2014(percentages of total)
national(22.7)
euro area(46.2)
other(31.1)
Note: The panel comprised 154 credit institutions

36Euro money market study, 2014
More specifically, the share of triparty repos in the overall secured market stood at 9% in 2014 (almost unchanged compared with 2013 and lower than the 12% recorded in 2012; see Chart 29). By contrast, the ICMA survey of June 2014 reports that 10% of the secured market is in triparty repos, up slightly on the 2012 figures. Overall, this shows that, compared with the United States, where triparty repos represent 55% of the total domestic repo market, euro area banks still tend to prefer bilateral repo trading via central counterparties (see Chart 29).
Despite the slight reduction in 2014 borrowing turnover, the latest figure for the triparty repo market size is still substantially higher than the lowest figure recorded since the beginning of the crisis (see Chart 27). Triparty repos free both parties from operational
Chart 27Cumulative quarterly turnover in triparty repo cash lending and borrowing
(index: cash lending volume in 2003 = 100)
0
200
400
600
800
1,000
1,200
1,400
1,600
1,800
2003 2004 2005 2006 2007 2008 2009 2010 2011 2012 2013 2014
lendingborrowing
Note: The panel comprised 101 credit institutions.
Chart 28Cumulative quarterly turnover in bilateral repo cash lending and borrowing
(index: cash lending volume in 2003 = 100)
0
50
100
150
200
250
2003 2004 2005 2006 2007 2008 2009 2010 2011 2012 2013 2014
lendingborrowing
Note: The panel comprised 101 credit institutions

37Euro money market study, 2014
and administrative burdens and offer efficiency benefits, such as reduced operational costs, when banks trade a large volume of individual securities. This continues to make them attractive. The reported stabilisation of the turnover in 2013 and 2014 is mainly a consequence of higher rates compared with the bilateral market.
The triparty repos constitute the most concentrated segment of the secured market, with the top five banks accounting for almost 75% of the market, while the top 20 banks account for almost the entire market (see Table 2). Triparty repos require a relatively substantial administrative effort at the inception of a business relationship, making barriers to market entry higher than they are in other segments. This fosters the emergence of specialised service providers and, in combination with the low market volume and interest rates, generates fewer opportunities, relatively speaking, for profitable business-making.
The one-day maturity turnover in triparty repo transactions revealed a strong switch to T/N. While O/N and S/N contracted sharply, particularly on the borrowing side, T/N nearly doubled its share. Despite the fact that triparty repos were still conducted mainly in the overnight up to one week maturity bucket, the strongest growth in borrowing for the panel as a whole was observed in the more than six months segment (see Charts 30 and 31). This is consistent with observations in other segments.
Chart 29Breakdown of total secured market
(percentages of total)
0
20
40
60
80
100
2003 2004 2005 2006 2007 2008 2009 2010 2011 2012 2013 2014
bilateralbilateral repos, non-CCP transactions only bilateral repos, CCP transactions only triparty repos
Notes: The panel comprised 101 credit institutions. Reporting only started in 2009.
Table 2Concentration of secured market activity in 2014(percentages of total)
Bilateral reverse
reposBilateral
repos
Bilateral reverse repos,
CCP only
Bilateral repos,
CCP only
Triparty reverse
reposTriparty
repos
Total reverse
reposTotal
repos
Top 5 credit institutions 36.5 42.2 41.3 46.1 74.4 66.5 36.6 42.7
Top 10 credit institutions 63.2 63.2 67.5 70.1 91.7 86.3 62.6 63.3
Top 20 credit institutions 86.9 84.3 90.4 88.9 100.0 98.6 85.8 84.5

38Euro money market study, 2014
Box 5Developments in secured money markets amid negative interest rates and regulatory requirements – evidence from GC Pooling
Development of the CCP market
Repo transactions via central counterparties (CCPs) continued to reach high levels in 2014. This reflects the increasing preference of credit institutions to conduct their secured money market transactions against general collateral (GC) and with limited counterparty credit risk. The survey shows an increasing trend over the past two years of the share of CCP-based transactions being
Chart 30Breakdown, by maturity, of cumulative quarterly turnover in triparty repo lending
(index: triparty repo lending volume in 2003 = 100)
0
100
200
300
400
500
600
700
800
2003 2004 2005 2006 2007 2008 2009 2010 2011 2012 2013 2014
O/NT/NS/Nless than 1 week
1 week to 1 month1 month to 3 months3 to 6 months6 months to 1 year
Note: The panel comprised 101 credit institutions
Chart 31Breakdown, by maturity, of cumulative quarterly turnover in triparty repo borrowing
(index: triparty repo borrowing volume in 2003 = 100)
0
50
100
150
200
250
300
350
400
2003 2004 2005 2006 2007 2008 2009 2010 2011 2012 2013 2014
1 week to 1 month1 month to 3 months3 to 6 months6 months to 1 year
O/NT/NS/Nless than 1 week
Note: The panel comprised 101 credit institutions.

39Euro money market study, 2014
in the bilateral repo business, although in the second quarter of 2014 it stabilised at around 66.5%. The observation of a rather constant CCP share in the second quarter of 2014 is in line with the data from Eurex Repo’s GC Pooling segment, one of the major pan-European electronic trading services for CCP-based repo transactions. The total outstanding volume has remained at a level of around €150 billion since spring 2013 (see Chart A) for both of the collateral baskets, the ECB Basket and ECB EXTended Basket28, taken together. By contrast, in the same time frame, the monthly trading volume had significantly risen, ranging between €960 and €1,200 billion in the second quarter of 2014 (see Chart B).
This development could have been driven by the negative deposit rate in place since June 2014, as cash providers may have decided to reduce at least part of their excess reserves held with the Eurosystem to avoid negative remuneration by lending at more favourable rates in the interbank repo market. At the same time, excess liquidity reached low levels and became more volatile which may also have raised incentives for more interbank money market activity. Finally, reduced risk aversion began to be observed since mid-2013 in the ongoing transition towards a new money market environment, which may be a more structural medium-term factor explaining the increase in money market activity. The increasing number of actively trading counterparties in GC Pooling, which reached a new high of 100 in July 2014 (84 in July 2013), confirms this possibility. In addition, in 2013, Eurex Repo, Eurex Clearing and Clearstream Banking introduced GC Pooling Select, which opens their services to corporate clients
28 The GC Pooling ECB Basket includes around 7,000 ECB-eligible instruments, mainly euro area government securities and covered bonds, with a minimum rating requirement of A-/A3. The GC Pooling EXTended Basket includes over 20,000 investment grade instruments which meet the ECB eligibility criteria, including uncovered bank bonds and corporate bonds. In addition, the GC Pooling International Maximum Quality (INT MXQ) Basket (government securities in foreign currencies) and the GC Pooling Equity Basket (securities-based on a HDAX selection) are available.
Chart AEuro GC Pooling
(outstanding volume; 20 day moving average; single counted; EUR billions)
Jan. Feb.2013 2014
Mar. Apr. May June July Aug. Sep. Oct. Nov. Dec. Jan. Feb. Mar. Apr. May June July Aug. Sep. Oct. Nov.
GC Pooling ECB EXTended BasketGC Pooling ECB Basket
300,000
250,000
200,000
150,000
100,000
50,000
0
Source: Eurex Repo.

40Euro money market study, 2014
by enabling bilateral trading based on banks’ existing business relationships and their corporate clients. Clients of GC Pooling Select can act as net cash providers to banks. To date, 17 banks have registered and four non-bank corporations have been admitted or are in the process of finalising the admission process, and a small number of trades have already been conducted.
Moreover, a rising trading volume together with broadly constant outstanding volumes also suggests a shift in the maturity structure in GC Pooling from longer to shorter maturities. This could be a result of the ECB rate cut decision in June 2014, followed by the further reduction announced in September 2014, which may have led market participants to manage their cash on a day-to-day basis. Indeed, the GC Pooling one-day maturities revealed an average positive spread of 12.1 basis points to the deposit facility since June 2014, thus providing the opportunity to minimise costs.29
29 Average effective spreads from 2 June to 30 September 2014: deposit facility to GCP O/N =11.5 basis points; deposit facility to GCP T/N = 12.5 basis points; deposit facility to GCP S/N = 12.3 basis points.
Chart CGC Pooling O/N and EONIA
(percentages)
0.6
0.5
0.4
0.3
0.2
0.1
0.0
-0.1
-0.2May June July
2014Aug. Sep. Oct. Nov.
EONIAGC Pooling O/N
Sources: ECB, Eurex Repo.
Chart BTrades – ECB Basket & ECB EXTended Basket
(volume per month; EUR billions)
Jan. Feb.2013 2014
Mar. Apr. May June July Aug. Sep. Oct. Nov. Dec. Jan. Feb. Mar. Apr. May June July Aug. Sep. Oct. Nov.
>=184d
32-91d
1-7d (w/o O/N, T/N, S/N)
T/N92-183d
8-31d O/N
S/N
1,400,000
200,000
400,000
600,000
800,000
1,000,000
1,200,000
0
Source: Eurex Repo.

41Euro money market study, 2014
Reaction to the negative rates
In the context of the deposit rate reduction to -0.10% on 11 June 2014, the comparison of EONIA with GC Pooling O/N has revealed very different reaction times. GC Pooling O/N reached negative values for the first time on 13 June, two days after the cut became effective, while EONIA only reached negative levels for the first time on 28 August, 78 days later. Thus, the unsecured O/N money market rate reacted with a significant delay in comparison to the secured rates, which could be explained by the natural positive spread existing between unsecured and secured money market rates, among other things. Since the September 2014 cut of the deposit rate to -0.20%, this behaviour has been even more pronounced. Neither of the two rates wholly reflected the full impact of the rate cut, as low levels of excess liquidity seemed to anchor the rates close to the pre-cut levels. Generally speaking, the level of excess liquidity is the key factor determining whether secured and unsecured O/N rates will remain negative over a longer period of time (for negative rates see also Box 4).
New reference rates
Besides the well-established GC Pooling O/N Index, Eurex Repo also decided to publish, together with STOXX, indices for longer money market maturities. Since October 2013, STOXX has been calculating average rates for maturities with terms from one week up to 12 months based on the GC Pooling. For this purpose, Eurex Repo introduced new standard terms with pre-determined contract dates, in addition to the established FlexTerm contracts, which allow banks to flexibly determine the start and end date of a GC Pooling transaction. Hence, the available GC Pooling rates now cover the full money market curve up to 12 months.
Chart DRepo market term structure based on GC Pooling term indices
(EUR billions; percentages)
O/N T/N S/N 12months
9months
6months
3months
1months
2weeks
1week
0.5
0.4
0.3
0.2
0.1
0.0
-0.1
20,000
18,000
16,000
14,000
12,000
10,000
8,000
6,000
4,000
2,000
0
Trade-based Trade and quote-based
1.10.2014volume (left-hand scale)average rate
1.11.2013volume (left-hand scale)average rate
30.05.2014volume (left-hand scale)average rate
Source: STOXX.

42Euro money market study, 2014
In contrast to quoted rates30, such as EURIBOR, the calculation of the STOXX GC Pooling Indices (GCPIs) relies on market activity, i.e. on effective trades as well as on so-called binding quotes.31 While shorter maturities (O/N, T/N, S/N) exclusively represent volume-weighted average rates based on effective transactions, less turnover makes the use of binding quotes more important for the calculation of rates for longer maturities. However, this calculation is based only on the ECB Basket for the standard terms. The GCPIs therefore reflect neither data on the EXTended Basket nor on FlexTerm trades.
FlexTerm trades made up the majority of turnover in longer maturities until April 2014. Since May 2014, standard term trades broadly represent the majority of all term trades conducted. Furthermore, during 2013, EXTended Basket trades made up roughly one-third of all standard term trades and one quarter of FlexTerm trades. As neither FlexTerm trades nor transactions based on the ECB EXTended Basket are included in the GCPIs, these new reference rates do not fully reflect the liquidity of the GC Pooling term market.
Eurex launched the EUR Secured Funding Futures on 12 November 2014. These cash-settled futures are structurally similar to forward-starting EONIA swaps along ECB dates, but are based on a GC Pooling origin reference index.32
Reactions to the regulatory changes
As a result of the financial crisis, banks have become more reliant on secured funding owing to counterparty credit risk concerns. New regulations are expected to further strengthen the demand for collateral in the coming years. For example, the Liquidity Coverage Ratio (LCR) under Basel III grants better run-off factors for secured funding (based on the collateral type they range between 0% and 50%) than for unsecured wholesale funding where the run-off factor is set at 100%.
Another factor is the requirement for banks to maintain sufficient buffers of high-quality liquid assets (HQLA) for the LCR requirements. This fosters the recent development of an active bond repo market, and interbank market between banks and non-banks, which allows for collateral held by the banks to be upgraded to meet the LCR requirements.
Finally, other measures have been taken, which establish the CCP clearing of standard OTC derivative contracts and introduce more stringent collateralisation requirements for non-centrally cleared OTC derivatives, implying that financial institutions will require more collateral for their OTC derivative transactions.
The universe of HQLA will differ from the universe of ECB eligible assets. The existing ECB-eligible baskets of CCPs include assets that are not HQLA level 1. As an example, covered bonds are separated into two categories, credit quality step 1 and step 2, in the LCR delegated act. Only
30 Indicative rates represent the expectations of major market participants regarding an appropriate rate.31 Whereas the short-term indices – overnight (O/N), tomorrow/next (T/N), spot/next (S/N) – are calculated
exclusively based on trades, the one-week to 12-month terms are based on trades and binding quotes.32 GC Pooling EUR Deferred Funding Rate.

43Euro money market study, 2014
covered bonds of credit quality step 1 are recognised as HQLA level 1, while those of credit quality step 2 are recognised as HQLA level 2A only. The majority of covered bonds in both groups are currently ECB-eligible.
In this context, the introduction of a fully HQLA level 1-eligible collateral basket by CCPs, in addition to the existing ECB-eligible baskets, could raise some issues. On the one hand, it may allow banks to manage their liquidity precisely via the repo market in accordance with the new regulation, and on the other hand, it may increase fragmentation in repo markets and reduce overall market liquidity.
In addition, some market participants have mentioned that greater use of CCPs could significantly raise demand for collateral, because CCPs require their members to provide comprehensive collateralisation of their positions at levels typically higher than those for bilaterally cleared transactions.33 Several studies have estimated the impact of the aforementioned changes on availability and use of collateral.34 Depending on the applied assumptions, the additional demand for collateral arising from regulatory reforms is estimated to be in the range of between €1.5 trillion and €3 trillion (versus an estimated amount outstanding of HQLA assets of €37 trillion according to the CGFS Report 2013 entitled “Asset encumbrance, financial reform and the demand for collateral assets”). However, because the impact of reforms is not yet fully visible, the increase in demand for collateral could be higher in the coming years than previously estimated. In addition, there is a broad consensus that the supply of high-quality collateral is likely to continue to increase, following a further increase in the demand for collateral.35
One way market participants could respond to the increased demand for collateral is managing their collateral holdings more efficiently and effectively, for example, by the increased use of collateral optimisation techniques. Such techniques involve optimisation of collateral management processes (e.g. centralisation of collateral at the group level), but also collateral reuse and rehypothecation may be considered instruments of collateral optimisation,36 along with a more active collateral upgrade market via repo and reverse repo operations. A recent study conducted by De Nederlandsche Bank (the Dutch Central Bank) shows that the majority of participants take steps to optimise their collateral allocation, usually aiming for optimisation at the group level.37 The Eurosystem has undertaken a number of important initiatives in order to improve the functioning of the repo market,38 namely the integration of triparty collateral management services in the Eurosystem collateral framework. This well-proven concept, already in place in Germany, Luxembourg, France, Belgium and the Netherlands, is now available on a cross-border basis. Since 29 September, it provides credit institutions operating anywhere in the euro area with the possibility of using a single collateral pool both for the ECB liquidity operations and for repo
33 The FOW OTC Derivatives Clearing Roundtable, April 2011.34 See, for example, ECB (2014b) for an overview of the different estimates.35 See IMF (2012), CGFS (2013), and Fender and Lewrick (2013).36 Rehypothecation refers to the right of a market participant to repledge, reassign or invest the collateral
that it has received to secure a financial transaction. In the derivatives market, rehypothecation is sometimes also called collateral reuse. However, there is a legal distinction between rehypothecation and reuse in the repo market. The term collateral reuse applies if collateral is posted on the basis of title transfer when legal ownership goes from the collateral giver to the collateral taker.
37 Capel and Levels (2014).38 ECB (2014a).

44Euro money market study, 2014
transactions with GC Pooling or comparable trading services in the euro area. Such a step allows for more efficient settlement and management of collateral assets, which could have a positive influence on the usability of collateral and repo markets.
Sources: Capel, J. and Levels, A. (2014), “Collateral optimization, re-use and transformation. Developments in the Dutch financial sector”,
DNB Occasional Studies, Vol. 12/No 5. CGFS (2013), “Asset encumbrance, financial reform and the demand for collateral assets”, CGFS Papers, No 49. ECB (2014a), “Collateral eligibility and availability”, Follow-up report in “Collateral eligibility requirements – a comparative study
across specific frameworks”, July 2013. ECB (2014b), “Euro Repo Markets: Improvements for collateral and liquidity management”. Fender, I. and Lewrick, U. (2013), “Mind the gap? Sources and implications of supply-demand imbalances in collateral asset market”,
BIS Quarterly Review, September. IMF (2012), “Safe Assets: Financial System Cornerstone?”, IMF Global Financial Stability Report: The Quest for Lasting Stability,
Chapter 3, pp. 81-122.
5 Developments in the over-the-counter derivatives markets
5.1 Turnover analysis
This section describes the development of turnover in the following euro-denominated OTC derivatives market segments: (i) the interest rate swap market, comprising overnight interest rate swaps (OISs) – also referred to as EONIA swaps – and other interest rate swaps (other IRSs); (ii) forward rate agreements (FRAs); and (iii) derivatives instruments linked to the foreign exchange market, comprising foreign exchange swaps (FX swaps) and cross-currency swaps (Xccy swaps).
Chart 32 shows that in 2013 turnover remained at around the same level as in 2012 (-1%). In the individual segments, the largest change took place in the other IRSs segment (+19%). The FX swap and Xccy swap segments dropped by about 12%. The activity in the FRAs segment rose slightly by 6%, whereas the OIS segment remained almost stable (-2%).
In 2014, the transaction volumes reported in the OTC derivatives market were overall quasi-stable (+2%) when compared to the volumes registered in 2013. The largest changes were reported in the OIS segment (+47%) and in the other IRS segment (-21%). Both the FX swap and Xccy swap segments rose by 8-9%, while the FRA segment dropped by 10%.
5.2 Maturity analysis
Despite the fact that the total OIS market turnover remained stable in 2013 in comparison to 2012, there were some small shifts in the different maturity buckets. The steady activity was mainly due to the absence of
Chart 32Cumulative quarterly turnover in various OTC derivatives markets(index: OTC derivatives volume in 2003 = 100)
0
20
40
60
80
100
120
140
160
2003 2005 2007 2009 2011 2013
OISsFX swapsother IRSsXccy swapsFRAs
Note: The panel comprised 101 credit institutions.

45Euro money market study, 2014
arbitrage opportunities in the low-volatility and low and stable-rate environment (see Chart 33).
In 2014 turnover in all maturity buckets up to six months increased, particularly for the shorter maturities. The contracts expiring in less than one week increased the most (+211%), followed by those expiring between one week and one month (+129%) and those expiring between one month and three months (+54%). This increase was mostly due to lower excess liquidity and more volatile EONIA fixings. However, turnover in the maturity bucket between six months and one year decreased by 44%.
The maturity-weighted distribution of OIS turnover shows a sharp decrease in the share of the six months to one year tenure. The shares of other maturities increased slightly (see Chart 34).
The turnover in the other IRS market segment increased for all maturity buckets between one and ten years in 2013, while it dropped for all maturity buckets in 2014 (see Chart 35).
In 2013 the need for shorter-dated swaps was low owing to the lower rates and reduced volatility on short-term rates, explaining the limited increase observed in the up to two year maturity bucket (+6%) in comparison to the low activity registered in 2012. An even larger increase (+48%) was registered in the two to five years maturity bucket. The five
Chart 34Maturity-weighted breakdown of cumulative quarterly turnover in the OIS segment(percentages of total)
0
5
10
15
20
25
30
35
40
< 1w 1wto1m
1mto3m
3mto6m
6mto1y
> 1y
20132014
Note: The panel comprised 154 credit institutions.
Chart 35Cumulative quarterly turnover in the IRS segment
(index: IRS volume in 2003 = 100)
0
50
100
150
200
250
300
350
2003 2005 2007 2009 2011 2013
more than 10 years5 to 10 years2 to 5 years1 year to 2 yearsup to 1 year
Note: The panel comprised 101 credit institutions.
Chart 33Cumulative quarterly turnover in the OIS segment
(index: OIS volume in 2003 = 100)
0
20
40
60
80
100
120
2003 2005 2007 2009 2011 2013
less than 1 week1 week to 1 month1 month to 3 months3 to 6 months6 months to 1 yearmore than 1 year
Note: The panel comprised 101 credit institutions.

46Euro money market study, 2014
to ten years maturity bucket rose by 41% in 2013 compared with 2012. For longer-dated swaps, banks also reported a lower need (-12%) to hedge interest rate risks.
The decrease in turnover in 2014 mainly took place in the up to two years maturity bucket, which declined by 39% and to a lesser extent in the two to five years and five to ten years maturity buckets, which declined by 10% and 20% respectively. The medium-term IRS volumes declined as volatility in medium-term rates subsided.
Turnover in the FRA segment increased slightly (+6%) in 2013 compared with 2012. The increase was only slight because of the lower market volatility and the low interest rate environment, which reduces the use of FRAs as a hedging instrument. There was a drop in activity in short-tenor FRAs mainly owing to the stable ECB rate policy, which results in a limited need to hedge one-month mismatches (see Chart 36).
In 2014 turnover dropped by 10%, which can be mainly attributed to lower market volatility and the low interest rate environment. The one to three months and the six months to one year segments lost ground (-33% and -10% respectively) in favour of the less than one week and the more than one year segments (+26% and +44% respectively).
The decrease in the overall FX swap turnover in 2013 (-12%), which was essentially a consequence of improved funding conditions in the US dollar (see Box 6), was visible in all segments (it was more pronounced, however, in the segments above three months and to a somewhat lesser extent in the O/N segment). The negative performance in 2013 was followed by an increase in turnover in 2014 (+9%), mainly in the O/N segment (+25%). In 2014 the increase can be attributed to higher market volatility in the short term, mostly driven by less excess liquidity ahead of the negative interest rate policy set by the Eurosystem and the suspension of the SMP absorbing operations (see Chart 37).
Chart 37Cumulative quarterly turnover in the FX swaps and forwards segment(index : FX swaps and forwards volume in 2003 = 100)
0
20
40
60
80
100
120
140
160
180
2003 2005 2007 2009 2011 2013
1 month to 3 months1 week to 1 monthless than 1 weekO/N
more than 1 year6 months to 1 year3 to 6 months
Note: The panel comprised 101 credit institutions.
Chart 36Cumulative quarterly turnover in the FRA segment
(index: FRA volume in 2003 = 100)
0
50
100
150
200
250
300
350
2003 2005 2007 2009 2011 2013
3 to 6 months1 month to 3 months1 week to 1 monthless than 1 week
more than 1 year6 months to 1 year
Note: The panel comprised 101 credit institutions.

47Euro money market study, 2014
Looking at the maturity-weighted breakdown, Chart 38 shows that transactions with maturities up to three months increased in maturity-weighted terms, whereas transactions with maturities of more than six months decreased.
The total turnover in cross-currency swaps (see Chart 39) has remained quite stable since 2012, although there were changes in the maturity buckets. In 2013 the total turnover decreased by 11%, with the largest decrease being observed in the up to one year segment (-31%) where the rates were lower, which resulted in a reduction in the volumes, whereas the five to ten year segment rose substantially (+59%).
In 2014 the total turnover increased by 8%.The largest increases were noted in the two to five years and the more than ten years segments (+35% and +57% respectively). The Xccy market was stable with fair volumes in all major Xccy crosses, with the majority of the turnover in the segments between two and five years.
As regards the maturity-weighted breakdown, the maturity buckets up to five years increased their share, whereas longer maturities decreased their share (see Chart 40).
Swap Execution Facility in the United States
The Dodd-Frank Act led to the creation of Swap Execution Facilities (SEFs). The main goals of
Chart 40Maturity-weighted breakdown of cumulative quarterly turnover in the Xccy swaps segment(percentages of total)
0
10
20
30
40
50
60
<1y 1yto2y
2yto5y
5yto
10y
>10y
20132014
Note: The panel comprised 154 credit institutions.
Chart 38Maturity-weighted breakdown of cumulative quarterly turnover in the FX swaps and forwards segment(percentages of total)
0
5
10
15
20
25
30
O/N < 1w 1w to 1m
1m to 3m
3m to 6m
6m to 1y
>1y
20132014
Note: The panel comprised 154 credit institutions.
Chart 39Cumulative quarterly turnover in the Xccy swaps segment(index: Xccy swaps volume in 2003 = 100)
0
50
100
150
200
250
300
2003 2005 2007 2009 2011 2013
more than 10 years5 to 10 years2 to 5 years1 year to 2 yearsup to 1 year
Note: The panel comprised 101 credit institutions.

48Euro money market study, 2014
SEFs are to reduce systemic risk and bring greater transparency to the OTC market, but also to improve safety by means of a reduction in counterparty and operational risks. The US Commodity Futures Trading Commission (CFTC) adopted the final rules, guidance and acceptable practices on SEFs on 16 May 2013. Between 2 October 2013 and 15 February 2014 the majority of major North American derivatives market participants took measures to comply with these rules. SEFs report real-time data and creation data for all swaps executed on their platform to Swap Data Repositories (SDRs). In Europe, a similar regulation will be in force via EMIR (European Market Infrastructure Regulation).
5.3 Market structure
With regard to the efficiency of the various OTC derivative market segments in 2013, respondents deemed all segments, except Xccy swaps, more efficient than in 2012. There was a particular improvement in efficiency in the FRA and FX swap segments.
In 2014 all segments, apart from the OIS segment, were perceived as less efficient than in 2013. The largest decline in efficiency was observed in the IRS segment (see Charts 41 and 42).
Participating banks stated that market liquidity in 2013, compared to 2012, did not change for the OIS, FRA and IRS segments and that it improved for the Xccy and FX swap segments. The largest improvement in market liquidity was seen in the Xccy swap segment.
Liquidity conditions in 2014 were deemed “unchanged” in the IRS, Xccy and FX swap segments, whereas they were deemed to have improved slightly in the OIS segment (more respondents said that liquidity improved slightly and fewer said that it worsened significantly). In the FRA segment, however, more respondents said liquidity conditions had worsened slightly in comparison with 2013.
Chart 41Is the FX swaps segment efficient?
(percentages of total)
0
20
40
60
80
100
2003 2005 2007 2009 2011 2013
limited and not efficient not efficient1)
limitedly efficient1) sufficiently efficientsignificantly efficient extremely efficient
Note: The panel comprised 101 credit institutions.1) Reporting started in 2012.
Chart 42Has the market liquidity in the OIS segment changed with respect to last year?(percentages of total)
0
20
40
60
80
100
2003 2005 2007 2009 2011 2013
has improved significantlyhas improved slightlyhas not changed
slightly1)
significantly1)
has worsened
Note: The panel comprised 101 credit institutions.1) Reporting started in 2012.

49Euro money market study, 2014
The geographical counterparty analysis shows that the counterparty structure remained quite stable in all segments in 2013, except for the FRA segment where the share of national counterparties rose from 20% to 27% (see Charts 43 and 44). In 2014 the share of transactions with euro area counterparties dropped in all segments, most noticeably in the OIS and IRS segments. In the OIS segment, this drop was in favour of transactions with national counterparties (+50%), while in the IRS segment, the drop was in favour of other counterparties (+25%).
As for the trading structure, the share of activity conducted via direct trading increased overall in 2013, except for in the Xccy swap segment. That movement was reversed in 2014. Furthermore, a clear trend can be seen in the IRS segment, where the share of electronic trading has been steadily increasing since 2008 (see Table 3).
As regards concentration, data from the 2014 EMMS show that activity in euro OTC derivatives remained quite concentrated (see Table 4). The concentration for the top
five and top ten banks increased significantly for OISs, other IRSs and FRAs compared with the 2012 data.
Table 3Transactions with counterparties in the second quarter of 2014(percentages)
Direct trading
Via voice broker
Via electronic trading
OIS 25 56 19IRS 20 26 54FRAs 5 56 39FX swaps 29 40 31Xccy swaps 26 62 12
Note: The panel comprised 154 credit institutions.
Chart 43Counterparty structure of OIS transactions
(percentages of total)
0
20
40
60
80
100
2003 2005 2007 2009 2011 2013
othereuro areanational
Note: The panel comprised 101 credit institutions.
Chart 44Trading structure of FX swap transactions
(percentages of total)
0
20
40
60
80
100
2003 2005 2007 2009 2011 2013
electronic tradingvoice brokerdirect trading
Note: The panel comprised 101 credit institutions.
Table 4Concentration of activity in OTC derivatives and short-term securities in 2014 (percentages)
OISs Other IRSs FRAs FX swaps Xccy swaps
Top 5 banks 56.0 72.7 64.9 38.4 55.8
Top 10 banks 79.3 88.1 86.9 58.4 79.3
Top 20 banks 94.0 95.6 98.4 82.4 94.3
Note: The panel comprised 154 credit institutions.

50Euro money market study, 2014
Box 6The FX swap market: some evidence of market access recovery after the crisis
Following the financial crisis in 2011, tensions are no longer visible in the FX swap market. The difficult price conditions in FX swaps for European banks to source funding for their US dollar assets in the US money market peaked during the last quarter of 2011. These challenges significantly improved thereafter, as can be illustrated by the developments in cross-currency basis swaps in EUR/USD (see Chart A). The decision to reduce the costs for US dollar operations by 50 basis points in November 2011 in conjunction with both three-year LTROs in December 2011 and February 2012 helped alleviate the cost of funding issues. The co-movement of the EUR/USD basis swap with the EURIBOR/OIS spread can be viewed as a good indicator of the easing of stress in USD funding markets.
Chart B shows that the US dollar liquidity provided by the Eurosystem has decreased substantially since then for European banks. In this respect, the recommendations39 of the European Systemic Risk Board (ESRB) that national supervisory authorities should closely monitor banks’ US dollar-denominated funding and liquidity and ensure that contingency funding plans are in place might also have played a role. In the second quarter of 2012 the outstanding amount of USD liquidity provided by the ECB was USD 26.9 billion, on average. Two years later the outstanding amount of USD operations had fallen to USD 0.3 billion, on average.
The three-year LTROs also indirectly had a positive lasting impact by improving, at least temporarily, the environment for banks’ issuance in the market. In June 2014, however, the Federal Reserve Board, the
Federal Deposit Insurance Corporation and the Office of the Comptroller of the Currency adopted rules that established a floor for the risk-based capital requirements applicable to the largest, internationally active banking organisations. For foreign banks based in the United States, the
39 Recommendation of the ESRB of 22 December 2011 on “US dollar-denominated funding of credit institutions” (ESRB/2011/2), OJ C 72/01.
Chart AThree-month EURIBOR/OIS and three-month cross-currency basis swap(percentages; basis points)
20
-20
-40
-60
-80
-100
-120
-140
-160
-180
0
1.2
1.0
0.6
0.8
0.4
0.2
0.02010 2011 2012 2013 2014
three-month spread EURIBOR/OISEUR/USD three-month cross-currency basis swap
Source: Bloomberg
Chart BRecourse to Eurosystem USD liquidity operations(EUR billions)
0
50
100
150
200
250
2008 2009 2011 20132010 2012 2014
84-day28-dayO/N
35-day7-day
Source: ECB

51Euro money market study, 2014
final rule will establish a US intermediate holding company requirement for foreign banking organisations with USD 50 billion or more in US non-branch assets. These institutions will have to comply with stricter requirements for risk-based, leverage capital, liquidity, risk management and stress tests requirements.
The relatively good functioning of the FX swap market, as indicated by the high turnover in this market segment and the low recourse to the ECB operations in US dollars in 2013 and 2014, confirms that most European banks managed to secure their funding via the market and that the Eurosystem’s USD operations currently function as a backstop facility. At the moment only a seven-day operation is offered, with the 84-day operation having been discontinued in April 2014.
To gain a better understanding of the FX swap market, we examine the answers to the question on the currency breakdown of FX swaps and FX forwards introduced in the 2012 EMMS. The survey includes only transactions of FX swaps with one euro leg; for the second legs the new question shows a rise in the concentration of transactions in EUR/USD from 76.6% to 82.1% between 2013 and 2014 (see Charts C and D).
The share of currencies other than the British pound (EUR/GBP), the Japanese yen (EUR/JPY) and the Swiss franc (EUR/CHF) fell from 9.8% in 2013 to 6.1% in 2014. The share of EUR/GBP, EUR/CHF and EUR/JPY fell from 8% to 6.2%, from 4.7% to 3.9% and from 3.5% to 1.7% respectively.
The answers are comparable with the latest BIS 2013 triennial survey, which now provides a similar currency pair breakdown for FX swaps alone (EUR/USD 81%, EUR/GBP 6%, EUR/CHF 3% and EUR/JPY 3%). The EMMS weights for 2013 amounted to 76.6%, 6.6%, 4.2% and 2.8% respectively, explaining the slight inter temporal difference in the weight of EUR/JPY transactions.
Chart CBreakdown, by currency, of transactions in the FX swaps and forwards segment in 2013(percentages of total)
EUR/USD76.62
EUR/CHF4.2
EUR/JPY2.76
EUR/GBP6.61
other9.83
Note: The panel comprised 154 credit institutions.
Chart DBreakdown, by currency, of transactions in the FX swaps and forwards segment in 2014(percentages of total)
EUR/USD82.1
EUR/CHF3.85
EUR/JPY1.72
EUR/GBP6.22
other6.11
Note: The panel comprised 154 credit institutions.

52Euro money market study, 2014
6 The short-term interest rate futures and options markets
The euro short-term interest rate futures and options markets have continued their post-crisis recovery and are considered more efficient since 2012. The period between 2013 and 2014, in terms of short-end interest rate expectations, was characterised by a number of different developments. The decline that can be observed in the volume of futures and options traded is likely to be due to the low interest rate environment and forward guidance which reduced uncertainty about the forward path of interest rates. Equally, non-standard measures, aimed at ensuring sufficient levels of excess liquidity in the system, were also conducive to the smooth functioning of the futures and options money markets, even though the repayments of the two three-year LTROs did cause some uncertainty at times as to the path of excess liquidity levels. In addition, some spikes in the volatility of EURIBOR rates were observed surrounding some Governing Council meetings, reflecting adjustments to expectations of monetary policy decisions and their impact on short-term rates.
Overall, however, these developments contributed to improved conditions in the short-term interest rate futures and options markets that are reflected in the annualised basis point volatility of EURIBOR futures options, which has declined significantly over the period.
6.1 EURIBOR-related instruments
6.1.1 Market developments and volatility
Volatility in short-term euro interest rates, as measured by the annualised basis point volatility on three-month EURIBOR futures contracts (see Chart 45), has declined since the last Money Market Survey in 2012. Volatility in yield levels shows a number of noticeable spikes around some ECB policy meetings as market participants reacted to rate cuts and other policy announcements by revising their views on short-term rates. However, an overall trend of a decline in volatility levels is illustrated by the annualised basis points measure in the chart. This is consistent with the improvement in the markets recorded by the qualitative survey data (discussed later) and the impact of a low interest rate environment with forward guidance.
Short-term euro interest rate levels, as measured by three-month EURIBOR rates, declined to record low levels by the end of the second quarter of 2014 (0.2% on 30 June). The more recent downward moves (0.12%
Chart 45Annualised basis point volatility on three-month EURIBOR futures
0
0.1
0.2
0.3
0.4
0.5
0.6
0.7
0.8
0.9
2008 2009 2010 2011 2012 2013 2014
basis point volatlity annualised
Source: Bloomberg

53Euro money market study, 2014
on 22 October) have been caused by the ECB rate cut in June 2014 (and supported by the subsequent September rate cut) and this downward trend has been further supported by market expectations of accommodative policy measures from the ECB.40
6.1.2. EURIBOR futures and options trading volumes
The three-month EURIBOR futures contracts and futures options market volume traded on Liffe41 has declined in volume compared with 2012 (see Charts 46 and 47). The options market average monthly volume has declined to below €5 trillion from the peak years of 2010 and 2011 (see Chart 46). The month-end open interest42, one measure of market liquidity in options markets, has also declined from its 2012 level (see Chart 48). Thus both volume and open interest indicate lower activity for the year to date in 2014. In the futures market, as shown in Chart 46, the average monthly volume increased in 2013, but the latest data available in 2014 (the last observation is for June) indicate that the average monthly volumes for the year to date represent the lowest average volume during the observation period. However, open interest in futures markets has remained relatively steady (see Chart 48).
The ongoing investigation into fraudulent behaviour by banks that contribute to reference rates and a related discussion about possible reforms to EURIBOR may have negatively affected volumes in the short-term interest rate market. A possible reduction in the need to hedge short-term interest rate positions in light of the ECB’s forward guidance on rates may also have contributed to the general decline in volumes. However, EURIBOR volumes continued to spike around ECB Governing Council meetings, most notably at the June and September 2014 meetings when the policy rate was reduced by 10 basis points.
40 Three-month EURIBOR futures implied rates for September 2016 stood at around 0.2% as of 22 October 2014.
41 With a 99% market share Liffe continues to be the dominant exchange for euro interest rate futures and options.42 Liffe calculates open interest as the quantity of open long positions for a given contract/series. The data
used is a month-end snapshot.
Chart 46Three-month EURIBOR futures and options
(EUR trillions; monthly average volume)
0
5
10
15
20
25
2006 2007 2008 2009 2010 2011 2012 2013 2014
3-month EURIBOR futures3-month EURIBOR options and 3-month EURIBOR mid-curve
Source: NYSE Liffe.
Chart 47EURIBOR futures
(EUR trillions; monthly volumes)
1
2
4
6
8
10
12
14
16
Jan. Feb. Mar. Apr. May June July Aug. Sep. Oct. Nov. Dec.
201220132014
Source: NYSE Liffe.

54Euro money market study, 2014
6.2 Bank for International Settlements data
According to Bank for International Settlements (BIS) data for exchange-traded interest rate derivatives in Europe, the notional principal amount outstanding in interest rate futures has risen since the last Money Market Study in 2012 (see Chart 49). The amount of futures outstanding rose quite rapidly to approximately USD 140 trillion in March 2013. Amounts outstanding have declined more recently in view of the continued low interest rate environment, which has been intensified by forward guidance that rates in the euro area will be kept low for a significant period of time. Amounts outstanding fell to approximately USD 121 trillion by March 2014. A similar pattern emerges from the BIS data examining the notional principal amount outstanding in interest rate options (see Chart 50), where a sharp rise in
Chart 48Liffe three-month EURIBOR options and futures month-end open interest
0
1,000,000
2,000,000
3,000,000
4,000,000
5,000,000
6,000,000
0
2,000,000
4,000,000
6,000,000
8,000,000
10,000,000
12,000,000
14,000,000
16,000,000
18,000,000
2006 2008 20092007 2010 2011 2012 2013 2014
3-month EURIBOR3-month EURIBOR mid curve
3-month EURIBOR futures
Source: Bloomberg
Chart 49Amount outstanding in interest rate futures in the EU
(USD billions)
0
20,000
40,000
60,000
80,000
100,000
120,000
140,000
160,000
180,000
200,000
2000 2002 2004 2006 2008 2010 2012
interest rate futures
Source: BIS.
Chart 50Amount outstanding in interest rate options in the EU
(USD billions)
0
10,000
20,000
30,000
40,000
50,000
60,000
70,000
80,000
90,000
interest rate options
2000 2002 2004 2006 2008 2010 2012
Source: BIS.

55Euro money market study, 2014
amounts outstanding until March 2013 has since been followed by a sharp decline towards 2012 figures.
Additional BIS data for the number of futures and options contracts traded gives the same picture, with both sets of data showing a rise and fall in contracts traded. The number of futures contracts outstanding in March 2014 stood at 225 million compared with 214 million in June 2012, while the number of options contract outstanding in March 2014 stood at 44 million compared with 51 million in June 2012.
6.3 Money Market Survey qualitative data
Turning to the qualitative part of the 2014 EMMS, it can be observed that the options market continues to be mostly assessed as “sufficiently efficient” or “significantly efficient” (see Chart 51). All market participants surveyed assess that the market is at least “sufficiently efficient”, with no respondents in 2013 and 2014 stating that there is limited efficiency. The overall share of participants stating that the market is “significantly efficient” has risen substantially, from 32% in the 2012 survey to 76% in the 2014 survey. The number of respondents who consider the market to be “extremely efficient” has decreased, however, with 12% of participants responding in this manner in 2014 compared with 20% in 2012.
As regards the perception of liquidity conditions in the options market, participants who reported that liquidity has worsened slightly represented a much lower market share in 2014, namely 27%, down from 53% in 2012 (see Chart 52). However, this proportion has risen somewhat since 2013. The vast majority of market participants (71%) stated that liquidity within the market had not changed (up from 47% in
Chart 51Is the options segment efficient?
(percentages of total)
0
20
40
60
80
100
2003 2005 2007 2009 2011 2013
extremely efficientsufficiently efficientnot efficient1)
significantly efficientlimitedly efficient1)
limited and not efficient
Note: The panel comprised 101 credit institutions.1) Reporting started in 2012.
Chart 52Has the market liquidity in the options market changed with respect to last year?(percentages of total)
0
20
40
60
80
100
2003 2005 2007 2009 2011 2013
has improved significantlyhas not changedsignificantly1)
has improved slightlyslightly1)
has worsened
Note: The panel comprised 101 credit institutions.1) Reporting started in 2012.

56Euro money market study, 2014
the 2012 survey), while 2% of respondents stated that market conditions had improved slightly. No participant reported an improvement in market conditions in the 2012 survey and only 1% reported a slight improvement in 2013.
Money Market Survey respondents consider the futures market segment efficient, since none of them perceive it as “limitedly efficient” or less efficient (see Chart 53). The majority (59%) of the market participants continue to perceive the futures segment to be “extremely efficient”, which has been the case since 2011. The most notable difference can be observed in the change in the proportion of respondents who regard markets as “significantly efficient” and “sufficiently efficient”, as the former has grown at the expense of the latter. In 2011 little more than 30% perceived the market segment as sufficiently efficient: this fell to 3% in 2014. In this regard, the market qualitative assessment of the efficiency of the futures segment has improved. The perceptions of market liquidity in the futures market have stayed somewhat unchanged (see Chart 54). The share of participants reporting a slight deterioration in market liquidity has grown in comparison with last year. In 2014 this share was 19%, up from 5% in 2013, albeit still less than the level recorded in 2012.
Box 7Segmentation in the euro money market
Introduction
Since the onset of the sovereign debt crisis, segmentation has proven to be one of the main features of the euro money market, despite the not insignificant improvements observed following the introduction of the three-year LTROs implemented by the Eurosystem at the end of 2011 and
Chart 53Is the futures segment efficient?
(percentages of total)
0
20
40
60
80
100
2003 2005 2007 2009 2011 2013
extremely efficientsufficiently efficientnot efficient1)
significantly efficientlimitedly efficient1)
limited and not efficient
Note: The panel comprised 101 credit institutions.1) Reporting started in 2012.
Chart 54Has the market liquidity in the futures market changed with respect to last year?(percentages of total)
0
20
40
60
80
100
2003 2005 2007 2009 2011 2013
has improved significantlyhas not changedsignificantly1)
has improved slightlyslightly1)
has worsened
Note: The panel comprised 101 credit institutions.1) Reporting started in 2012.

57Euro money market study, 2014
the beginning of 2012, and the announcement of Outright Monetary Transactions (OMTs) in August 2012.43
This box analyses the geographical segmentation across different market segments, focusing on interest rates, trading volumes and liquidity distribution.
Evidence on money market rates – price-based indicators
The unsecured euro money market was stable in terms of the volatility of EONIA contributions until mid-2014. Since the ECB rate cut in June the dispersion of EONIA contributions has clearly declined along with EONIA volatility, as shown in Chart A. This result may also be connected with the “zero lower bound” effect, as some counterparties tend to refrain from trading at negative rates, resulting in a narrowing of the range of contributions.
Following a sharp decrease in secured euro money market rates after the implementation of the two three-year LTROs, the three-month repo rates spread of Italian and Spanish collateral versus repo rates of German collateral reached levels in October 2014 below those observed at the beginning of 2013 (see Chart B). In particular, Italian collateral repo rate spreads, following a period of divergence during the first half of 2013, declined from an average peak of 26 basis points in August 2013 to seven basis points in October 2014. Likewise, Spanish differentials shrank from an average peak of 17 basis points in December 2013 to eight basis points in October 2014. The introduction of a negative deposit facility rate in June 2014 may indeed have helped to ease interest rate differentials across countries in the secured euro money market. Additionally, some rating upgrades may have spurred the tightening of spreads across countries in the course of 2014.
43 See the ECB report entitled “Financial Integration in Europe”, ECB, April 2014, and Box 9 in the 2012 Euro Money Market Survey, ECB, 2012.
Chart ACross-sectional standard deviation and amplitude of EONIA contributions
(five-day moving average; as a percentage)
0.0
0.1
0.2
0.3
0.4
0.5
0.6
0.7
0.8
0.9
1.0
cross-sectional standard deviation of EONIA contributionsamplitude of EONIA contributions
ECB rate cutto 0.15% (MRO)
and to -0.10% (DF)
ECB rate cutto 0.05% (MRO)
and to -0.20% (DF)
June Aug. Oct. Dec. Feb. Apr.June Aug. Oct. June Aug. Oct.Dec. Feb. Apr.2012 2013 2014
Sources: EMMI and ECB calculations.

58Euro money market study, 2014
Further reduction in fragmentation within the euro money market could be brought about by the upcoming launch and implementation of the first pillar of the banking union (the Single Supervisory Mechanism), as part of the new system of banking supervision. The higher level of transparency granted by the recent stress testing exercise and asset quality review may improve interbank and market confidence, and the entailed shift to a supranational level playing field is likely to dull national differences in liquidity distribution. Further reduction in segmentation may reasonably be assumed to occur with the subsequent implementation of the Single Resolution Mechanism, owing to the widespread increase in confidence that it should bring.
Evidence on volumes and liquidity distribution – quantity-based indicators
Although EONIA rates are currently at their lowest level, EONIA volumes remained subdued throughout 2013 compared with their pre-crisis level, which was close to the levels seen at the end
Chart BThree-month repo rates for different types of general collateral and spreads to Germany
(ten-day moving average; as a percentage; monthly averages; basis points)
Feb. May Aug. Oct. Jan.Jan. Apr. July Oct.2013 2014
-0.2
-0.1
0.0
0.1
0.2
0.3
0.4
0.5
0.6
DEES
ITFR
-10
-5
0
5
10
15
20
25
30
Jan. Dec.Feb. Apr. June Aug. Oct. Feb. Apr. June Aug. Oct.2013 2014
ESITFR
Sources: Bloomberg composite and ECB calculations.

59Euro money market study, 2014
of 2011 (see Chart C). However, after reaching their lowest levels at the end of 2012, there has since been an upward trend in EONIA volumes, further stimulated by the ECB rate cuts in June and September 2014 and the suspension of the SMP absorption operations.
Recent data also confirm a positive trend in the secured market, as repo volumes have recovered from the beginning of 2013. In addition, this year’s survey shows greater reliance on non-national counterparties for both secured and unsecured segments, signalling a slight increase in cross-border money market transactions.
The 2014 EMMS also reports a higher level of money market activity which is consistent with the considerable reduction in excess liquidity over the past two years. While daily excess liquidity was close to €800 billion after the second three-year LTRO, it averaged €130 billion in the first three quarters of 2014. Indeed, recourse to Eurosystem monetary policy refinancing has declined, mainly owing to early repayments on three-year LTROs.
In spite of signs of recovery in the euro money market suggesting a desegmentation trend, the excess liquidity is still unevenly distributed among euro area countries. The developments in TARGET2 balances are a suitable indicator for the degree of money market segmentation. Although current balances per country are far above pre-crisis levels, the downward trend since mid-2012 reflects some improvement.
Chart CEONIA rate and volumes and GC Pooling overnight rates and volumes
(20-day moving average percentages; EUR billions)
0
12
24
36
48
60
-0.25
0.00
0.25
0.50
0.75
1.00
MROEONIA rateGC Pooling EXTended rateGC Pooling rate
DFGC Pooling EXTended volume (right-hand scale)GC Pooling volume (right-hand scale)EONIA volume (right-hand scale)
Mar. May July Sep. Nov.Jan. Mar. May July Sep. Nov.Jan. Mar. May July Sep.Jan.2012 2013 2014
Sources: Bloomberg and STOXX for GC Pooling and GC Pooling ECB EXTended basket.

60Euro money market study, 2014
7 The short-term securities market
7.1 Analysis of turnover in the secondary market
With the exception of the second quarter of 2011 when transactions peaked, the total turnover in outright transactions has been hovering around €1 billion since 2004 (see Chart 55). The global stability hides a strong and persistent dichotomy between deals on government securities and deals on private securities. Transactions on government issues have been trending higher since 2004 and have actually increased by 136% since then. Conversely, turnover in banking and non-banking sector securities has declined sharply by 36% and 29% respectively since 2004.
These changes are reflected in the structure by issuers of outright transactions. The share of issuance by public names rose from 35% in the second quarter of 2004 to 66% in the second quarter of 2014. Conversely, the share of issuance by banks in the second quarter of 2014 (20%) is half of the share recorded in the second quarter of 2004 (40%), while the share of issuance by non-banks has declined from 25% to 14% (see Chart 56).
7.2 Outstanding amounts and issuance
Gross issues have been declining strongly since mid-2008 and are now well below their pre-crisis level. This change is mainly attributable to the developments in the bank issuing market which represents on average around 70% of total issuances over the last decade. The average of gross issuances during the seven first months of 2014 is almost 59% below the average of gross issuances for the same months of 2007 and almost 44% below the average of gross issuance for 2011, a year when issuance activities briefly recovered thanks to a peak in banking sector issues.
Chart 55Total turnover in outright transactions
(index; outright transaction volume 2004 = 100)
180
160
140
120
100
80
60
40
20
02004 2006 2008 2010 2012 2014
government issuesbank issuesnon-bank issues
Note: The panel comprised 101 credit institutions.
Chart 56Breakdown of turnover by issuance sector
(percentages)
100
90
80
70
60
50
40
30
20
10
02004 2006 2008 2010 2012
government issuesbank issuesnon-bank issues
Note: The panel comprised 101 credit institutions.

61Euro money market study, 2014
The breakdown by sector shows a reduction of 72% between 2007 and 2014 and of 57% between 2011 and 2014. Similarly, corporate issuance has declined by 53% since 2007 but has been somewhat stable since 2011. By contrast, government securities issuance has experienced a 52% increase between 2007 and 2014, reflecting euro area governments’ higher funding needs. However, since 2011 public issuance has decreased by 11%. As a result, its share has increased over that past few years from 17% in 2012 to 25% in 2013 and 28% in 2014 (while the average share for the period 2004-14 was 15%).
The negative trend observed in issuances, notably since 2011, has strongly impacted outstanding amounts. They have experienced an 18% decrease between 2011 and 2014. Outstanding amounts of MFI and government short-term securities have dropped by 25% and 18% respectively, while outstanding amounts of corporate short-term securities have remained stable. For the banking sector overall, banking issuance has remained on a downward trend since the collapse of Lehman Brothers, such that outstanding amounts are still lower than in 2009.
7.3 The efficiency and liquidity of the short-term securities market
The qualitative information gathered in the survey provides some features that contrast with the statistical data analysis. Indeed, since the release of the last survey, the market participant sentiment about market conditions is clearly improving. Regarding market efficiency, no surveyed counterparty considers the market not efficient, while the share of counterparties that describe the market as “sufficiently” or “significantly” efficient has increased by 36 percentage points since 2012. In addition, 5% of counterparties in 2014 considered the market extremely efficient while in 2012 none did.
Chart 57Gross issuances of euro-denominated short-term securities by issuing sector since January 2004(EUR billions)
200
0
400
600
800
1,000
1,200
1,400
2004 2006 2008 2010 2012 2014
totalcorporateMFIgovernment
Source: ECB statistics database.
Chart 58Outstanding amounts of euro-denominated short-term securities by issuing sector since January 2004(EUR billions)
0
200
400
600
800
1,000
1,200
1,400
1,600
1,800
2004 2006 2008 2010 2012 2014
totalcorporateMFIgovernment
Source: ECB statistics database.

62Euro money market study, 2014
As regards the perception of market liquidity, the picture has also clearly improved since 2012. The share of market participants that consider that liquidity has declined “significantly” or “slightly” has dropped by 24 percentage points. On the contrary, the share of survey counterparties that indicate that liquidity has improved “significantly” or “slightly” has increased by around 15 percentage points. However, the bulk (47%) of counterparties describes stable liquidity conditions, just like in 2012.
The diverging signals between quantitative and qualitative data may be explained by the ongoing deleveraging process across the euro area, notably as far as the banking sector is concerned. However, the clear improvement in qualitative data is encouraging and indicates that more favourable market conditions for a recovery are prevailing.
7.4 Market structure
Compared to the previous survey, the geographical structure of transactions in the short-term securities market continues to exhibit a refocusing of transactions among counterparties located in the euro area. The shares of domestic and euro area counterparties have remained stable, at 31% and 50% respectively in 2014, versus 30% and 54% in 2012.
Regarding the trading structure, the share of direct transactions over the total has sharply declined in 2014 to 52% compared with the historical peak of 76% in 2007 and 2012. This drop mirrored a significant increase in the share of electronic trading to 23% in 2014 instead of 14% in 2012. Voice brokerage has also risen since 2012, reaching a share of 25% in 2014.
Chart 59Is the short-term securities segment efficient?
(percentages of total)
100
90
80
70
60
50
40
30
20
10
02004 2006 2008 2010 2012 2014
limited and not efficientnot efficient1)
limitedly efficient1)
sufficiently efficientsignificantly efficientextremely efficient
Notes: The panel comprised 101 credit institutions.1) Reporting started in 2012.
Chart 60Has the market liquidity for short-term securities changed with respect to last year?(percentages of total)
100
90
80
70
60
50
40
30
20
10
02004 2006 2008 2010 2012 2014
has worsenedsignificantly1)
slightly1)
has not changedhas improved slightlyhas improved significantly
Notes: The panel comprised 101 credit institutions.1) Reporting started in 2012.

63Euro money market study, 2014
Box 8The French commercial paper market in 2013-14
The French short and medium-term negotiable debt securities market (also called the French commercial paper or TCN market) is an over-the-counter market which hosts the following types of issuers:
(i) credit institutions (banks) that issue certificates of deposit (CDs) of up to one-year maturity and negotiable medium-term notes (bons à moyen terme négociables (BMTN)) of over one year;
(ii) non-financial institutions (public and private companies, public agencies and local authorities) that issue commercial papers (billets de trésorerie (BT)) and BMTN; and
(iii) special purpose vehicles that issue asset-backed commercial paper (ABCP).
Chart 61Counterparty structure of short-term securities transactions(percentages of total)
0
10
20
30
40
50
60
70
80
90
100
2004 2006 2008 2010 2012 2014
nationaleuro areaother
Note: The panel comprised 101 credit institutions.
Chart 62Trading structure of short-term securities transactions
(percentages of total)
0
10
20
30
40
50
60
70
80
90
100
2004 2006 2008 2010 2012 2014
direct tradingvoice brokerelectronic trading
Note: The panel comprised 101 credit institutions.
Key outstanding amounts on the French TCN market over 2013-14
Outstanding (in EUR billions) 2013-14 2013-14 Over 2013-14ChangeMinimun Date Maximun Date 01/01/13 05/09/14
CertificatesofDeposit(CD) 266.9 06/01/14 373.4 22/01/13 355.3 276.3 -78.9
Commercial Paper (CP) 46.3 07/02/14 64.2 15/04/13 52.5 55.2 2.7
Asset-Backed Commercial Paper (ABCP) 3.2 30/07/14 5.0 14/01/13 4.7 3.3 -1.4
Negotiable Medium-term Notes (BMTN) 71.3 07/01/13 79.5 24/01/14 71.6 72.4 0.8
Total (TCN) 397.4 05/01/14 501.9 22/01/13 484.0 407.2 -76.9
Source: Banque de France.

64Euro money market study, 2014
Over the 2013-14 period, which was characterised by multiple decreases in monetary policy interest rates and an easier liquidity environment for the banking system, the French commercial paper market (BT) has exhibited contrasted changes in its outstanding amount. The relative resilience of the French commercial paper market lies particularly in the dynamism of corporate issuers (+€15.5 billion or +63% since January 2014, with an outstanding of €40 billion in September 2014). In the meantime, the drop in the French CD market (-€78.9 billion since January 2013) reveals fewer short-term financing needs and diversified sources of funding of banking issuers; it still remains predominant as regards outstanding French TCN as a whole. In September 2014 outstanding TCN represents 57% in outstanding STEP paper.
Chart AFrench CD outstanding
(EUR billions)
260
280
300
320
340
360
380
Jan. Mar. May July Sep. Nov. Jan. Mar. May July2013 2014
CD, total
Source: Banque de France
Chart BFrench CP outstanding
(EUR billions)
10
20
30
40
50
60
70
Jan. Mar. May July Sep. Nov. Jan. Mar. May July2013 2014
CP, public sector1)
CP, except public sectorCP, total
Source: Banque de France1) Agencies, local authorities and public companies.
Chart CAverage maturity of French CD outstanding
(in days)
100
110
120
130
140
150
Jan. Mar. May July Sep. Nov. Jan. Mar. May July2013 2014
CD, total
Source: Banque de France
Chart DAverage maturity of French CP outstanding
(in days)
40
50
60
70
80
90
100
110
120
CP, public sector1)
CP, except public sectorCP, total
Jan. Mar. May July Sep. Nov. Jan. Mar. May July2013 2014
Source: Banque de France1) Agencies, local authorities and public companies.

65Euro money market study, 2014
The average maturity of outstanding French CD has sharply extended over the 2013-14 period from 110 days in January 2013 to 139 days in September 2014, with a record level of 144 days in August 2014. This trend reflects CD investors’ search for yield in a low interest rate environment, and the ample liquidity in the very short term.
Over the 2013-14 period, average interest rates on French CDs and CPs have developed in two stages: a visible bear steepening of the yield curve between 2013 and June 2014 followed by a parallel shift of the rate curve toward lower rates within the context of the negative deposit facility rate (-0.10% in June 2014 and -0.20% in September 2014).
In spite of a deposit facility rate lowered to 0% since July 2012, fixed interest rates on French CDs and CPs issued in euro have remained positive. They reached negative levels from June 2014 onwards for the shortest tenors of below one month.
Chart EAverage interest rates on French CD issues
(percentages)
0.10
0.23
0.32
0.610.64
-0.01
0.18
0.30
0.51
-0.1
0.0
0.1
0.2
0.3
0.4
0.5
0.6
0.7
1 day 1 month 3 months 6 months 1 year
0.05
January 2013August 2014January 2014
Source: Banque de France
Chart FAverage interest rates on French CP issues
(percentages; issues in EUR; fixed rates)
January 2013January 2014August 2014
1 day 1 month 3 months 6 months 1 year
0.49
0.34
0.340.26
0.14
0.02
0.16
0.28
0.32
0.60
0.50
0.40
0.30
0.20
0.10
0.00
Source: Banque de France
Chart GMonthly French CD issuances at negative percentage level1)
(EUR billions)
0
1
2
3
4
5
6
7
Aug. Oct. Mar. June July Aug.2012 2013 2014
0.30.0 0.1
1.9
1.2
6.5
Source: Banque de France1)IssuesinEUR,fixedrates.
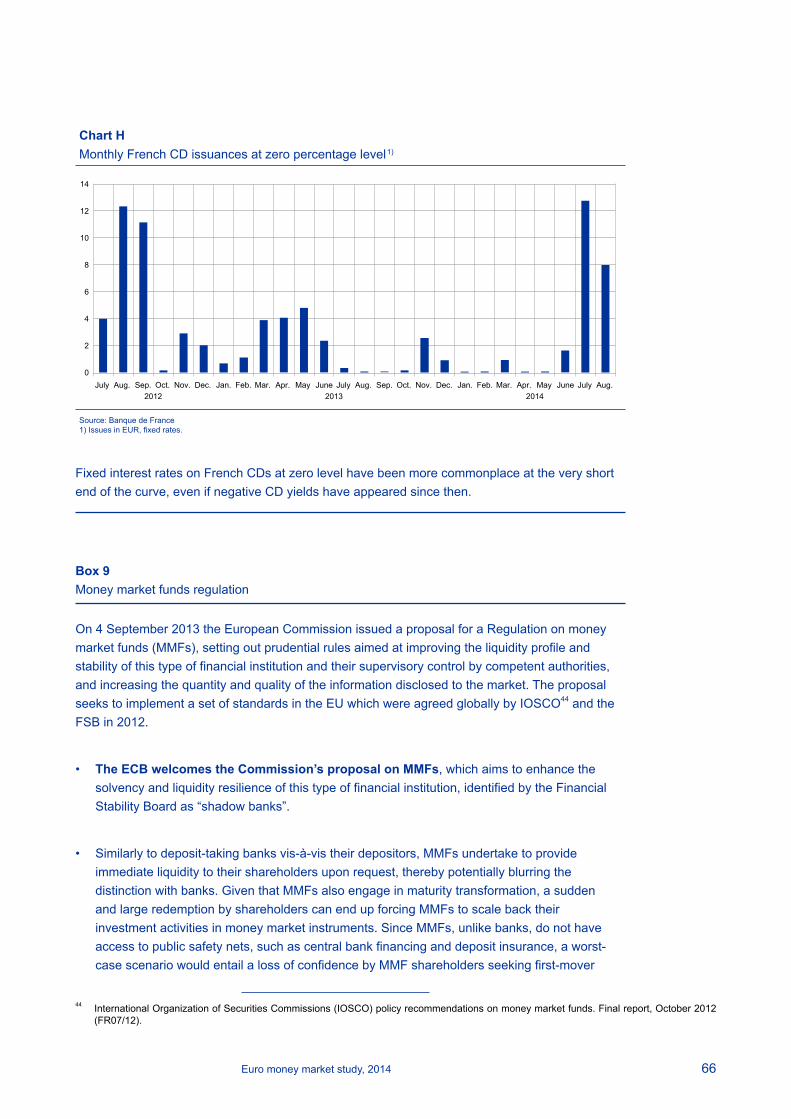
66Euro money market study, 2014
Fixed interest rates on French CDs at zero level have been more commonplace at the very short end of the curve, even if negative CD yields have appeared since then.
Box 9Money market funds regulation
On 4 September 2013 the European Commission issued a proposal for a Regulation on money market funds (MMFs), setting out prudential rules aimed at improving the liquidity profile and stability of this type of financial institution and their supervisory control by competent authorities, and increasing the quantity and quality of the information disclosed to the market. The proposal seeks to implement a set of standards in the EU which were agreed globally by IOSCO44 and the FSB in 2012.
• The ECB welcomes the Commission’s proposal on MMFs, which aims to enhance the solvency and liquidity resilience of this type of financial institution, identified by the Financial Stability Board as “shadow banks”.
• Similarly to deposit-taking banks vis-à-vis their depositors, MMFs undertake to provide immediate liquidity to their shareholders upon request, thereby potentially blurring the distinction with banks. Given that MMFs also engage in maturity transformation, a sudden and large redemption by shareholders can end up forcing MMFs to scale back their investment activities in money market instruments. Since MMFs, unlike banks, do not have access to public safety nets, such as central bank financing and deposit insurance, a worst-case scenario would entail a loss of confidence by MMF shareholders seeking first-mover
44 International Organization of Securities Commissions (IOSCO) policy recommendations on money market funds. Final report, October 2012 (FR07/12).
Chart HMonthly French CD issuances at zero percentage level 1)
14
12
10
8
6
4
2
0July Aug. Sep. Oct.
2012 2013 2014Nov. Dec. July Aug. Sep. Oct. Nov. Dec.Jan. Feb. Mar. Apr. May June July Aug.Jan. Feb. Mar. Apr. May June
Source: Banque de France1)IssuesinEUR,fixedrates.

67Euro money market study, 2014
advantage. This could eventually lead to a run on MMFs, which is particularly acute as regards constant net asset value MMFs (CNAV MMFs) since, owing to their business model, they could potentially be perceived as failing to redeem their units or shares at par (“breaking the buck”).
• An ECB Opinion on the proposal was published in the Official Journal of the European Union on 6 August 2014.
• The cornerstone provision of the proposal relates to the introduction of a capital buffer requirement amounting to 3% of total assets under management for those funds that display constant net asset value (CNAV). The ECB regards this provision as a step to address the risks posed by this type of fund, which is consistent with the FSB-endorsed IOSCO recommendations. The statutory review by the Commission of the adequacy of the legislation three years after its entry into force would provide an opportunity to reconsider and, if deemed appropriate, implement more drastic measures, such as a mandatory conversion of all CNAV funds into variable net asset value funds (VNAV), as recommended by the European Systemic Risk Board (ESRB) in December 2012. The negative deposit rate also argues in favour of VNAV funds.
• In its Opinion, the ECB also notes that there may be several aspects that warrant further assessment, such as the non-risk based nature of the 3% capital buffer for CNAV funds and the envisaged period for replenishment in the event of depletion (one month). The fact that the regulatory proposal does not take into account the MMFs’ risk profile might have undesired consequences on the investment policies of CNAV MMFs, while the duration of the replenishment period should ideally be contingent on the extent of the NAV buffer’s depletion and on general market conditions.
8 Cross-market segment analysis
8.1 Turnover analysis
In the second quarter of 2013, as the European sovereign debt crisis eased slightly, the turnover in the euro money market registered a smooth improvement of a 6% year-on-year increase compared with 2012, which corresponds to the lowest level since 2006. This slight overall positive development was mainly due to the improvement in the secured segment.
During the second quarter of 2014, the upward trend continued, with a 4% year-on-year rise, but with a heterogeneous development across market segments. The OIS, unsecured, short-term security and FX swap segments registered the most relevant rises when compared with 2013, while the secured segment recorded only a marginal increase. Conversely, the other IRS and FRA segments registered a negative performance during the second quarter of 2014 (-21% and -10% respectively).

68Euro money market study, 2014
The secured market remained the most significant segment with a stable share of 41% of the total turnover in both 2013 and 2014 (see Chart 64). The unsecured market represented only 6% of the overall euro money market activity in 2014. Although a slight increase in turnover (4%) can be observed in the unsecured market with respect to 2013, overall activity in this segment is still subdued compared with its pre-crisis levels.
The FX swap market still represents the second most important segment with a 21% share in 2014, while the FRA and other IRS segments lost some ground, representing an 11% and 10% share respectively in 2014. The OIS market benefited from an increase in weight from 7% to 10%.
The unsecured money market, after a significant drop in activity since 2008, finally registered an upward movement in 2014, with a 39% increase from the second quarter of 2013 to the second quarter of 2014 (see Chart 65), although this is still below the 2012 level. The continued downward trend observed from 2008 to 2013 reveals the aversion to counterparty credit risk and the further escalation of market segmentation following the onset of the sovereign debt crisis. However, the improvement in the second quarter of 2014 denoted slight progress in counterparty credit risk assessment along with a reduction in excess liquidity, which might have triggered more substantial market activity.
Chart 63Cumulative quarterly turnover in the euro money market(EUR trillions)
0
10
20
30
40
50
60
70
80
90
2003 2005 2007 2009 2011 2013
securedunsecured
FX swapsOISs FRAs
other IRSsXccy swaps
ST securities
Note: The panel comprised 101 credit institutions.
Chart 64Cross-segment breakdown of cumulative quarterly turnover in the euro money market(percentages of total)
0
20
40
60
80
100
2003 2005 2007 2009 2011 2013
unsecured
secured
OISs
FX swapsother IRSs
Xccy swaps
FRAs
ST securities
Note: The panel comprised 101 credit institutions.
Chart 65Cumulative quarterly turnover in various money market segments(index: total segment volume in 2003 = 100)
0
50
100
150
200
250
300
350
400
2003 2005 2007 2009 2011 2013
unsecuredsecuredST securitiesFX swaps
Source: ECB, EMMSNote: The panel comprised 101 credit institutions.

69Euro money market study, 2014
The secured segment recorded the largest year-on-year increase in 2013 (+24%) and this positive performance continued in 2014, although at a more moderate pace (+2%), reaching its highest level since 2003. This development is linked to the improved perception among market participants regarding the risk of sovereign bonds, although the higher haircuts in comparison to pre-crisis values have been maintained. However, transactions are still highly concentrated among participants in the core countries.
FX swap market activity declined by 12% in 2013 and rose by 9% in 2014, remaining below 2012 levels (see Chart 65). Counterparty risk underlying these transactions is very low and the activity in this type of instrument reflects the overall lower need for banks to fund USD and other foreign currency-denominated assets. As a result of the considerable improvement in USD funding conditions, the ECB ceased to conduct three-month USD liquidity-providing operations as of April 2014. This segment is thus one of the most dynamic and liquid within the money market and ranks second in terms of total turnover.
The OIS segment stabilised in 2013 but recorded the most sizeable positive development in the second quarter of 2014 (see Chart 66). This strong expansion in 2014 (+47%) apparently mirrors the decline in the liquidity surplus and a further increase in EONIA volatility, which made this market more attractive owing to a greater need for hedging very short-term interest rate risks.
Activity in the short-term security market showed a similar trend compared to the majority of segments, with a 5% decline in 2013 and a 12% increase in the second quarter of 2014, above the levels of 2012 (see Chart 65).
With regard to the other OTC derivative market, divergent movements were observed over the past two years (see Chart 66). The other IRS segment increased by 19% in 2013, falling thereafter by 21% in the second quarter of 2014, following the narrowing of the EURIBOR/OIS spread. However, this segment has maintained a positive development since 2003. FRA activity featured a similar path to the other IRSs, albeit more moderate, with a 6% increase in the second quarter of 2013 and a 10% decline in the second quarter of 2014. On the other hand, the Xccy swaps, which are restricted to a limited set of institutions that trade mostly for customer needs, dropped marginally in 2013 and improved slightly in the second quarter of 2014 (see Chart 66). Indeed, this segment features the smallest turnover, with a stable 0.5% share in both 2013 and 2014.
Chart 66Cumulative quarterly turnover in various money market segments(index: total segment volume in 2003 = 100)
0
50
100
150
200
250
300
350
400
2003 2005 2007 2009 2011 2013
other IRSsXccy swapsFRAsOISs
Note: The panel comprised 101 credit institutions.
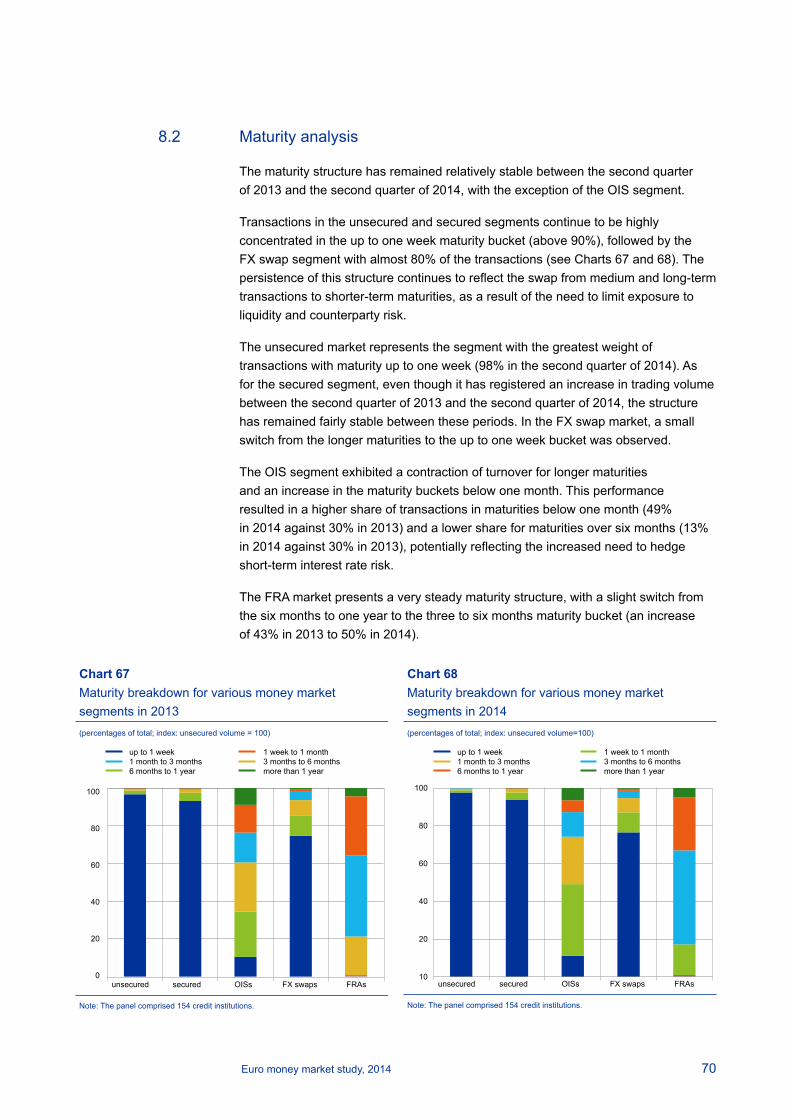
70Euro money market study, 2014
8.2 Maturity analysis
The maturity structure has remained relatively stable between the second quarter of 2013 and the second quarter of 2014, with the exception of the OIS segment.
Transactions in the unsecured and secured segments continue to be highly concentrated in the up to one week maturity bucket (above 90%), followed by the FX swap segment with almost 80% of the transactions (see Charts 67 and 68). The persistence of this structure continues to reflect the swap from medium and long-term transactions to shorter-term maturities, as a result of the need to limit exposure to liquidity and counterparty risk.
The unsecured market represents the segment with the greatest weight of transactions with maturity up to one week (98% in the second quarter of 2014). As for the secured segment, even though it has registered an increase in trading volume between the second quarter of 2013 and the second quarter of 2014, the structure has remained fairly stable between these periods. In the FX swap market, a small switch from the longer maturities to the up to one week bucket was observed.
The OIS segment exhibited a contraction of turnover for longer maturities and an increase in the maturity buckets below one month. This performance resulted in a higher share of transactions in maturities below one month (49% in 2014 against 30% in 2013) and a lower share for maturities over six months (13% in 2014 against 30% in 2013), potentially reflecting the increased need to hedge short-term interest rate risk.
The FRA market presents a very steady maturity structure, with a slight switch from the six months to one year to the three to six months maturity bucket (an increase of 43% in 2013 to 50% in 2014).
Chart 67Maturity breakdown for various money market segments in 2013(percentages of total; index: unsecured volume = 100)
0
20
40
60
80
100
unsecured secured OISs FX swaps FRAs
1 week to 1 month3 months to 6 monthsmore than 1 year
up to 1 week1 month to 3 months6 months to 1 year
Note: The panel comprised 154 credit institutions.
Chart 68Maturity breakdown for various money market segments in 2014(percentages of total; index: unsecured volume=100)
10
20
40
60
80
100
unsecured secured OISs FX swaps FRAs
up to 1 week 1 week to 1 month1 month to 3 months 3 months to 6 months6 months to 1 year more than 1 year
Note: The panel comprised 154 credit institutions.

71Euro money market study, 2014
For the other OTC derivatives, different developments were noted. On the one hand, a swap from shorter to longer maturities occurred for the other IRSs (transactions with a maturity of more than one year increased from 67% in 2013 to 75% in 2014). On the other hand, the share of transactions with the shortest maturity (one to five years bucket) in the Xccy swap markets increased (from 26% in 2013 to 34% in 2014), which was compensated for by a similar reduction in the longer bucket maturities (over five years).
8.3 Market structure
The degree of market concentration in 2014 broadly decreased, following a visible increase in almost all segments in 2013. Of the four main segments, the secured market was the only one with a higher concentration in 2014 compared with 2013 for the three levels under examination (top five, ten and 20 credit institutions). In particular, the top 20 credit institutions accounted for 85% of the total repo market in the second quarter of 2014 (82% in 2013).
The unsecured segment remained the least concentrated segment (see Chart 71) and fell from 2013 to 2014, although clearly above 2012 levels. The share of the top 20 credit institutions dropped from 78% in the second quarter of 2013 to 74% in the second quarter of 2014, but remained above the 68% recorded in 2012. As in the past few years, the lending side remains more concentrated than the borrowing side, with the top 20 credit institutions accounting for 78% of the unsecured borrowing, but for more than 84% of the unsecured lending.
Chart 69Maturity breakdown for various money market segments in 2013(percentages of total)
10
20
40
60
80
100
other IRSs Xccy swaps
up to 1 year
1 to 2 years
1 to 5 years
5 to 10 years
more than 10 years
Note: The panel comprised 154 credit institutions.
Chart 70Maturity breakdown for various money market segments in 2014(percentages of total)
10
20
40
60
80
100
other IRSs Xccy swaps
up to 1 year
1 to 2 years
1 to 5 years
5 to 10 years
more than 10 years
Note: The panel comprised 154 credit institutions.

72Euro money market study, 2014
The FX swap segment also depicted a positive development, as it became the second least concentrated segment in 2014, with the top 20 credit institutions representing 82% of the FX swap market compared to 83% in 2013.
The developments in the short-term security segment were similar, as the share of the top five and ten institutions decreased, although the share of the top 20 institutions rose by two percentage points to 92% in the second quarter of 2014.
The other OTC derivatives remained the most concentrated segment in 2014, with a mixed development compared with 2013. While the share of the top 20 credit institutions decreased for the other IRSs and Xccy swaps, it increased slightly for FRAs and remained stable for OISs.
As regards money market functioning (see Chart 72), qualitative assessments by a majority of market participants support the view that most market segments are considered to be either “sufficiently efficient” or “significantly efficient”. The two exceptions are the unsecured segment, which is considered “not efficient” or “limitedly efficient” by more than half of respondents (65%), and the futures segment, which is considered “extremely efficient” by 54% of respondents. Compared with 2013, the development is clearly positive for most of the segments, with greater improvements in the options, futures, short-term security, repo and OIS segments.
When assessing the evolution of liquidity conditions (see Chart 73), the majority of participants reported “no change” in the situation of most segments from 2013 to 2014. Repos are the only segment where most participants (62%) considered that liquidity had improved “slightly” or “significantly”. In other segments, notably short-term securities, unsecured and OISs, some participants also reported “slight” liquidity improvements. On the other hand, most participants (57%) reported
Chart 71Lorenz curve: concentration of activity in various market segments in 2014
(x axis: percentage of market participants; y axis: percentage of activity)
0
10
20
30
40
50
60
70
80
90
100
0 10 20 30 40 50 60 70 80 90 100
other IRSsST securities
securedFX swaps
Xccy swapsFRAsOISsunsecured
Note: The panel comprised 154 credit institutions.

73Euro money market study, 2014
that liquidity conditions in the FRA segment had worsened “slightly” or “significantly”. The FX swap, OIS and option segments recorded a significant deterioration of liquidity conditions (46%, 37% and 26% of participants respectively). The dispersion of the distribution of responses for the OIS segment, although skewed to the negative side, points to some potential segmentation of this market, as different jurisdictions
Chart 72Is the euro money market (for the different segments) efficient?
(percentages of total)
0
10
20
30
40
50
60
70
80
90
100
unsecured repos FX swaps FRAs OISs other IRSs Xccy swaps ST securities options futures
not efficientlimitedly efficientsufficiently efficientsignificantly efficient
Note: The panel comprised 154 credit institutions
Chart 73Has the market liquidity in the euro money market changed with respect to last year?
(percentages of total)
0
10
20
30
40
50
60
70
80
90
100
has not changedhas improved significantly
has worsened significantly
has worsened slightlyhas improved slightly
unsecured repos FX swaps FRAs OISs other IRSs Xccy swaps ST securities options futures
Note: The panel comprised 154 credit institutions

74Euro money market study, 2014
may face different liquidity conditions. Finally, more respondents reported a slight worsening of liquidity conditions compared with 2013.
The geographical distribution of counterparty structure (see Chart 74) reveals a larger proportion of counterparties outside the euro area and a loss of share for euro area counterparties from 2013 to 2014, in line with the trend observed from 2012 to 2013. All OTC derivatives were mainly carried out with non-euro area counterparties. Despite the sizeable improvement, the unsecured segment remained an essentially domestic market, a sign that the phenomenon of fragmentation in the euro money market is far from being overcome. More than 40% of unsecured transactions were carried out with domestic peers, compared with 50% in 2013, while the euro area share increased from 27% to 38% (note that before the crisis the share of euro area counterparties was above 50%). Only the short-term securities and repos were mostly carried out with euro area counterparties (50% and 46% respectively).
As for the trading structure (see Chart 75), the 2014 results reveal a higher importance of electronic trading followed by voice broker trading, and a substantial decrease for all segments of direct trading. From 2012 to 2013, the opposite development was observed, with a decrease in electronic trading and an increase in direct trading, although not as sharp as in 2014. All OTC derivatives except the other IRSs are mostly traded via voice broker (ranging from 40% for FX swaps to 62% for Xccy swaps). The unsecured transactions were mostly carried out via direct trading (60%), fewer than in 2013 (72%), which is related to the current domestic bias of this market. The short-term security transactions are also mainly carried out via direct trading (52%), while the repo transactions are essentially based on electronic trading, which is associated with the higher share of repo transactions cleared by CCPs.
The section on risk limits conveys a very positive picture. While in 2012 respondents accounting for more than 40% of the total turnover reported a contraction in money
Chart 74Counterparty structure of various money market segments in 2014?(percentages of total)
10
20
40
60
80
100
nationaleuro areaother
unsecured secured FX swaps
FRAs OISs other IRSs
Xccy swaps
ST securites
Note: The panel comprised 154 credit institutions
Chart 75Trading structure of various money market segments in 2014?(percentages of total)
0
20
40
60
80
100
unsecured secured FX swaps
FRAs OISs other IRSs
Xccy swaps
ST securites
direct tradingvoice brokerelectronic trading
Note: The panel comprised 154 credit institutions

75Euro money market study, 2014
market turnover and number of counterparties due to limit changes, the 2014 results show that institutions representing only a very small percentage of total turnover (3%) experienced a “risk-led” contraction in both their money market activity and the number of counterparties. However, in 2014 the institutions reporting an expansion in their activity due to changes in risk limits did not exceed 15% of the total turnover of the reporting banks. Thus, risk limit changes did not affect the activity of the vast majority.
Looking at the prospective question, institutions representing 77% of the total turnover do not expect any changes in their future money market activity due to changes in risk limits and only a small share, representing around 15% of the total turnover, expect an expansion in their activity. The 2014 results contrast with the more negative expectations expressed in the 2013 survey, where institutions representing more than 30% of the total turnover were expecting a contraction in activity and only a very small percentage (accounting for 2% of total turnover) was expecting an expansion, which did not materialise, as evidenced by the results of the previous question.
ANNEX 1
CREDIT INSTITUTIONS PARTICIPATING IN THE EMMS 2014
AT Allgemeine Sparkasse Oberösterreich Bank AGAT Erste Group Bank AGAT Oberbank AGAT Österreichische Volksbanken-AGAT Raiffeisen Bank International AGAT Raiffeisenlandesbank Niederösterreich-Wien AGAT Raiffeisen-Landesbank Steiermark AGAT UniCredit Bank Austria AGBE Belfius Banque SABE Fortis BanqueBE KBC Bank NVBG BNP Paribas S.A.BG DSK BankBG Eurobank EFG BulgariaBG United Bulgarian BankCH Credit SuisseCH UBS AGCH Zürcher Kantonalbank AG (ZKB)CY Bank of Cyprus Public Company LtdCY Cyprus Popular Bank Public Co LtdCY Hellenic Bank Public Company LtdCZČeskáspořitelna,a.s.CZČeskoslovenskáobchodníbanka,a.s.CZ Citibank Europe plcCZ HSBC Bank plc

76Euro money market study, 2014
CZ ING Bank N.V.CZKomerčníbanka,a.s.CZ The Royal Bank of Scotland N.V.CZ UniCredit Bank Czech Republic a. s.DE BayernLBDE BHF-BANK AGDE Commerzbank AGDE DekaBank Deutsche GirozentraleDE Deutsche Bank AGDE Deutsche Postbank AGDE DZ BANK AGDE Hamburger Sparkasse AGDE HSH Nordbank AGDE Landesbank Baden-WürttembergDE Landesbank Berlin AGDE Landesbank Hessen-Thüringen GirozentraleDE Landwirtschaftliche RentenbankDE SEB AGDE UniCredit Bank AGDE WGZ BANK AGDK Danske Bank A/SEE AS Eesti KrediidipankEE AS LHV PankEE Bigbank ASES Banco Bilbao Vizcaya Argentaria S.A. (BBVA)ES Banco CAM S.A.ES Banco Cooperativo Español S.A.ES Banco de Sabadell S.A.ES Banco Español de Crédito S.A.ES Banco Popular Español S.A.ES Banco Santander S.A.ES Bankia S.A.ES Bankinter S.A.ES Caixa Bank S.A.ES Catalunya Banc S.A.ES Confederación Española de Cajas de AhorrosES ING Direct, N.V. S.EFI Nordea Bank Finland AbpFI Pohjola Pankki OyjFR BNP ParibasFR BPCEFR BRED – Banque PopulaireFR Crédit Agricole CIBFR Crédit Agricole S.A.FR Crédit Industriel et Commercial – CICFR HSBC FranceFR NatixisFR Société GénéraleGR Alpha Bank S.A.

77Euro money market study, 2014
GR BNP ParibasGR EFG Eurobank Ergasias S.A.GR Emporiki Bank of Greece S.A.GR HSBC Bank plcGR National Bank of Greece S.A.GR Piraeus Bank S.A.HUINGBankN.V.MagyarországiFióktelepeHU K&H Bank Zrt.HU UniCredit Bank Hungary Zrt.IE Allied Irish Banks plcIE DEPFA BANK plcIE Permanent tsb plcIE Rabobank Ireland plcIE The Governor and Company of the Bank of IrelandIE UniCredit Bank Ireland plcIT Banca IMI SpaIT Banca Monte dei Paschi di Siena SpaIT Banca Nazionale del Lavoro Spa (BNL)IT BNP Paribas S.A.IT Dexia Crediop SpaIT Intesa Sanpaolo SpaIT UBI Banca (Unione di Banche Italiane Scpa)IT UniCredit SpaLT AB SEB bankasLTABŪkiobankasLT Swedbank, ABLU Banque et Caisse d’Épargne de l’État, LuxembourgLU KBL European Private Bankers S.A.LU UniCredit Luxembourg S.A.LV AS Citadele bankaLV Rietumu BankaLV SEB bankaLV SwedbankMT Akbank T.A.S.MT Bank of Valletta plcMT FIMBank plcMT Garanti Bank MaltaMT HSBC Bank Malta plcNL ABN AMRO Bank N.V.NL Bank Nederlandse Gemeenten N.V.NL Coöperatieve Centrale Raiffeisen-Boerenleenbank B.A. (Rabobank)NL F. van Lanschot Bankiers N.V.NL ING Bank N.V.NL The Royal Bank of Scotland N.V.PL Bank BPH S.A.PL Bank Handlowy w Warszawie S.A.PL Bank Polska Kasa Opieki S.A. (Bank Pekao S.A.)PL Bank Zachodni WBK S.A.PL Deutsche Bank Polska S.A.PL Getin Noble Bank S.A.PLINGBankŚląskiS.A.PL Invest-Bank S.A.PL Kredyt Bank S.A.

78Euro money market study, 2014
PLPowszechnaKasaOszczędnościBankPolskiS.A.(PKOBP)PL Raiffeisen Bank Polska S.A.PLSocieteGeneraleS.A.OddziałwPolscePT Banco BPI SAPT Banco Comercial Português SAPT Banco do Brasil AG – Sucursal emPortugalPTBancoEspíritoSantoSAPT Banco Finantia SAPT Banco Itaú Europa SAPT Banco Santander Totta SAPT BANIF –Banco Internacional do Funchal SAPT Barclays Bank plcPT BPN – Banco Português de Negócios SAPTCaixaCentral–CaixaCentraldeCréditoAgrícolaMútuo,CRLPT Caixa Económica Montepio GeralPT Caixa Geral de Depósitos SAPT Deutsche Bank (Portugal) SARO Banca Comerciala Romana S.A.RO BRD – Groupe Societe Generale S.A.RO RBS Bank (Romania) S.A.SE Skandinaviska Enskilda Banken AB (publ) (SEB)SE Svenska Handelsbanken AB (publ)SE Swedbank AB (publ)SI Abanka Vipa D.D.SI Nova Ljubljanska Banka d.d., LjubljanaSI UniCredit Banka Slovenija d.d.SKČeskoslovenskáobchodnábanka,a.s.SKSlovenskásporiteľňa,a.sUK Abbey National Treasury Services plcUK Banco do Brasil SAUKBancoEspíritoSantoSAUK Barclays Bank PLCUK BNP ParibasUK Citibank N.A.UK Crédit Agricole CIBUK Credit SuisseUK Deutsche Bank AGUK Goldman Sachs International BankUK HSBC Bank plcUK JPMorgan Chase & Co.UK Lloyds TSB Bank plcUK Merrill Lynch International Bank LimitedUK Standard Bank plcUK The Royal Bank of Scotland plc

79Euro money market study, 2014
ANNEX 2
TECHNICAL ANNEX
Scope of the study
In this tenth Euro Money Market Study (EMMS), banks were invited to provide data about their interbank activity during the second quarters of 2013 and 2014, covering the main segments of the euro money market. Non-interbank, or customer transactions (i.e. transactions with corporate customers, central banks or supranational institutions) are not included, as they do not fall within the scope of the 2014 study.
Banks reported interbank activity where this activity was registered in their own entity. Intragroup flows derived from intragroup operations are excluded from the 2014 study. Any interbank activity by another subsidiary/branch of the group is reported by the relevant entity of the group in a separate questionnaire. The data provided are nominal amounts for cash transactions and notional amounts for derivatives transactions. In addition, transactions related to the rollover of previous positions have been taken into consideration. The turnover for each maturity bucket was the total turnover over the second quarter. This is a simplification compared with the 2012 methodology, in which banks were asked to provide the daily average volume over the quarter.
The turnover was allocated to each maturity bucket according to the initial maturity of the transactions (including forward transactions, regardless of the settlement date). In the case of transactions redeemable at notice, the length of the notice period was taken as the maturity.
In addition, banks were asked to fill in a qualitative survey providing information about perceived market efficiency, changes in liquidity and the breakdown of transaction amounts by both counterparty location and trading system for each money market segment. Finally, the 2014 survey also gathered information about the efficiency of the options market and changes in its liquidity. The range of answers made available to respondents to assess these factors was also extended to include five possibilities, thereby facilitating symmetry in the responses.
The location of the counterparties with which reporting banks conducted transactions during the second quarter of 2014 were divided in the qualitative survey according to the geographical location of the counterparty: national; euro area; and other. “National” refers to counterparties located in the same country as the reporting bank. If the reporting bank is not located in the euro area, “euro area” refers to counterparties located in the euro area countries; if the reporting bank is located in the euro area, “euro area” refers to counterparties located in the other euro area countries. “Other” refers to counterparties located in all non-euro area countries.
Secured and unsecured segmentsFor the secured and unsecured segments of the money market, the activity tables are divided according to the terms of the lending and borrowing activity. For the

80Euro money market study, 2014
secured segment, “cash lending” refers to buy/sell-back transactions and reverse repos, while “cash borrowing” refers to sell/buy-back transactions and repos. Information about the origin of collateral has been provided as a percentage of the total turnover in secured markets. For the country of issuance of the security used as collateral, the same geographical approach as for the location of counterparties is used: national; euro area; and other. The distinction between bilateral and triparty repos in the secured markets has only been included since 2004 (but there are also figures for 2003).
Swap segments
The 2014 study covers different kinds of swap transactions.
• Overnight indexed swaps (OIS) are financial operations calculated on the basis of an exchange of a fixed rate agreed at the onset of the swap, and a floating-rate leg linked to a daily overnight reference rate during the period of the swap. At the maturity of the swap, the two parties exchange a net payment based on the difference between the interest accrued at the agreed fixed rate and the interest accrued at the compounded floating rate (geometric average), multiplied by the notional amount. In the euro money market, the most widely recognised overnight index is the EONIA (euro overnight index average). Banks were also asked to provide the percentage of their average daily OIS turnover not indexed to the EONIA.
• Foreign exchange (FX) swaps are transactions which involve the actual exchange of two currencies (principal amount only) on a specific date at a rate agreed at the time of conclusion of the contract (the short leg), and a reverse exchange of the same two currencies at a future date at a rate (generally different from the one applied to the short leg) agreed at the time of the contract (the long leg). Both spot/forward and forward/forward swaps fall into this category. FX swaps are only reported if one of the two currencies exchanged was the euro. Furthermore, and to avoid double-counting, only the leg in euro is reported. In 2014, the EMMS also collected a breakdown of FX swaps by the following currencies exchanged against the euro: USD, CHF, JPY and GBP.
• Interest rate swaps (IRS) are agreements to exchange periodic payments related to interest rates in one currency, in this case, the euro; they can be either fixed-for-floating or floating-for floating, based on different indices.
• Cross-currency swaps are contracts that commit two counterparties to exchange streams of interest payments in different currencies for an agreed period of time, and to exchange principal amounts in different currencies at a pre-agreed exchange rate at maturity. Banks were asked to consider cross-currency swaps only if one of the currencies involved was the euro.
Short-term securitiesThe information on the turnover in outright transactions in euro-denominated short-term securities is divided into three categories: government issues (e.g. Treasury bills); bank issues (i.e. paper issued by euro area credit institutions); and non-bank issues (i.e. paper issued by corporations). Banks report the average of daily outright transactions. Outright transactions are defined as a sale or purchase of short-term

81Euro money market study, 2014
securities on the interbank secondary market. Short-term securities are broadly defined as all securities with an initial maturity of up to 12 months, including Treasury bills, commercial paper, euro commercial paper, asset-backed commercial paper, certificates of deposit, etc. The primary market or issuance activity has not been included, but there is a separate item for the issuance by the panel bank.
Revision of the composition of the panelTo compare the findings with those of previous studies and to analyse long-term trends in the euro money market, a constant panel of banks for each segment was used for all previous money market studies dating back to 2003. However, banks were added to this panel in the 2006 study with the aim of improving the representative nature of the sample, whilst other banks decided to abandon the panel in recent years.
In order to smooth out the impact of the inclusion or removal of new/old banks in the panel and to enable a comparison of long-term trends, the turnover of the extended panel in 2003 was re-indexed to the turnover reported in 2003 by the initial constant panel (using the chain-linking approach). The base year for the study is 2003.
ANNEX 3
GLOSSARY
Automated trading system (ATS): a system that offers additional means of trading compared with established exchanges. These systems operate electronically (lowering transaction costs) and focus on services that established exchanges do not always provide (e.g. a central limit order book, after-hours trading or direct access for institutional investors).
Assets under management (AUM): the size of the portfolios managed by a fund or financial institution.
Bid-ask/bid-offer spread: the differential prevailing on the market between the bid price and the offered price.
Broker: a firm which operates in a market on behalf of other participants and arranges transactions without being a party to these transactions itself.
Cassa di Compensazione e Garanzia (CC&G): a central counterparty which is part of the London Stock Exchange Group. It is supervised by the Banca d’Italia.
Central counterparty (CCP): an entity that interposes itself, in one or more markets, between the counterparties to the contracts traded, becoming the buyer to every seller and the seller to every buyer and thereby guaranteeing the performance of open contracts.
Certificates of deposit (CDs): short-term securities issued by banks.

82Euro money market study, 2014
Clearing: the process of transmitting, reconciling and, in some cases, confirming the payment order and the securities transfer prior to settlement. In the context of repos, this can have three separate aspects: confirmation/matching; netting; and clearing with the central counterparty.
Clearstream: Clearstream Banking Frankfurt is the German central securities depository (CSD). Clearstream Banking Luxembourg (CBL) is an international central securities depository (ICSD) based in Luxembourg. Both are owned by the Deutsche Börse.
Constant net asset value (CNAV): funds that report the value of the assets under management according to amortised value, as opposed to variable net asset value (VNAV) funds which report the size of their portfolios according to mark-to-market conventions.
Commercial paper (CP): short-term obligations with maturities ranging from two to 270 days issued by banks, corporations and other borrowers. Such instruments are unsecured and usually discounted, although some are interest-bearing.
Counterparty: the opposite party in a financial transaction.
Credit risk: the risk that a counterparty will not settle the full value of an obligation, neither when it becomes due nor at any time thereafter. Credit risk includes replacement cost risk and principal risk. It also includes the risk of the settlement bank failing.
Cross-currency swap: a contract that commits two counterparties to exchanging streams of interest payments in different currencies for an agreed period of time and to exchanging principal amounts in different currencies at a pre-agreed exchange rate at maturity.
Dealer: a firm whose primary business is entering into transactions on both sides of wholesale financial markets and seeking profits by taking risks on these markets.
Derivative: a financial contract, the value of which depends on the value of one or more underlying reference assets, rates or indices. For analytical purposes, all derivatives contracts can be divided into three basic building blocks: forward contracts; options; or combinations thereof.
Efficient market: a market where the price is the unbiased estimate of the true value of the investment, based on existing information.
Electronic trading: in broad terms, this refers to any use of electronic means to send orders (bids and offers) to the market.
e-MID: an electronic broker market for interbank deposits, run by e-MID S.p.A. Milan.
e-MID MIC: an electronic broker market for collateralised interbank deposits, run by e-MID S.p.A. Milan.
Eurepo: the benchmark rate of the large euro repo market which emerged following the introduction of the euro in 1999. It was discontinued on 2 January 2015. Eurepo

83Euro money market study, 2014
is the successor rate to the British Bankers’ Association (BBA) euro repo benchmark. It is the rate at which one prime bank offers funds in euro to another prime bank, where the former receives, in exchange, Eurepo general collateral (GC) as collateral from the latter. Eurepo is supported by the European Banking Federation (EBF) and the European Repo Council (ERC).
Eurex: the German/Swiss futures and options market.
Eurex Repo: a major electronic repo market platform provider. It offers, inter alia, a cash-driven repo market trading product called Euro General Collateral (GC) Pooling.
EURIBOR: the rate at which a prime bank is willing to lend funds in euro to another prime bank, as reported by a panel of contributing banks, computed daily for interbank deposits with different maturities of up to 12 months.
Euroclear: the world’s largest settlement system for domestic and international securities transactions. It is an international central securities depositary (ICSD) and also acts as the central securities depository (CSD) for Belgian, Dutch, French, Irish and British securities.
Euro General Collateral (GC) Pooling: cash-driven general collateral segment of the electronic trading platform Eurex Repo, offering short-term collateralised funding possibilities and efficient collateral management.
Euro overnight index average (EONIA): the overnight rate computed as the euro interbank offered overnight rate for the euro. It is calculated as a weighted average of the interest rates on all unsecured overnight lending transactions in the interbank market initiated within the euro area by the contributing panel of 43 prime banks. The rate is owned by EMMI and calculated by the ECB.
Euronext: the company born out of the merger of the Amsterdam, Brussels and Paris exchanges on 22 September 2000. In 2007 it merged with the New York Stock Exchange (NYSE) to create the NYSE Euronext.
Euronext Liffe: the Euronext-London International Financial Futures and Options Exchange. Euronext took over Liffe in October 2001.
European System of Central Banks (ESCB): composed of the ECB and the NCBs of all 28 EU Member States; it includes the NCBs of Member States whose currency is not the euro, as well as NCBs of the Eurosystem. The ESCB is governed by the Governing Council and the Executive Board of the ECB and, as a third decision-making body of the ECB, by the General Council.
Eurosystem: the central banking system of the euro area. It comprises the ECB and the NCBs of the EU Member States whose currency is the euro.
Foreign exchange swap (FX swap): the simultaneous spot purchase/sale and forward sale/purchase of one currency against another. In the EMMS, banks are asked to report FX swaps only if one of the two currencies exchanged is the euro and, in this case, the euro amount of the short leg.

84Euro money market study, 2014
Forward rate agreement (FRA): a cash-settled forward contract on a deposit.
Forward: the purchase or sale of a specific quantity of a commodity at the current price, with delivery and settlement on a specified future date.
Future: an agreement to buy or sell a specific amount of a commodity or financial instrument at a particular price on a specified future date.
General collateral (GC): collateral which, owing to its homogeneous features, is widely accepted.
Interest rate swap (IRS): an exchange between two parties of a fixed interest rate instrument or two floating interest rate instruments.
International central securities depository (ICSD): a central securities depository which settles international securities and cross-border transactions in domestic securities.
Key ECB interest rates: the interest rates set by the Governing Council of the ECB. They are the rates on the main refinancing operations, the marginal lending facility and the deposit facility.
Liquid (market): the three aspects of liquidity are: tightness in bid-ask spreads; depth; and resiliency. Liquidity is characterised by the ability to conduct transactions in a market without significantly moving prices.
Longer-term refinancing operation (LTRO): a credit operation with a maturity of more than one week executed by the Eurosystem in the form of reverse transactions. The regular monthly operations have a maturity of three months. During the financial market turmoil that started in August 2007, supplementary operations with maturities ranging from one maintenance period to 36 months were conducted with varying frequencies. Targeted longer-term refinancing operations (TLTROs) of 48 months have recently been introduced.
Lorenz curve: a cumulative frequency curve which compares the distribution of one variable (money market activity) with the uniform distribution representing equality (diagonal line in the charts). For convenience of interpretation, the Lorenz curves presented in the 2012 Euro Money Market Study have been plotted above the equality line, instead of below it (which is the more standard mode of presentation), since market players have been sorted by descending order of their activity share.
Main refinancing operation (MRO): a regular open market operation executed by the Eurosystem in the form of reverse transactions. Such operations are carried out through a weekly standard tender procedure and normally have a maturity of one week. The collateral accepted for these operations and the eligibility criteria for counterparties are published on the ECB’s website.
Market-maker: a dealer who is obliged to quote, buy and sell prices in return for certain privileges within a market (sometimes used to refer to any participant providing quotes).

85Euro money market study, 2014
Market transparency: the ability of market participants to observe (pre-trade) quotes and (post-trade) prices and volumes in a timely fashion.
Monetary financial institution (MFI): financial institutions which together form the money-issuing sector of the euro area. These include the Eurosystem, resident credit institutions (as defined under EU law) and all other resident financial institutions whose business is to receive deposits and/or close substitutes for deposits from entities other than MFIs and, for their own account (at least in economic terms), to grant credit and/or invest in securities. The latter group consists predominantly of money market funds, i.e. funds that invest in short-term and low-risk instruments, usually with a maturity of one year or less.
Money market: the market in which short-term funds are raised, invested and traded using instruments which generally have an original maturity of less than one year.
Monte Titoli S.p.A.: the Italian central security depository (CSD).
MTS S.p.A.: an electronic fixed-income trading market owned by the London Stock Exchange Group, with over 500 counterparties and an average daily turnover exceeding €85 billion, including the repo segment.
Option: the right to sell or buy a security in exchange. The “American” options can be executed on any date between their purchase and their expiry date. “European” options are executed on the expiry date only.
Over-the-counter (OTC): a method of trading that does not involve a regulated market. In OTC markets, such as those for OTC derivatives, participants trade directly with each other, typically through telephone or computer links.
Overnight interest rate swap (OIS): a financial operation involving an exchange of cash flows on a specified date. It involves paying or receiving a fixed cash flow on the one hand and paying or receiving a variable rate cash flow on the other.
Primary market: the market for new issues of securities.
Real-time gross settlement (RTGS) system: a settlement system in which processing and settlement take place on an order-by-order basis (without netting) in real time (continuously).
Repurchase agreement (repo): a financial instrument which allows cash to be temporarily exchanged for securities for a predetermined period. Various legal arrangements exist to perform this basic economic function (repo agreements, reverse repo agreements, sell/buy-backs and securities lending). All forms of repos entail a change in ownership.
Reserve maintenance period: the period over which compliance with the reserve requirements is calculated. Maintenance periods begin on the settlement day of the first main refinancing operation following the meeting of the ECB’s Governing Council, at which the monthly assessment of the monetary policy stance is pre-scheduled.

86Euro money market study, 2014
Reserve requirement: the minimum amount of reserves a credit institution is required to hold with the Eurosystem over a predefined maintenance period. Compliance with the requirement is determined on the basis of the average of the daily balances in the reserve accounts over the maintenance period.
Reverse repo: a contract with a counterparty to buy and subsequently resell securities at a specified date and price. A reverse repo is thus the mirror image of a repo.
Secondary market: exchanges and over-the-counter markets where securities are bought and sold subsequent to their original issuance, which took place on the primary market.
Settlement: the completion of a transaction by the exchange of instruments and funds.
Special maintenance period operation: operations conducted by the ECB with a maturity of one maintenance period.
Spot/next (day): an expression used by traders when a transaction is settled two business days after today and matures the following business day.
Swap: an agreement to exchange payments between two counterparties at some point(s) in the future and according to a specified formula.
TARGET2 (Trans-European Automated Real-time Gross settlement Express Transfer system): the second generation TARGET system. It settles payments in euro in central bank money and functions on the basis of a single shared IT platform, to which all payment orders are submitted for processing.
Tomorrow/next (day): an expression used by traders when a transaction is settled on the next business day after today and matures the following business day.
Treasury bill (T-bill): a short-term government debt instrument issued at a discount with a maturity of one year or less.
Triparty repo: a repo that involves a third party, commonly a custodian bank or an ICSD, acting as an agent to exchange cash and collateral for one or both of the counterparties.
Undertakings for collective investment in transferable securities (UCITS): a set of EU directives aiming to harmonise the rules for collective investments within the EU. UCITS funds that are authorised in one EU country, as a result of mutual recognition, are also allowed to be marketed in other EU countries.
Variable net asset value (VNAV): see CNAV.