EuP Lot 30: Electric Motors and Drives - BAM
209
EuP Lot 30: Electric Motors and Drives Task 1: Product Definition, Standards and Legislation ENER/C3/413-2010 Final April 2014 Anibal de Almeida Hugh Falkner João Fong Keeran Jugdoyal This document has been prepared for the European Commission however it reflects the views only of the authors, and the Commission cannot be held responsible for any use which may be made of the information contained therein. ISR – University of Coimbra
Transcript of EuP Lot 30: Electric Motors and Drives - BAM

EuP Lot 30: Electric Motors and Drives
Task 1: Product Definition, Standards and Legislation
ENER/C3/413-2010
Final
April 2014
Anibal de Almeida
Hugh Falkner
João Fong
Keeran Jugdoyal
This document has been prepared for the European Commission however it reflects the views only of the authors, and the Commission cannot be held responsible for any use which may be made of the information contained therein.
ISR – University of Coimbra

2
Contents
1 Definition ............................................................................................................................... 3
1.1 Product Categorisation and Performance Assessment ................................................. 4
1.1.1 Motors ................................................................................................................... 4
1.1.2 Motor Controllers .................................................................................................. 6
1.1.3 Performance Parameters ...................................................................................... 7
1.2 Test standards ............................................................................................................... 7
1.2.1 IEC 60034-2-1 (Ed. 1.0), 2007 ................................................................................ 8
1.2.2 IEC 60034-2-2 [10] ............................................................................................... 11
1.2.3 IEC/TS 60034-2-3:2013 ........................................................................................ 11
1.2.4 IEC 60034-25 ....................................................................................................... 11
1.2.5 Efficiency test standards for controllers ............................................................. 11
1.2.6 IEC 60034-30 ....................................................................................................... 12
1.2.7 IEC 60034-31 ....................................................................................................... 16
1.3 Existing relevant environmental legislation inside and outside the EU and existing self regulation. ............................................................................................................................... 16
1.3.1 WEEE Directive (Directive 2002/96/EC) .............................................................. 26
1.3.2 RoHS Directive (Directive 2002/95/EC) ............................................................... 27
1.4 Summary ..................................................................................................................... 28
1.5 References ................................................................................................................... 30

3
1 Definition
This section defines the product and the boundaries for the study. The product is categorised and its performance parameters are defined. This section also identifies and shortly describes relevant test standards and existing legislation.
The product group is defined in the invitation to Tender as “Products in motor systems outside the scope of the Regulation 640/2009 on electric motors, such as special purpose inverter duty motors (asynchronous servo motors), permanent magnet motors, motors cooled by their load (fans), including motors and products under Article 1, Points 2(b), (c) and (d) and including drives, such as soft starters, torque or variable speed drives (VSD) from 200W- 1000kW. The study should also cover motors in the scope of the Regulation 640/2009 from 750kW 1000kW”.
The short description for Lot 30 is quite broad, encompassing products in motor systems outside the scope of Regulation 640/2009 on electric motors. This includes, not only the motors that are specifically excluded in Article 1 of the Regulation, such as brake motors, but also other induction motors (single phase and 3-phase outside the 0.75-375 kW power range), motors specifically designed for inverter duty, and motors with different design such as permanent magnet motors. Furthermore, it also includes motor drives and controllers (e.g. electro-mechanical starters, soft starters, VSDs, etc.).
In Regulation 640/2009 [1] “electric motor” is defined as:
A single speed, three-phase 50 Hz or 50/60 Hz, squirrel cage induction motor that:
has 2 to 6 poles,
has a rated voltage of UN up to 1 000 V,
has a rated output PN between 0,75 kW and 375 kW,
is rated on the basis of continuous duty operation.
The study will focus on motors outside this scope, namely:
Motors in power ranges outside the 0,75 kW – 375 kW power range covered by the
previous Lot 11 study and the Regulation, with special attention given to small motors
including and above 120 W and high power motors above 375 kW up to 1000 kW.
Exceptions to the Regulation, described in its Article 1, point 2, such as brake motors
and motors rated for different operating conditions.
Special purpose inverter duty motors, used for wide speed range such in AC
servomotor applications.
Emerging state-of-the-art technologies such as: Permanent magnet motors (PM), Line-
Start Permanent magnet motors, switched reluctance motors (SR), etc. On the EuP Lot
11 [2] study a brief analysis of other motor technologies, such as Brushless Permanent
Magnet Motors, has already been conducted. However, at the time, these new very
efficient technologies could not be considered “commodity” products. These were
highly customised products without suitable standards (e.g. dimensions, mounting,
power, torque specifications, etc.). Meanwhile, the market for these products has
matured and standards have been developed, or are being developed, accordingly. It is
intended to address these emerging technologies in more detail.

4
The importance of motor controllers has also been recognized to have a significant impact on the motor and motor systems efficiency and, therefore they shall also be included in the analysis, namely on the following aspects:
The high potential savings of Variable Speed control, especially in centrifugal load
applications, is also widely recognized and is to be the subject of further analysis
including hardware, software and interaction with the motor, to evaluate its combined
efficiency.
Other motor controllers, which can be applied in loads with small variability, such as
soft-starters.
The pertinence of the introduction of regulatory measures for the above mentioned products will be evaluated based on Article 15 of the Ecodesign Directive, specifically, products with large sales, high environmental impact and high potential reduction of that environmental impact.
In principle, all motors that are capable of continuous duty operation are to be analysed in this preparatory study. This includes those motors that are integrated into other equipment but that can be tested separately. Motors that are not capable of continuous operation at their rated power with a temperature rise within the specified insulation temperature class, are not considered since the low hours of use translate into small environmental impact, i.e., Furthermore, these motors sometimes have particular design features which are not compatible with ecodesign measures.
Motors for off-grid applications, such as battery powered tools, motors in mobile machinery and motors used in automobiles (e.g. powered windows, windscreen wipers) are not considered in this study.
1.1 Product Categorisation and Performance Assessment
The product categorisation will be primarily based on the Prodcom [3] categories.
Prodcom provides statistics on the production of manufactured goods. The term comes from the French "PRODuction COMmunautaire”. It is based on a product classification called the PRODCOM List which consists of about 4500 headings relating to manufactured products in which electric motors are included.
1.1.1 Motors
Table 1-1 presents the Prodcom classification for electric motors.
Table 1-1 Prodcom categorisation for electric motors
27.11.10.30 DC motors and generators of an output > 37.5 W but <= 750 W (excluding starter motors for internal combustion engines)
27.11.10.53 DC motors and generators of an output > 0.75 kW but <= 7.5 kW (excluding starter motors for internal combustion engines)
27.11.10.55 DC motors and generators of an output > 7.5 kW but <= 75 kW (excluding starter motors for internal combustion engines)
27.11.10.70 DC motors and generators of an output > 75 kW but <= 375 kW (excluding starter motors for internal combustion engines)
27.11.10.90 DC motors and generators of an output > 375 kW (excluding starter motors for

5
internal combustion engines)
27.11.21.00 Universal AC/DC motors of an output > 37.5 W
27.11.22.30 Single-phase AC motors of an output <= 750 W
27.11.22.50 Single-phase AC motors of an ouput > 750 W
27.11.23.00 Multi-phase AC motors of an output <= 750 W
27.11.24.03 Multi-phase AC motors of an output > 0.75 kW but <= 7.5 kW
27.11.24.05 Multi-phase AC motors of an output > 7.5 kW but <= 37 kW
27.11.24.07 Multi-phase AC motors of an output > 37 kW but <= 75 kW
27.11.25.40 Multi-phase AC motors of an output > 75 kW but <= 375 kW (excluding traction motors)
27.11.25.60 Multi-phase AC motors of an output > 375 kW but <= 750 kW (excluding traction motors)
27.11.25.90 Multi-phase AC motors of an output > 750 kW (excluding traction motors)
For the purpose of this study, motors shall be divided into three major categories according to output power:
Small motors in the power range of 120 W 1 to 750 W. This group will namely include:
General purpose single-phase induction motors
General purpose single speed 3-phase induction motors
Brushless Permanent Magnet Motors / EC Motors
DC/Universal motors
Small motors constitute about 90% of the global stock, but only consume about 9% of the total electricity used by electric motors [4]. They are used in many applications such as appliances, small pumps, compressors and fans. These motors are often single‐phase (induction, shaded‐pole, or DC/Universal motor types), which are typically custom‐made in large series to be integrated into specific machines or appliances.
Medium motors in the power range of 0.75 kW to 375 kW. This is the power range covered by the existing EC regulation, so special attention is to be given to exclusions and to the improvement potential.
This group will include:
General purpose single speed 3-phase induction motors in the power range 0.75-375
kW, but which are excluded in the Regulation 640/2009, such as brake motors and
motors for special applications and operating conditions
Special purpose inverter duty motors
Integrated Motors + VSD
Permanent Magnet (PM) Motors, including Line-Start Permanent magnet (LSPM)
motors
Switched reluctance (SR) motors
1 Although the initial lower limit was 200 W it was decided to further lower this limit to 120 W to keep in
line with the upcoming edition of IEC 60034-30-1 (see 1.2.6)

6
Medium motors, in this power range, are responsible for about 68% of the electricity consumed by electric motors globally. The market is largely dominated by three-phase AC induction motors (around 85% market share) but other technologies are used, such as conventional DC motors (declining market), PM motors and SR motors (increasing market).
General purpose single speed, single-phase induction motors in the power range above 0.75 kW, will not be considered because of their relatively lower performance compared with 3-phase motors and because of their declining market share.
Large motors in the power range above 375 kW, up to 1000 kW.
General purpose single speed 3-phase induction motors (squirrel cage and wound
rotor)
Wound-rotor synchronous motors
According to CEMEP, motors in this power range are mostly rated for voltages over 1000 V and up to 6600 V. Therefore, the analysis in this study will also be extended to this voltage range.
Typically motors in this power range have customized design for very specific industrial applications and are often produced according to specific requirements of the purchaser. They account for only about 0.03% of the stock of all electric motors but consume about 23% of global motor electricity use [4]. Because of their large power and, in general, of their high number of operating hours, these motors tend to be specified to have a very high efficiency. Although motors in this power range are available to order, from catalogue, usually, these motors are individually designed according to the customer’s specifications.
1.1.2 Motor Controllers
The high savings potential of Variable Speed control in certain applications is also widely recognized and is to be the subject of further analysis including hardware, software and interaction with the motor, to evaluate its combined efficiency.
The environmental advantages of other motor controllers, such as soft-starters and electro-mechanical starters, which can be applied in fixed speed applications, will also be evaluated. Soft-starters typically operate during a brief start-up period (typically less than 10 seconds). After this period, it is either bypassed to reduce the losses or for light loads it can enter in an energy-saving mode. The energy use of soft-starters seems, on a first approach, quite small.
Prodcom lists inverters in two different categories shown in Table 1-2.
Table 1-2 PRODCOM categorisation for inverters
27.11.50.53 Inverters having a power handling capacity <= 7.5 kVA
27.11.50.55 Inverters having a power handling capacity > 7.5 kVA
Prodcom also considers Static Converters (excluding polycrystalline semiconductors, converters specially designed for welding, without welding equipment, accumulator chargers, rectifiers, inverters).
Because the ProdCom classification is not sufficiently categorized, the same power ranges used in the motors classification will be used for motor controllers.

7
1.1.3 Performance Parameters
The functional unit defines the quantification of the identified functions (performance characteristics) of the product2. That is to say, what the product does.
Electric motors are devices that convert electric energy into mechanical energy. Therefore, the primary performance parameter or “functional unit” is output power in kW. Also relevant is the speed at which the shaft rotates. Both these parameters are related to torque by the following equation.
sradspeed
WPowermNTorque
/.
1.2 Test standards
Almost all the major economies have some kind of voluntary or mandatory regulatory scheme regarding induction motor efficiency. Induction motors are by far the most used technology in industry and efforts to regulate motor efficiency have, therefore concentrated in this technology.
Most of major economies have mandatory minimum efficiency levels for motors sold in the respective countries and labeling schemes for the promotion of higher efficiency motors: NEMA and EPAct in the USA, CSA in Canada, CEMEP –EU Agreement and Regulation 640/2009 in Europe, COPANT in South America, AS/NZS in Australia and New Zealand, JIS in Japan, GB in China and others.
To further increase confusion, these classifications schemes relied in the past on different efficiency test methods which can produce significantly different results. Therefore efficiency levels were not straightforwardly comparable. This was a source for potential confusion and an important market barrier.
The last few years have witnessed a substantial effort in harmonising the different test and classification standards, and subsequent labeling schemes in use. The International Electrotechnical Commission (IEC) has worked together with NEMA, CEMEP, IEEE and other international organizations and this work resulted in the publication of two major standards:
IEC 60034-2-1 (Ed. 1.0): Rotating electrical machines – Part 2-1:Standard methods for
determining losses and efficiency from tests (excluding machines for traction vehicles),
2007 [5], which describes methods to determine motor efficiency from tests, and
IEC 60034-30 (Ed.1.0): Rotating electrical machines – Part 30: Efficiency classes of
single-speed, three-phase cage-induction motors (IE-code), 2008 [6], which defines
energy classes for induction motors
Efficiency in a motor is defined as the ratio of output (mechanical) power to input (electrical) power.
powerelectricalInput
powermechanicalOutputEfficiency
2 ISO 14040:2006 Environmental management — Life cycle assessment — Principles and framework

8
The difference between input and output power is caused by the presence of losses in different parts of the motor. The electrical losses (also called Joule losses) are expressed by I2R, and consequently increase rapidly with the motor load. Electrical losses appear as heat generated by electric resistance to current flowing in the stator windings and in the rotor conductor bars and end rings. Magnetic losses occur in the steel laminations of the stator and rotor. They are due to hysteresis and eddy currents, increasing approximately with the square of the flux-density. Mechanical losses are due to friction in the bearings, ventilation and windage losses. Stray load losses are due to leakage flux, harmonics of the air gap flux density, non-uniform and inter-bar currents distribution, mechanical imperfections in the air gap, and irregularities in the air gap flux density. In motors with brushes (e.g. wound rotor motors), the brush contact losses result from the voltage drop between the brushes and the commutator or the slip rings.
As an example, Figure 1-1 shows the distribution of the induction motor losses as a function of the motor power.
Figure 1-1 Typical fraction of losses in 50-Hz, in four-pole squirrel cage IMs [7]
Efficiency in an electric motor can be determined in two ways, directly and indirectly. Direct test methods rely on measuring the input power on the basis of the voltage and current supplied, and the output power based on the rotational speed and torque. Indirect methods involve measuring the input power and calculating the total losses by measuring and adding individual loss components.
1.2.1 IEC 60034-2-1 (Ed. 1.0), 2007
IEC 60034-2-1 (Ed. 1.0) [5], published in 2007, describes test methods to determine losses and efficiency of electric motors. It supersedes the old IEC 60034-2 (1996) and also the intermediate publication IEC 61972. In IEC 60034-2 [8](commonly referred to as IEC 34-2) full load stray load losses in induction motors were arbitrarily assumed to be 0,5% of the full load input power. This method has a clear tendency to overestimate efficiency in the low-medium

9
power range. The error is not so important when testing low-efficiency motors, but leads to a significant influence when testing high-efficient motors.
IEC 60034-2-1 contains a test procedure (Indirect loss determination with PLL determined from residual loss) similar to IEEE 112B [9], which is the recognized test method in Canada, Mexico and the US, with some further improvements especially for smaller motors (1 kW and below).
IEC 60034-2-1 describes different test methods for both AC and DC machines with different levels of uncertainty associated. The choice of test to be made depends on the information required, the accuracy required, the type and size of the machine involved and the available field test equipment (supply, load or driving machine).
This test standard presents three tables with the preferred methods for the determination of efficiency and their associated levels of uncertainty.
As an example, the table regarding Induction motors is presented here.

10
Table 1-3 Preferred methods for determining the efficiency of Induction Motors [5]
The IEC 60034-2-1 standard is currently being revised to remove ambiguities and possible causes for confusion. Its text has also been edited to make it more readable and user friendly. It is expected to be published in 2014. The test methods are now grouped into preferred methods and methods for field or routine testing. Preferred methods have a low uncertainty and for a specific rating and type of machine only one preferred method is now defined. The requirements regarding instrumentation have been detailed and refined. The description of tests required for a specific method is now given in the same sequence as requested for the performance of the test. This will avoid misunderstandings and improve the accuracy of the procedures. In addition, for each method a flowchart shows the sequence of tests graphically. To maintain compatibility with existing national standards very few technical modifications are introduced.

11
1.2.2 IEC 60034-2-2 [10]
Supplementary to IEC 60034-2-1 another standard was published, [10] which describes three additional test methods (Calibrated-machine test, Retardation test, Calorimetric method) to be applied mainly for large machines where the facility cost for other methods is not considered economical.
1.2.3 IEC/TS 60034-2-3:2013
New general purpose induction motors can be used with inverters, since they are built with improved insulation materials able to withstand high dV/dt voltage waveforms. For low speeds (e.g. below 50%) the torque capabilities significantly drop if no additional cooling is used. When fed by an electronic variable speed drive the motor has additional harmonic losses, which depend upon many variables (switching frequency, PWM control algorithms, etc..). Harmonic losses are produced in the motor by the non-sinusoidal voltage and current waveforms generated by the converter and are in addition to the fundamental losses of iron, rotor-winding, stator-winding and additional-load.
IEC/TS 60034-2-3 Rotating electrical machines - Part 2-3: Specific test methods for determining losses and efficiency of converter-fed AC motors, was published in November 2013 as a technical specification. Technical Specifications are often published when the subject under question is still under development or when insufficient consensus for approval of an international standard is available (standardization is seen to be premature). This standard is aimed to evaluate the additional harmonic motor losses resulting from non-sinusoidal power supply and consequently the efficiency of the converter-fed motor, supplementing the methods intended for operation on sinusoidal supply.
1.2.4 IEC 60034-25
Regarding special purpose inverter duty motors IEC Standard 60034-25, 2007, Guidance for the design and performance of A.C. motors specifically designed for converter supply [11], has been developed.
Variation of frequency over a wider range results in additional stress on the motor and the motors have to be specially designed to meet these conditions. Special designed motors for variable frequency drive can be used for frequency variations from a few Hz up to 200Hz or more. Typically these motors are designed for inherent low magnetic flux densities. The motors have at least class 'F' insulation and strengthened insulation by way of thicker insulation at certain points, improved overhand binding, and additional varnishing. Motors are generally in Totally Enclosed Force Cooled version having a separate motor / fan mounted on the primary motor, which cools the main motor. Rotors are balanced to higher degree. Depending on the range of RPM, special bearings are used and tolerances on the shaft and end covers are controlled to higher precision.
1.2.5 Efficiency test standards for controllers
There are currently no efficiency test or classification standards for drives – Power Drive Systems (PDS) and Variable Speed Drives (VSDs) but effort is being put into its development, namely by:
the Canadian Standards Association
CSA 838 draft standard, regarding VSD testing

12
and CENELEC
Particularly relevant is the development of EN50598 by CENELEC TC22x, which will be divided into three parts:
Part 1: Procedure for determining the energy efficiency indicators of motor driven
applications by using the extended product approach and semi analytical models
Part 2: Energy efficiency indicators for Power drive systems and Motor starters
Part 3: Environmental aspects and product declaration for Power drive systems and
Motor starters
The standard specifies a system-level methodology called the Extended Product Approach (EPA). The EPA allows determining the energy efficiency of motor systems, considering both the efficiency of the equipment and the requirements of the application and covers aspects of both mandates (M/470 and M/476).
Also, standards are being developed with regard to not only polyphase induction motors, but all other types of motors, such as single phase induction motors, permanent magnet synchronous and reluctance motors, at an international level.
1.2.6 IEC 60034-30
With the purpose of harmonising the different energy efficiency classification schemes for induction motors in use around the world, the International Electrotechnical Commission (IEC) introduced, in 2008, a classification standard – IEC60034-30 [6].
The standard covered single-speed three-phase 50 Hz or 60 Hz cage induction motors that:
have a rated voltage UN up to 1000 V; NOTE - The standard also applies to motors rated for two or more voltages and/or frequencies
have a rated output PN between 0,75 kW and 375 kW;
have either 2, 4 or 6 poles
are rated on the basis of duty type S1 (continuous duty) or S3 (intermittent periodic duty) with an operation time of 80% or more;
are intended for direct on-line connection;
are rated for operating conditions according to IEC 60034-1, clause 6.
Motors with flanges, feet and/or shafts with mechanical dimensions different from IEC 60072-1 are covered by this standard. Geared motors and brake motors were covered by this standard although special shafts and flanges may be used in such motors. Excluded were:
Motors specifically made for converter operation according to IEC 60034-25 with increased insulation.
Motors completely integrated into a machine (pump, fan, compressor, …) which can not be separated from the machine.
All other non-general-purpose motors (like smoke-extraction motors built for operation in high ambient temperature environments according to EN12101-3 etc).
The standard defined three levels of energy efficiency:

13
IE3 – Premium efficiency (equivalent to NEMA Premium)
IE2 – High efficiency (equivalent to EPAct/EFF1)
IE1 – Standard efficiency (equivalent to EFF2)
A fourth level, IE4 – Super Premium efficiency, was also introduced but not defined, since there was not sufficient market and technological information available to allow standardization. The nominal limits of Super-Premium Efficiency (IE4) were proposed in Annex A of IEC 60034-31 standard (Guide for the selection and application of energy efficient motors including variable-speed applications) [12]. This class is projected to have roughly 15-20% lower losses than IE3.
The efficiency levels of this Super Premium class at the time were believed to be too high to be achieved with standard induction motor technology, particularly for small motors. However, it was expected that advanced technologies (e.g. Permanent Magnet motors, Reluctance Synchronous motors) would enable manufacturers to design motors for this efficiency class with mechanical dimensions compatible to existing motors of lower efficiency classes, making this motors commodity products. Today, induction motors have reached the market with IE4 efficiency levels.
Figure 1-2. IE1, IE2 and IE3 efficiency levels in the IEC 60034-30 standard for 4 poled motors [6] and the new IE4 proposed in the IEC 60034-31 standard [12].
Efficiency and losses shall be tested in accordance with IEC 60034-2-1 [5]. The selected test method shall be associated with low uncertainty and shall be stated in the documentation of the motor.
Both standards will hopefully end the difficulties manufacturers encounter when producing motors for a global market and will help make the market more transparent.
IEC 60034-30 has recently been revised (March 2014). It is now divided into two parts:
Part 1 - Efficiency classes of line operated AC motors (IE code)
Part 2 - Efficiency classes of variable speed AC motors (IE code)
Part 2 is still under development.
0,7
0,75
0,8
0,85
0,9
0,95
1
0,1 1 10 100 1000
Mo
tor
Effi
cie
ncy
(%
)
Motor Power (kW)
IE1
IE2
IE3
IE4

14
IEC 60034-30-1 significantly broadens the scope of products covered. The power range has been expanded to cover motors from 120 W to 1000 kW. All technical constructions of electric motors are covered as long as they are rated for direct on-line operation. These include single-phase motors, not just three-phase motors as in the previous edition, and line-start permanent magnet motors.
The standard covers single-speed electric motors that are rated according to IEC 60034-1 or IEC 60079-0 (explosive atmospheres), are rated for operation on a sinusoidal voltage supply and:
have a rated power PN from 0,12 kW to 1000 kW
have a rated voltage UN above 50 V up to 1 kV
have 2, 4, 6 or 8 poles
are capable of continuous operation at their rated power with a temperature rise
within the specified insulation temperature class;
NOTE – Most motors covered by this standard are rated for duty type S1 (continuous duty). However, some motors that are rated for other duty cycles are still capable of continuous operation at their rated power and these motors are also covered.
are marked with any ambient temperature within the range of – 20 °C to + 60 °C
NOTE – The rated efficiency and efficiency classes are based on 25 °C ambient temperature according to IEC 60034-2-1.
NOTE – Motors rated for temperatures outside the range – 20 °C and + 60 °C are considered to be of special construction and are consequently excluded from this standard.
NOTE – Smoke extraction motors with a temperature class of up to and including 400 °C are covered by this standard.
are marked with an altitude up to 4 000 m above sea level.
NOTE – The rated efficiency and efficiency class are based on a rating for altitudes up to 1000 m above sea level.
Excluded are:
Single-speed motors with 10 or more poles or multi-speed motors
Motors with mechanical commutators (such as DC-motors)
Motors completely integrated into a machine (for example pump, fan and compressor)
that cannot be practically tested separately from the machine even with provision of a
temporary end-shield and drive-end bearing;
NOTE – This means the motor must: a) share common components (apart from connectors such as bolts) with the driven unit (for example, a shaft or housing) and; b) not be designed in such a way as to enable the motor to be separated from the driven unit as an entire motor that can operate independently of the driven unit. That is, for a motor to be excluded from this standard, the process of separation must render the motor inoperative.

15
NOTE – (TEAO, IC417) Totally enclosed air-over machines, i.e. totally enclosed frame-surface cooled machines intended for exterior cooling by a ventilating means external to the machine, are covered by this standard. Efficiency testing of such motors may be performed with the fan removed and the cooling provided by an external blower with a similar airflow rate as the original fan.
Motors with integrated frequency-converters (compact drives) when the motor cannot
be tested separately from the converter;
NOTE – Energy-efficiency classification of compact drives must be based on the complete product (PDS = Power-Drive System) and will be defined in a separate standard. A motor is not excluded when the motor and frequency-converter can be separated and the motor can be tested independently of the converter.
Brake motors when the brake is an integral part of the inner motor construction and
can neither be removed nor supplied by a separate power source during the testing of
motor efficiency
NOTE - Brake motors with a brake coil that is integrated into the flange of the motor are covered as long as it is possible to test motor efficiency without the losses of the brake (for example by dismantling the brake or by energizing the brake coil from a separate power source).
NOTE - When the manufacturer offers a motor of the same design with and without a brake the test of motor efficiency may be done on a motor without the brake. The determined efficiency may then be used as the rating of both motor and brake motor.
Submersible motors specifically designed to operate wholly immersed in a liquid
Smoke extraction motors with a temperature class above 400 °C
The standard defines 4 efficiency classes IE1, IE2, IE3 and IE4. The IE4 efficiency level is now included in the standard while an IE5 level is envisaged for a future revision, with the goal of reducing the losses of IE5 by some 20% relative to IE4.

16
Figure 1-3. Efficiency levels in the draft IEC 60034-30-1 standard for 4 poled motors, 50 Hz
The efficiency levels in the power range 0,75 to 375 kW, already covered by the previous edition of the standard suffered no changes. Between 0,12 and 0,75 kW the limit values of efficiency were extrapolated, and between 375 and 1000 kW the fixed values were expanded.
The standard sets limit values of efficiency for each class regardless of technology used, to allow for the straightforward comparison between different technologies. It should be noted that not all of the motor technologies covered by this standard will be capable of reaching all efficiency levels.
1.2.7 IEC 60034-31
The recognition that in a motor driven application inefficiencies are present throughout the entire system (power supply, electric motor, speed controls, mechanical transmission, end-use device, etc.), as shown in Figure 14, and are influenced by diverse factors, such as maintenance practices, load management, intensity of use, etc. led to a recent standard (2010) dealing with the application of energy-efficient induction motors published by IEC:
Figure 1-4. Typical components in a motor system.
IEC 60034-31 (Ed.1.0): Rotating electrical machines - Part 31: Selection of energy-
efficient motors including variable speed applications - Application guide, 2010 [12]
The standard is intended to help manufactures, end-users, regulators, and other interested parties, with application issues regarding the use of energy-efficient motors and motor systems.
1.3 Existing relevant environmental legislation inside and outside the
EU and existing self regulation.
Motor efficiency regulations around the world are limited to AC induction motors. An overview of the AC three-phase induction motor efficiency voluntary agreements and regulation around the world is presented in Table 1-4.

17
Table 1-4 Overview of Minimum Energy Performance Standards (MEPS) Worldwide
Efficiency Levels Efficiency Classes Testing Standard Performance Standard
IEC 60034-30 IEC 60034-2-1 MEPS
Premium Efficiency IE3 Low Uncertainty
USA Europe 2015* (>7,5kW), 2017 Canada Korea 2015
High Efficiency IE2 USA Mexico Canada Australia New Zealand Brazil Korea China Europe Switzerland
Standard Efficiency IE1 Medium Uncertainty
China Brazil Costa Rica Israel Taiwan Switzerland
* IE3 or IE2 + VSD
These minimum energy performance standards and test methods rely on similar classification schemes, although the nomenclature is sometimes different which is a source of market confusion.
Table 1-5 Different classifications used worldwide
USA EPAct/NEMA Premium
Australia Minimum Efficiency/High Efficiency
China Grade 1, 2 and 3
EU IE1, IE2, IE3
European Union
In 1998 a voluntary agreement supported by the European Committee of Manufacturers of Electrical Machines and Power Electronics (CEMEP) and the European Commission was established and signed by 36 motor manufacturers, representing 80% of the European production of standard motors. In this agreement three motor efficiency levels were defined as:
1. EFF1 (similar to IE2)
2. EFF2 (similar to IE1)
3. EFF3 (below standard)
Based on this classification scheme there was a voluntary undertaking by motor manufacturers to reduce the sale of motors with EFF3 efficiency levels (standard efficiency).

18
The CEMEP/EU agreement was a very important first step to promote motor efficiency classification and labeling, achieving a significant market transformation. Low efficiency motors were essentially removed from the EU motor market which, at the time, was a positive development. However, the penetration of high and premium efficiency motors in 2009 was still very modest.
Figure 1-5 Total motor-sales in the scope of the CEMEP/EU Voluntary Agreement in the period 1998-2009 [2]
With the aim of improving the penetration of high-efficiency electric motors in the European market, the European Commission decided that it was time to set mandatory efficiency levels for motors sold within the European Union. Efficiency levels were based on the IEC60034-30 classification standard.
Minimum efficiency requirements were set in the Commission Regulation (EC) No 640/2009 [1], as follows:
1. from 16 June 2011, motors shall not be less efficient than the IE2 efficiency level
2. from 1 January 2015: motors with a rated output of 7,5-375 kW shall not be less
efficient than the IE3 efficiency level, or meet the IE2 efficiency level and be equipped
with a variable speed drive.
3. from 1 January 2017: all motors with a rated output of 0,75-375 kW shall not be less
efficient than the IE3 efficiency level, or meet the IE2 efficiency level and be equipped
with a variable speed drive.
These requirements apply to 2-, 4- and 6-pole, single speed, Three-Phase, induction Motors in the above mentioned power ranges, rated up to 1000 V and on the basis of continuous duty operation.
The following types of motor are excluded:
motors designed to operate wholly immersed in a liquid;
motors completely integrated into a product (e.g. pump or fan) where the motor’s
energy performance cannot be tested independently from the product;

19
motors specifically designed to operate:
- at altitudes exceeding 1000 meters
- where ambient air temperatures exceed 40°C;
- in maximum operating temperatures above 400°C;
- where ambient air temperatures are less than –15°C (any motor) or less than
0°C (air-cooled motors);
- where the water coolant temperature at the inlet to a product is less than 5°C
or exceeds 25°C;
- in potentially explosive atmospheres as defined in Directive 94/9/EC;
brake motors.
The regulation has since been amended by Regulation (EC) No 4/2014 and will reinforce the existing Regulation by closing most of the loopholes that have become apparent by redefining the limit values applied to altitude, maximum and minimum ambient air temperatures and water coolant temperatures.
This amendment revises the scope of exceptions to motors specifically designed to operate:
at altitudes exceeding 4 000 metres above sea-level;
where ambient air temperatures exceed 60 °C;
where ambient air temperatures are less than −30 °C for any motor or less than 0 °C
for a motor with water cooling;
where the water coolant temperature at the inlet to a product is less than 0 °C or
exceeding 32 °C;
Additionally, manufacturers were previously obliged to mark efficiency at 100%, 75% and 50% of rated load. Following the amendment only the figure for 100% rated load needs to be shown in the case of small motors (“where the size of the rating plate makes it impossible to mark all the information…”).
For the evaluation of the best available option (IE2 motor + VSD; IE3 motor fixed speed or IE3 motor + VSD) the following guidelines can be used in order to provide the users the most efficient solution [13]:
“Applications with fully loaded motors running at the network frequency and controlled by fixed speed motor starters, would consume less energy than if they were controlled by a Variable Speed Drive (VSD). Other applications, particularly variable torque loads, would reduce their energy consumption by using a VSD to match the motor speeds to the variations of the process demands. Both of the above statements apply to either an IE2 motor or an IE3 motor.
Referring to the Regulation (EC) 640/2009, Article 3, sub clauses 2 and 3, the end user has the decision whether to use an IE3 motor (fixed or variable speed), or an IE2 motor controlled by a variable speed drive. The end user should base their decision on which solution offers the lowest energy consumption for the dedicated application.
The determination of the lowest energy consumption for each specific application shall be performed in accordance with the standard (project number 23551) being developed by CENELEC CLC/TC 22X/WG 06. This standard is in response to European Commission mandate M/476 and M/470.”

20
United States of America
In 1992, the US Congress approved the Energy Policy Act (EPAct), which set minimum efficiency requirements (similar to IE2) for motors manufactured or imported for sale in the USA. These mandatory standards became effective in October 1997. From that time until 2008 the market sales for that efficiency level grew from 15% to 54%. The remaining market is evenly split between Premium motors and low efficiency motors outside the scope of the standard.
Table 1-6 Characteristics of the motors included on EPAct [14]
Motors included in EPACT scheme:
Polyphase squirrel-cage induction motors, NEMA Design A and B
Rated power 1-200 hp
Single-speed
230/400 Volts
60 Hz
Continuous rated
Tested in accordance with IEEE 112- Method B
2, 4 and 6 poles
Type of Enclosure: Totally Enclosed Fan-Cooled (TEFC) and Open Drip-Proof (ODP)
Meanwhile, many utilities and industry associations were promoting motors with a higher efficiency than EPAct mandatory levels (similar to IE2). Therefore the National Electrical Manufacturers Association (NEMA) felt a need to define a classification scheme for premium higher efficiency motors (similar to IE3). In June 2001, NEMA granted such "better-than-EPAct" motors special recognition by creating a label designated NEMA Premium. In 2001-2002 the total net units shipped went up approximately 30%. In 2002-2003 there was a 14% increase over the previous years. In 2006 NEMA Premium motors constituted 20-25% of the market share in the USA.
Figure 1-6. Market Penetration of NEMA Premium (voluntary) and EPAct (mandatory) motors (2001-2006) [15]

21
In order to further improve the market penetration of Premium Efficiency motors, the US Congress approved Energy Independence and Security Act of 2007 (EISA), which was enforced in December 2010. It not only sets higher minimum efficiency mandatory levels but also broadens the scope of existing standards, as follows:
Current minimum efficiency standards of general purpose induction motors as defined
in the 1992 EPAct and covered by federal legislation should be raised to NEMA
Premium levels (IE3).
Seven types of low voltage poly-phase, integral-horsepower induction motors not
currently covered under federal law should be subjected to minimum efficiency
standards at the levels defined in 1992’s EPAct (IE2) for general purpose induction
motors.
- U-Frame Motors
- Design C Motors
- Close-coupled pump motors
- Footless motors
- Vertical solid shaft normal thrust (tested in a horizontal configuration)
- 8-pole motors (900 rpm)
- All poly-phase motors with voltages up to 600 volts other than 230/460
volts
General purpose induction motors with power ratings between 200 and 500
horsepower should also meet minimum efficiency levels as specified in 1992’s EPAct
(IE2).
EISA does not apply to:
Motors with a special customer flange;
Vertical Motors;
Hollow shaft
P-Base solid shaft (hp, LP…) different from “Normal thrust”
Special shaft motors (Typically TZ, TCZ, TDZ, TY, LPZ…);
201 Hp – 500Hp design A or Medium Voltage;
Brake motors with an integral brake design that is factory built within the motor;
With the adoption of these new requirements, the sales of premium efficiency motors are expected to exceed 70% by 2013.

22
Figure 1-7. Expected impact of NEMA Premium® as a regulated product [15]
The USA has recently issued a regulation, Energy Conservation Standards for Small Electric Motors, regarding the efficiency of “small induction motors”, either single-phase or polyphase, ranging from 1/4 to 3 horsepower (0,18 to 2,2 kW), to be enforced in 2015. The Energy Policy and Conservation Act (EPCA) defines small electric motors as a NEMA (National Electrical Manufacturers Association) general purpose alternating current single-speed induction motor, built in a two-digit frame number series in accordance with NEMA Standards Publication MG1–1987.
The standards apply to three types of electric motors:
Polyphase Small Electric Motor
Single-phase Capacitor-Start Induction-Run
Single-phase Capacitor-Start Capacitor-Run
Next tables present the efficiency levels for polyphase; capacitor-start, induction run, and capacitor-start, capacitor-run motors.
Table 1-7 Standard levels for polyphase small electric motor
Motor output power Six poles Four poles Two poles
0.25 Hp/0.18 kW 67.5 69.5 65.6
0.33 Hp/0.25 kW 71.4 73.4 69.5
0.5 Hp/0.37 kW 75.3 78.2 73.4
0.75 Hp/0.55 kW 81.7 81.1 76.8
1 Hp/0.75 kW 82.5 83.5 77.0
1.5 Hp/1.1 kW 83.8 86.5 84.0
2 Hp/1.5 kW N/A 86.5 85.5
3 Hp/2.2 kW N/A 86.9 85.5
Table 1-8 Standard levels for capacitor-start induction-run and capacitor-start capacitor-run small electric motors

23
Motor output power Six poles Four poles Two poles
0.25 Hp/0.18 kW 62.2 68.5 66.6
0.33 Hp/0.25 kW 66.6 72.4 70.5
0.5 Hp/0.37 kW 76.2 76.2 72.4
0.75 Hp/0.55 kW 80.2 81.8 76.2
1 Hp/0.75 kW 81.1 82.6 80.4
1.5 Hp/1.1 kW N/A 83.8 81.5
2 Hp/1.5 kW N/A 84.5 82.9
3 Hp/2.2 kW N/A N/A 84.1
Single-phase small electric motors are commonly found in products and appliances including pumps, fans, and power tools. Polyphase small motors are used to drive such equipment as pumps, fans, and compressors.
Minimum energy performance standards in Mexico are similar to the USA.
Canada [16]
Canada has had minimum energy performance standards in place since 1995. This standards were amended in 1997 to include explosion-proof motors and integral gear assembly motors.
The regulation regarding electric motors was again revised and, as of January 2010, has a more stringent scope and minimum efficiency levels. The revised regulation applies to electric motors, including motors incorporated into another product, that:
is rated for continuous duty operation
is a design type that is :
o an electric three-phase induction design,
o a cage or squirrel-cage design, and
o a NEMA design A, B or C with NEMA T or U frame dimensions, or IEC design N
or H;
is designed to operate at a single speed
has a nominal output power of not less than 0.746 kW (1 hp) and not more than 375
kW (500 hp),
has a nominal voltage of not more than 600 V AC
has a nominal frequency of 50/60 Hz or 60 Hz
has a two, four, six or eight pole construction
has an IP code from 00 to 66
is of open or enclosed construction
is of foot-mounted construction or flange-mounted construction, and
has a standard shaft, R-shaft or S-shaft, or is a close-coupled pump motor or a
vertically-mounted solid shaft normal thrust motor;
The regulation excludes:
a NEMA design A or C motor of more than 150 kW (200 hp) and not more than 375 kW
(500 hp) or
an IEC design H motor of more than 150 kW (200 hp) and not more than 375 kW (500
hp).

24
Motors that match the above description and that:
have an output power of not less than 0.746 kW (1 hp) and not more than 150 kW
(200 hp),
have two, four or six poles
are NEMA T frame or IEC frame number of 90 or above
are NEMA design A or B or IEC design N
have a standard shaft, R-shaft or S-shaft and IEC equivalent
have foot-mounting or C-face mounting with feet or detachable feet or D-flange
mounting with feet or detachable feet
Must meet or exceed Premium (IE3) efficiency levels.
Motors that are in the scope of the regulation and that meet any one of the following definitions below:
eight pole construction
NEMA U frame
NEMA design C or IEC design H
close-coupled pump motor
vertically-mounted solid shaft normal thrust motor
fire pump duty motor
motor that it is not a foot-mounting, including a non foot-mounting type C face-
mounting or a non-foot mounting type D flange-mounting motors
integral gear assembly motor
it is a two, four, six or eight pole, NEMA design B or IEC design N motor with an output
power greater than 150 kW (200 hp) and not more than 375 kW (500 hp)
Must meet or exceed Energy Efficient (IE2) efficiency levels.
Brazil
Brazil started a voluntary labelling program for induction motors in 1993. It was a coordinated effort between motor manufacturers, CEPEL (Centro de Pesquisas de Energia Elétrica da Eletrobras) and INMETRO (Instituto Nacional de Metrologia, Normalização e Qualidade Industrial). The program defined periodically revised efficiency levels, for standard- and high-efficiency motors.
In 2002, MEPS were introduced by Decree 4.508/2002, applying to:
Motors with electric single speed, three-phase 60 Hz, squirrel cage induction
2 to 8 poles
Rated voltage of Un up to 600 V
Rated output Pn between 1 up to 250 hp (0,75 up to 185 kW) for 2 and 4 poles, 1 up to
200 hp (0,75 up to 150 kW) for 6 poles and 1 up to 150 hp (0,75 kW up to 110 kW) for
8 poles
Rated on the basis of continuous duty operation
Cat N, H (ABNT - IEC) or design A, B or C (NEMA);

25
Motors with intermediate power;
Motors with special bearings;
Close coupled pump (JM and JP);
Totally Enclosed Fan Cooled motors;
Motors below the standard efficiency levels (similar to IE1) were not allowed for sale in the country.
In 2010 MEPS were raised to high efficiency levels (IE2).
Australia / New Zealand
Australia has implemented its Minimum Energy Performance (MEPS) requirements in October 2001 for three phase electric motors from 0.73kW to <185kW which were set out in AS/NZS 1359.5-2000. MEPS does not apply to submersible motors, integral motor-gear systems, variable or multi-speed motors or those rated only for short duty cycles
These MEPS were updated in April 2006 which are set out in detail in AS/NZS 1359.5-2004, published in September 2004. Minimum Efficiency levels were raised to IE2 equivalents and High Efficiency to IE3 equivalents.
Two methods of efficiency measurement, described in AS 1359.102, are allowed:
Method A, identical to method 1 of IEC 61972 and technically equivalent to method B
specified in IEEE 112;
Method B, based on IEC 60034-2 “summation of losses” test procedure.
Therefore, there are two tables for each efficiency level, depending on the method used to determine efficiency.
China [17]
China first introduced Minimum Energy Performance standards in 2002 (GB18613: 2002). The standard has since been revised and substituted by GB18613: 2006 – “The minimum allowable values of energy efficiency and the energy efficiency grades for small and medium three-phase asynchronous motors”. The revised standard, based on the CEMEP-EU Agreement, established energy efficiency Grades (Grade 1, 2 and 3), grade 1 being the highest efficiency level.
The standard was enforced in 2007 and prevented motors with efficiency below the Grade 3 level (equivalent to IE1) from being manufactured or sold in the country. The minimum efficiency requirements were raised to IE2 levels in 2011 and further to IE3 until 2015. A label for IE4 efficiency motors is also expected to be introduced as a voluntary scheme.
It applies to general purpose motors (including explosion-proof) with 690V and lower voltage, 50Hz three-phase alternating current power supply, the scope of rating power between 0.55kW to 315kW for grade 2 (IE2) and grade 3 (IE1), and 3KW to 315KW for grade 1(IE3), the numbers of poles are 2, 4 and 6, single-speed close fan-cooled and N design.
Motor efficiency should be tested according to the method of Loss Analysis prescribed in GB/T 1032. In where, the stray loss of motors is calculated as 0.5% of rated input power. This test method is described in IEC 60034-2-1 as being a medium uncertainty test method and is

26
therefore, not accepted as a valid test method in the IEC60034-30 classification standard. Provisions are being taken to revise GB/T 1032 in order to coordinate it with IEC standards.
MEPS for small motors were recently enforced in China (GB 25958-2011 - Minimum allowable values of energy efficiency and efficiency grade for small-power motors)
This standard applies to small three‐phase asynchronous motors (10W - 2.2kW), capacitor‐run asynchronous motors (10W - 2.2kW), capacitor‐start induction motors (120W - 3.7kW), double‐value capacitor induction motors (250W - 3kW) for general purpose with the voltage ≤ 690V, 50Hz AC power, and also to fan motors for room air conditioner (6W - 550W).
A labelling and financial incentive scheme for Medium Voltage (6000V) and High Voltage (10000) three-phase asynchronous motors is also being introduced. It covers motors in the 355 kW to 25000 kW power range.
In 2009, an energy labelling scheme for VSDs was introduced, covering variable frequency speed regulation devices using three-phase AC power supply, which voltage is no higher than 660V, frequency of 50Hz, and power no bigger than 315kW.
Rest of the World
Other countries are recognizing the importance of energy efficiency in electric motors and its potential economic and environmental impact and are working on developing mandatory minimum energy performance standards to be implemented in the near future. These standards are expected to follow the IEC 60034-30 classification.
Some examples of foreseen regulation include:
Japan: IE2 expected for 2012
220/220/400/440 V, 50/60 Hz, 0.2 – 160 kW, 2 – 6;
India: IE2 expected for 2013
415/690 V, 50 Hz, 0.37 – 315 kW, 2 – 8 poles;
Israel: IE3 expected for 2015
400 V, 50 Hz, 0.75 – 185 kW, 2 – 8 poles;
United Arab Emirates: IE2 expected for 06/2011 (based on EC Nr. 640/2009 European Union) with recommendations;
400 V, 50 Hz, 0.75 – 375 kW, 2 – 6 poles;
1.3.1 WEEE Directive (Directive 2002/96/EC)
With the purpose of preventing waste of electrical and electronic equipment (WEEE), the EU adopted Directive 2002/96/EC imposing responsibility on producers for the environmental impact of the disposal of such waste.
Furthermore, it states that Member States should encourage the design and production of electrical and electronic equipment that facilitates reuse, recycling and other forms of

27
recovery of such wastes in order to reduce them. Producers should not prevent, through specific design features or manufacturing processes, WEEE from being reused, unless such specific design features or manufacturing processes present overriding advantages, for example with regards to the protection of the environment and/or safety requirements.
In the WEEE Directive “electrical and electronic equipment” (EEE) is defined as:
Equipment which is dependent on electric currents or electromagnetic fields in order to work properly
Equipment designed for use with a voltage rating not exceeding 1000 Volt for alternating current and 1500 Volt for direct current;
Equipment for the generation, transfer and measurement of such currents and fields
And cover EEE falling under the following categories (Annex IA of the WEEE Directive):
Large household appliances
Small household appliances
IT and telecommunications equipment
Consumer equipment
Lighting equipment
Electrical and electronic tools (with the exception of large-scale stationary industrial tools)
Toys, leisure and sports equipment
Medical devices (with the exception of all implanted and infected products)
Monitoring and control instruments
Automatic dispensers
Some electric motors, particularly in the small power range (120W to 750W) can be a part of some of the products included in the above categories and so responsibilities are believed to fall on the producers of the complete equipment. Separately sold electric motors do not fall in the scope of the WEEE Directive.
Furthermore, any equipment that is a part, component or subassembly of a fixed installation is also outside the scope of the WEEE Directive.
As a consequence, components (such as electric motors, variable speed motor drives, switchgear & controlgear products, etc.) of fixed industrial installations do not fall within the scope of the WEEE Directive, since they are not finished products, but part of equipment that does not fall under the scope of the WEEE.
1.3.2 RoHS Directive (Directive 2002/95/EC)
The Restriction on the Use of Certain Hazardous Substances in Electrical and Electronic Equipment Directive - RoHS) Directive 2002/95/EC – which took effect July 1, 2006 – restricts the use of certain hazardous substances in electrical and electronic equipment.
Member states should ensure that from that date forward, new products do not contain lead, mercury, cadmium, hexavalent chromium, polybrominated biphenyls (PBB) or polybrominated diphenyl ethers (PBDE).

28
This directive covers electrical and electronic equipment as defined in the WEEE Directive and equipment falling under the categories defined in its Annex IA.
As mentioned earlier, some electric motors can be a part of some of the equipments covered by the directive. Therefore, producers of such equipment should ensure that none of the motors to be included in their equipment contain any of the hazardous substances mentioned in the directive.
1.4 Summary
This study will address electric motors that are not covered by the current European energy efficiency regulation (EC Regulation 640/2009) with special attention given to motors:
outside the power range 0,75 kW to 375 kW
in the 0,75 kW to 375 kW power range, but which are currently excluded from the
Regulation, such as:
o brake motors, other operation ratings
o other technologies (single-phase motors, PM motor, SR motors, Special
purpose inverter duty motors)
The recognised potential impact of motor controllers, such as VSDs and Soft-starters, on the efficiency of motor systems as been acknowledged and these products will also be evaluated in detail.
Motors will be divided into three categories based on output mechanical power:
Small motors – 0,120 kW to 0,750 kW
Medium motors – 0,750 kW to 375 kW
Large motors – 375 kW to 1000 kW
Electronics controllers will be divided into two categories, based on apparent power handling capability:
having a power handling capacity <= 7.5 kVA
having a power handling capacity > 7.5 kVA
Recently developed standards on motor efficiency testing and classification (IEC 60034-2-1 and IEC 60034-30), which harmonise different efficiency test methods and efficiency classification schemes in use around the world, allowed to overcome the difficulties manufacturers encounter when producing motors for a global market and helped to make a more transparent market.
Other standards in development regarding test methods for converter-fed motors (IEC 60034-2-3), and test methods and classification of Power Drive Systems and motor controllers (CLC 52800-x), will hopefully become the basis for efficiency standardization of these products with high potential for environmental impact reduction.
Almost all the major economies have some kind of voluntary or mandatory regulatory scheme regarding induction motor efficiency. An overview of different motor efficiency regulation in use around the world is given, showing an increasing stringency on the adopted efficiency levels.

29

30
1.5 References
[1] European Comission, Commission Regulation (EC) No 640/2009 of 22 July 2009 implementing Directive 2005/32/EC of the European Parliament and of the Council with regard to ecodesign requirements for electric motors, Brussels, 2009.
[2] A. T. de Almeida, P. Fonseca, F. Ferreira and J. Fong, “EuP Lot 11 Motors, Ecodesign Assessment of Energy Using Products,” ISR-University of Coimbra for EC-DG-TREN, 2008.
[3] Eurostat, “PRODCOM,” [Online]. Available: http://epp.eurostat.ec.europa.eu/portal/page/portal/prodcom/introduction. [Acedido em 2012].
[4] P. Waide e C. Brunner, “Energy-Efficiency Policy Opportunities for Electric Motor Systems,” IEA, 2011.
[5] IEC 60034-2-1: Methods for determining losses and efficiency of rotating electrical machinery from tests - excluding machines for traction vehicles, International Electrotechnical Commission, 2007.
[6] IEC 60034-30: Efficiency classes of single-speed, three-phase, cage-induction motors, International Electrotechnical Commission, 2010.
[7] A. de Almeida, J. .. T. .. E. .. F. Ferreira e J. Fong, Standards for efficiency of electric motors - Permanent magnet synchronous motor technology, 2011.
[8] IEC 60034-2 Methods for determining losses and efficiency of rotating electrical machinery from tests - excluding machines for traction vehicles, International Electrotechnical Commission , 1996.
[9] IEEE, IEEE 112-B Standard Test Procedure for Polyphase Induction Motors and Generators, 2004.
[10] IEC 60034-2-2 Rotating electrical machines - Part 2-2: Specific methods for determining separate losses of large machines from tests, International Electrotechnical Commission, 2010.

31
[11] IEC 60034-25: Guidance for the design and performance of A.C. motors specifically designed for converter supply, International Electrotechnical Commission, 2007.
[12] IEC 60034-31: Guide for the selection and application of energy efficient motors including variable-speed applications, International Electrotechnical Commission, 2010.
[13] CAPIEL, EU Regulation for Ecodesign of electric motors (n°2), 2012. http://capiel.eu/data/Journal_CAPIEL_MOTEUR-2_EN.pdf
[14] A. Balducci, EPACT Legislation - The United States experience of minimum efficiency standards for induction motor, Springer - Venlag, 1997.
[15] R. Boteler, Motor Efficiency North American Standards and Regulations, Zurich, 2008.
[16] "National Resources Canada - Energy Efficiency Regulations - Electric Motors," [Online]. Available: http://oee.nrcan.gc.ca/regulations/bulletins/17333. [Accessed May 2012].
[17] GB 18613-2006 Minimum Allowable Values of Energy Efficiency and the Energy Efficiency Grades for Small and Medium Three-phase Asynchronous Motors, GAQSIQ, SAC, 2006.
[18] M. Dopplebauer, “IEC 60034-30 2nd edition (Presentation),” em EEMODS 2011, Alexandria, USA, 2011.
EuP Lot 30: Electric Motors and Drives
Task 2: Economic and Market Analysis
ENER/C3/413-2010
Final
April 2014
Anibal de Almeida
Hugh Falkner
João Fong
Keeran Jugdoyal
This document has been prepared for the European Commission however it reflects the views only of the authors, and the Commission cannot be held responsible for any use which may be made of the information contained therein.
ISR – University of Coimbra

2
Contents
2 Economics and Market .......................................................................................................... 3
2.1 Generic Economic Data ................................................................................................. 3
2.2 Motor Stock ................................................................................................................... 7
2.3 Market Trends ............................................................................................................. 10
2.3.1 Small motors (150 W to 750 W) .......................................................................... 10
2.3.2 Medium motors (0,750 to 375 kW) ..................................................................... 11
2.3.3 Large Motors (over 375 kW) ............................................................................... 13
2.3.4 VSDs and Controllers Market .............................................................................. 13
2.4 Motor and VSD Prices ................................................................................................. 15
2.5 Electricity Prices .......................................................................................................... 18
2.6 Repair and Maintenance Costs ................................................................................... 19
2.7 Summary ..................................................................................................................... 19
2.8 References ................................................................................................................... 20

3
2 Economics and Market
This section gives data on current market figures, stock and market trends, in order to indicate the place of possible eco-design measures on motors and drives. Data that will be used for the calculation of Life Cycle Costs, such as motor prices and electricity rates are also collected here.
2.1 Generic Economic Data
The global stock of electric motors is estimated at 2,23 billion. Small motors, under 750 W, account for 90% of the electric motors population (approximately 2 billion) but use only 9% of the overall electricity consumption. There are around 230 million medium motors, in the 0.75 kW to 375 kW power range, about 9% of the installed motors, which are responsible for 68% of the electricity consumed by motor systems. Large motors, with powers over 375 kW represent the smallest number, with only 0,6 million motors installed globally but, nevertheless, they are responsible for 23% of the energy use [1].
Motor market data, relating to Europe, was primarily sourced from official EU statistics so that it is coherent with official data used in EU industry and trade policy. Prodcom [2] (which stands for Production Communautaire) is the official Eurostat source of statistics on the production of manufactured goods.
Table 2-1 presents the PRODCOM classification for electric motors.
Table 2-1 PRODCOM categorisation for electric motors
27.11.10.30 DC motors and generators of an output > 37.5 W but <= 750 W (excluding starter motors for internal combustion engines)
27.11.10.53 DC motors and generators of an output > 0.75 kW but <= 7.5 kW (excluding starter motors for internal combustion engines)
27.11.10.55 DC motors and generators of an output > 7.5 kW but <= 75 kW (excluding starter motors for internal combustion engines)
27.11.10.70 DC motors and generators of an output > 75 kW but <= 375 kW (excluding starter motors for internal combustion engines)
27.11.10.90 DC motors and generators of an output > 375 kW (excluding starter motors for internal combustion engines)
27.11.21.00 Universal AC/DC motors of an output > 37.5 W
27.11.22.30 Single-phase AC motors of an output <= 750 W
27.11.22.50 Single-phase AC motors of an ouput > 750 W
27.11.23.00 Multi-phase AC motors of an output <= 750 W
27.11.24.03 Multi-phase AC motors of an output > 0.75 kW but <= 7.5 kW
27.11.24.05 Multi-phase AC motors of an output > 7.5 kW but <= 37 kW
27.11.24.07 Multi-phase AC motors of an output > 37 kW but <= 75 kW
27.11.25.40 Multi-phase AC motors of an output > 75 kW but <= 375 kW (excluding traction motors)
27.11.25.60 Multi-phase AC motors of an output > 375 kW but <= 750 kW (excluding traction motors)
27.11.25.90 Multi-phase AC motors of an output > 750 kW (excluding traction motors)
The Prodcom data available is not sufficiently disaggregated for the purpose of this study, particularly regarding DC motors which are grouped with DC generators. Furthermore, the data for DC motors also includes motors produced for applications where only DC power is

4
available such as forklifts, battery powered tools and for subsystems used in the automotive industry (e.g. powered windows, windscreen wipers), which are outside the scope of this study. This is especially relevant for small motors under 750 W. As an example, in 1999 automotive applications represented 37,1 of fractional power (<1hp or <0,750 kW) DC motors sales by value, in Germany [3], shown in Table 2-2. Since then, the number of automotive applications for small DC motors has increased and with it the respective market share.
Table 2-2 Small DC motor market - Percent of Revenues by Application (Germany, 1999)
Application (%)
Automotive Auxiliaries 37,1
Domestic Appliances 11,2
Industrial Machinery 13,1
Pumps and Compressors 10,2
HVAC 9,3
Portable Tools 4,7
Office Machinery 5,7
Medical Equipment 4,2
Others 4,5
Total 100,0 Note: Others include toys, video recorders, hi-fi stereo systems, photographic equipment, agriculture, defence and aerospace, clocks, garage doors and a growing range of other automated household functions and security systems.
Traditionally, conventional brushed DC motors in the medium power range have been used in industrial applications requiring accurate torque and/or speed control (e.g. servo drives, traction). The developments in power electronics in the last 25 years allowed induction motors to achieve the same torque/speed performance of DC motors in high demand applications, but with much higher reliability leading to a decline in market share of DC motors, in the medium power range.
Table 2-3 presents the number of electric motors sold in the EU-27 in 2010 in the different power ranges by technology used, according to ProdCom data.
Table 2-3 ProdCom data for electric motors and generators sold, in thousands (EU-27, 2010)
Power range
≤ 750 W > 0,75 ≤ 375 kW > 375 kW
n. units % n. units % n. units %
DC Motors and Generators 128 176 56 4417 21 1 5
AC Single-Phase 67 019 29 6379 30 n/a n/a
AC Multi-Phase 11 700 5 10175 49 28 95
Universal 23 228 10 n/a n/a n/a n/a
Total 230123 20970 30
In 2010 over 250 million motors were sold in Europe, 91 % of which were in the small power range, that is, under 750 W. The share of large motors is very small (only 0,01%). The remaining 9% of motors sold are in the medium power range. These values are consistent with the available estimates of global sales of motors.
Table 2-4 shows the revenues of motors sold in each technology, for each of the power ranges under consideration.

5
Table 2-4 Prodcom revenue data for electric motors and generators, in millions (EU-27, 2010)
Power range
≤ 750 W > 0,75 ≤ 375 kW > 375 kW
Value € % Value € % Value € %
DC Motors and Generators 1 762 39 515 11 64 5
AC Single-Phase 1 365 30 805 17 n/a n/a
AC Multi-Phase 805 18 3384 72 1142 95
Universal 576 13 n/a n/a n/a n/a
Total 4508 100 4705 100 1207 100
Data provided by CEMEP for induction motors slightly differs from the ProdCom data presented, as can be seen in Table 2-5.
Table 2-5 Induction motors sold, in thousands, and revenue in million € (EU-27, 2010) Source: CEMEP
Power range
≤ 750 W > 0,75 ≤ 375 kW > 375 kW
n. units Million€ n. units Million€ n. units Million€
AC Single-Phase* 800 48
AC Multi-Phase 7 300 580 8 100 2 700 13-13,5 320-340
Total
* Only in typical industry applications.
The number of AC Single-Phase motors sold provided by CEMEP only relates to motors used in industrial applications. However, these motors can be found in a number of other applications, such as household appliances. The total number of AC Single-Phase motors sold according to ProdCom is in-line with other market studies [3] and will be used in further calculations.
The number of DC Multi-Phase motors sold in the EU-27, by power range, in 2010 is shown in Table 2-7.
Table 2-6 Prodcom number of DC Multi-Phase motors sold and market share, in thousands (EU-27, 2010)
Power range n. of units sold Market Share(%)
≤ 750 W 128176 96,67
> 0.75 kW but ≤ 7.5 kW 3600 2,72
> 7.5 kW but ≤ 37 kW 800 0,60
> 37 kW but ≤ 75 kW 17 0,01
> 75 kW but ≤ 375 kW (excluding traction motors) 1 0,001
Total 132594 100
The number of AC Multi-Phase motors sold in the EU-27, by power range, in 2010 is shown in Table 2-7.

6
Table 2-7 ProdCom number of AC Multi-Phase motors sold in thousands, and market share (EU-27, 2010)
Power range n. of units sold Market Share(%)
≤ 750 W 11700 53,42
> 0.75 kW but ≤ 7.5 kW 8366 38,20
> 7.5 kW but ≤ 37 kW 1512 6,90
> 37 kW but ≤ 75 kW 202 0,92
> 75 kW but ≤ 375 kW (excluding traction motors) 94 0,43
> 375 kW but ≤ 750 kW (excluding traction motors) 21 0,10
> 750 kW (excluding traction motors) 7 0,03
Total 21903 100%
CEMEP data relating to AC motors over 375kW gives a significantly lower number of units sold annually, as seen in Table 2-6.
Table 2-8 Number of Large AC Multi-Phase motors sold in thousands (EU-27, 2012) Source: CEMEP
Power range n. of units sold
> 375 kW but ≤ 1000 kW Low Voltage 10
Medium Voltage 3 – 3,5
Total 13 -13,5
The share of electricity demand of motors, by end-use application in the industrial sector is shown in Figure 2-1.
Figure 2-1 Estimated share of global EMDS electricity demand by end‐use application
Compressors; 32%
Mechanical movement;
30%
Pumps; 19%
Fans; 19%

7
Next table presents the number of inverters sold by power handling capacity, in the EU-27, in 2010.
Table 2-9 Prodcom number of VSDs sold by power handling capacity (EU-27, 2010)
Power handling capacity n. of units sold in thousands
Value In million Euros
≤ 7.5 kVA 5837 2400
> 7.5 kVA 2000 3170
The data disaggregation given by ProdCom is not sufficient for the purpose of this study. CEMEP provided VSD market data for the power ranges considered in the study, as shown in table xx.
Table 2-10 Number of VSDs sold and revenues by power range (EU-27, 2012) Source: CEMEP
Power range
> 120 W ≤ 750 W > 0,75 kW ≤ 375 kW > 375 kW ≤ 1000 kW
n. units Mio € n. units Mio € n. units Mio €
VSDs 1,13 Mio 200 2,89 Mio 2.500 7.000 260
8,9 million static converters (excluding polycrystalline semiconductors, converters specially designed for welding, without welding equipment, accumulator chargers, rectifiers, inverters), which include soft-starters, were sold representing a sales volume of 1,566 billion euros, according to ProdCom data.
Again, ProdCom data is not sufficiently disaggregated for the purpose of this study. CAPIEL provided market data for Soft-Starters and Electro-Mechanical starters.
Table 2-11 Number of Soft-Starters and Electro-Mechanical starters sold (in thousands) and revenues (in million €) by power range (EU-27, 2012) Source: CAPIEL
Power range
> 120 W ≤ 750 W > 0,75 kW ≤ 375 kW > 375kW ≤ 1000 kW
n. units € n. units € n. units €
Soft Starters 20 1,2 360 74 1 6,5
Contactors 10 300 103 19 200 575 3 4,5
2.2 Motor Stock
For the estimation of the motor installed base a bottom up approach was used starting at the number of motors sold in each category.
The following assumptions were made:
An average lifetime of 10, 15 and 20 years for motors in each of the power range
considered (small, medium and large), which is gives a replacement rate of 10 %; 6,7%
and 5% for each of the power ranges, respectively.

8
An yearly market growth of 2,1 %, equivalent to the increase of electricity
consumption, in the EU-27, in the period 2000-2010.
European manufacturers often sell motors that are included into equipment that is
then exported. It is assumed that these exports account for about 20% of the motors
sold and therefore do not contribute to the European stock of motors.
Table 2-12 Estimation of the motor stock in thousands (EU-27, 2010)
Power range
≤ 750 W > 0,75 ≤ 375 kW > 375 kW
n. units n. units n. units
DC Motors and Generators 847444 40304 16
AC Single-Phase 443101 58209 n/a
AC Multi-Phase 77355 92852 n/a
Universal 153575 n/a 317
Total 1521476 191365 333
The evolution of the installed base of three-phase induction motors is estimated here, projecting the sales of these motors according to the existing policy measures (Regulation 640/2009). The results for two scenarios, in the period 1998-2020, are presented here.
1. No Regulation – based on the information collected in the EuP Lot 11 study, and the evolution of the electricity consumption in the EU-25. The 1998 (base year) installed stock is conservatively assumed to be divided by efficiency levels according to the sales in that year.
The motor stock in 1998 was based in previous studies and in the period 1998-2020 the evolution of motor sales in this scenario was made according to the evolution of the electricity consumption in the respective sectors. In the period 1998-2009 the CEMEP sales by efficiency class were considered.
2. Regulation 640/2009 [4] – Same as No regulation until end of 2010. Motors in the power range of 0,75-375 kW manufactured in or imported into the EU after June 2011 must meet or exceed the IE2 efficiency level as defined in the IEC 60034-30 standard until the end of 2014. Motors with a power rating over 7,5 kW (included) manufactured in or imported into the EU after January 1, 2015 must meet or exceed the IE3 efficiency level as defined in the IEC 60034-30 standard [5]. Motors with a power rating over 0,750 kW (included) manufactured in or imported into the EU after January 1, 2017 must meet or exceed the IE3 efficiency level as defined in the IEC 60034-30 standard A residual number of sales (15%) of motors under the IE3 class is maintained to take into account special purpose motors that fall out of the product definition. The option to use IE2 motor+VSD, instead of an IE3 motor was not considered,

9
Figure 2-2 Evolution of the motor installed base, by efficiency class, in the industry (No regulation)
Figure 2-3 Evolution of the motor installed base, by efficiency class, in the tertiary sector (No regulation)
0
10
20
30
40
50
60
70
mill
ion
un
its
No Class IE1 IE2
0
5
10
15
20
25
30
35
40
45
mill
ion
un
its
No Class IE1 IE2

10
Figure 2-4 Evolution of the motor installed base, by efficiency class, in the industry (Regulation 640/2009)
Figure 2-5 Evolution of the motor installed base, by efficiency class, in the tertiary sector (Regulation 640/2009)
2.3 Market Trends
2.3.1 Small motors (150 W to 750 W)
The market of single-phase motors has been slowly declining as they are being replaced by other technologies in HVAC, domestic appliances and some industrial applications.
The falling price of inverters is expected to promote growth in the use of AC polyphase products. As inverters become less expensive, a growing number of industrial motor users are favouring AC polyphase motors over DC motors. Accompanied with an inverter, AC polyphase motors offer good control and lower running costs in the medium and long run because of the absence of brushes.
0
10
20
30
40
50
60
70
mill
ion
un
its
No Class IE1 IE2 IE3
0
5
10
15
20
25
30
35
40
45
mill
ion
un
its
No Class IE1 IE2 IE3

11
The falling price of DC brushless motors is encouraging the gradual replacement of existing DC products and of induction motors. While brushless motors remain more expensive than standard DC motors, reduced operating costs because of the absence of brushes and much higher efficiency are increasingly seen as justifying the higher initial cost. The minimum efficiency requirements set to some applications also encourages OEM to include these motors in their products.
The number of units sold, per technology used in this power range, can be seen in the next figure, for the years 2003 to 2010.
Figure 2-6 Number of small electric motors sold, per technology used (EU-27)
2.3.2 Medium motors (0,750 to 375 kW)
In the medium power range, conventional Brushed DC motor market is expected to continue to decline as this technology is being replaced by three-phase induction motors which can have a high dynamic performance when fed by VSDs, cost less and require much less maintenance. Permanent Magnet DC Motors are mostly customized products, but they are expected to become widely available commercially, in standard mechanical dimensions (e.g. frame sizes, flanges, shaft heights, etc.) in the near future. Line-start permanent magnet motors, which as the name implies do not need an electronic controller, being able to start by direct connection to the mains supply, have been recently (2010) introduced in the market. These motors are able to achieve IE4 – Super Premium efficiency levels, and are produced in standard frame sizes, allowing the possibility of easy integration in products and allowing retrofitting. Since it does not need an electronic controller in constant speed applications, its application has not the associated cost premium and losses, allowing very high efficiency during synchronous running.
High performance magnets are made from rare earths such as neodymium and dysprosium, which are both imported from China. Because in the last decade China lowered the production prices (like many other products) the production of Rare Earth materials collapsed in other countries. The figure below shows the evolution of market for rare earth materials.
0
20000
40000
60000
80000
100000
120000
140000
160000
2003 2004 2005 2006 2007 2008 2009 2010
un
its
sold
in t
ho
usa
nd
s
year
DC motors and generators > 37.5 W but ≤ 750 W Single-phase AC motors of an output ≤ 750 W Universal AC/DCmotors > 37.5 W
Multi-phase AC motors of an output ≤ 750 W

12
Figure 2-7. Rare Earth Materials Production [6]
It seems critical that 97% of rare earth element production is currently controlled by China, where internal demand is rising.
The increase in demand of rare earth metals has caused an increase in market price in the last few years as can be seen in Figure 2-8.
Figure 2-8 Rare Earth Metals Market Price Trends
In applications in which space or weight is not at premium (e.g. appliances and fans) the use of low cost ferrite magnets is already usual. Motor manufacturers have developed motors using ferrite magnets (about one 20th of the price of rare earth magnets which are commonly used in electronics parts.
The decrease in demand of single-phase integral motors is expected to persist due to the increased use of electronic speed controls. These controls allow a single-phase supply to feed a cheaper and comparatively more efficient 3-phase motor.

13
The number of units sold in the EU, per technology used in this power range, can be seen in the next figure, for the years 2003 to 2010.
Figure 2-9 Number of medium electric motors sold, per technology used (Prodcom EU-27)
The market in this power range is expected to continue to be largely dominated by three-phase induction motors, in the next years. As mentioned in the previous chapter, the introduction of mandatory and voluntary schemes to promote the penetration of energy efficient motor in the market has proven successful, particularly in countries where mandatory regulation is enforced. For example, the share of IE3/NEMA Premium Class in the United States has reached 20%, but it has failed to penetrate in the European Union.
Recently, IE4 induction motors have been introduced in the market by some manufacturers.
2.3.3 Large Motors (over 375 kW)
The large motor market is a very specialized market, with custom motors designed for specific applications. Since more time and money are spent in the specification of this high cost products, there is a tendency to address high efficiency performance during the process. Therefore, the market structure is not expected to experience major changes.
2.3.4 VSDs and Controllers Market
The VSDs market, in 1998, for powers above 0,75 kW, was dominated by low power drives in the range of 0.75 to 4 kW, representing about 76% of the total units sold in the EU-15 [7].
0
2000
4000
6000
8000
10000
12000
14000
16000
2003 2004 2005 2006 2007 2008 2009 2010
un
its
sold
in t
ho
usa
nd
s
year
Multi-phase AC motors of an output > 0.75 kW but ≤ 375 kW Single-phase ACmotors of anouput > 750 W
DC motors and generators > 750 W but ≤ 375 kW

14
Figure 2-10 Number of units sold in the EU-15 and sales value per power range, in 1998
The market share by power range has not significantly changed for medium and large size applications (over 0,750 kW). The number of units sold with power handling capabilities below 7,5 kVA has risen considerably driven by developments in power electronics and by a price decrease.
The market for VSDs sold integrated into small pumps and fans, particularly in HVAC high-efficiency applications, has also been increasing significantly.
The number of units sold, per power range, can be seen in the next figure, for the years 2003 to 2010.
Figure 2-11 Number of VSD units sold for different power ranges (Prodcom EU-27)
The number of motor systems which include VSDs is, nevertheless, still small particularly when compared with countries, such as Japan, which began selling VSDs in de 1980’s and where sales have been encouraged by tax incentives since later in the same decade. VSD sales, by the mid‐1990s, accounted for about 75% of the sales volume of electric motors, which
0
1000
2000
3000
4000
5000
6000
7000
2003 2004 2005 2006 2007 2008 2009 2010
un
its
sold
, in
th
ou
san
ds
year
Power handling capacity ≤ 7.5 kVA
Power handlingcapacity > 7.5 kVA
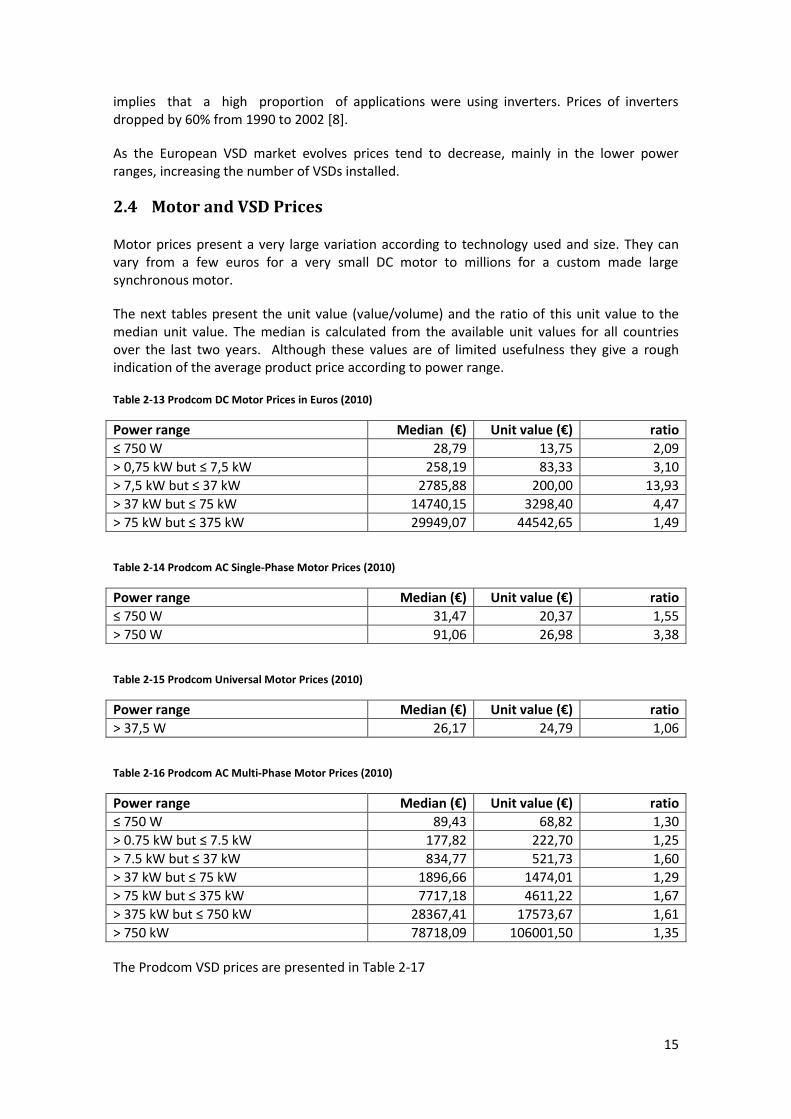
15
implies that a high proportion of applications were using inverters. Prices of inverters dropped by 60% from 1990 to 2002 [8].
As the European VSD market evolves prices tend to decrease, mainly in the lower power ranges, increasing the number of VSDs installed.
2.4 Motor and VSD Prices
Motor prices present a very large variation according to technology used and size. They can vary from a few euros for a very small DC motor to millions for a custom made large synchronous motor.
The next tables present the unit value (value/volume) and the ratio of this unit value to the median unit value. The median is calculated from the available unit values for all countries over the last two years. Although these values are of limited usefulness they give a rough indication of the average product price according to power range.
Table 2-13 Prodcom DC Motor Prices in Euros (2010)
Power range Median (€) Unit value (€) ratio
≤ 750 W 28,79 13,75 2,09
> 0,75 kW but ≤ 7,5 kW 258,19 83,33 3,10
> 7,5 kW but ≤ 37 kW 2785,88 200,00 13,93
> 37 kW but ≤ 75 kW 14740,15 3298,40 4,47
> 75 kW but ≤ 375 kW 29949,07 44542,65 1,49
Table 2-14 Prodcom AC Single-Phase Motor Prices (2010)
Power range Median (€) Unit value (€) ratio
≤ 750 W 31,47 20,37 1,55
> 750 W 91,06 26,98 3,38
Table 2-15 Prodcom Universal Motor Prices (2010)
Power range Median (€) Unit value (€) ratio
> 37,5 W 26,17 24,79 1,06
Table 2-16 Prodcom AC Multi-Phase Motor Prices (2010)
Power range Median (€) Unit value (€) ratio
≤ 750 W 89,43 68,82 1,30
> 0.75 kW but ≤ 7.5 kW 177,82 222,70 1,25
> 7.5 kW but ≤ 37 kW 834,77 521,73 1,60
> 37 kW but ≤ 75 kW 1896,66 1474,01 1,29
> 75 kW but ≤ 375 kW 7717,18 4611,22 1,67
> 375 kW but ≤ 750 kW 28367,41 17573,67 1,61
> 750 kW 78718,09 106001,50 1,35
The Prodcom VSD prices are presented in Table 2-17

16
Table 2-17 Prodcom VSD Prices (2010)
Power handling capacity Median (€) Unit value (€) ratio
≤ 7.5 kVA 463,86 411,15 1,13
> 7.5 kVA 3207,71 1585,02 2,02
As there are large uncertainties present in ProdCom data, CEMEP provided average prices and installation costs for motors under consideration in the study, which are presented in Table 2-18.
Table 2-18 Motor Average Prices (2012) Source: CEMEP
Description Power range (kW) Unit Price
(€) Installation
Costs (€)
AC Single-Phase Motor (IE1) 0.12 -0.75 60
AC Multi-Phase Motor (IE1) 0.12 – 0.75 80
AC Multi-Phase Motor (IE2)
0.75 - 2.1 150
7.5 – 45 600
76 - 110 6 000
(LV) 375 - 1000 25 000 1 000
(MV) 375 - 1000 40 000 3 000
In the medium power range motor prices can vary from around 150 € for an AC three-phase IE2 motor to around 50000 € for a 1000 kW MV motor. In general, the market is very competitive with large discounts (over 40%) offered to OEMs, although there are lesser pressures at higher power ratings as the degree of competition is not considered as fierce.
CEMEP and CAPIEL provided average prices and installation costs for VSDs, soft-starters and electro-mechanical starters, which are presented in
Table 2-19. The installation costs can vary depending on several factors, including wiring, filters, environment, location and conditions of the application. The installation costs are estimated as a percentage of the unit price, which is a general estimate, accepting that there will be large variations in either side of these ranges.

17
Table 2-19 Average prices for VSDs, soft-starters and electro-mechanical starters (2012) Source: CEMEP and CAPIEL
Description Power (kW) Unit Price
(€) Installation
Costs (€)
VSD
0.12 – 0.75 200 50-300%
0.75 – 2.1 280 50-250%
7.5 - 45 1 130 50-200%
76 - 110 5 320 50-175%
375 - 1000 41 790 50-150%
Soft Starter
1,1 60 30
11 100 70
110 800 100
Contactors
1,1 12 20
11 30 30
110 140 40

18
2.5 Electricity Prices
Electricity prices vary significantly in the EU, and even in each country the prices are strongly influenced by the consumption level.
The electricity prices for industry in the EU-27, for the first semester of 2011, are shown in the next table [9].
Table 2-20 Electricity prices for the EU-27 countries (€/kWh), 1st
semester 2011
Industrial Sector 500 MWh < Consumption < 2 000 MWh
European Union average (27 countries) 0.0935
Euro area average (EA11-2000, EA12-2006, EA13-2007, EA15-2008, EA16-2010, EA17) 0.0940
Belgium 0.1014
Bulgaria 0.0657
Czech Republic 0.1071
Denmark 0.0810
Germany (including former GDR from 1991) 0.0899
Estonia 0.0649
Ireland 0.1260
Greece 0.0982
Spain 0.1100
France 0.0667
Italy 0.1212
Cyprus 0.2041
Latvia 0.1101
Lithuania 0.1034
Luxembourg 0.0957
Hungary 0.0934
Malta 0.1800
Netherlands 0.0829
Austria :
Poland 0.0895
Portugal 0.0895
Romania 0.0803
Slovenia 0.0889
Slovakia 0.1218
Finland 0.0680
Sweden 0.0823
United Kingdom 0.0998
Norway 0.0764
Croatia 0.0886
Turkey 0.0730
Bosnia and Herzegovina 0.0644

19
2.6 Repair and Maintenance Costs
Small motors are normally not repaired and are replaced upon failure.
Medium power induction motors above 11 kW are normally repaired at least 2 times during its lifetime but this can occur up to 4 times.
Figure 2-12 allows the comparison between repair prices and new motor prices by power. It shows that for smaller motors the repair price exceeds the new motor price.
Figure 2-12 Comparison between repair prices and new motor prices [10]
2.7 Summary
In 2010 over 250 million motors were sold in Europe, 91 % of which were in the small power range, under 750 W. The share of large motors is very small (only 0,01%). The remaining 9% of motors sold are in the medium power range, where most of the consumption is concentrated.
In the small power range (< 750 W), DC motors account for 56% of the number of units sold but more than 37% of this motors are used in automotive applications which are out of the outside the scope of this study.
The decreasing price of electronic controllers is expected to lead to the further decline in AC single-phase motor sales, and the increase in AC multi-phase motors and in DC brushless motors.
In the medium power range (0,750 to 375 kW), AC multi-phase motors are responsible for 50% of sold units (72% in value). The conventional Brushed DC motor market in this power range is expected to continue to decline as this technology is being replaced by three-phase induction motors. Very high efficient technologies (e.g. PM motors, LSPM motors), which until recently were considered customized products, are becoming available in the market in standard dimensions, as commodity products.
Because of the recently introduced energy efficiency regulation on three-phase electric motors, the market share of motors in the IE2 and IE3 efficiency levels will increase substantially in the upcoming years.

20
The number of VSD units sold with power handling capabilities below 7,5 kVA has risen considerably in the last decade driven by developments in power electronics and by a decrease in prices. The market for VSDs sold integrated into small pumps and fans, particularly in HVAC high-efficiency applications, has also been increasing significantly.
2.8 References
[1] P. Waide e C. Brunner, “Energy-Efficiency Policy Opportunities for Electric Motor Systems,” IEA, 2011.
[2] Eurostat, “PRODCOM,” [Online]. Available: http://epp.eurostat.ec.europa.eu/portal/page/portal/prodcom/introduction. [Acedido em 2012].
[3] Frost & Sullivan, “European Fractional Horsepower Motors Markets,” 2000.
[4] A. T. de Almeida, P. Fonseca, F. Ferreira and J. Fong, “EuP Lot 11 Motors, Ecodesign Assessment of Energy Using Products,” ISR-University of Coimbra for EC-DG-TREN, 2008.
[5] International Electrotechnical Commision, “IEC 60034-30: Efficiency classes of single-speed, three-phase, cage-induction motors,” 2010.
[6] G. B. Haxel, J. B. Hedrick e G. Orris, “Rare Earth Elements — Critical Resources for High Technology,” U.S. Geological Survey, 2002.
[7] A. e. a. de Almeida, “VSD’s for Electric Motor Systems,” SAVE Report for EC, 2001.
[8] JWG - Japanese G8 Working Group on Motors, “End - Use Assessment on Industrial Electric Motors and Drives: Japanese proposal for Toyko G8 Summit,” 2007.
[9] EUROSTAT, 2012.

Task 3 Page 1 of 40
EuP Lot 30: Electric Motors and Drives
Task 3: Consumer Behaviour and Local Infrastructure
ENER/C3/413-2010
Final
April 2014
Anibal de Almeida
Hugh Falkner
João Fong
ISR – University of Coimbra

Task 3 Page 2 of 40
Table of Contents
3 Consumer Behaviour and Local Infrastructure ............................................................................... 4
3.1 Real Life Efficiency .................................................................................................................. 4
3.1.1 Real life energy considerations of induction motors ...................................................... 4
3.1.2 Dosage of auxiliary inputs during use ............................................................................. 8
3.1.3 Real Life energy considerations of Soft Starters ............................................................. 8
3.1.4 Real life energy considerations of VSDs. ....................................................................... 10
3.1.5 Other types of motor .................................................................................................... 13
3.2 End of Life behaviour ............................................................................................................ 14
3.2.1 Economical Product Life (=in practice) ......................................................................... 14
3.3 Local Infra-structure .............................................................................................................. 17
3.3.1 Electrical ........................................................................................................................ 18
3.3.2 Physical Environment .................................................................................................... 20
3.3.3 Appliances / Equipment in which motors are fitted ..................................................... 20
3.4 Summary ............................................................................................................................... 20
4 Introduction .................................................................................................................................. 24
4.1 Pumps in scope ..................................................................................................................... 25
4.2 Energy savings ....................................................................................................................... 25
5 Extended Product Approach for pumps ....................................................................................... 26
6 Load Profiles and reference control curves .................................................................................. 27
6.1 Closed loop variable flow system ......................................................................................... 27
6.2 Open loop variable flow system ........................................................................................... 28
6.3 Constant flow system (open and closed loop) ...................................................................... 30
6.4 Relation between system types and pump types ................................................................. 32
7 Methodology for calculation of EEI for extended products .......................................................... 33
7.1 Semi Analytical Models (SAMs) ............................................................................................ 34
7.2 References ............................................................................................................................ 37

Task 3 Page 3 of 40

Task 3 Page 4 of 40
3 Consumer Behaviour and Local Infrastructure
Consumer behaviour can – in part – be influenced by product-design but overall it is a very relevant input for the assessment of the environmental impact and the Life Cycle Costs of a product. One aim is to identify barriers and restrictions to possible eco-design measures, due to social, cultural or infra-structural factors. A second aim is to quantify relevant user-parameters that influence the environmental impact during product-life and that are different from the Standard test conditions as described in Subtask 1.2.
3.1 Real Life Efficiency
3.1.1 Real life energy considerations of induction motors
Actual efficiency compared to catalogue efficiency
The nominal efficiency represents the average value of a representative sample of manufactured motors for each product category. The actual motor full load efficiency can deviate from the nominal efficiency due to both manufacturing variation and testing uncertainty.
Evidence from independent verification is that motors do meet the claimed efficiencies. Because of the high material cost of making more efficient motors, established manufacturers are able to consistently produce motors that just exceed the MEPS.
Repair of failed motors
When induction motor windings fail, they will be removed and replaced with new windings. This process typically loses 0.5-2.0% in efficiency, although in some cases it is possible to have no additional losses, and even to reduce losses to less than those of the original machine. For large motors >55kW the average decrease in efficiency may be less than this.i
For maintenance personnel, the need to quickly get the plant working again means that the fastest option will usually be chosen. A motor can typically be repaired in less than 24 hours, and it can be certain that it will fit and work properly. Sourcing a new motor of the right specification may take longer, and there is a small risk of minor additional works for it to operate satisfactorily. The cost of unscheduled plant downtime will usually be much greater than those from the slightly reduced efficiency of an older motor compared to a new one. Hence motor repair is an important business.
For larger motors, the value of the motor makes repair increasingly attractive. The typical threshold for replacing rather than repair is 5-40kW. Across all users, the threshold for replace or repair is considered to be an average of 10kWii.
For specialist motors where replacements may be hard to source, then it will still be sensible to repair much smaller sizes.
Best practice in motor repair is given in an ANSI repair guideiii.
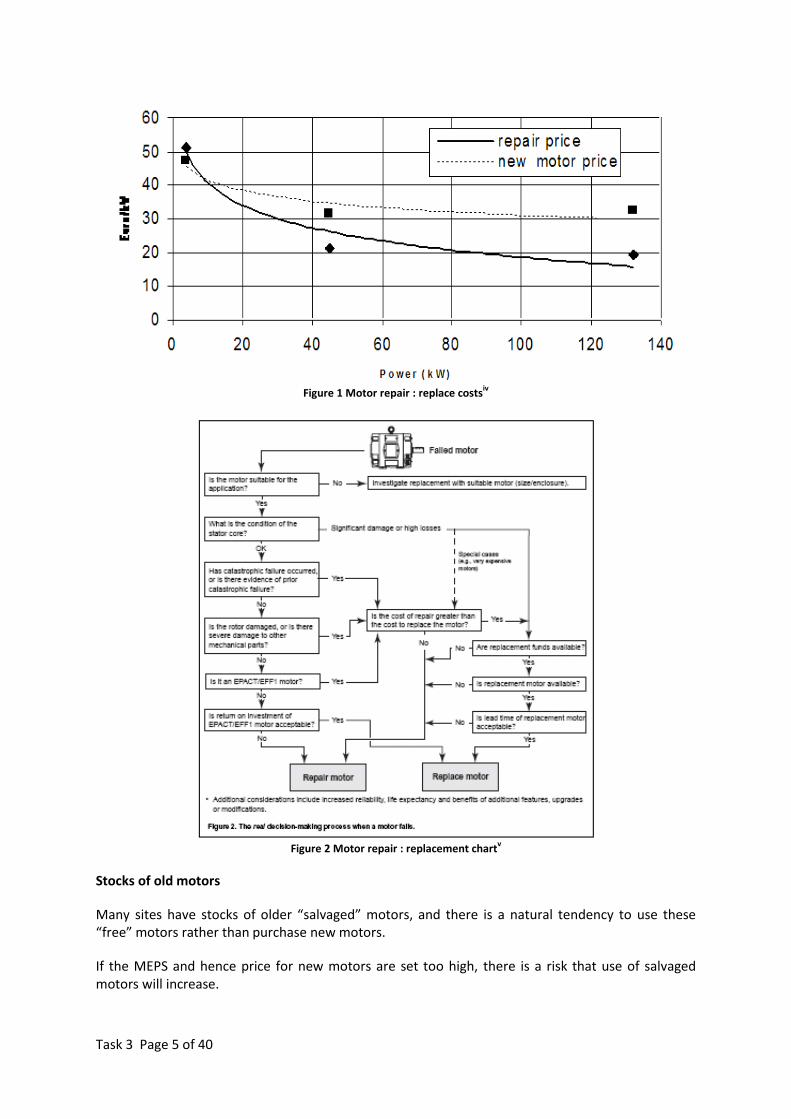
Task 3 Page 5 of 40
Figure 1 Motor repair : replace costs
iv
Figure 2 Motor repair : replacement chart
v
Stocks of old motors
Many sites have stocks of older “salvaged” motors, and there is a natural tendency to use these “free” motors rather than purchase new motors.
If the MEPS and hence price for new motors are set too high, there is a risk that use of salvaged motors will increase.

Task 3 Page 6 of 40
Deterioration with time
It is unusual for efficiency to decrease significantly over time. The exception is the build up of dirt on the body of the motor, fan or fan guard, which will effect cooling. Seal losses will decrease over the first 10’s of hours operation.
Part load efficiency
Historically, induction motors have been optimised for operation at 75% load, as this is close to the 60% loadingvi1 where they will on average spend most of their running time. In practice, this means that the efficiency is close to its peak from 50-100% load.
The shape of the efficiency vs load curve is a function of the ratio of iron to copper losses, and so is a parameter that can be controlled by the designer.
Sometimes, and for short periods, motors can be operated above 100% load. Over this point, a slight decrease in efficiency is observed. Typically, a service factor of 1.20 (this represents a 20% overload) is permitted, although prolonged operation at this power will decrease lifetime. Where there is adequate cooling, prolonged operation at higher loads is permitted, for example the motors used on some axial fans. Motors on some industrial packaged screw compressors are also used in their service zone during normal operation.
Figure 3 Motor Efficiency vs. Load (CAPIEL)
The figure above also shows how modern high efficiency motors have flat efficiency profiles, with smaller motors being almost flat in the 40-100% load range, and medium to large motors flat between 30-100% load. Above 100%, there will only be a gradual decrease in efficiency.
Nevertheless it should be noted that all international MEPS are based on efficiency at 100% load, but this does not reflect the average load. This is a discrepancy that might be considered later in the
1 A figure similar to this is cited by various authorities. For example SAFE refer to an average of 59-63% on a
survey of 75 motors in Switzerland, (submission to this study), and ABB in their submission agreed this value is reasonable.

Task 3 Page 7 of 40
study when reviewing policy options. The SEAD motor competition rules are suggesting a load weighted scheme that takes account of this issue, and is used in evaluating the energy losses of motors in Task 5 of this study. This is particularly pertinent given the growth of the VSD market.
Motor over-sizing
For various reasons the motor may be deliberately over-sized:
Lower running temperature to offer increased reliability
Higher starting torque
Ability to cope with future increases in load
Ability to operate under adverse electrical or environmental conditions
Gives additional margin for the system designer
But it is much more usual for the designer to err on the generous side, with the others in the procurement chain perhaps offering an additional margin of safety.
Manufacturers are aware of this impact, and so induction motors are commonly designed with a flat efficiency between 50-100%, often peaking at around the 75% load point. For induction motors, providing the load is at least 50%, then the efficiency is close to the rated efficiency. But below this point, the efficiency declines quickly.
However, since larger motors are inherently more efficient than smaller motors, over-sizing by one or two power ratings could yield a higher efficiency.
Packaged equipment is much more likely to run at close to full load, as the designer will know much more closely the load conditions.
Load Profiles
Many motors will operate at different loads at different times. The overall energy performance then depends on the time spent at each load, and the efficiency of the motor at this load.
Figure 4 Example of a load factor graph
vii

Task 3 Page 8 of 40
3.1.2 Dosage of auxiliary inputs during use
Motors require low amounts of auxiliary inputs during use, which are:
Periodic lubrication with grease, for larger motors only
When motors are repaired, all metal components can be recycled.
For induction motors, it is assumed that all induction motors ≥7.5kW have bearings replaced two times during their lifetime. It is also assumed that all motors < 7.5kW are recycled when they fail.
Brushed motors may need replacement brushes. For example, the brushes on older washing machines and some power tools.
3.1.3 Real Life energy considerations of Soft Starters
Soft Starters
Soft Starters enable motors to be started in a gradual way such that inrush current and any starting torque “shock” are reduced to safe levels. Modern soft starters are very sophisticated, but do not offer the variable speed control of a VSD. They are particularly popular in applications such as:
Where there is only a weak supply.
Where the load cannot withstand a sudden torque change, such as a conveyor.
Where the system cannot withstand a sudden change in speed, such as a pump system
where water hammer is a danger.
Where a smooth ramp up and/or down is required.
However, VSDs are preferred for applications requiring very frequent cycling.
Soft Starters - Internal losses
Their internal losses relate almost entirely to the voltage drop across the internal thyristors used for power control. In addition there will be some power used by the display, other electronics, and the cooling fan where fitted.
There will be a reduction in peak KVA demand at start up, but the motor will take longer to run up to operating speed, and so the energy saving (if any) is only small. A typical ramp up time is 5 – 15 seconds. The energy losses are calculated as (Loss/cycle x ramp up time x No starts pa) + (On-time x quiescent loss).
Soft starters and system efficiency
In addition, they have several aspects that effect system efficiency:
Voltage balancing: Out of balance phase voltage reduces motor efficiency dramatically. A soft starter can be used to balance voltages and hence reduce motor losses.
Bypass mode: Once up to speed, the thyristors can be bypassed by a contactor to reduce thyristor losses. If this is not done, there will be continuous internal losses.

Task 3 Page 9 of 40
Table 1 Allowable number of starts per hour for different size induction motorsviii
Load detection: Motors can be switched off when no load is detected for a set period of time. This reduces system energy consumption, for example, with escalators.
Voltage optimisation: For induction motors operating at low load, the soft-starter can reduce the output voltage to give a small energy saving. A threshold of 40%-50% load factor is typical of the load point above which no savings will be achieved, but is motor specific. (An alternative that is beneficial below about 40% load is running the motor permanently in star connection.)
kW 2-pole 4-pole 6-pole
Max
Starts/hr
Minimum off
time (sec)
Max
Starts/hr
Minimum off
time (sec)
Max
Starts/hr
Minimum off
time (sec)
1 15 75 30 38 34 33
5 8.1 83 16.3 42 18.4 37
10 6.2 92 12.5 46 14.2 41
15 5.4 100 10.7 46 12.1 44
20 4.8 100 9.6 55 10.9 48
50 3.4 145 6.8 72 7.7 64
75 2.9 180 5.8 90 6.6 79
100 2.6 220 5.2 110 5.9 97
200 2 600 4 300 4.8 268
250 1.8 1000 3.7 500 4.2 440

Task 3 Page 10 of 40
Figure 5 Energy savings by connecting low loaded motors in star
Factors where flex reduction might be more attractive, based on the iron losses being larger, include:
Lower load.
High supply voltage.
Lower efficiency motor.
Higher pole motor.
3.1.4 Real life energy considerations of VSDs.
Variable Speed Drives
The analysis here focuses on the PWM VSD, which currently dominates sales. Many of these can also be programmed to control other types of motor, which makes it much easier for the user to install and commission.
Energy Savings by the use of VSDs
VSDs can save large amounts of energy in many applications, especially some fan and pump systems. These savings are frequently many times larger than the savings from using a more efficient motor, but because the savings are so application dependent, it is hard to regulate for their use. However, the Extended Product Approach is an attempt to do just this, currently described best in the Europump draft Extended Product Approach description (see annex) The application of VSDs and how to estimate savings is described in IEC 60034-31: 2011, (vii) and many other commercial marketing publications.
Part load efficiency
in star- and delta connection for fixed speed applications
0
10
20
30
40
50
60
70
80
90
100
0% 10% 20% 30% 40% 50% 60% 70% 80% 90%
part of rated torque [%]
Eff
icie
ncy [
%]
Star-Connection
Delta-Connection

Task 3 Page 11 of 40
VSD – Control Strategies
There are two core control strategies when using a VSD:
Passive – where the speed is set on commissioning and rarely changed.
Active – where the speed is dynamically adjusted according to a feedback signal, (which would only rarely be speed itself.) VSDs mean that motor speed can be rapidly adjusted to follow fast changing load conditions.
The VSD will also give additional losses in ancillaries such as any filters or cooling devices that may be required. Although small, if energy savings are the objective of fitting a VSD, the system savings should considerably exceed the additional losses incurred when using a VSD.
It is noted that for pump and fan applications, where the energy savings are largest and response times not demanding, and where low speed operation is unusual, simple control systems are adequate. For high speed servo positioning systems and similar, more advanced controls are required. In some cases, cascade or voltage depression control strategies are appropriate.
VSDs – Internal power loss
From test work to date by the Study team, it is thought that above 10kVA, VSD internal losses are very similar. Below 10kVA, there is more variation between designs. This is thought to be due primarily to differences in the power transistors selected. Lower loss transistors will be more costly, but also give the benefit of requiring a smaller heatsink and hence more compact package. VSD volume is an important marketing factor, with compactness particularly important for cabinets containing control gear for many motors. Lower heat loss also reduces, or completely removes, the need for forced ventilation. It also improves the critical capacitor lifetime.
Technically the biggest opportunity for saving is through the use of very low loss power devices, such as Gallium Nitride.
Other losses include the display, other electronics, chokes, input bridge and fan (where used).
At low loads, the efficiency of the VSD decreases. At the time of writing this report, no scheme for giving an “efficiency index” based on losses over a typical load profile has been suggested, but work is being undertaken by various organisations that will influence this. These include:
BC Hydro (Pierre Angers)
Caltech (Andrew Baghurst)
IEA EMSA (Task C)
SEAD Motor competition
This load profile will give an Energy Efficiency Index (EEI) that is similar to that adopted for the Circulators (Lot 11 study), and will consider a representative selection of torque and speed points, weighted by typical times at those points.
There are several detailed considerations to take account of, including type and length of the motor cable, mains side filter specification and switching frequency. It is of note that the switching frequency is key in determining the losses in the motor and VSD.

Task 3 Page 12 of 40
IEC TC22X/123/CD is under development, and publishes target “good practice” efficiencies for the VSD. It is expected that by the time of the 2nd stakeholder meeting a methodology will have been proposed.
It has been suggested by one stakeholder that the cost of a comprehensive test of a motor + drive combination can be 10,000 to 30,000 euros.ix
Figure 6 Example of part load performance of an 11kW induction motor
x
If a VSD supplied motor is ever running at full speed, then a bypass contactor can be fitted, in which case the power losses are greatly reduced.
Voltage balancing
VSDs synthesise the motor voltage waveform, which will be precisely in phase and balanced, even if the incoming mains supply is not. This can give an additional energy saving advantage.
3.1.4.1 VSD Ancillary component losses
VSD losses comprise various elements which help differentiate performance between different products:
Switching frequency
Internal control algorithms
Filtering
Rectifier / inverter front end (for energy recovery)
The reason the total losses fall at high load is that the (current and hence torque dependent) losses in each element are at their maximum. At very low load, the fixed losses become more important, and although only small give a very low efficiency simply because the output power with which the losses are compared are so themselves so small.

Task 3 Page 13 of 40
In addition to the internal losses of the VSD itself, the use of a VSD will create additional losses in ancillary components:
Additional heating due to harmonic currents in the mains supply cable.
Additional heating due to harmonic currents in the motor supply cable.
Heating in any input or output filters used.
Energy used by any active cooling such as fans or air conditioning.
VSD and System Efficiency
The harmonic distortion in the motor waveform due to the inverter compared to the mains, leads to additional motor heating and hence de-rating. IEC60034-2-3 (draft) gives an indication of the change in losses of a motor when controlled by a VSD. Indicatively these are 10-15%.
The energy savings in motor systems due to the use of VSDs are widely acknowledged, shown below in Figure 3.6 as representing 50% of the total optimization potential in the average motor system. (This average energy saving is assumed in this study, but similar but different figures have been shown by different authors, reflecting the difficulty in gaining an overview of the potential on ALL motor systems.) Such variation can be addressed partly by later sensitivity analysis to understand the implications of variations in this figure. It should also be noted that VSDs may also be fitted for control rather than energy saving reasons.
Figure 7 The importance of better controls (mainly VSDs) in global motor system energy savings.
xi
Care will need to be taken to consider the inter-relationships between regulatory changes relating to the motor and those relating to the VSD to check that they are compatible.
3.1.5 Other types of motor
We will also be considering the following types of motor in the study. The duty considerations will be similar, although for motors selected on the basis of higher efficiency, they will be biased towards those applications with longer running hours.
Permanent Magnet motors
Switched Reluctance drives
Synchronous motors

Task 3 Page 14 of 40
Electronically commutated PM motors
Shaded pole
While some of these types may be offered as drop-in alternatives to conventional induction motors, their other characteristics may dictate the final selection. Of particular note is the efficiency vs. load profile.
Some types of motors may commonly be used at speeds higher than an induction motor, but there is currently no agreement on what speeds/ loads these motors should be tested at.
Motors with different speed:torque characteristics may allow the control of loads without the use transmission components, representing an additional energy saving.
3.2 End of Life behaviour
3.2.1 Economical Product Life (=in practice)
Motor lifetime is influenced by many factors including number of operating hours, load factor including possible overloading, frequency of start/stop cycles, power quality and environmental conditions (temperature, vibrations, humidity, chemical pollutions).
75% of induction motors fail due to worn bearings, with stator failure being the other major cause of failure.xii
The average life of AC induction motors (including repairs) varies according to the motor power and is shown below.
Table 2 Average life of induction motors, including repairsxiii
Power range Average life (years)
1.0 – 7.5 kW 12
7.5 – 75 kW 15
75 – 250 kW 20
Further, the life of small motors is assumed to be 10 years, and that of large motors > 250kW 20 years. However, it is noted that with quality maintenance and repair the lifetimes of large motors may be up to twice this.
Surveys of motor stock can give an apparent average age of motor beyond the actual average lifetime of motors used in that plant. This is because the history of motors that have already failed and been replaced will not be known. Figure 8 illustrates this well.xiv

Task 3 Page 15 of 40
Figure 8 Deviation of motors lifetimes from average lifetimes
It is assumed that Permanent Magnet and Switched Reluctance motors of the same rotational speed and load have similar lifetimes.
Universal motors rarely last more than 1,000 hours, due to their commutators and high rotational speeds. Small DC appliance motors will usually be disposed of rather than have brushgear replaced on failure. A maximum life time of 10,000 hours is assumed for these, with an average of 2,000 – 5,000 hoursxv.
3.2.1.1 Hand held portable tools
Motors used in portable tools for the DIY market will have an average design life of 5 years. The actual life varies widely with the usage, which will rarely be more than a few hours pa.
Similar tools for the professional market may only last 2 years, again depending on the use, dust, dirt and degradation they experience. The average “switch on” time is about 40 hours pa.xvi
3.2.1.2 Variable Speed Drive
For PWM VSDs, the DC-link electrolytic capacitor is the weak point determining the lifetime. The semiconductor output bridge is an important secondary source of failure. Both semiconductor and capacitor lifetime is highly temperature dependent, with heatsinking or forced cooling increasing life. The choice of capacitors with a lower internal resistance reduces self-heating, but there is a cost premium attached to this. Harmonic distortion of the mains supply will lead to additional capacitor ripple current and hence reduce the lifetime, and similarly additional harmonic distortion imposed on the mains by a VSD rectifier will impact other equipment on the supply phase.
Other converter types, such as DC phase angle controllers or matrix converters do not require these capacitors, and so should have a longer lifetime.
A VSD lifetime of 10 years is typical for smaller VSDs, but on larger units where the capacitors and cooling fans will be replaced, this may be extended to 25 yearsxvii.

Task 3 Page 16 of 40
3.2.1.3 Soft Starters
A soft starter is less complex and does not have electrolytic capacitors that can dry out. A typical design life may be just 10 years, but the life in practice may be up to 20 years, hence supporting this 15 year averagexviii, xix. A soft starter would not normally need to be repaired within the lifetime of the motor.
3.2.1.4 Motors
On average, a medium to large induction motor will be repaired twice during its life. Small motors will not be repaired unless they are very specialist, (see Fig 1).
Because of the need for speedy response times, most motors will be repaired by local repair shops. Transportation distances are therefore small.
For smaller products, especially integrated packages, the complete product may be returned to the supplier for repair. Alternatively a replacement component may be sent for the User to fit.
For many small products, when the motor fails, then it may be considered easier and more cost effective to replace the entire product.
Suggested repair transportation distances are shown in table 3:
Table 3 Transportation Distances for motors
Motor size range Repair transportation distance
Very small 0km (Not repaired)
Very large 200km round trip to specialist repairer
Small/medium motor 75km round trip to local repairer
Small handheld and transportable tools will not be transported for repair, instead the spares will be sent direct to the user.
For critical applications, spare motors will be kept on site to minimize the costs of downtime.
Table 4 Transportation distance for repair - VSDs
VSD size range Repair transportation distance
Small 0km (Replaced, notrepaired)
Medium 100km trip to specialist repairer
Large Repaired on site
A similar figure is assumed for Soft Starters. In practice, a soft starter will not need repairing during the lifetime of the motor it is controlling.

Task 3 Page 17 of 40
Best practice in facilities dismantling
Given the high value of the metals content of motors, it is considered that all motors will be dismantled and metal content re-used at end of life.2
The growing use of Permanent magnet motors could lead to the disassembly to recover the expensive permanent magnet material, rather than conventional separation techniques.
Transportable and portable power tools are generally exchanged at the end of their life, and the metals reclaimed.
Second hand market
Some motors and controls may be refurbished and sold to Developing Countries.
Some second hand products that include motors may be sold within the EU.
Best Practice in Sustainable Product Use.
The presumption at this stage is that the net environmental benefit of more efficient motors and the use of motor controllers means that using these products represents Sustainability Best Practice. This assertion will be tested in subsequent tasks.
The exception will be products with very low duties where the additional material content cannot justify the superior product. Many domestic products fall in to this category, for example DIY tools or domestic garage openers.
3.3 Local Infra-structure
This identifies and describes the barriers and opportunities relating to the local infra-structure. This includes consideration of energy, water, telecom, installation skills and physical environment.
2 Siemens is leading the German Government funded More (Motor Recycling) project that is examining in detail the recycling of materials from old motors. The consortium is focusing on permanent magnet materials. It is expected to report 2014.2 This project is taking various approaches to electric motor recycling: removal of the materials from scrap motors, repair and subsequent reuse of the electric motor or its components, and reuse of the materials and raw materials, and the rare earth metals, following their extraction from pre-sorted and shredded materials. Also being developed are concepts for a recycling-compatible motor design, as well as ecological efficiency analyses and models for material cycles. This will become an important reference work, but should not be refered to until completion, as without the detailed analysis the results might be misleading.

Task 3 Page 18 of 40
3.3.1 Electrical
The use of drive systems that reduce energy consumption may lead to a reduction in supply side electrical infrastructure and losses. The net effect depends on the balance of increase in losses due to harmonic distortion, and the reduction in power demand.
The use of controlled starting can greatly reduce the peak power demand seen during motor start-up. Even just changing from DOL to star delta starting can reduce the peak to just 1/3 of its original value, and with soft starter or VSD control the peak can be less. The distribution network will see reduced power demand on transformers, cables and other transmission components. This reduces the losses in these components. Where there are local capacity constraints, it may also offset the need for additional equipment.
Controlling the sequence of motor starting will spread the peak starting current of each motor, so reducing overall capacity requirements.
Improved power factor of motors, in particular through the use of VSDs, reduces the current in the cables from the distribution board to the motor. This reduces heating loss, and also reduces wear on any switchgear.
Conversely, if peak output of the motor is not reduced, then the additional harmonic load can require a stronger power supply. Even if the standby power consumption of a VSD is only low, large reactive capacitor charging currents can impose additional losses on the electrical supply.
Electrical power quality will also have an impact on motor losses:
Voltage imbalance. A 3.5% voltage imbalance will give an increase in motor losses of approximately 20%.xx As previously stated, a controller can re-balance the voltage phases.
Harmonic distortion. In addition, VSDs and other motor controls will impose a line-bourne distortion that will in turn impact other users. The use of filters to mitigate this effect is essential.
Voltage level. Motors must be designed for safe use over the entire voltage range. Low loaded induction motors will be most efficient at low voltage, and high loaded motors most efficient at high voltage. When loads right below 40% frequently occur and if the process requirements no other possibilities permit, additional measures to control the effective motor voltage should be considered. Efficient technical solutions are flux control by VSDs, voltage suppression by soft-starters or re-wiring to star connection in case of fixed speed applications, (figure 9).

Task 3 Page 19 of 40
Figure 9. Connection in star at low load
Figure 10 The impact of motor performance as a function of supply voltage, when subject to full load.
xxi
Part load efficiency
in star- and delta connection for fixed speed applications
0
10
20
30
40
50
60
70
80
90
100
0% 10% 20% 30% 40% 50% 60% 70% 80% 90%
part of rated torque [%]
Eff
icie
ncy [
%]
Star-Connection
Delta-Connection

Task 3 Page 20 of 40
3.3.2 Physical Environment
Controllers: Electronic controllers should be kept clear of dust and high temperatures, and isolated from any source of vibration. This can be hard to achieve in some applications without costly cubicles, filters and even air conditioning.
Motors: Higher ambient temperatures will give higher losses, principally through higher conductor resistance.
3.3.3 Appliances / Equipment in which motors are fitted
Products that include new types of motors may need minor re-design to accommodate different size or shaped motors. The shaft height and diameter are key parameters. The motor length and fixing hole pattern and diameter are also important.
Similarly, small differences in electrical or mechanical characteristics may require product re-design and re-certification. Parameters include starting torque, holding torque, inrush current, speed variation with load, duty cycle or operating temperature range.
3.4 Summary
Changes in the design of motors and use of controls has many impacts on the usage and hence duty patterns of motors. Of particular importance to this study are the following:
Motors operate at an average load of 60%. Part load performance is therefore very
important, and will vary between different types of motors. As previously noted, modern
high efficiency motors will have a fairly even efficiency between 40-110%.
Some types of motor can work at very high speeds or low torques, enabling system savings
through the omission of transmissions and their losses.
All controllers have internal energy losses, but when fitted in the right application the
system energy savings they enable is much greater. Care must be taken that any regulations
applying to products do not adversely impact possible system savings.
Correct motor system design and programming of VSDs is essential in order to maximize
system performance and minimize motor losses.
VSDs increase the losses in induction motors, and so care must be taken that any regulations
do not simply lead to the shifting of losses from the VSD to the motor or vice versa.
As motors become more efficient they become more expensive, so encouraging their repair
rather than replacement with more efficient types.
Motors are almost exclusively recycled, but research is in place to look at better ways to
reclaim valuable materials, in particular permanent magnets.
The transformation from the process requirements into a certain system structure and
control strategy and thus in a resulting load profile decides mainly about the energy
consumption of the application. Care must be taken that users and system designers are
aware of their possibilities and responsibilities.

Task 3 Page 21 of 40
Annex 1 : Europump Extended Product Approach description
EXTENDED PRODUCT APPROACH FOR PUMPS
A Europump Guide
8 April 2013
Draft version
Draft version
This working document for a future Europump guide on the Extended Product Approach is prepared by a subcommittee of the Europump Standards Commission. It has not been presented or discussed in the Europump Standards Commission or the joint working group for EuP/ErP and currently does not reflect the position of Europump.
Copyright © 2013 by Europump.
Published by Europump. All rights reserved.
No parts of this publication may be reproduced, stored in a retrieval system or transmitted in any form or by any means: electronic, electrostatic, magnetic tape, mechanical, photocopying, recording or otherwise, without permission in writing from the publisher.
Published by Europump
Diamant Building
Boulevard A. Reyers, 80
B-1030 Brussels
www.europump.org

Task 3 Page 22 of 40
Foreword
This working document is prepared by a subcommittee of the Europump Standards Commission which consists of the following members:
Dr. Niels Bidstrup, Grundfos
Mr. Markus Teepe, WILO
Mr. Gerhard Berge, KSB
Dr. Gerhard Ludwig, TU Darmstadt
The working document will serve as a communication tool towards the European Commission during the legal process concerning the ecodesign requirements based on the extended product approach (EPA) for pumps. At a later stage this working document will be elaborated into a Europump guide, as an aid for pump manufacturers and users to ensure compliance with the future regulation on the extended product approach (EPA) for pumps.

Task 3 Page 23 of 40
Table of Contents
1 Introduction ........................................................................................................................................ 24
1.1 Pumps in scope ........................................................................................................................... 25
1.2 Energy savings ............................................................................................................................. 25
2 Extended Product Approach for pumps ............................................................................................. 26
3 Load Profiles and reference control curves ........................................................................................ 27
3.1 Closed loop variable flow system ............................................................................................... 27
3.2 Open loop variable flow system ................................................................................................. 28
3.3 Constant flow system (open and closed loop) ............................................................................ 30
3.4 Relation between system types and pump types ....................................................................... 32
4 Methodology for calculation of EEI for extended products ................................................................ 33
4.1 Semi Analytical Models (SAMs) .................................................................................................. 34

Task 3 Page 24 of 40
1 Introduction
Europump’s answer to the ecodesign directive for pumps is based on three pillars as shown in Figure 11. The Product Approach focuses on the efficiency of the pump alone. The Extended Product Approach is focused on the extended product (pump, PDS, controls) and the System Approach focuses on optimising the pumping system. The purpose of this guide is to describe the methodology for future implementing measures (i.e labelling, legislation etc.) for extended pump products (EPs).
Figure 11 Europump Ecopump initiative
Figure 12 shows the difference between a Product Approach and an Extended Product Approach. Implementing measures based on a Product Approach take only the efficiency of the product into account, whereas the Extended Product Approach via the load profile and control method curve also takes the reductions in pump head into account.
Figure 12 Difference between a Product Approach and an Extended Product Approach
ecopump
The pump industry’s answer to the Ecodesign directive !
Product
(Pump)
ExtendedProduct
(Pump, PDS, Controls)
System
BEP
flow rate
pre
ssu
re
flow rate
pre
ssu
re
OverloadPartload
flow rate
pre
ssu
re
flow rate
pre
ssu
re
Product Approach Ext. Prod. ApproachLoad profile + Reference control curve
BEP

Task 3 Page 25 of 40
1.1 Pumps in scope
The Extended Product Approach (EPA) has already been applied for circulators and forms the basis for the ecodesign requirement for these products today [1].
Figure 13 shows the road map for ecodesign requirements for pumps.
Figure 13 Road map for energy efficiency regulation on pumps in EU
Ecodesign requirements based on extended products (EPs) are expected to be introduced during the next 5 years and the requirements will be based on an Energy Efficiency Index (EEI) as for circulators. The following pump products are expected to be targeted:
Water pumps as defined [2]
Booster systems (directly or indirectly)
Wastewater pumps as defined in (to be determined)…up to 150 kW?
Clean water pumps as defined in (to be determined)…up to 150 kW?
1.2 Energy savings
The main driver for the Extended Product Approach is the huge energy saving potential. Europump estimates that a marked transformation based on the EPA for water pumps in the scope of Commission Regulation 547/2012 only will lead to energy savings of 35 TWh per year, which is approximately ten times greater than the saving in 2020 achieved by the current regulation for water pumps.
En
erg
y e
ffic
ien
cy r
equ
irem
en
ts
20172009 2013 2014 2015 20162008 2010 2011 2012
Adoption/ Expected adoption
Energy efficiency requirements
Water pumps
EEI<0,27
EEI<0,23
MotorsIE2
CirculatorsIE3 or IE2+VSD*
MEI>0,1MEI>0,4
EP (EEI<xx)
Wastewater pumps
Clean water pumps
IE3 or IE2+VSD
2018
*Increased scope
EP (EEI<yy)
EP (EEI<zz)
Expected future requirements

Task 3 Page 26 of 40
2 Extended Product Approach for pumps
It is important to distinguish between the Extended Product Approach (EPA) and the Extended Product (EP).
Extended Product Approach (EPA): a methodology to calculate the Energy Efficiency Index (EEI) of an Extended Product (EP), which incorporates load profiles and control method.
Extended Product (EP): consists of physical components
The EPA is a methodology or procedure which can be used to qualify an extended product for a certain efficiency level, whereas the EP is the actual product. This is shown graphically in Figure 14.
Figure 14 Definition of Extended Product Approach
Extended pump products are placed on the market as integrated units i.e. a pump, a motor with or without VSD which is supplied by one manufacturer as a complete unit. They are also placed on the market as separated units i.e. where the pump, motor and VSD are separate products supplied by one or more manufacturers. The EPA must be able to handle both integrated and separated extended pump products.
This leads to the following general definition for an extended pump product
This definition is valid for all extended pump products in the scope, including circulators. The speed control is based on a system feedback which can come from sensors in the system or in the pump or from sensorless feedback transmitted by the motor.
Terminal box,
or
VSD
Mains
EuP/ErP – Pumps
MEI
EuP/ErP - Electric Motors
IEX
PumpPump
Coupling
Fluid
Inlet
Fluid
Outlet
Electric
Motor
Electric
Motor
Pump
Extended Product Approach
EEI
Pu
mp
Extended Product
Extended pump product means a pump driven by an electric motor with or without a variable speed drive (VSD)

Task 3 Page 27 of 40
3 Load Profiles and reference control curves
Extended pump products are used in a variety of applications with different load profiles and control methods. For the purpose of the EPA methodology these load profiles and control methods are grouped into the following:
Closed loop systems or open loop systems
Constant flow systems or variable flow systems
When combined they cover all applications in the scope.
3.1 Closed loop variable flow system In a closed loop system the purpose of the pumps is to produce enough head to overcome friction losses in the system
losses in the system and satisfy the requirement for actuators (valves etc.). A typical closed system is a hydronic a hydronic distribution system of a heating and/or air conditioning system (HVAC-system). The purpose of these pumps
purpose of these pumps is to distribute energy from the energy supply (boiler, chiller etc.) to the emission systems emission systems (radiator, coils, air handling units etc.) by circulating a pumped media. The load profile for these
profile for these systems is shown in ~
Table 5.
~
Table 5 Load profile for closed loop variable flow systems
At part load the pump head can be reduced due to reduction in friction losses in the system. The control method must take that into account. Figure 15 shows the load points from Table 5 and the reference control curve as defined for these systems (green line).
Flow
[%]
Time
[%]
L1 100 6
L2 75 15
L3 50 35
L4 25 44

Task 3 Page 28 of 40
Figure 15 Load points and control curve for closed loop variable flow systems
The EEI calculation of all pumps (fixed speed or variable speed) used in closed loop variable flow systems will be evaluated according to this reference control curve and load profile.
3.2 Open loop variable flow system
Pumps in open loop variable flow systems must deliver a certain static pressure and, in addition, enough head to overcome friction losses in the system. A typical open loop variable flow system is a water distribution system in cities and buildings. A load profile for these systems is shown in Table 6.
H
Q
L1
L2
3LL4
P1
Q
Q
H
3L
L2
L1
L4
P1
Q
Fixed speed pump Variable speed pump

Task 3 Page 29 of 40
Table 6 Load profile for open loop variable flow systems
At part load the pump head can also be reduced in these systems due to reduction in friction losses and the control method must take that into account. Figure 16 shows the load points from Table 6 and the reference control curve as defined for these systems (green line).
Flow
[%]
Time
[%]
L1 100 1
L2 90 2
L3 80 3
L4 70 4
L5 60 6
L6 50 12
L7 40 19
L8 30 26
L9 20 21
L10 10 6

Task 3 Page 30 of 40
Figure 16 Load points and control curve for open loop variable flow systems
The EEI calculation of all pumps (fixed speed or variable speed) used in open loop variable flow systems will be evaluated according to this reference control curve and load profile.
3.3 Constant flow system (open and closed loop)
In a constant flow system the pump must overcome a certain static pressure in an open loop system or overcome a certain friction loss in a closed system which is designed to give a certain constant flow. A typical application of an open loop constant flow system is where the purpose of the pump is to move liquid from one reservoir to another. A typical example of a closed loop system could be a boiler feed pump. In a real system the flow is very seldom constant. For example it will vary due to the level of the reservoirs etc. Therefore it makes sense to define a load profile with a load point around the best efficiency point. Such a load profile is shown in Table 7.
H
Q
L1
L2
P1
Q

Task 3 Page 31 of 40
Table 7 Load profile for constant flow systems (open and closed loop)
These are the same load points as those used for MEI calculation for water pumps, where a time profile has been added.
Figure 17 shows the load points listed in Table 6. In these systems variable speed is not a benefit and no reference control curve is defined.
Figure 17 Load points constant flow systems (open and closed loop)
The EEI calculation of all pumps (fixed speed or variable speed) used in constant flow systems (open loop and closed loop) will be evaluated according to this load profile.
Flow
[%]
Time
[%]
L1 110 25
L2 100 50
L3 75 25
Q
H
1L
L3
L2
P1
Q

Task 3 Page 32 of 40
3.4 Relation between system types and pump types
There is no one-to-one mapping between system types and pump types. Some pump types are used in different systems. Table 8 show the relation between system types and pump types.
Table 8 System type vs. pump type
Pump type
Relation to EuP/ErP
System type
Variable flow Constant flow
Closed loop Open Loop Closed and open loop
Circulators Lot 11 X
ESCCI Lot 11 X O O
ESOB Lot 11 X X X
ESCC Lot 11 X X X
MS Lot 11 O X O
MSS Lot 11 O O X
Wastewater pumps Lot 28 O O X
Clean water pumps Lot 29
(except Lot 11 pump types)
O O X
For pump types used in more than one system type, more than one EEI value will be calculated. The product information requirements must ensure that the EEI is calculated and documented for all the entries in the table marked with an ‘X’. Calculation and documentation of an EEI are optional for the entries marked with an ‘O’ in the table.
The energy efficiency requirements must specify that when putting an extended product into service, the energy efficiency requirements (in terms of EEI) for a particular pump type used in a particular system type must be met.

Task 3 Page 33 of 40
4 Methodology for calculation of EEI for extended products
The Energy Efficiency Index (EEI) is based on the same methodology as for circulators. Basically it consists of an average power input calculated on a load-time profile divided by a reference power input.
Figure 18 shows how the power in an extended product is defined. P1 is the electrical power input from the grid. P2 is the mechanical power from the motor shaft. Phydr is the hydraulic power produced by the pump.
Figure 18 Definition of Powers in an extended pump product. The combined motor and CDM (VSD) is referred to as a Power Drive System (PDS)
A graphical presentation of the EEI calculation is shown in Figure 19. The left side shows the calculation of average power input i.e. the numerator of the EEI index. The right side shows how to calculate the reference power i.e. the denominator of the EEI index.
Figure 19 Graphical presentation of the EEI calculation
The power input values P1,I in Figure 19 can be measured, but this is not possible in most cases especially not for separated units. The P1,I values will then be calculated from Semi Analytical Models as described in the next section.
The reference power input based on actual efficiency of the pump as defined in the EC regulation for water pumps [2] and later on for the other pump types in the scope in Lot 28 and Lot 29. Based on
CDMMotorPump

Task 3 Page 34 of 40
actual measurements of the pump, the head and the flow, the best efficiency point (H100%, Q100%) is determined and from that the specific speed (ns) is calculated. Based on the hydraulic power and the efficiency, the reference shaft power P2,ref is calculated, which can via the IEC 600034-30 for motors be converted onto a reference power input. The reference efficiency of the VSD is set to 100% by definition. The actual efficiency of the specific VSD is captured by the power input values P1,I as is the case for pump and motor.
4.1 Semi Analytical Models (SAMs)
A methodology for an extended pump product cannot be based on measurement only although this is an option, which can be applied in some cases.
Separated extended pump products are in many cases built on site, which makes a determination of EEI based on measurements of the extended product impossible. Therefore a methodology based on Semi Analytical Models (SAMs) has been developed to overcome this problem [3].
A SAM is a model which is based on measurement combined with physical and empirical knowledge of the product. Based on SAMs of the pump, motor and VSD it is possible to calculate the EEI of the extended product based on a few measurement points (supporting points) of the individual products (pump, motor and VSD).
Figure 20 Flow chart for calculating EEI of an Extended Pump Product
Based on the SAM for the pumps, the torque and rotational speed at the part load point is calculated.
Based on SAMs of the Power Drive System (PDS) the power losses at these part load point can be calculated and used to determine the power input to the extended product.

Task 3 Page 35 of 40
The SAM for the PDS is decribed in [4]. Figure 21 shows the eight load points which are defined in this standard. These eight points are chosen to cover all PDS applications.
Figure 21 Related losses of a PDS at different part load points (Source: [4])
Figure 22 shows the three supporting points for pump applications. All pump applications in the scope will be within the green shaded area.
Figure 22 Three points of related losses and shaded area of interest for pump manufacturers when calculating the EEI (Energy Efficiency Index) of a pump unit (Source: [4])
The actual losses will be based on interpolation based on these supporting points. Part One of the PDS standard [5] will cover the generic application of the standard for extended products. A specific measurements standard must be written for all products. A draft standard for pumps is already under development.
RM relative
torque / %
RM relative
speed / %
25
100
50 100
p L, RM (0;100) p L, RM (50; 100) pL, RM (100; 100)
50
p L, RM (0; 50) p L, RM (50; 50) p L, RM (100; 50)
p L, RM (0; 25) p L, RM (50; 25)
PDS relative
torque / %
PDS relative
speed / %
25
100
50 100
pL, RPDS (100; 100)
50p L, RPDS (100; 50)
pL, RPDS (50; 25)
Area of Torque-Speed range relevantfor determining the EEI of a pump unit

Task 3 Page 36 of 40
Bibliography
[1] Commission Regulation 641/2009 (EC), Brussels: European Commission, 2009.
[2] Commission Regulation 547/2012 (EU), Brussels: European Commission, 2012.
[3] B. Stoffel, Semi Analytical Models SAM's for Pumps, Technical University of Darmstadt, 2013.
[4] prEN 50589-2 Energy efficiency indicators for power drive systems and motor starters, CENELEC, 20xx.
[5] prEN 50589-1 Procedure for determining the energy efficiency indicators or motor driven applications by using the extended product approach and semi analytical model, CENELEC, 20xx.

Task 3 Page 37 of 40
References
i Submission by ABB, 30 Sept 2012.
ii Submission by Kone cranes, 2012.
iii ANSI/EASA AR100-2010: Recommended Practice for the Repair of Rotating Electrical Apparatus.
iv EUP Lot 11 Preparatory study, 2008. P.59.
v The Effect of Repair/Replacement on Motor Efficiency, AEMT/EASA.
vi SAVE motor studies.
vii IEC 60034-31: 2011, Rotating electrical machines -Part 31: Selection of energy-efficient motors including variable speed applications - Application guide, Fig 13.
viii Baker Instrument Co, USA.
ix Gambica.
x Based on data from Pierre Angers, presented at Motor Summit 2010.
xi Walking the Torque, IEA, Falkner and Holt, 2011.
xii EUP Lot 11 Preparatory study, 2008.
xiii EUP Lot 11 Preparatory study, 2008. (1.0 – 250kW only from this reference, other lifetimes are estimates only)
xiv Electric Motor Performance Data. Analysis of the database of the financial incentive program Easy. SAFE Topmotors, Zurich 2 October 2012.
xv EUP Lot 11 Preparatory study, 2008. Section 3.4.
xvi Written submission from The European Power Tool Association, August 2012..
xvii This is in line with submission from ABB, September 2012.
xviii Written submission from Gambica.
xix Submission from Fairford Electronics, September 2012.
xx IEC 60034-31: 2011, Rotating electrical : Selection of energy-efficient motors including variable speed applications - Application guide, section 8.4.
xxi IEC 60034-31: 2011, Rotating electrical machines -Part 31: Selection of energy-efficient motors including variable speed applications - Application guide, Fig 9.

EuP Lot 30: Electric Motors and Drives
Task 4: Technical analysis existing products
ENER/C3/413-2010
Final
June 2014
Anibal De Almeida
Hugh Falkner
João Fong
This document has been prepared for the European Commission however it reflects the views only of the authors, and the Commission cannot be held responsible for any use which may be made of the information contained therein.
ISR – University of Coimbra

2
Contents
4 Introduction .......................................................................................................................... 3
4.1 Production Phase .......................................................................................................... 4
4.2 Distribution Phase ......................................................................................................... 7
4.3 Use Phase ...................................................................................................................... 7
4.4 Motor system electricity use ......................................................................................... 8
4.4.1 Power Supply Quality .......................................................................................... 13
4.4.2 Distribution Network ........................................................................................... 14
4.4.3 Motor oversizing ................................................................................................. 15
4.4.4 Transmission System ........................................................................................... 17
4.5 End-of-life phase ......................................................................................................... 19

3
4 Introduction
This section entails a general technical analysis of current products, as defined in section 1, and provides general inputs for the definition of the BaseCases. The BaseCases need to be representative of the whole spectrum of products for each category as defined in subtask 1.1, both in terms of design features and size. This is necessary so that the outputs from the EcoReport tool for single products can be extended to be representative of the entire range of sizes and styles of that sub-type. The BaseCase is the reference point for further improvements, and should therefore ideally represent the average new EU product.
For the purpose of this study, the following BaseCases for motors will be analysed, divided into three major categories according to output power:
For Small motors in the power range of 120 W to 750 W, two BaseCases will be considered:
BaseCase 1 – 1-Phase Induction Motor (IM), 370 W, IE1
BaseCase 2 – 3-Phase Induction Motor (IM), 370 W, IE1
Medium motors in the power range of 0.75 kW to 375 kW
BaseCase 3 –1-Phase IM, 1,1 kW – IE2
BaseCase 4 – 3-Phase IM, 1,1 kW – IE2
BaseCase 5 – 3-Phase IM, 11 kW – IE2
BaseCase 6 – 3-Phase IM, 110 kW – IE2
Large motors in the power range above 375 kW, up to 1000 kW.
BaseCase 7 – 3-Phase IM, 560 kW LV, IE2 BaseCase 8 – 3-Phase IM 560 kW MV (6600V), IE2 The efficiency levels for all of the above motors are based on IEC 60034-30-1 standard. All of the BaseCase motors are 4-pole motors. Two additional BaseCases will also be considered for submersible motors. Submersible Motors are a separable part of the Multistage submersible borehole pumps considered in Lot29. The analysis of these is within LOT30 so that the analysis is done on the same basis as other motors, but the results of this analysis will be highly relevant to LOT29. Motor Controllers For the analysis of Variable Speed Drives (VSDs) one additional BaseCase will be considered for all of the above motor powers, when coupled with a VSD. Three BaseCases will also be considered, on a first approach, for Soft-Starters coupled to 1.1 kW, 11kW and 110 kW motors for the evaluation of the environmental impact of such equipment.

4
4.1 Production Phase
The material composition of electric motor BaseCases is presented in the following Bill-of-Materials (BoMs).
The material fractions of motors are derived from data provided from CEMEP1 for this and the previous Lot 11 study. For Soft-Starters, the material fractions were provided by CAPIEL.
Small Motors
Table 4-1 shows the material fractions used in a single-phase induction motor of 370 W (BaseCase 1) and a three-phase induction motor of the same output power (BaseCase 2), both of IE1 efficiency levels.
Table 4-1 Bill-of-Materials for Small Motors, Basecases (370 W IE1) Source: CEMEP
Materials Number of Phases
1-Phase 3-Phases
Electrical steel (kg/kW) 12,5 10,5
Other steel (kg/kW) 3,0 2,1
Cast iron (kg/kW) 0- 3,5 0-3,0
Aluminium (kg/kW) 4,0 3,6
Copper (kg/kW) 2,3 1,9
Insulation material (kg/kW) 0,06 0,06
Packing material (kg/kW) 2,0 2,0
Impregnation resin (kg/kW) 0,4 0,4
Paint (kg/kW) 0,12 0,12
Medium Motors
Table 4-2 shows the material fractions of three IE2, four poles, three-phase induction motors of 1,1 kW, 11 kW and 110kW.
Table 4-2 Bill-of-Materials for Medium Motors, Basecases
Materials Motor Rated Power
1,1 kW 11 kW 110 kW
Electrical steel (kg/kW) 8 4,8 3,6
Other steel (kg/kW) 1,6 1 0,7
Cast iron (kg/kW) 2,5 (0,0 - 5,0) 1 (0,0 - 2,0) 3
Aluminium (kg/kW) 0,5 - 4,0 0,25 - 1,8 0,2
Copper (kg/kW) 1,9 0,9 0,6
Insulation material (kg/kW) 0,05 0,02 0,01
Packing material (kg/kW) 1 0,9 0,5
Impregnation resin (kg/kW) 0,3 0,1 0,05
Paint (kg/kW) 0,1 0,05 0,01
Large Motors
1 CEMEP - Comité Européen de Constructeurs de Machines Electriques et d'Electronique de Puissance
(European Committee of Manufacturers of Electrical Machines and Power Electronics).

5
Table 4-3 shows the material fractions of two IE2, 560 kW, 4-poles, induction motor, one low-voltage and on medium-voltage.
Table 4-3 Bill-of-Materials for Large Motors, Basecases, 560 kW Source: CEMEP
Materials Voltage
Low Voltage Medium Voltage
Electrical steel (kg/kW) 3,2 3,2
Other steel (kg/kW) 0,4 0,9
Cast iron (kg/kW) 1,8 2,0
Aluminium (kg/kW) 0,1 0,01
Copper (kg/kW) 0,4 0,6
Insulation material (kg/kW) 0,03 0,2
Packing material (kg/kW) 0,1 0,15
Impregnation resin (kg/kW) 0,03 0,03
Paint (kg/kW) 0,02 0,02
Other (plastic terminals, etc.) 0,02 0,03
A motor design is the balance of different parameters. Therefore the material fractions presented here are only an average value. Depending on the motor design and the steps in lamination diameter, the single value of each different material can deviate from the average value by approximately +/- 40 %.
A major factor in the balance of different parameters is the usage of cast iron or aluminium for the motor case. Therefore, these two materials have got a wide range of values. Their average value is used in the analysis of the BaseCase models and BAT.
Submersible Pump Motors
Although these only enjoy a small niche, submersible pump motors are considered here because this data may be useful in support of possible Lot 29 regulations on submersible borehole pumps.
These specialist motors are designed specifically for connection to submersible borehole pumps, and come in several fixed diameters to match the borehole size. There is also a standard NEMA flange to connect the motor to the pump. They use 2 pole induction motors, and may be of greatly varying length depending on the required power.
They are available as interchangeable “off the shelf” products, which means that it might technically be possible to apply measures relating to their environmental performance.
The market was first developed by Franklin motors, with some companies buying from this or other manufacturers, and others building their own. Larger motors may be hand wound, which enables a higher efficiency through tighter windings.
Evidence so far is that the volume produced motors have very similar efficiencies to each other, and that there are few imports from outside Europe.

6
Figure 1 Examples of Submersible borehole pump motors (Franklin)
Variable Speed Drives
Table 4-4 shows the material fractions of VSD for each of the BaseCase powers considered.
Table 4-4 Bill-of-Materials for VSDs
Materials Rated Power
0,37 kW 1.1 kW 11 kW 110 kW 560 kW
Steel (kg/kW) - 0,5 0,16 0,05 0,045
Aluminium (kg/kW) 1,3 1 0,22 0,01 0,009
PVC Plastic (kg/kW) 0,4 0,3 0,05 0,03 0,027
PWB (kg/kW) 0,26 0,2 0,03 0,01 0,009
Electronics small (SMD, IC,...) (kg/kW) 0,26 0,2 0,07 0,04 0,036
Electronics big (IGBT, Thyristors,...) (kg/kW) 0,065 0,05 0,02 0,03 0,027

7
Soft-Starters
Table 4-5 shows the material fractions of VSD for each of the BaseCase powers considered.
Table 4-5 Bill-of-Materials for Soft-Starters Source: CAPIEL
Materials Rated Power
1.1 kW 11 kW 110 kW
Steel (kg/kW) 0,020 0,005 0,011
Aluminium (kg/kW) 0,067 0,018 0,023
PVC Plastic (kg/kW) 0,120 0,015 0,015
PWB (kg/kW) 0,053 0,018 0,002
Electronics small (SMD, IC,...) (kg/kW) 0,033 0,009 0,002
Electronics big (IGBT, Thyristors,...) (kg/kW) 0,013 0,003 0,005
Copper (kg/kW) 0,080 0,003 0,010
4.2 Distribution Phase
The average volume of the packaged products for each power level is considered in the analysis of the BaseCase models.
Table 4-6 Average volume of packaged products
Volume (m3)
Rated Power
0,37 kW 1.1 kW 11 kW 110 kW 560 kW
LV 560 kW
MV
Motor 0,02 0,02 0,15 1,1 3 6
VSD - - - - - -
Soft-Starter 0,000664 0,000686 0,00594
4.3 Use Phase
Electric motors convert electrical energy into mechanical energy, therefore, the only energy consumed by the motor is due to the losses during this conversion. The ratio of mechanical output power to electrical input power gives the motor efficiency.
Tables 4-6 to 4-8 show the efficiency levels considered to be the average efficiency levels of the products coming into the market today. For medium motors the IE3 level is considered as it will be the mandatory efficiency level in 2015. The efficiency levels considered are based on IEC 60034-30-1.

8
Table 4-7 Basecase Efficiency – Small motors (0,37 kW) IE1
Motor Efficiency Number of Phases
1-Phase 3-Phases
Small Motor 66 66
Table 4-8 Basecase Efficiency – Medium motors IE2
Motor Efficiency Motor Rated Power
1,1 kW 11 kW 110 kW
Medium Motors 81,4 89,8 94,5
Typically, large motors above 750 kW have customized design for very specific industrial applications and are often produced according to specific requirements of the purchaser. Because of their large power and, in general, of their high number of operating hours, translating into high running costs, particular attention to efficiency is given by purchasers. Therefore, these motors tend to be specified to have high efficiency levels. For this study, it is assumed that the average motor in this power range is of IE2 efficiency level.
Table 4-9 Basecase Efficiency – Large motors (560 kW) IE2
Motor Efficiency Voltage
Low Voltage Medium Voltage
Large Motors 95,1 96,6
Medium voltage motors avoid the need to have a transformer for voltage reduction, which translates into lower net losses, and also have lower cable losses. Therefore their efficiency is considered to be slightly higher than that of LV motors.
Borehole pump motors
For each borehole size, there is a range of motor sizes that can be accommodated. There is some overlap between ranges, but in general a particular power rating will be made only for a particular diameter borehole.

9
Figure 2 Efficiencies of typical submersible borehole pump motors (400V supply)
The unusual length to width and the differing cooling mechanism means that these motors are inherently less efficient than conventional induction motors, (figure 3 below). This also shows that the IE scheme curves would not be appropriate, due to the efficiency relative to the IE curves becoming worse with size.
4" 6" 8" 10" 12" IE1 IE2 IE3
0.37 66
0.55 68
0.75 70 72.1 77.4 80.7
1.1 74
1.5 73
2.2 75
3 76
4 78
5.5 79
7.5 79
9.3 81
11 81
15 81 88.7 90.3 91.9
18.5 82
22 83
30 86
37 87
45 87
55 88
75 87
85 85
93 87
110 88 86 93.3 94.3 95.2
130 88 88
150 88 87
185 88 87
220 88
250 88
300 88
350 87 94.6 95.6 96.3
400 90
Motor diameter (Inches) Motor IE RatingsPower
(kW)

10
Figure 3 Efficiency of submersible borehole pump motors compared with the IE scheme values for conventional induction motors
Variable Speed Drives
Losses in VSDs occur within their control circuits (motor control, network connection, Input/Output (I/Os), logic controllers etc.), particularly in the output-switches (30-50%).
VSD losses are mainly influenced by the switching frequency and the output current (which is function of output power and load).
Table 4-10 Loss distribution for low-voltage VSDs [1]
Typical percent of losses for passive front-end converters
Factors affecting these losses
Switching losses
(output stage)
30 to 50
Motor-current and switching-frequency.
Line-rectifier 20 to 25 losses Line-current
(nearly proportional to motor power).
Forward losses (output stage) 15 to 20 Motor current.
Internal control circuit 5 to 20 Nearly constant.
0
20
40
60
80
100
120
0,1 1 10 100 1000
Effi
cie
ncy
(%
)
Power kW
Motor diameter (Inches) 4"
Motor diameter (Inches) 6"
Motor diameter (Inches) 8"
Motor diameter (Inches) 10"
Motor diameter (Inches) 12"
Motor IE Ratings IE1
Motor IE Ratings IE2
Motor IE Ratings IE3

11
Losses (microcontroller, internal power supply, display,
keyboard, buscommunication,
digital and analogue ins/outs…)
Switching losses (line-side converter / active front-end only)
- Line-current and switching-frequency
(nearly proportional to motor power).
Compound losses (line-side converter / active front-end only)
- Line-current
(nearly proportional to motor power).
The full load efficiency of a VSD is typically around 96%, decreasing with partial load.
Figure 4-4 37 kW VSD efficiency [2]
Five basecases are considered for motor+VSD based on the motor powers for the motor alone Basecases.
Table 4-11 Losses relative to the apparent VSD output power (BaseCase Powers) [3]
% Size Speed 0% 50% 90%
VSD kW Torque 25% 50% 100% 25% 50% 100% 50% 100%
Very small 0.37 14.77% 14.82% 15.29% 14.87% 15.02% 15.82% 15.37% 16.84%
Small 1.1 6.86% 7.13% 7.82% 6.93% 7.33% 8.40% 7.68% 9.51%
Medium 11 2.39% 2.68% 3.61% 2.46% 2.87% 4.23% 3.20% 5.43%
Large 110 1.24% 1.48% 2.27% 1.32% 1.68% 2.91% 2.02% 4.11%
Very Large 560 1.15% 1.40% 2.22% 1.22% 1.60% 2.86% 1.93% 4.08%

12
Soft Starters
The estimation of the soft-starter’s power consumption is presented in the next table, for each of the power ranges considered, including electronic, possible auxiliaries and fans.
Table 4-12 Soft-Starters – Power consumption Source: CAPIEL
Soft-Starter losses, for 2-phase and 3-phase controlled soft-starters, typical cycle time and number of cycles per hour are presented in the next table.
Table 4-13 Typical operating parameters for soft-starters Source: CAPIEL
Description Power Range
corresponding to basecase
Basecase Size (kW)
Loss/cycle W
Cycle time secs
No. starts /hour
Soft Starter - Small 0.25 - 7.5kW 1,1 2-phase: 1,3 3-phase: 1,9 90 40
Soft Starter - Medium 7.5 - 75kW 11 2-phase: 8,6
3-phase: 12,9 180 20
Soft Starter - Large 75 - 750kW 110 2-phase: 52,4 3-phase: 78,7 900 4
4.4 Motor system electricity use
The efficiency of a motor driven process depends upon several factors which may include:
Motor efficiency
Motor speed controls
Power supply quality
System oversizing
Distribution network
Mechanical transmission
Maintenance practices
Load management and cycling
Efficiency of the end-use device (e.g. fan, pump, etc.)
Description Power Range
corresponding to basecase
Basecase Size (kW)
Power (running)
W
Soft Starter - Small 0.25 - 7.5kW 1,1 5
Soft Starter - Medium 7.5 - 75kW 11 10
Soft Starter - Large 75 - 750kW 110 30

13
Figure 4-5 Motor system efficiency
It must be emphasised that the design of the process itself can also influence to a large extent the global efficiency of the system (units produced/kWh).
A number of important but often overlooked factors which may affect the overall motor system efficiency include: power supply quality (high-quality power supply), careful attention to harmonics, system oversizing (proper equipment sizing), the distribution network that feeds the motor (attention to power factor and distribution losses), the transmission and mechanical components (optimised transmission systems), maintenance practices (careful maintenance of the entire drivepower system) and the match between the load and the motor (good load management practice).
4.4.1 Power Supply Quality
Electric motors, and in particular induction motors, are designed to operate with optimal performance, when fed by symmetrical 3-phase sinusoidal waveforms with the nominal voltage value. Deviations from these ideal conditions may cause significant deterioration of the motor efficiency and lifetime. Such deviations include:
Voltage Unbalance
Voltage unbalance wastes energy: it leads to high current unbalance which in turn leads to high losses. A phase unbalance of just 2% can increase losses by 25%. Additionally, long operation under unbalanced voltage can damage or destroy a motor (that is why many designers include phase unbalance and phase failure protection in motor starters). Another negative consequence of unbalance is the reduction of the motor torque.

14
Figure 4-6 Effect of voltage unbalance on motor rating
VSD´s can accept a voltage unbalance of typically up to 3% without remark-able decrease of
efficiency, while the connected motor will still run with balanced voltage.
Undervoltage or Overvoltage
When the motor is running at or nearly full load, voltage fluctuations exceeding 10% can decrease motor efficiency, power factor and lifetime.
Harmonics
Under ideal operating conditions, utilities supply pure sinusoidal waveforms (50 Hz frequency in Europe). However there are some loads, namely VSDs and other power electronic devices, arc furnaces, saturated magnetic cores (transformers, reactors), TVs and computers that cause voltage distortion. The resulting distorted waveform contains a series of sine waves with frequencies that are multiples of the fundamental 50 Hz frequency, the so called harmonics.
Harmonics increase the motor losses and noise; reduce torque, and cause torque pulsation and overheating. Vibration and heat can shorten the motor life, by damaging bearings and insulation. Harmonics can cause malfunctions in electronic equipment, including computers, induce errors in electric meters ( one study sponsored by Electric Power Research Institute (EPRI) found measurement errors ranging from +5,9% to -0,8% in meters subjected to harmonics from VSDs), produce radio frequency static and destroy power system components.
4.4.2 Distribution Network
There are substantial losses through the distribution network from the substation to the loads. These losses can be reduced by proper selection and operation of efficient transformers, by correctly sizing the distribution cables and by correcting the power factor. In large industries it is also common to use a high distribution voltage to reduce the losses.
Transformers
Distribution transformers normally operate above 95% efficiency, unless they are old or are operating at very light load. Old, inefficient transformers should be replaced by new models that are more efficient. It is more efficient to run only one transformer at full load than to run two transformers at light load.
Cable Sizing
The currents supplied to the motors in any given installation will produce losses (of the I2R type) in the distribution cables and transformers of the consumer. Correct sizing of the cables will not only allow a cost-effective minimisation of those losses, but also helps to decrease the voltage drop between the transformer and the motor. The use of the standard national codes for sizing conductors leads to cable sizes that prevent overheating and allow adequate starting current to the motors, but can be far from being an energy efficient design. Ideally the cables should be sized not only taking into consideration the national codes, but also considering the life-cycle cost.

15
In general, in new installations it is cost-effective to install a larger cable than that required by code, if the larger cable can be installed without increasing the size of the conduit, the motors operate at or near full load, and the system operate a large number of hours per year.
Power Factor Compensation
A poor power factor means higher losses in the cables and transformers, reduced available capacity of transformers, circuit breakers, and cables, and higher voltage drops.
In the case of motors, the power factor is maximum at full load, and it decreases with the load.
As discussed in section 3.3 an oversized motor will significantly drop the power factor. Thus, a properly sized motor will improve the power factor. Low power factor can be corrected by using capacitors connected to the motor or at the distribution transformer. Reactive power compensation not only reduces the losses in the network but also allows full use of the power capacity of the power system components. Additionally, the voltage fluctuations are reduced, thus helping the motor to operate closer to the voltage for which it was designed.
4.4.3 Motor oversizing
Studies on the use of electric motors in the European countries highlighted that the average motors working load is far below the rated motor power. The average load factor among all surveyed sectors (foods, paper, chemicals, ceramics, foundries and steel, tertiary sector) was estimated to range from 41% for small size motors (below 4 kW) to 51% for motors above 500 kW. In some sectors (foods, tertiary) the average working load is even lower, with a minimum of 24% for smaller motors.
The reasons why designers tend to oversize the motors are usually due to the aim of improving:
the system reliability
the starting torque
the ability to accommodate increasing power requirements
the allowance for higher load fluctuations
the operation under adverse conditions (like voltage unbalance or undervoltage)
the inventory of spare motors
The general practice of motors over sizing is a confirmation that the energy performances - minimum losses in motors and supply lines - are often overlooked in the industry. The machinery manufacturers, who are responsible for choosing the motor in the first place, as well as the users who should influence the buying phase or the replacement of broken down motors, should consider that the design criteria leading to over sizing may have strong consequences on the energy bill. Since motors are designed to withstand short periods of overload, there is no reason to oversize a motor just because the maximum required power is over (e.g 10-15%) the rated power of the motor, during some of the operation time.

16
Figure 4-7 Motor Efficiency vs. Load [4]
Figure 4-8 Power Factor vs. Load
Whenever a motor has a working point far below 100% of rated power, its efficiency and power factor decrease as well as the capital cost increases.
In most motors the efficiency is almost constant from 75% to full load, but it drops significantly below 50% of full load. This effect is more evident for small motors. Figure 4-7 shows the efficiency vs. load factor of different power electric motors
The comparison of the efficiency characteristics between standard and energy-efficient motors (EEM) shows that even the benefits of using EEM's may be wasted if the load factor is abnormally low.

17
The adverse effect of the reduction of power factor due to over sizing is often neglected. Figure 19 shows the power factor vs. load factor of electric motors.
Unless the reactive power is compensated for each motor, the additional line losses due to over sizing may, in some cases, be a key factor for the proper motor selection.
4.4.4 Transmission System
The transmission system transfers the mechanical power from the motor to the final end-use. The choice of transmission is dependent upon many factors, namely: the desired speed ratio, motor power, layout of the shafts, type of mechanical load, etc. The most important kind of transmission types available include: direct shaft couplings, gearboxes, chains and belts.
Belts
Most motors are connected to their loads through a transmission system, very frequently through a belt. About one third of the motor transmissions in industry uses belts. Belts allow flexibility in the positioning of the motor in relation to the load. Additionally, belts can also increase or decrease the speeds using pulleys of suitable diameters.
There are several types of belts namely: V-belts, cogged V-belts, synchronous belts and flat belts. While V-belts are the cheapest and are the most common type, other types can offer greater efficiency Table 1.
Table 4-14 Comparison of Belt Drive Characteristics 7
Typical Efficiency Range (%)
Suitable for Shock Loads
Periodic Mainte- nance Required
Change of Pulleys Required
Special Features
V-belts 90-98 Yes Yes No Low first cost.
Cogged- V-belts
95-98 Yes Yes No Easy to retrofit. Reduced slip.
Synchro- nous Belts
97-99 No No Yes, with higher cost
Low-medium speed applications. No slip. Noisy.
The V-belt losses are associated with flexing 4 times per cycle, slippage and a small percentage loss due to windage. With wear V-belts stretch and need retensioning. They also smooth with wear, becoming more vulnerable to slip. Thus V-belts need regular maintenance, which is a disadvantage in relation to other non-stretch type belts. Besides, their efficiency will drop if the load is above or below the full load (see Figure 20).

18
Figure 4-9 Efficiency Curve for a V-belt 8
The cogged V-belts have lower flexing losses, since less stress is required to bend the belt and so they are typically 1-4 percent more efficient than standard V-belts. They can be used on the same sheaves and pulleys as standard V-belts, last twice and require less frequent adjustments. The efficiency gained with cogged V-belts is larger when small pulleys are used. Cogged V-belts cost 20-30% more than standard V-belts, but their extra cost is recovered over a few thousand operating hours.
The most efficient belt is the synchronous design, with 97-99% efficiency, because it has low flexing losses and no slippage. Synchronous belts have no slippage because they have meshing teeth on the belt and pulleys. Unlike standard V-belts that rely on friction between the belt and the pulley grooves to transmit the torque, synchronous belts are designed for minimum friction between the belt and the pulley. Due to their positive drive, these belts can be used in applications requiring accurate speed control. Synchronous belts stretch very little because of their construction, do not require periodic retensioning and they typically last 4 times longer than standard V-belts. Retrofitting synchronous belts requires installing sprocket pulleys that cost several times the price of the belt. In cases where pulley replacement is not practical or cost effective, cogged V-belts should be considered.
Gears
The selection of efficient gear drives can be a potential for important energy savings. The ratings for gear drives depend on the gear ratio (the ratio of the input shaft speed to the speed of the output shaft) and on the torque required to drive the load.
Today, various types of gear units are used for power transmission together with a motor. Such gear units are, for example, helical, spur, bevel or worm gear units. Other gear unit types with special profiles or a combination of types are also commonly used. Gear units are generally distinguished by coaxial or parallel axes and by those with intersecting axes.
Gear units with parallel and coaxial axes usually reach efficiency levels of up to 98% and beyond in one stage, sometimes even beyond their gear ratio. Gear units with intersecting axes (such as bevel or worm gear units) have efficiency levels of up to 98% in one stage. However, a larger gear ratio in a single stage can be achieved in gear units with intersecting axes, usually at the expense of efficiency. This becomes significant in the case of worm gears with high gear ratio.
The suitable gear unit type shall be selected by the requirements of the application, such as envelope space, noise and special attention given to efficiency at full and part load. In
9 0
9 2
9 4
9 6
9 8
0 5 0 1 00 1 50 2 00 2 50
P ercen t Nom inal Load
Perc
en
t E
ffic
ien
cy

19
summary, a gear unit interacting with a motor must always be selected in view of the overall application and its requirements.
Chains
Unlike belts, chains typically have been used in low speed and high-torque applications. Like synchronous belts chains do not slip. A well-maintained chain may have an efficiency of about 98%, but wear can decrease this efficiency by a few points.
With the exception of silent chains, chains are noisy. Chains need readjustments and adequate lubrification, which may not be easy to provide. Thus the use of synchronous belts may seem as an attractive alternative to the use of chains.
4.5 End-of-life phase
The EcoReport’s default values are used. It is assumed that 5% of the materials go to landfill, 90% of the plastics are incinerated and 10% are recycled and that 95% of the metals and glass is recycled.
4.6 Works Cited
[1] IEC 60034-31: Guide for the selection and application of energy efficient motors including variable-speed applications, International Electrotechnical Commission, 2010.
[2] P. Angers, A. de Almeida, C. Brunner e M. Doppelbauer, “Motors with Adjustable Speed Drives:Testing Protocol and Efficiency Standard,” em EEMODS 09, 2009.
[3] CENELEC, “Ecodesign for power drive systems, motor starters, power electronics & their driven applications - Part 2: Energy efficiency indicators for power drive systems and motor starters (Draft),” 2013.
[4] “Improving Motor and Drive System Performance: A Sourcebook for Industry,” US Department of Energy, 2008.

1
EuP Lot 30: Electric Motors and Drives
Task 5: Definition of Base Case
ENER/C3/413-2010
Final
June 2014
Anibal De Almeida
Hugh Falkner
João Fong

2
Contents 5 Definition of Base Case ................................................................................................................... 4
5.1 Introduction ............................................................................................................................ 4
5.2 Overview of Methodology ...................................................................................................... 5
5.1.1 Subtask 5.1 Product-specific Inputs ............................................................................... 5
5.1.2 Sub-task 5.2 Base-Case Environmental Impact Assessment .......................................... 5
5.1.3 Subtask 5.3 Base-Case Life Cycle Costs .......................................................................... 5
5.1.4 Sub-task 5.4 EU Totals ..................................................................................................... 5
5.1.5 Sub-task 5.5 EU-27 Total System Impact ........................................................................ 5
5.3 MEEUP Model Input data ....................................................................................................... 6
5.1.6 Motor and VSD time : load data ..................................................................................... 6
5.1.7 Motor and VSD MEEUP Input Data ................................................................................. 6
5.1.8 Soft Starter MEEUP Input Data ....................................................................................... 8
5.1.9 Submersible borehole pump motor ................................................................................ 9
5.1.10 Motor + VSD .................................................................................................................... 9
5.1.11 Overview ......................................................................................................................... 9
5.1.12 Soft starters ................................................................................................................... 10
5.1.13 Induction motors........................................................................................................... 10
5.1.14 Variable Speed Drives ................................................................................................... 11
5.1.15 Multistage submersible borehole pump motors .......................................................... 11
5.1.16 Combined Motor + controller ....................................................................................... 11
5.2 Summary of lifetime environmental impacts, by basecase .................................................. 13
5.2.1 Basecase 1 Small Induction Motor – I phase IE1 0.37kW ........................................... 13
5.2.2 Basecase 2 Small induction motor – 3 phase IE1 0.37kW ........................................... 14
5.2.3 Basecase 3 Medium induction motor (S) - 3 phase IE2 1.1kW .................................... 15
5.2.4 Basecase 4 Medium induction motor (M) - 3 phase IE2 11kW ................................ 16
5.2.5 Basecase 5 Medium induction motor (L) - 3 phase IE2 110kW .................................. 17
5.2.6 Basecase 6 Large induction motor – LV IE2 550kW ................................................... 18
5.2.7 Basecase 7 Large induction motor – MV IE2 550kW.................................................. 19
5.2.8 Basecase 8 VSD Very small 0.37kW ............................................................................. 20
5.2.9 Basecase 9 VSD Small 1.1kW........................................................................................ 21
5.2.10 Basecase 10 VSD Medium 11kW .................................................................................. 22
5.2.11 Basecase 11 VSD Large 110kW ..................................................................................... 23
5.2.12 Basecase 12 VSD Very Large 550kW ............................................................................ 24

3
5.2.13 Basecase 13 Soft Starter Small 1.1kW ......................................................................... 25
5.2.14 Basecase 14 Soft Starter, Medium 11kW .................................................................... 26
5.2.15 Basecase 15 Soft Starter Large 110kW ....................................................................... 27
5.2.16 Basecase 16 Submersible borehole pump motor Small 2.2kW ................................... 28
5.2.17 Basecase 17 Submersible borehole pump motor Large 37kW ................................... 29
5.2.18 Basecase 18 Motor + VSD Very Small 0.37kW ............................................................ 30
5.2.19 Basecase 19 Motor + VSD Small 1.1kW ........................................................................ 31
5.2.20 Basecase 20 Motor + VSD Medium 11kW ................................................................... 32
5.2.21 Basecase 21 Motor + VSD Large 110kW ..................................................................... 33
5.2.22 Basecase 22 Motor + VSD Very Large 550kW .............................................................. 34
5.3 Conclusions ........................................................................................................................... 35

4
5 Definition of Base Case
5.1 Introduction A total of 22 basecases have been selected to ensure that the key characteristics of each group of
products are adequately captured. If differences between basecases are found to be negligible, then
it is possible that at a later stage some basecases might be merged.
The basecase models are based closely on real products, but care must be taken in interpretation of
the whole stock results, as it cannot be certain that the basecases selected are a statistical average
of the range they are representing.
Basecase Descriptions
Basecase 1: Small induction motor - 1 phase IE1 0.37kW
Basecase 2: Small induction motor - 3 phase IE1 0.37kW
Basecase 3: Medium induction motor (S) - 3 phase IE2 1.1kW
Basecase 4: Medium induction motor (M) - 3 phase IE2 11kW
Basecase 5: Medium induction motor (L) - 3 phase IE2 110kW
Basecase 6: Large induction motor - LV IE2 550kW
Basecase 7: Large induction motor - MV IE2 550kW
Basecase 8: VSD - Very Small 0.37kW
Basecase 9: VSD - Small 1.1kW
Basecase 10: VSD - Medium 11kW
Basecase 11: VSD - Large 110kW
Basecase 12: VSD - Very Large 550kW
Basecase 13: Soft Starter - Small 1.1kW
Basecase 14: Soft Starter - Medium 11kW
Basecase 15: Soft Starter - Large 110kW
Basecase 16: Submersible borehole motor - Small 2.2kW*
Basecase 17: Submersible borehole motor - Large 37kW*1
1 Submersible Motors are a separable part of the Multistage submersible borehole pumps considered in Lot29.
The analysis of these is within LOT30 so that the analysis is done on the same basis as other motors, but the results of this analysis will be highly relevant to LOT29.

5
Basecase 18: Motor + VSD - Very Small 0.37kW
Basecase 19: Motor + VSD - Small 1.1kW
Basecase 20: Motor + VSD - Medium 11kW
Basecase 21: Motor + VSD - Large 110kW
Basecase 22: Motor + VSD - Very Large 550kW
It is noted that MV VSDs will have a lifetime of 21 years, compared to the assumed LV VSD basecase
lifetime of 17 years. This variation is considered to be within the boundaries of the LV basecase, and
the impact of this can be explored in more detail if subsequent analysis shows that measures
applicable to Large VSDs are recommended.
5.2 Overview of Methodology
5.1.1 Subtask 5.1 Product-specific Inputs
This section uses information from Task 4 to create specific values relating to stock, energy use, bill
of materials, and other costs of ownership, which are shown in section 5.3.
5.1.2 Sub-task 5.2 Base-Case Environmental Impact Assessment
This uses the VHK ecodesign model to determine the environmental emissions from each product
over each phase of its life
Raw Materials Use and Manufacturing;
Distribution;
Use;
And End-of-Life Phase.
5.1.3 Subtask 5.3 Base-Case Life Cycle Costs
This stage calculates the total environmental impact over the life cycle of each basecase.
5.1.4 Sub-task 5.4 EU Totals
This stage totals the environmental impact of the stock of products sold in one year.
5.1.5 Sub-task 5.5 EU-27 Total System Impact
This stage gives the total EU impact of the stock of products over their lifetime.
The results of Task 5 will highlight which parameters are important, with important parameters at a
later stage being subjected to sensitivity analysis and / or the collection of more refined data. For
clarity, the detailed outputs of the model are included as Annex 1.
Note that for clarity, the Motor and VSD basecases include those products used in the
combined Motor + VSD basecases. Care must be taken to avoid double counting of both
energy use and energy savings potential.

6
5.3 MEEUP Model Input data
5.1.6 Motor and VSD time : load data
Figure 5.1: Time:Load duraction values for Motors and VSDs
The selection of 25, 20, 75 and 100% load points is in line with published motor data. However, for
the purposes of this study, note that these load points are best considered as the mid-point of a load
range, ie87.5% - 112.% etc, not everything between the load point and next lowest load point (which
would have been 75% – 100% etc). This approach does cause a small anomaly at very low loads, the
impact of which will need reviewing to check it does not lead to misleading results.
5.1.7 Motor and VSD MEEUP Input Data
Figure 5.2 shows the assumed efficiencies and annual running hours used in the basecase models,
Figure 5.3 other lifetime cost information, and Figure 5.4 the Bill of Materials for each.
Figure 5.2: Motor and VSD energy use input
Product 100% 75% 50% 25%
Motor 0.2 0.3 0.3 0.2
VSD 0.25 0.5 0.2 0.05
Description Basecase Running
Size (kW) 100% 75% 50% 25% Hours pa
1 Small induction motor - 1 phase IE1 0.15 - 0.75 kW 0,37 66 71 70 61 400
2 Small induction motor - 3 phase IE1 0.15 - 0.75 kW 0,37 66 71 70 61 2000
3 Medium induction motor (S) - 3 phase IE2 0.75 - 7.5 kW 1,1 81,4 82 80 72 2250
4 Medium induction motor (M) - 3 phase IE2 7.5 - 75kW 11 89,8 90 89 85 3000
5 Medium induction motor (L) - 3 phase IE2 75 - 375kW 110 94,5 94,5 94 92,5 6000
6 Large induction motor - LV IE2 375 - 1,000kW 550 95,1 95,1 95,1 94 6000
7 Large induction motor - MV IE2 375 - 1,000kW 550 96,6 96,6 96,6 95,5 6000
8 VSD - Very Small 0.15 - 0.75 kW 0,37 85,6 81,6 76,0 62,5 2000
9 VSD - Small 0.15 - 7.5kW 1,1 91,3 88,7 85,6 77,3 2250
10 VSD - Medium 7.5 - 75kW 11 94,8 93,2 92,2 89,7 3000
11 VSD - Large 75 - 375kW 110 96,0 94,8 94,5 93,7 6000
12 VSD - Very Large 375 - 750kW 550 96,1 94,8 94,6 94,0 6000
Efficiency (%) at load pointsPower Range
corresponding to basecase
Basecase
Ref

7
Figure 5.3: Motor and VSD Other model inputs
Figure 5.4: Motor and VSD Bill of Materials

8
5.1.8 Soft Starter MEEUP Input Data
The following tables show the input data used for the MEEUP models
Figure 5.5: Soft Starter energy use inputs
Figure 5.6: Soft starter cost and miscellaneous data
Figure 5.7: Soft starter Bill of Materials
Description Basecase Loss/cycle Cycle time No. starts
Size (kW) kW secs pa
13 Soft Starter - Small 0.25 - 7.5kW 1.1 0.05 5 2250
14 Soft Starter - Medium 7.5 - 75kW 11 0.5 10 3000
15 Soft Starter - Large 75 - 750kW 110 5 20 6000
Basecase
Ref
Power Range
corresponding to basecase
Description Basecase Repair EU Sales pa Lifetime Stock
Size (kW) Installation Repair Unit Distance (km) (Years) Units
13 Soft Starter - Small 1.1 30 0 60 0 1 15 15
14 Soft Starter - Medium 11 70 100 100 75 0.4 15 6
15 Soft Starter - Large 110 100 250 800 100 0.4 15 6
Total Energy use of
Stock (TWhpa)
Basecase
Ref
Costs (euros)
Electrical Other Cast Aluminium Copper Insulation Packing Impregn Paint PVC PWB Electronics Electronics
Steel Steel Iron Resin Plastic Small Large
13 0 0 0 715 0 0 0 0 0 220 143 143 35.75
14 0 0 0 5500 0 0 0 0 0 1650 1100 1100 275
15 0 0 0 12100 0 0 0 0 0 2750 1650 3850 1100
Bill of materials (kg)
Basecase Ref

9
5.1.9 Submersible borehole pump motor
The assumed proportion of time spent at each flow is shown in Figure 5.8 below:
Figure 5.8 Submersible borehole pumps: Proportion of time spent at each flow
The material content and costs are based on that for conventional induction motors. This is small
source of inaccuracy due to the different dimensional constraints, casing and cooling mechanisms.
However, the environmental analysis of other motors shows that material content only has a small
impact on overall environmental impact, and so this inaccuracy is not critical.
5.1.10 Motor + VSD
The energy consumption is calculated from the sum of the VSD + motor losses, with an additional
increase in motor losses to take account of the impact on motor losses of the VSD. These losses are
shown in figure 5.9 below. Note that this calculation does not take account of the wider system
energy savings from the use of a VSD, it simply focuses on the internal losses of these
motor+controller combinations. A 3-phase motor is assumed in each case.
Figure 5.9 Additional motor loss assumed when driven by a VSD (Source:CEMEP)
6 Summary results of Environmental Analysis of Basecases
6.1 Overview The graphs in section 3.3 present summaries of the environmental emissions of the basecases by
environmental factor, by lifecycle stage.
Decisions on possible trade-offs between these different environmental emission factors are outside
the remit of this study. Therefore each environmental factor needs to be considered on its own
merit, with the focus being on identifying which lifecycle phase has the dominant impact.
Flow 100% 75% 50% 25%
Relative Time 0.3 0.5 0.2 0
VSD size (kW) Loss
VSD - Very Small 0,37 10%
VSD - Small 1,1 10%
VSD - Medium 11 13%
VSD - Large 110 16%
VSD - Very Large (LV and MV) 750 16%

10
For some emissions it is clear what if any elements in the lifecycle can be improved, for others this
will require a knowledge of the possible improvements that are possible, which will be described in
Task 6. In terms of what improvements are possible, it is the differences that are important – and so
environmental emissions that are substantially the same irrespective of product performance will be
of less interest in the analysis.
It should be stressed that these results are dependent on the assumptions used in the design of the
MEEUP model (which cannot be changed), and assumptions underpinning the basecase data.
6.1.1 Soft starters
Soft starters have only very short running hours, due to the fact that these are incurred only during
start / stop instances. Because of this, their energy use is extremely small. Technically there is
negligible scope for reducing losses, with the possible exception of standby losses, on which there is
little data.
The environmental emissions of soft starters are much more diverse than the other products
considered, which is simply reflecting the low emissions attributable to energy losses.
→ There is little scope for measures to reduce the energy losses of soft starters, except for standby
losses.
6.1.2 Induction motors
For all Motors it is clearly the In-use phase that dominates for each product. The only other
significant impact is that of particulates, which relates to the weight and volume of products in
distribution. Improved designs using conventional induction motor technology will have a small
increase in these factors, but it is thought that any reduction in energy saving would justify the
increase in particulates.
Small induction motors have relatively high energy losses due to their proportionately high (kW
loss/ kW rated) energy losses. However, the economic potential for energy saving is limited by their
lower running hours. It is noted that these products are regulated in the USA, and so it is likely that
a similar case can be made for measures in the EU.
Medium induction motors have already been regulated, and so despite their large losses, the scope
for further improvement is limited because of the higher (IE2 or IE3) efficiency levels already
assumed for the basecase.
Large induction motors use less energy than the small and large segments, but the cost
effectiveness of energy savings will be determined by later analysis.
→ The Small induction motor segment appears to have a good energy saving potential. Later
analysis will show whether it is technically and economically justifiable to introduce measures to
promote medium sized motors at efficiency levels beyond those already included in the” Lot11”
regulations.

11
6.1.3 Variable Speed Drives
The lower relative numbers compared to motors, and the small internal losses of VSDs, means that
the total losses are only a small proportion of the total losses for any motor drive system. However,
given the large number installed, and the anticipated future growth of the market, the total losses of
the stock are significant. Generally only on those below 10kVA is there much room for energy
saving, and like soft starters this may relate more to power management and ancillaries rather than
losses in the power converter itself. However there are in the market VSDs, with efficiency
significantly below average.
VSDs have significant but low quantities of other environmental emissions, which is due to the
electronic components used. The particulates in the distribution phase are proportionately high,
due mostly to their lower In Use energy losses.
→ VSDs are efficient devices with proportionately little energy losses. Later analysis will show the
technical and economic potential for energy savings.
6.1.4 Multistage submersible borehole pump motors
These have a proportionately very small energy use. Even if they are not to be considered for
measures within Lot 30, the information is essential for possible Extended Product Approach
measures as part of Lot 29.
→ The low energy use and modest energy saving potential mean that Multistage submersible
borehole pump motors are a lower priority for regulation, but it may still be practical to regulate
them as part of an “Extended Product Approach” for Multistage submersible borehole pumps.
6.1.5 Combined Motor + controller
This basecase has been introduced in order that other new technologies requiring a controller for
operation can be compared on a like for like basis; just looking at the energy losses as shown here
does not give the full picture. To avoid double counting, energy losses are not included in the pie
chart. The basecase of this combination of parts becomes relevant in the context of tasks 6 & 7.

12
Figure 5.10 Breakdown of energy losses, by product.
Figure 5.11 Breakdown of energy losses, by product.

13
6.2 Summary of lifetime environmental impacts, by basecase
6.2.1 Basecase 1 Small Induction Motor – I phase IE1 0.37kW
Figure 5.12 Basecase 1, Small induction motor – 1 phase IE1: Breakdown of environmental impact, by type and life cycle phase
Nr
1
Life Cycle phases --> D IST R I- USE T OT A L
R eso urces Use and Emissio ns Material Manuf. Tota l BUTION Disposal Recycl. Tota l
Materials unit
1 Bulk Plastics g 0 0 0 0 0
2 TecPlastics g 2 2 2 200 22 2 2 2 0
3 Ferro g 7 6 9 6 385 7311 7 6 9 6 0
4 Non-ferro g 2 3 5 0 117 2232 2 3 5 0 0
5 Coating g 4 8 2 46 4 8 0
6 Electronics g 0 0 0 0 0
7 Misc. g 8 5 1 43 808 8 5 1 0
T o tal weight g 1116 7 747 10420 1116 7 0
see note!
Other Resources & Waste debet credit
8 Total Energy (GER) MJ 446 18 4 6 4 7 2 4 0 7 7 52 23 2 9 4 6 4 2
9 of w hich, electricity (in primary MJ) MJ 40 11 5 1 0 4 0 7 3 0 0 0 4 12 4
10 Water (process) ltr 13 0 13 0 2 7 2 0 0 0 2 8 4
11 Water (cooling) ltr 108 5 113 0 10 8 6 1 0 0 0 10 9 7 4
12 Waste, non-haz./ landfill g 34255 56 3 4 3 11 6 1 5 0 6 5 685 0 6 8 4 4 0 12 2
13 Waste, hazardous/ incinerated g 6 0 6 1 9 4 200 0 2 0 0 3 0 1
Emissions (Air)
14 Greenhouse Gases in GWP100 kg CO2 eq. 27 1 2 8 6 17 8 4 2 2 2 14
15 Ozone Depletion, emissions mg R- 11 eq.
16 Acidif ication, emissions g SO2 eq. 477 4 4 8 2 16 10 5 3 8 2 6 15 5 7
17 Volatile Organic Compounds (VOC) g 1 0 1 0 2 0 0 0 3
18 Persistent Organic Pollutants (POP) ng i- Teq 123 0 12 3 0 2 8 5 0 5 15 6
19 Heavy Metals mg Ni eq. 98 0 9 8 3 7 1 15 0 15 18 7
PAHs mg Ni eq. 25 0 2 5 3 8 0 0 0 3 6
20 Particulate Matter (PM, dust) g 36 1 3 6 5 2 2 3 67 0 6 7 17 8
Emissions (Water)
21 Heavy Metals mg Hg/20 27 0 2 7 0 2 7 4 0 4 5 7
22 Eutrophication g PO4 3 0 3 0 0 0 0 0 4
23 Persistent Organic Pollutants (POP) ng i- Teq
Life cycle Impact per product:
P R OD UC T ION EN D -OF -LIF E*
negligible
Author
HF
Date
V3.0 19 Dec 2013Small induction motor - 1 phase IE1
negligible
*=N o te: R ecycling credits o nly relate to recycling o f plast ics and electro nics (excl. LC D / C R T ). R ecycling credits fo r metals and
o ther fract io ns are already taken into acco unt in the pro duct io n phase.
0%10%20%30%40%50%60%70%80%90%
100%
Tota
l Ene
rgy
(GER
)
Wat
er (p
roce
ss)
Wat
er (c
oolin
g)
Was
te, n
on-h
az./
…
Was
te, h
azar
dous
/ …
Gre
enho
use
Gas
es in
…
Ozo
ne D
eple
tion,
…
Aci
dific
atio
n, e
mis
sion
s
Vola
tile
Org
anic
…
Pers
iste
nt O
rgan
ic …
Hea
vy M
etal
s
PAH
s
Part
icul
ate
Mat
ter …
Emis
sion
s (W
ater
)
Hea
vy M
etal
s
Eutr
ophi
catio
n
Pers
iste
nt O
rgan
ic …
End of life
Use
Distribution
Production

14
6.2.2 Basecase 2 Small induction motor – 3 phase IE1 0.37kW
Figure 5.13: Basecase 2, Small induction motor – 3 phase IE1: Breakdown of environmental impact, by type and life
cycle phase
0%10%20%30%40%50%60%70%80%90%
100%
Tota
l Ene
rgy
(GER
)
Wat
er (p
roce
ss)
Wat
er (c
oolin
g)
Was
te, n
on-h
az./
…
Was
te, h
azar
dous
/ …
Gre
enho
use
Gas
es in
…
Ozo
ne D
eple
tion,
…
Aci
dific
atio
n, e
mis
sion
s
Vola
tile
Org
anic
…
Pers
iste
nt O
rgan
ic …
Hea
vy M
etal
s
PAH
s
Part
icul
ate
Mat
ter …
Emis
sion
s (W
ater
)
Hea
vy M
etal
s
Eutr
ophi
catio
n
Pers
iste
nt O
rgan
ic …
End of life
Use
Distribution
Production

15
6.2.3 Basecase 3 Medium induction motor (S) - 3 phase IE2 1.1kW
Figure 5.14: Basecase 3, Medium induction motor (S) - 3 phase IE3: Breakdown of environmental impact, by type and
life cycle phase.
Nr
3
Life Cycle phases --> D IST R I- USE T OT A L
R eso urces Use and Emissio ns Material Manuf. Tota l BUTION Disposal Recycl. Tota l
Materials unit
1 Bulk Plastics g 0 0 0 0 0
2 TecPlastics g 3 3 0 297 33 3 3 0 0
3 Ferro g 14 4 7 6 724 13752 14 4 7 6 0
4 Non-ferro g 4 8 18 241 4577 4 8 18 0
5 Coating g 110 6 105 110 0
6 Electronics g 0 0 0 0 0
7 Misc. g 115 5 58 1097 115 5 0
T o tal weight g 2 0 8 8 9 1325 19564 2 0 8 8 9 0
see note!
Other Resources & Waste debet credit
8 Total Energy (GER) MJ 828 35 8 6 3 7 9 4 3 4 7 0 92 33 5 8 4 4 4 7 0
9 of w hich, electricity (in primary MJ) MJ 71 21 9 2 0 4 3 4 6 2 0 0 0 4 3 5 5 4
10 Water (process) ltr 20 0 2 0 0 2 8 9 8 0 0 0 2 9 18
11 Water (cooling) ltr 179 10 18 9 0 115 8 9 8 0 1 - 1 116 0 8 6
12 Waste, non-haz./ landfill g 62073 109 6 2 18 2 6 4 5 10 12 1281 0 12 8 0 114 5 3 9
13 Waste, hazardous/ incinerated g 11 0 11 1 10 0 2 297 0 2 9 7 13 10
Emissions (Air)
14 Greenhouse Gases in GWP100 kg CO2 eq. 51 2 5 2 6 18 9 7 7 2 4 19 6 0
15 Ozone Depletion, emissions mg R- 11 eq.
16 Acidif ication, emissions g SO2 eq. 865 8 8 7 4 17 112 0 0 13 3 10 12 10 1
17 Volatile Organic Compounds (VOC) g 2 0 2 0 16 0 0 0 19
18 Persistent Organic Pollutants (POP) ng i- Teq 245 0 2 4 5 0 2 8 7 9 0 9 5 4 2
19 Heavy Metals mg Ni eq. 178 0 17 8 3 7 4 7 26 0 2 6 9 5 5
PAHs mg Ni eq. 55 0 5 5 4 8 6 0 0 0 14 5
20 Particulate Matter (PM, dust) g 74 1 7 5 6 9 2 4 0 119 0 119 5 0 3
Emissions (Water)
21 Heavy Metals mg Hg/20 52 0 5 2 0 2 8 1 8 0 8 3 4 1
22 Eutrophication g PO4 5 0 5 0 1 0 0 0 7
23 Persistent Organic Pollutants (POP) ng i- Teq negligible
*=N o te: R ecycling credits o nly relate to recycling o f plast ics and electro nics (excl. LC D / C R T ). R ecycling credits fo r metals and
o ther fract io ns are already taken into acco unt in the pro duct io n phase.
Life cycle Impact per product:
P R OD UC T ION EN D -OF -LIF E*
negligible
Author
HF
Date
V3.0 19 Dec 2013Medium induction motor (S) - 3 phase IE2
0%10%20%30%40%50%60%70%80%90%
100%
Tota
l Ene
rgy
(GER
)
Wat
er (p
roce
ss)
Wat
er (c
oolin
g)
Was
te, n
on-h
az./
…
Was
te, h
azar
dous
/ …
Gre
enho
use
Gas
es in
…
Ozo
ne D
eple
tion,
…
Aci
dific
atio
n, e
mis
sion
s
Vola
tile
Org
anic
…
Pers
iste
nt O
rgan
ic …
Hea
vy M
etal
s
PAH
s
Part
icul
ate
Mat
ter …
Emis
sion
s (W
ater
)
Hea
vy M
etal
s
Eutr
ophi
catio
n
Pers
iste
nt O
rgan
ic …
End of life
Use
Distribution
Production

16
6.2.4 Basecase 4 Medium induction motor (M) - 3 phase IE2 11kW
Figure 5.15: Basecase 4, Medium induction motor (M) - 3 phase IE3: Breakdown of environmental impact, by type and
life cycle phase.
Nr
4
Life Cycle phases --> D IST R I- USE T OT A L
R eso urces Use and Emissio ns Material Manuf. Tota l BUTION Disposal Recycl. Tota l
Materials unit
1 Bulk Plastics g 0 0 0 0 0
2 TecPlastics g 110 0 990 110 110 0 0
3 Ferro g 9 3 0 6 0 4653 88407 9 3 0 6 0 0
4 Non-ferro g 2 4 0 9 0 1205 22886 2 4 0 9 0 0
5 Coating g 5 5 0 28 523 5 5 0 0
6 Electronics g 0 0 0 0 0
7 Misc. g 10 12 0 506 9614 10 12 0 0
T o tal weight g 12 8 9 2 0 7381 121539 12 8 9 2 0 0
see note!
Other Resources & Waste debet credit
8 Total Energy (GER) MJ 4485 156 4 6 4 1 2 5 5 2 8 6 3 9 4 508 203 3 0 5 2 9 15 9 6
9 of w hich, electricity (in primary MJ) MJ 443 94 5 3 7 0 2 8 6 17 3 0 0 0 2 8 6 7 10
10 Water (process) ltr 121 1 12 3 0 19 0 7 9 0 0 0 19 2 0 1
11 Water (cooling) ltr 686 44 7 3 0 0 7 6 3 12 0 0 2 - 2 7 6 3 8 4 8
12 Waste, non-haz./ landfill g 316051 488 3 16 5 3 9 14 9 3 3 4 9 6 0 7903 2 7 9 0 1 6 5 9 5 5 0
13 Waste, hazardous/ incinerated g 42 0 4 2 3 6 5 9 5 990 0 9 9 0 7 6 3 0
Emissions (Air)
14 Greenhouse Gases in GWP100 kg CO2 eq. 278 9 2 8 7 17 12 5 0 5 38 15 2 3 12 8 3 2
15 Ozone Depletion, emissions mg R- 11 eq.
16 Acidif ication, emissions g SO2 eq. 4223 37 4 2 6 0 4 9 7 3 7 4 5 75 19 5 6 7 8 110
17 Volatile Organic Compounds (VOC) g 12 0 12 3 111 2 0 2 12 8
18 Persistent Organic Pollutants (POP) ng i- Teq 1487 0 14 8 7 1 18 9 1 54 0 5 4 3 4 3 3
19 Heavy Metals mg Ni eq. 915 0 9 15 8 4 9 5 8 147 0 14 7 6 0 2 7
PAHs mg Ni eq. 285 0 2 8 5 9 6 0 6 0 0 0 8 9 9
20 Particulate Matter (PM, dust) g 390 6 3 9 5 5 13 2 2 3 9 661 0 6 6 0 3 8 0 8
Emissions (Water)
21 Heavy Metals mg Hg/20 293 0 2 9 3 0 18 4 8 42 0 4 2 2 18 3
22 Eutrophication g PO4 22 0 2 2 0 9 2 0 2 3 4
23 Persistent Organic Pollutants (POP) ng i- Teq negligible
*=N o te: R ecycling credits o nly relate to recycling o f plast ics and electro nics (excl. LC D / C R T ). R ecycling credits fo r metals and
o ther fract io ns are already taken into acco unt in the pro duct io n phase.
Life cycle Impact per product:
P R OD UC T ION EN D -OF -LIF E*
negligible
Author
HF
Date
V3.0 19 Dec 2013Medium induction motor (M) - 3 phase IE2
0%10%20%30%40%50%60%70%80%90%
100%
Tota
l En
ergy
(G
ER)
Wat
er (
pro
cess
)
Wat
er (
coo
ling)
Was
te, n
on
-haz
./…
Was
te,…
Gre
en
ho
use
Gas
es…
Ozo
ne
De
ple
tio
n,…
Aci
dif
icat
ion
,…
Vo
lati
le O
rgan
ic…
Pe
rsis
ten
t O
rgan
ic…
Hea
vy M
etal
s
PA
Hs
Par
ticu
late
Mat
ter…
Emis
sio
ns
(Wat
er)
Hea
vy M
etal
s
Eutr
op
hic
atio
n
Pe
rsis
ten
t O
rgan
ic…
End of life
Use
Distribution
Production

17
6.2.5 Basecase 5 Medium induction motor (L) - 3 phase IE2 110kW
Figure 5.16: Basecase 5, Medium induction motor (L) - 3 phase IE3: Breakdown of environmental impact, by type and
life cycle phase.
Life Cycle phases --> D IST R I- USE T OT A L
R eso urces Use and Emissio ns Material Manuf. Tota l BUTION Disposal Recycl. Tota l
Materials unit
1 Bulk Plastics kt 0 0 0 0 0
2 TecPlastics kt 1 0 0 1 0
3 Ferro kt 8 5 4 81 8 5 0
4 Non-ferro kt 10 1 10 10 0
5 Coating kt 0 0 0 0 0
6 Electronics kt 0 0 0 0 0
7 Misc. kt 6 0 5 6 0
T o tal weight kt 10 2 6 97 10 2 0
see note!
Other Resources & Waste debet credit
8 Total Energy (GER) PJ 3 0 3 0 4 5 2 0 0 0 4 5 5
9 of w hich, electricity (in primary PJ) PJ 0 0 0 0 4 5 2 0 0 0 4 5 2
10 Water (process) mln. m3 0 0 0 0 3 0 0 0 0 3 0
11 Water (cooling) mln. m3 0 0 0 0 12 0 5 0 0 0 12 0 6
12 Waste, non-haz./ landfill kt 209 0 2 10 0 5 2 6 6 0 6 7 4 2
13 Waste, hazardous/ incinerated kt 0 0 0 0 10 0 0 0 11
Emissions (Air)
14 Greenhouse Gases in GWP100 mt CO2 eq. 0 0 0 0 2 0 0 0 0 2 0
15 Ozone Depletion, emissions t R- 11 eq.
16 Acidif ication, emissions kt SO2 eq. 3 0 3 0 116 0 0 0 119
17 Volatile Organic Compounds (VOC) kt 0 0 0 0 0 0 0 0 0
18 Persistent Organic Pollutants (POP) g i- Teq 1 0 1 0 3 0 0 0 4
19 Heavy Metals ton Ni eq. 1 0 1 0 8 0 0 0 9
PAHs ton Ni eq. 0 0 0 0 1 0 0 0 1
20 Particulate Matter (PM, dust) kt 1 0 1 0 3 0 0 0 4
Emissions (Water)
21 Heavy Metals ton Hg/20 0 0 0 0 3 0 0 0 3
22 Eutrophication kt PO4 0 0 0 0 0 0 0 0 0
23 Persistent Organic Pollutants (POP) g i- Teq
P R OD UC T ION EN D -OF -LIF E*
*=N o te: R ecycling credits o nly relate to recycling o f plast ics and electro nics (excl. LC D / C R T ). R ecycling credits fo r metals and
o ther fract io ns are already taken into acco unt in the pro duct io n phase.
negligible
negligible
0%10%20%30%40%50%60%70%80%90%
100%
Tota
l En
erg
y (G
ER)
Wat
er
(pro
cess
)
Wat
er
(co
olin
g)
Was
te, n
on
-haz
./ …
Was
te, h
azar
do
us/
…
Gre
en
ho
use
Gas
es
in …
Ozo
ne
De
ple
tio
n, …
Aci
dif
icat
ion
, em
issi
on
s
Vo
lati
le O
rgan
ic …
Pe
rsis
ten
t Org
anic
…
He
avy
Me
tals
PA
Hs
Par
ticu
late
Mat
ter …
Emis
sio
ns
(Wat
er)
He
avy
Me
tals
Eutr
op
hic
atio
n
Pe
rsis
ten
t Org
anic
…
End of life
Use
Distribution
Production

18
6.2.6 Basecase 6 Large induction motor – LV IE2 550kW
Figure 5.17: Basecase 6, Large induction motor – LV IE2: Breakdown of environmental impact, by type and life cycle
phase.
0%10%20%30%40%50%60%70%80%90%
100%
Tota
l En
ergy
(G
ER)
Wat
er (
pro
cess
)
Wat
er (
coo
ling)
Was
te, n
on
-haz
./…
Was
te, h
azar
do
us/
…
Gre
en
ho
use
Gas
es in
…
Ozo
ne
De
ple
tio
n,…
Aci
dif
icat
ion
, em
issi
on
s
Vo
lati
le O
rgan
ic…
Pe
rsis
ten
t O
rgan
ic…
Hea
vy M
etal
s
PA
Hs
Par
ticu
late
Mat
ter…
Emis
sio
ns
(Wat
er)
Hea
vy M
etal
s
Eutr
op
hic
atio
n
Pe
rsis
ten
t O
rgan
ic…
End of life
Use
Distribution
Production

19
6.2.7 Basecase 7 Large induction motor – MV IE2 550kW
Figure 5.18: Basecase 7, Large induction motor – MV IE2: Breakdown of environmental impact, by type and life cycle
phase.

20
6.2.8 Basecase 8 VSD Very small 0.37kW
Figure 5.19: Basecase 8, VSD – Very small: Breakdown of environmental impact, by type and life cycle phase.

21
6.2.9 Basecase 9 VSD Small 1.1kW
Figure 5.20: Basecase 9, VSD - Small: Breakdown of environmental impact, by type and life cycle phase.
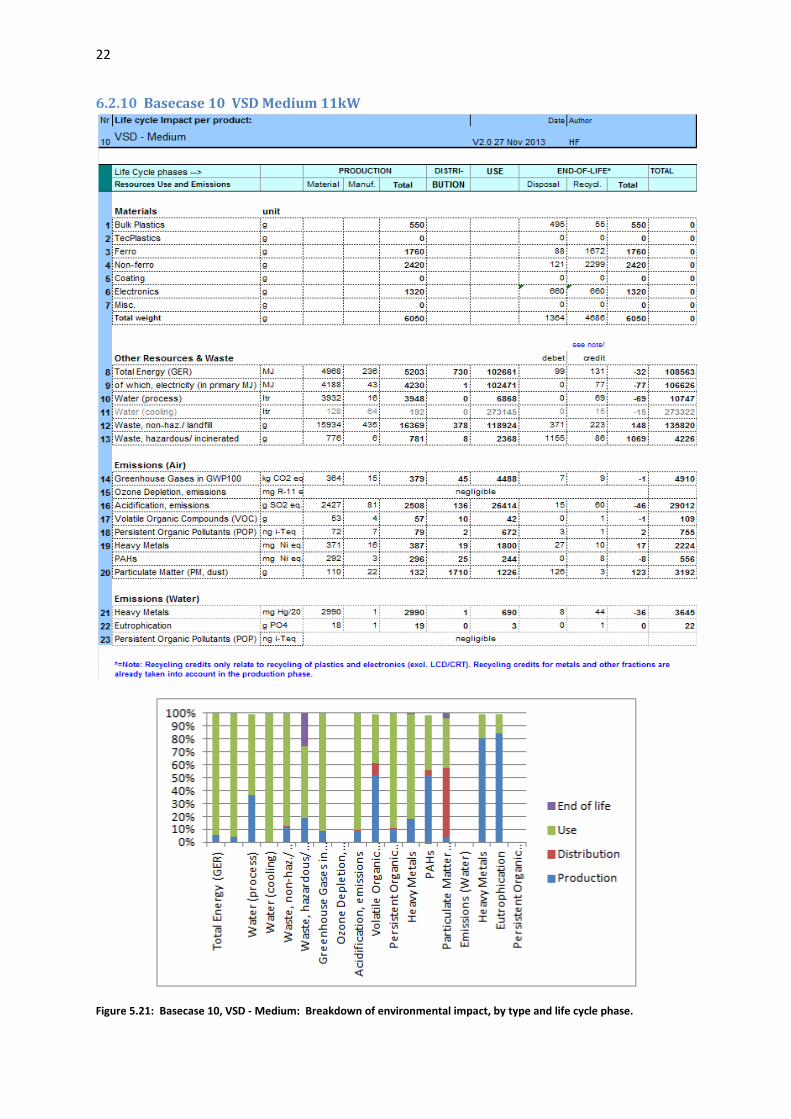
22
6.2.10 Basecase 10 VSD Medium 11kW
Figure 5.21: Basecase 10, VSD - Medium: Breakdown of environmental impact, by type and life cycle phase.

23
6.2.11 Basecase 11 VSD Large 110kW
Figure 5.22: Basecase 11,VSD - Large: Breakdown of environmental impact, by type and life cycle phase.

24
6.2.12 Basecase 12 VSD Very Large 550kW
Figure 5.23: Basecase 12, VSD – Very large: Breakdown of environmental impact, by type and life cycle phase.

25
6.2.13 Basecase 13 Soft Starter Small 1.1kW Life Cycle phases --> PRODUCTION DISTRI- USE END-OF-LIFE* TOTAL
Resources Use and Emissions
Material
Manu
f. Total BUTION Disposal Recycl. Total
Materials unit
1 Bulk Plastics g 220 198 22 220 0
2 TecPlastics g 0 0 0 0 0
3 Ferro g 0 0 0 0 0
4 Non-ferro g 715 36 679 715 0
5 Coating g 0 0 0 0 0
6 Electronics g 322 161 161 322 0
7 Misc. g 0 0 0 0 0
Total weight g 1257 395 862 1257 0
see note!
Other Resources & Waste debit credit
8 Total Energy (GER) MJ 1000 63 1064 459 35 29 36 -8 1550
9 of which, electricity (in primary PJ) MJ 789 14 803 1 33 0 19 -19 818
10 Water (process) ltr 745 4 749 0 9 0 17 -17 741
11 Water (cooling) ltr 49 17 66 0 66 0 4 -4 129
12 Waste, non-haz./ landfill g 3961 129 4089 248 69 77 54 23 4429
13 Waste, hazardous/ incinerated g 287 1 288 5 3 359 21 338 634
Emissions (Air)
14 Greenhouse Gases in GWP100 kg CO2 eq.
15 Ozone Depletion, emissions mg R-11 eq. negligible
16 Acidification, emissions g SO2 eq. 486 21 507 86 11 4 15 -11 594
17 Volatile Organic Compounds (VOC) g 10 1 11 6 0 0 0 0 17
18 Persistent Organic Pollutants (POP) ng i-Teq 11 2 13 1 0 1 0 0 15
19 Heavy Metals mg Ni eq. 72 5 77 13 1 8 2 5 96
PAHs mg Ni eq. 79 1 80 16 1 0 2 -2 95
20 Particulate Matter (PM, dust) g 25 6 31 1026 0 37 1 36 1093
Emissions (Water)
21 Heavy Metals mg Hg/20 565 0 565 0 6 2 11 -8 563
22 Eutrophication g PO4 4 0 4 0 0 0 0 0 4
23 Persistent Organic Pollutants (POP) ng i-Teq negligible
*=Note: Recycling credits only relate to recycling of plastics and electronics (excl. LCD/CRT). Recycling credits for metals and other fractions are already taken into account in the production phase.
Figure 5.24: Basecase 13 ,Soft Starter, small: Breakdown of environmental impact, by type and life cycle phase.
0%10%20%30%40%50%60%70%80%90%
100%
Tota
l En
ergy
(G
ER)
Wat
er (
pro
cess
)
Wat
er (
coo
ling)
Was
te, n
on
-haz
./…
Was
te, h
azar
do
us/
…
Gre
en
ho
use
Gas
es in
…
Ozo
ne
De
ple
tio
n,…
Aci
dif
icat
ion
, em
issi
on
s
Vo
lati
le O
rgan
ic…
Pe
rsis
ten
t O
rgan
ic…
Hea
vy M
etal
s
PA
Hs
Par
ticu
late
Mat
ter…
Emis
sio
ns
(Wat
er)
Hea
vy M
etal
s
Eutr
op
hic
atio
n
Pe
rsis
ten
t O
rgan
ic…
End of life
Use
Distribution
Production

26
6.2.14 Basecase 14 Soft Starter, Medium 11kW Life Cycle phases --> PRODUCTION DISTRI- USE END-OF-LIFE* TOTAL
Resources Use and Emissions
Material
Manu
f. Total BUTION Disposal Recycl. Total
Materials unit
1 Bulk Plastics g 1650 1485 165 1650 0
2 TecPlastics g 0 0 0 0 0
3 Ferro g 0 0 0 0 0
4 Non-ferro g 5500 275 5225 5500 0
5 Coating g 0 0 0 0 0
6 Electronics g 2475 1238 1238 2475 0
7 Misc. g 0 0 0 0 0
Total weight g 9625 2998 6628 9625 0
see note!
Other Resources & Waste debit credit
8 Total Energy (GER) MJ 7691 485 8176 459 919 217 278 -61 9492
9 of which, electricity (in primary PJ) MJ 6071 105 6177 1 718 0 144 -144 6751
10 Water (process) ltr 5731 31 5761 0 101 0 130 -130 5733
11 Water (cooling) ltr 372 131 503 0 1755 0 30 -30 2229
12 Waste, non-haz./ landfill g 30464 984 31448 248 1075 591 418 172 32944
13 Waste, hazardous/ incinerated g 2205 11 2216 5 37 2723 162 2561 4819
Emissions (Air)
14 Greenhouse Gases in GWP100 kg CO2 eq.
15 Ozone Depletion, emissions mg R-11 eq. negligible
16 Acidification, emissions g SO2 eq. 3740 162 3902 86 222 32 116 -84 4126
17 Volatile Organic Compounds (VOC) g 77 8 85 6 4 1 2 -1 94
18 Persistent Organic Pollutants (POP) ng i-Teq 85 15 100 1 5 4 2 3 109
19 Heavy Metals mg Ni eq. 553 37 590 13 56 59 18 41 699
PAHs mg Ni eq. 610 6 617 16 46 0 15 -15 664
20 Particulate Matter (PM, dust) g 193 43 237 1026 667 278 6 273 2203
Emissions (Water)
21 Heavy Metals mg Hg/20 4346 1 4348 0 48 18 82 -64 4331
22 Eutrophication g PO4 29 2 31 0 0 1 1 0 31
23 Persistent Organic Pollutants (POP) ng i-Teq negligible
*=Note: Recycling credits only relate to recycling of plastics and electronics (excl. LCD/CRT). Recycling credits for metals and other fractions are already taken into account in the production phase.
Figure 5.25: Basecase 14, Soft Starter, medium: Breakdown of environmental impact, by type and life cycle phase.
0%10%20%30%40%50%60%70%80%90%
100%
Tota
l En
ergy
(G
ER)
Wat
er (
pro
cess
)
Wat
er (
coo
ling)
Was
te, n
on
-haz
./…
Was
te, h
azar
do
us/
…
Gre
en
ho
use
Gas
es in
…
Ozo
ne
De
ple
tio
n,…
Aci
dif
icat
ion
, em
issi
on
s
Vo
lati
le O
rgan
ic…
Pe
rsis
ten
t O
rgan
ic…
Hea
vy M
etal
s
PA
Hs
Par
ticu
late
Mat
ter…
Emis
sio
ns
(Wat
er)
Hea
vy M
etal
s
Eutr
op
hic
atio
n
Pe
rsis
ten
t O
rgan
ic…
End of life
Use
Distribution
Production

27
6.2.15 Basecase 15 Soft Starter Large 110kW Life Cycle phases --> PRODUCTION DISTRI- USE END-OF-LIFE* TOTAL
Resources Use and Emissions
Material
Manu
f. Total BUTION Disposal Recycl. Total
Materials unit
1 Bulk Plastics g 2750 2475 275 2750 0
2 TecPlastics g 0 0 0 0 0
3 Ferro g 0 0 0 0 0
4 Non-ferro g 12100 605 11495 12100 0
5 Coating g 0 0 0 0 0
6 Electronics g 6600 3300 3300 6600 0
7 Misc. g 0 0 0 0 0
Total weight g 21450 6380 15070 21450 0
see note!
Other Resources & Waste debit credit
8 Total Energy (GER) MJ 24688 1180 25868 459 26749 464 656 -192 52884
9 of which, electricity (in primary PJ) MJ 20897 214 21111 1 26461 0 383 -383 47190
10 Water (process) ltr 19660 80 19740 0 1947 0 346 -346 21341
11 Water (cooling) ltr 641 320 961 0 70010 0 75 -75 70895
12 Waste, non-haz./ landfill g 72626 2175 74801 248 31183 1316 1113 203 106435
13 Waste, hazardous/ incinerated g 3878 28 3907 5 644 5775 431 5344 9899
Emissions (Air)
14 Greenhouse Gases in GWP100 kg CO2 eq.
15 Ozone Depletion, emissions mg R-11 eq. negligible
16 Acidification, emissions g SO2 eq. 12103 405 12508 86 6903 69 301 -232 19265
17 Volatile Organic Compounds (VOC) g 266 21 286 6 17 1 4 -3 306
18 Persistent Organic Pollutants (POP) ng i-Teq 255 33 288 1 175 9 4 5 470
19 Heavy Metals mg Ni eq. 1831 82 1913 13 521 126 48 77 2525
PAHs mg Ni eq. 1461 17 1478 16 118 0 40 -40 1572
20 Particulate Matter (PM, dust) g 541 112 652 1026 1033 593 15 578 3289
Emissions (Water)
21 Heavy Metals mg Hg/20 14934 3 14937 0 319 39 220 -181 15075
22 Eutrophication g PO4 91 5 95 0 2 2 3 -1 96
23 Persistent Organic Pollutants (POP) ng i-Teq negligible
*=Note: Recycling credits only relate to recycling of plastics and electronics (excl. LCD/CRT). Recycling credits for metals and other fractions are already taken into account in the production phase.
Figure 5.26: Basecase 15, Soft Starter, large: Breakdown of environmental impact, by type and life cycle phase.
0%10%20%30%40%50%60%70%80%90%
100%
Tota
l En
ergy
(G
ER)
Wat
er (
pro
cess
)
Wat
er (
coo
ling)
Was
te, n
on
-haz
./…
Was
te, h
azar
do
us/
…
Gre
en
ho
use
Gas
es in
…
Ozo
ne
De
ple
tio
n,…
Aci
dif
icat
ion
, em
issi
on
s
Vo
lati
le O
rgan
ic…
Pe
rsis
ten
t O
rgan
ic…
Hea
vy M
etal
s
PA
Hs
Par
ticu
late
Mat
ter…
Emis
sio
ns
(Wat
er)
Hea
vy M
etal
s
Eutr
op
hic
atio
n
Pe
rsis
ten
t O
rgan
ic…
End of life
Use
Distribution
Production

28
6.2.16 Basecase 16 Submersible borehole pump motor Small 2.2kW Life Cycle phases --> PRODUCTION DISTRI- USE END-OF-LIFE* TOTAL
Resources Use and Emissions
Material
Manu
f. Total BUTION Disposal Recycl. Total
Materials unit
1 Bulk Plastics g 0 0 0 0 0
2 TecPlastics g 660 594 66 660 0
3 Ferro g 28952 1448 27504 28952 0
4 Non-ferro g 9636 482 9154 9636 0
5 Coating g 220 11 209 220 0
6 Electronics g 0 0 0 0 0
7 Misc. g 2310 116 2195 2310 0
Total weight g 41778 2650 39128 41778 0
see note!
Other Resources & Waste debit credit
8 Total Energy (GER) MJ 1657 69 1726 92 61909 183 67 116 63843
9 of which, electricity (in primary PJ) MJ 142 42 184 0 61412 0 0 0 61596
10 Water (process) ltr 40 1 41 0 4094 0 0 0 4135
11 Water (cooling) ltr 358 20 378 0 163764 0 1 -1 164141
12 Waste, non-haz./ landfill g 124146 217 124364 71 72445 2561 1 2560 199440
13 Waste, hazardous/ incinerated g 21 0 21 1 1415 594 0 594 2032
Emissions (Air)
14 Greenhouse Gases in GWP100 kg CO2 eq. 101 4 105 7 2718 14 5 9 2839
15 Ozone Depletion, emissions mg R-11 eq. negligible
16 Acidification, emissions g SO2 eq. 1731 17 1747 19 15868 27 6 21 17655
17 Volatile Organic Compounds (VOC) g 4 0 4 1 31 1 0 1 36
18 Persistent Organic Pollutants (POP) ng i-Teq 491 0 491 0 407 18 0 18 916
19 Heavy Metals mg Ni eq. 357 0 357 4 1161 53 0 53 1574
PAHs mg Ni eq. 111 0 111 4 226 0 0 0 341
20 Particulate Matter (PM, dust) g 148 3 150 103 2103 238 0 238 2594
Emissions (Water)
21 Heavy Metals mg Hg/20 104 0 104 0 397 15 0 15 517
22 Eutrophication g PO4 11 0 11 0 2 1 0 1 13
23 Persistent Organic Pollutants (POP) ng i-Teq negligible
*=Note: Recycling credits only relate to recycling of plastics and electronics (excl. LCD/CRT). Recycling credits for metals and other fractions are already taken into account in the production phase.
Figure 5.27: Basecase 16, Submersible borehole motor - Small: Breakdown of environmental impact, by type and life
cycle phase.
0%10%20%30%40%50%60%70%80%90%
100%
Tota
l En
ergy
(G
ER)
Wat
er (
pro
cess
)
Wat
er (
coo
ling)
Was
te, n
on
-haz
./…
Was
te, h
azar
do
us/
…
Gre
en
ho
use
Gas
es in
…
Ozo
ne
De
ple
tio
n,…
Aci
dif
icat
ion
, em
issi
on
s
Vo
lati
le O
rgan
ic…
Pe
rsis
ten
t O
rgan
ic…
Hea
vy M
etal
s
PA
Hs
Par
ticu
late
Mat
ter…
Emis
sio
ns
(Wat
er)
Hea
vy M
etal
s
Eutr
op
hic
atio
n
Pe
rsis
ten
t O
rgan
ic…
End of life
Use
Distribution
Production

29
6.2.17 Basecase 17 Submersible borehole pump motor Large 37kW Life Cycle phases --> PRODUCTION DISTRI- USE END-OF-LIFE* TOTAL
Resources Use and Emissions
Material
Manu
f. Total BUTION Disposal Recycl. Total
Materials unit
1 Bulk Plastics g 0 0 0 0 0
2 TecPlastics g 1850 1665 185 1850 0
3 Ferro g 287490 14375 273116 287490 0
4 Non-ferro g 35150 1758 33393 35150 0
5 Coating g 370 19 352 370 0
6 Electronics g 0 0 0 0 0
7 Misc. g 18870 944 17927 18870 0
Total weight g 343730 18759 324971 343730 0
see note!
Other Resources & Waste debit credit
8 Total Energy (GER) MJ 9238 379 9617 323 2525622 1287 335 952 2536514
9 of which, electricity (in primary PJ) MJ 928 228 1156 1 2525056 0 1 -1 2526212
10 Water (process) ltr 319 3 323 0 168340 0 0 0 168662
11 Water (cooling) ltr 1259 108 1366 0 6733466 0 4 -4 6734829
12 Waste, non-haz./ landfill g 704212 1189 705401 182 2934700 21070 3 21067 3661351
13 Waste, hazardous/ incinerated g 64 0 64 4 58185 1665 0 1665 59918
Emissions (Air)
14 Greenhouse Gases in GWP100 kg CO2 eq. 616 21 637 21 110235 96 25 72 110964
15 Ozone Depletion, emissions mg R-11 eq. negligible
16 Acidification, emissions g SO2 eq. 9131 91 9222 61 650328 189 31 158 659769
17 Volatile Organic Compounds (VOC) g 35 0 35 4 959 5 0 5 1003
18 Persistent Organic Pollutants (POP) ng i-Teq 3197 0 3197 1 16583 145 0 145 19926
19 Heavy Metals mg Ni eq. 2149 0 2149 9 43446 374 0 374 45978
PAHs mg Ni eq. 314 0 314 11 5082 0 0 0 5407
20 Particulate Matter (PM, dust) g 1881 14 1895 684 15671 1675 1 1675 19924
Emissions (Water)
21 Heavy Metals mg Hg/20 605 0 605 0 16287 107 0 107 17000
22 Eutrophication g PO4 37 0 37 0 78 6 0 6 121
23 Persistent Organic Pollutants (POP) ng i-Teq negligible
*=Note: Recycling credits only relate to recycling of plastics and electronics (excl. LCD/CRT). Recycling credits for metals and other fractions are already taken into account in the production phase.
Figure 5.28: Basecase 17, Submersible borehole motor - Large: Breakdown of environmental impact, by type and life
cycle phase.
0%10%20%30%40%50%60%70%80%90%
100%
Tota
l En
ergy
(G
ER)
Wat
er (
pro
cess
)
Wat
er (
coo
ling)
Was
te, n
on
-haz
./…
Was
te, h
azar
do
us/
…
Gre
en
ho
use
Gas
es in
…
Ozo
ne
De
ple
tio
n,…
Aci
dif
icat
ion
, em
issi
on
s
Vo
lati
le O
rgan
ic…
Pe
rsis
ten
t O
rgan
ic…
Hea
vy M
etal
s
PA
Hs
Par
ticu
late
Mat
ter…
Emis
sio
ns
(Wat
er)
Hea
vy M
etal
s
Eutr
op
hic
atio
n
Pe
rsis
ten
t O
rgan
ic…
End of life
Use
Distribution
Production

30
6.2.18 Basecase 18 Motor + VSD Very Small 0.37kW
Figure 5.29: Basecase 18, Motor + VSD - Very Small: Breakdown of environmental impact, by type and life cycle phase.

31
6.2.19 Basecase 19 Motor + VSD Small 1.1kW
Figure 5.30: Motor + VSD - Small: Breakdown of environmental impact, by type and life cycle phase.
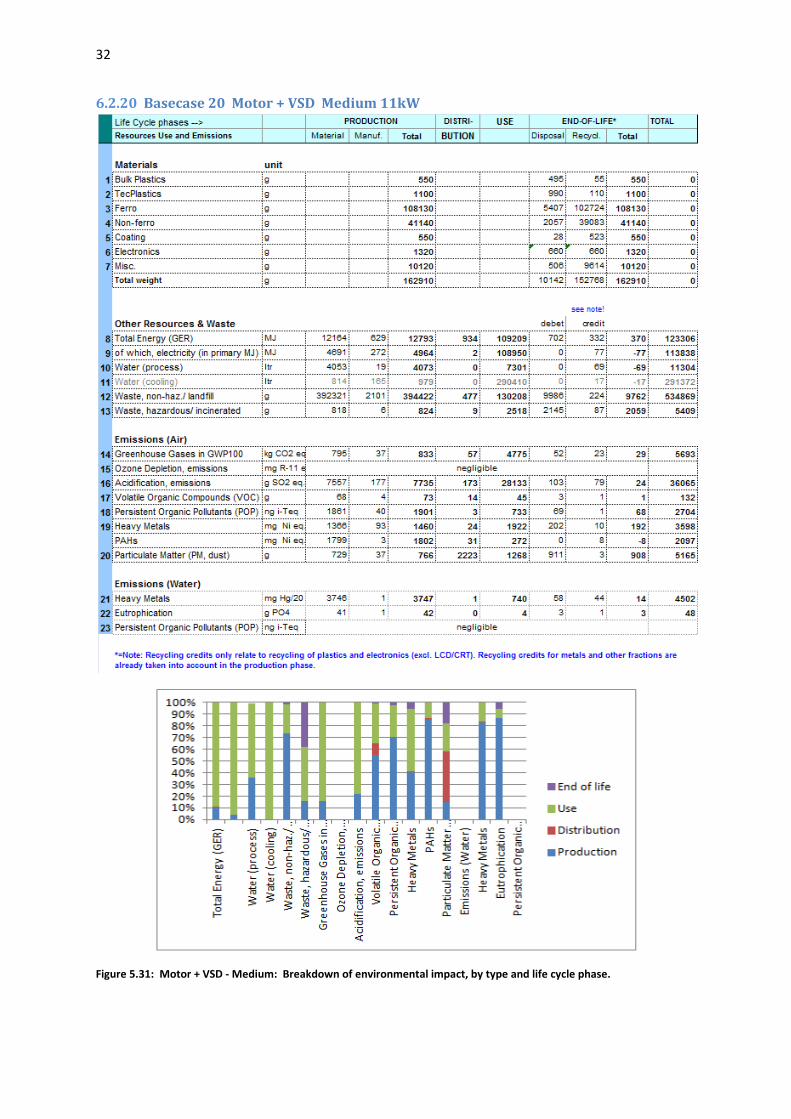
32
6.2.20 Basecase 20 Motor + VSD Medium 11kW
Figure 5.31: Motor + VSD - Medium: Breakdown of environmental impact, by type and life cycle phase.

33
6.2.21 Basecase 21 Motor + VSD Large 110kW
Figure 5.32: Motor + VSD - Large: Breakdown of environmental impact, by type and life cycle phase.

34
6.2.22 Basecase 22 Motor + VSD Very Large 550kW
Figure 5.33: Motor + VSD – Very Large: Breakdown of environmental impact, by type and life cycle phase.
35
6.3 Conclusions
This Task 5 basecase environmental analysis gives the reference point about which subsequent
comparisons of improved technologies (BAT and BNAT) are made (Task 7).
For all types of motor, the energy consumption (in use phase) dominates in almost all types of
environmental impact. This indicates that reducing the energy consumption should be the priority
option for reducing the environmental impact of motors.
The total environmental impact of VSDs is considerably less than that of motors, partly because they
are inherently efficient at mid to high load, and because they will not be used on all motor systems.
However, a watching brief should be maintained in order to identify any cost effective technologies
that might be capable of reducing their losses, especially as the total stock is anticipated to keep
increasing.
The environmental impact of soft starters is extremely small, as normally they are only actually
energized for a short time during motor switch on and switch off. Even during these periods the
losses are quite small. Because of this, they are not analysed any further in this study.
The distinction between motor energy consumption and losses is important, as motors are almost
unique in EUP studies in that most of the energy consumed is used to drive another product – it is
only the internal losses that are of concern.
The need to adequately present the benefits of VSDs has led to the introduction of an additional
basecase of Motor + VSD, which assesses the performance of the combined product as a whole. This
means that new technology products using alternatives to the induction motor can be compared on
an equal basis. In addition, the analysis in this study includes an estimation of the increase in motor
losses when used with a VSD. This will ensure that when other drive products are compared in Task
7, they can be compared on a total losses basis.
Because Permanent Magnet, Synchronous Reluctance and other new technologies are considered to
be improvements on the conventional motors considered here, they do not have a separate
basecase, and instead will be part of the Task 7 analysis.
For both soft starters and VSDs, it is possible that some products have significantly lower standby
power consumption than others, but this is something on which there has been no data. The
breakdown of standby energy consumption is complicated by the many variations in
communications, display and ancillaries, and so is not attempt to assess this has been made.

EuP Lot 30: Electric Motors and Drives
Task 6: Technical analysis of Best Available Technologies (BAT)
ENER/C3/413-2010
Final
June 2014
Anibal de Almeida
Hugh Falkner
João Fong
This document has been prepared for the European Commission however it reflects the views only of the authors, and the Commission cannot be held responsible for any use which may be made of the information contained therein.
ISR – University of Coimbra

2
Contents
6 Introduction .......................................................................................................................... 3
6.1 Small induction motors ................................................................................................. 3
6.2 Electronically commutated / permanent magnet motors ............................................ 4
6.3 Line start permanent magnet motor (LSPMM) ............................................................. 5
6.4 Switched Reluctance motors ......................................................................................... 9
6.5 Synchronous Reluctance Motors ................................................................................ 10
6.6 Brake Motors ............................................................................................................... 10
6.7 Explosion-proof motors ............................................................................................... 10
6.8 VSDs ............................................................................................................................. 11

3
6 Introduction
This section entails a general technical analysis of the best available technologies for products, as defined in section 1. It provides general inputs for the identification of improvement potential when compared to the BaseCases.
6.1 Small induction motors
Joule effect losses are normally dominant in small motors. I2R losses can be reduced by reducing resistance to current flow in the electrical components of a motor. The resistance is dependent on the resistivity of the material used and its geometric dimensions. Resistance is inversely proportional to the cross-sectional area of the material through which current is flowing. Options to reduce I2R losses in inductions motors include:
Increasing the cross-section of stator windings - This modification is where the largest
gains in efficiency are achieved. High efficiency motors typically contain about 20%
more copper than standard efficiency models of equivalent size and rating.
Increasing the cross-section of the rotor conductors.
Use copper rotor bars – Due to the excellent electrical conductivity of copper (57
MS/m compared to 37 MS/m), replacing the aluminium in a rotor's conductor bars
with die-cast copper can produce a significant improvement in the efficiency of an
electrical motor.
Increase size of the end rings.
Reduce rotor bar skew - rotor bars are slightly skewed which helps reduce harmonics
Reducing the skew will help reduce the rotor resistance and reactance, thereby
providing gains in efficiency. However, care must be taken not increase harmonics.
Odd harmonics, can originate cogging and higher magnetic noise.
Reduce the air gap between the stator and rotor - A smaller air gap lowers the
magnetizing current the motor draws to maintain the magnetic field across that gap.
The motor will then require less current to drive the load and thereby reduce I2R
losses. Mechanical boarders (tolerances) and the increase of harmonics limit the
reduction of airgap.
For single-phase motors, adding a secondary “run” capacitor - These motors have two
capacitors in series with the main stator winding. The starting capacitor is connected in
series with a centrifugal switch. The starting capacitor optimizes starting-torque during
the starting period, while the running capacitor optimizes the motor's current flow
leading to better energy efficiency when operating at running speed. When the motor
initially starts with the centrifugal switch in the closed position, both capacitors are
functional. Once the motor gets to about 70%-to-80% of normal operating speed, the
switch disconnects the starting capacitor. Since the run capacitor is NOT wired in series
with the switch, the run capacitor remains functional to optimize the motor's
performance. This design provides optimum levels of both starting-torque and
efficient running characteristics
Magnetic losses occur in the steel laminations of the stator and rotor. They are due to hysteresis and eddy currents, increasing approximately with the square of the flux-density. Options to reduce magnetic losses are:

4
Lengthening the lamination stack - reduces the flux density within the stack, therefore
reducing core losses.
Use of magnetic steel with better magnetic properties - hysteresis losses are reduced
because the magnetic permeability improves and grain size increases, reducing the
magnetic domain resistance. Eddy currents are reduced because the resistivity of the
laminations is higher, reducing the magnitude of the currents.
Reduce the laminations’ thickness - using thinner laminations decreases the cross-
sectional area through which the eddy currents are produced, reducing the magnitude
of the eddy currents.
Ensuring adequate insulation between laminations, thus minimizing the flow of
current (and I²R losses) through the stack and reducing eddy current losses.
Annealing the core steel - After being annealed, the material becomes much easier to
magnetize, which means the magnetic domains reorient more easily reducing
hysteresis losses. Annealing is a heat process whereby a metal is heated to a specific
temperature and then allowed to cool slowly facilitating the diffusion of atoms within
a solid material to relieve internal stresses and refine the structure by making it
homogeneous.
Mechanical losses are caused by friction in the bearings, ventilation and windage losses. Options to reduce mechanical losses include:
Use low friction bearings – These bearings take advantages of better geometry,
materials and lubricant to reduce friction by more than 30% when compared to
standard bearings
Improved cooling – properly designed cooling systems, such as optimized fans, can
help reduce ventilation losses. Improved air flow can also help reduce the power
required to move the fan.
6.2 Electronically commutated / synchronous permanent magnet
motors
An Electronically Commutated (EC) motor also called Brushless DC (BLDC) motor is a rotating electric machine where the stator is a classic three-phase stator like that of an induction motor and the rotor has permanent magnets which create the rotor magnetic field without incurring in excitation losses. The motor rotates in synchronism with the magnetic field, thus eliminating I²R losses in the rotor (no rotor slip losses).
These motors typically require an electronic frequency converter. The AC supply is converted to a DC supply, which feeds a Pulse-Width Modulation (PWM) inverter, which generates a set of three-phase almost sinusoidal waveforms, supplied to the stator windings. To rotate, the stator windings should be energized in a sequence. It is important to know the rotor position in order to understand which winding will be energized following the energizing sequence. and a rotor position sensor (encoder) for proper operation. In some designs the encoder can be replaced by a control algorithm in the converter. Rotor position is sensed using Hall effect sensors embedded into either the stator or the rotor, but new sensorless designs are becoming available.

5
Based on the required magnetic field density in the rotor, the proper magnetic material and geometry is chosen to make the rotor.
Permanent Magnet Motors are a type of synchronous motor. This means the magnetic field generated by the stator and the magnetic field generated by the rotor, rotate at the same frequency. Permanent Magnet Motors do not experience the “slip” that is normally seen in induction motors.
Permanent Magnet Motors present a large savings potential and have been gaining market importance in some particular applications such as high performance motion control, in some types of variable speed fans and also in some high efficiency appliances (e.g. air conditioners).
In the low power range and in applications requiring variable speed control EC/BLDC motors can lead to significant efficiency improvements when compared with variable speed induction motors, as shown in Figure 6-1.
Figure 6-1 Energy efficiency of IM and PM motors in ventilator systems [11]
Some manufacturers sell integrated PMSM+VSD solutions, which achieve full-load efficiency values significantly higher than IE3 class [1].
6.3 Line start permanent magnet motor (LSPMM)
Another very high efficiency technology that has recently been introduced in the market by some manufacturers is the line start permanent magnet motor (LSPMM). As the name implies the motor does not need an electronic controller, being able to start by direct connection to the mains supply. These motors have permanent magnets fitted in the induction motor squirrel cage rotor giving them the ability to start by direct coupling to an AC power source – and, therefore, avoiding the use of a Variable Speed Drive – whilst having very high efficiency during synchronous running.

6
To achieve very high efficiency levels (IE4 – Super Premium) high energy magnetic material such as NeFeB are used for the permanent magnets.
Since the motor operates as a synchronous machine, the induced currents in the rotor are much smaller than in an induction machine and, therefore, rotor joule losses are significantly reduced. In addition, it is possible to achieve unity-power-factor performance, thereby reducing the stator currents and the corresponding losses [2].
One of the main advantages of these “hybrid” motors is their interchangeability with induction motors. Their design enables them to keep the same output /frame ratio as standard induction motors in spite of having very high efficiency, and they do not require electronic motion control as do EC or PM machines since they are able to start from standstill with a fixed-frequency supply.
Although in Table one of the IEC 60034-30-1 draft standard they are identified with “Difficult” for IE4 class and “No” for IE5 class, there are already commercially available LSPMs that meet IE4 levels, and are actually candidates to IE5 class.
Figure 6-2 Rated efficiency levels for commercial 50-Hz, 4-pole LSPMs from 0,55 kW to 7,5 kW and IE3-, IE4- and IE5-class limits defined in the draft of the IEC60034-30-1 Standard [3]
In the early stages of LSPMs development, one of the main initial drawbacks was the starting torque, particularly in loads combining high starting torque and high inertia. Presently, commercial LSPMs can have a maximum allowable load inertia limited to 30 times the motor inertia, which is enough for most industrial loads. The starting torque of commercial 4-pole LSPMs is 2.2 to 2.8 times higher than rated torque for the 0.55-7.5 kW power range. [3]
It is worth noting that the starting “kick” of LSPMs is quite violent, which can lead to accelerated mechanical wear of the motor and load bearings and/or gears (if present). This can

7
be particularly critical in application with frequent start/stop cycles and is one of the major disadvantages of LSPM motors.
A high counter-torque and a high inertia cannot be started at the same time. During start-up, strong oscillating torques create noise and vibration. Therefore, such motors are especially suitable for pumps, fans, compressors and similar applications, i.e. whenever the torque is a function of the square of the speed. They can also be used for conveyor belts due to the low inertia of such applications, provided the starting torque is sufficient. LSPM motors are less suited for hoist drives, lifts and other applications, where overloads can occur and lead to critical situations. In particular, under-voltage is critical and can lead to a loss or failure of synchronization [10].
Permanent magnets
Ferrite magnets have traditionally been used to make permanent magnets in low cost applications. As the technology advances and with decreasing costs, rare earth elements (REE) alloy magnets are gaining popularity. The ferrite magnets are less expensive, but they have the disadvantage of lower flux density for a given volume. In contrast, the alloy material has high magnetic density improving the size-to-weight ratio and give higher torque for the same size motor using ferrite magnets. Samarium Cobalt (SmCo) and the alloy of Neodymium, Ferrite and Boron (NdFeB) are some examples of rare earth alloy magnets used in high performance motors. Continuous research is going on to improve the flux density to compress the motor volume even further.
Figure 6-3 Advances in magnet energy product [4]
Some manufacturers have been able to produce motors, based on an innovative geometry for the motor rotor and stator, using less costly ferrite magnets to deliver the performance level typically found in much more expensive rare earth-based permanent magnet motors.

8
The production of rare-earth alloy permanent magnets for use in these motor technologies presents two problems: (1) the limited supply of REE and (2) the environmental impact of mining and refining these elements.
Although there is currently no inequality between supply and demand of REE if the predicted trend in demand of REE for the production of both electric motors and generators persists will there is no doubt that total REE supply will eventually lag behind total demand [5] [6].
For example, Dysprosium is an essential element in the production of neodymium magnets, which are the most commonly used type of rare-earth magnet in motors, allowing them to maintain their properties at high temperatures.
Past supply has generally been able to keep up with past demand, but current growth rates in production are simply too low to yield future equality, and the necessary ramp-up of production is difficult to achieve . China's Ministry of Commerce (MOC) has recently reduced its export quotas for REEs. China produces 98% of the world's dysprosium, thus changes in China's export policy could severely reduce global dysprosium supply affecting the security of supply. As dysprosium is a heavy rare earth, it exists in much lower concentrations than other . It is therefore hard to ramp up production of dysprosium while still maintaining economic viability. Finally, although many new mines are coming online within the next few years (Lynas and Molycorp), their focus is exclusively on mining light REEs. Thus, the increase in supply due to their increasing production will have almost no effect on net dysprosium supply [6].
Another issue is that REE are mined as a combined ore, and then later separated through chemical processing. Thus, it is impossible to increase production of a given REE without also increasing production of other REEs, although demand can be different.
The mining of REEs also presents a number of environmental concerns. Most rare earth elements are mined through open pit mining, which necessarily causes a disruption to existing ecosystems, involving the loss of wild life habitat, loss of vegetation and alterations in water runoff. The contamination of water supplies through sedimentation, acid drainage, and metals deposition through the production of small, fine particles (tailings) that can be absorbed into the water and ground surrounding a particular mine. If a mining project involves the extraction of a few hundred million metric tons of mineral ore, then the mine project will generate a similar quantity of tailings. The proper disposal of this high-volume toxic waste material is of major importance.
Additionally, the ores containing REEs often contain less savory components such as radioactive thorium and uranium and often contain undesired toxic metals (such as cadmium, lead, and arsenic). These components need to be safely isolated and stored.
Because extracted metal ores need to be purified they undergo a process of refining (beneficiation). This refining process introduces another set of environmental concerns, mostly revolving around the release of metal byproducts into the environment. It is very easy for metals to enter the air, ground, or water sin an environment, and once there it is nearly impossible to remove them.
The environmental consequences that any specific open pit mining operation will have on the natural and cultural environments depends on a number of factors: type of rock and ore being mined, scale and longevity of mining operations, efficiency and effectiveness of environmental management systems and mitigation measures that are employed by mine management, the nature and level of enforcement of government environmental regulations, and the sensitivity

9
of the receiving environment (especially the abundance/scarcity of both surface and ground waters).
Although mining is heavily regulated in developed countries, these laws differ from country to country, making it difficult to quantify the real impacts of REE mining activities, particularly for developing countries.
6.4 Switched Reluctance motors
Switched Reluctance motors are very simple, robust and very reliable. They have a salient pole stator with concentrated excitation windings and a salient pole rotor with no conductors or permanent magnets. A coil is wound around each stator pole and is connected, usually in series, with the coil on the diametrically opposite stator pole to form a phase winding.
The stator features straightforward laminated iron construction with simple coil windings: absence of phase overlaps significantly reduces the risk of inter-phase shorts. The compact and short coil overhangs make efficient use of active coil area (lower copper costs) [7].
Their operation is based on the principle that a salient poles rotor will move to a position of minimum reluctance to the flow of flux in a magnetic circuit. Since inductance is inversely proportional to reluctance, the inductance of a phase winding is maximum when the rotor is in the aligned position, and minimum when the rotor is in the nonaligned position. Therefore, energisation of a phase will cause the rotor to move into alignment with the stator poles, so minimizing the reluctance of the magnetic path.
Unlike induction motors, switched reluctance motors require a power converter circuit, controlling the phase currents to produce continuous motion and torque. Rotor position feedback is used to control phase energisation in an optimal way. Speed can be varied by changing the frequency of the phase current pulses while retaining synchronism with the rotor position.
The non-uniform nature of torque production leads to torque ripple and contributes to acoustic noise.
Figure 6-4 System Efficiency of a SR motor versus induction motor driven by a VFD

10
6.5 Synchronous Reluctance Motors
Synchronous reluctance motors operate based on the same principle as switched reluctance motors the main difference being rotor design. The rotor has an equal number of poles as the stator and the rotor teeth are arranged to introduce internal flux “barriers,” holes which direct the magnetic flux along the so-called direct axis.
The rotor design eliminates rotor cage I2R losses. These motors require an electronic controller (VSD) to operate.
6.6 Brake Motors
Brake motors are electric motors with a mechanical brake fitted at one end.
In most applications, electric motors are not required to stop immediately, instead, electric motors typically slow down and gradually stop after power is removed from the motor, due to a buildup of friction and windage from the internal components of the motor. However, some applications require electric motors to stop quickly. Such motors may employ a brake component that, when engaged, abruptly slows or stops shaft rotation. The brake component attaches to one end of the motor and surrounds a section of the motor’s shaft. During normal operation of the motor, the brake is disengaged from the motor’s shaft—it neither touches nor interferes with the motor’s operation. However, under these conditions, the brake is drawing power from the electric motor’s power source and may be contributing to windage losses, because the brake is an additional rotating component on the motor’s shaft. When power is removed from the electric motor (and brake component), the brake component de- energizes and engages the motor shaft, quickly slowing or stopping rotation of the rotor and shaft components.
Brake motors are often used in intermittent duty applications where quick stopping is required (e.g. automatic machinery, packaging machinery, machine tools, hoisting equipment, etc.). In some of these applications special requirements may be needed such as: heavy starting duty, special torque stiffness and/or breakdown torque characteristics, large number of starts/stop cycles, low inertia, limited starting current.
For applications with a large number of start/stops the increased rotor inertia of a more efficient motor increase the run-up time and the power-consumption during run-up. It will also reduce the permissible number of starts per hour thereby possibly limiting the application’s throughput. Furthermore, when braking is performed by a mechanical braking system, both the wear of the brake disc and the braking-time will increase for motors with higher rotor inertia [8].
Brake motors are capable of achieving the same efficiency levels as induction motors alone.
6.7 Explosion-proof motors
Explosion-proof motors are motors built for operation in environments that contain combustible materials. Because of this the motor must have several special features:
be constructed in such a way that it will be able to completely contain an internal
explosion without rupturing

11
any hot gases escaping the enclosure are forced to exit through long, narrow openings
known as flame paths
must not develop surface temperatures hot enough to cause spontaneous ignition of
hazardous gases in the external atmosphere
no sparking parts can be used
As a result of safety requirements explosion proof motors may face design constraints such as increased air-gap, reduced starting current, enhanced sealing, etc., which have a negative impact on efficiency. Nevertheless, for lower explosion proof levels, higher efficiency classes such as IE3 are possible.
Explosion proof motors require ATEX certification. This certification has to be applied for at an official authority (i.e. PTB/Germany) and may limit the use, allowed environment or allow combination possibilities with other components such as drive controllers.
6.8 Borehole Pump Motors
There are some permanent magnet borehole pump motors, but these require a controller and do not command a significant market share at present. Because they are used in high static head applications, the scope for speed reduction is only modest, but speed control is still used as an efficient solution to regulating water extraction. Currently the UK is seen as the biggest market for variable speed control.
6.9 VSDs
VSD energy consumption depends on the losses in the control circuits: motor control, network connection, Input/Output (I/Os), logic controllers and particularly in the output-switches (30-50%). These losses may vary depending on the capabilities of the VSD.
VSD losses are mainly influenced by the switching frequency (the higher the switching frequency, the higher the losses in the drive) and the output current (which is function of output power and load). However low switching frequency can cause torque ripple.
Transistors - IGBTs (Insulated Gate Bipolar Transistors) and MOSFETs (Field Effect Transistors) - have nearly completely replaced thyristors in inverter circuits below 1 MW. Overall losses, parts count, and driver cost are markedly reduced with these devices resulting in an increasingly competitive product.
The functionality of the drive can also negatively affect its energy consumption but at the same time increase the capability of the system it is integrated and its efficiency either by reducing its energy consumption or by increasing its throughput. VSD capabilities can vary from simply varying motor speed with simple open-loop algorithms, to very complex enhanced on-board software features and embedded PLC functionality, network communications, etc.
It must be noted that the energy benefits from using a VSD always come from decreasing the losses of the system on the load side and that if this benefits can be achieved they surpass the losses in the drive itself.
Harmonics can affect the equipment performance and are both caused by and can interfere with the function of VSDs. Harmonics increase equipment losses and have also raised concerns about excessive currents and heating in transformers and neutral conductors. Harmonic

12
waveforms are characterised by their amplitude and harmonic number. Figure 6-7 shows how the 50 Hz fundamental changes when harmonics are added.
Figure 6-5 Waveform with VSD harmonics: Combined waveform reflects combination of fundamental and harmonics [9].
The harmonics are usually measured not individually, but collectively as total harmonic distortion (THD) which is the RMS value (square root of the sum of the squares) of all the harmonic frequencies, divided by the RMS value of current or voltage.
Line side harmonics caused by VSD´s can be reduced by integrated harmonics filters (i.e. to a level of 40% THdi which will take out most of the energy relevant harmonics like the 5th, 7th, 11th). Additionally, it is possible to employ external passive or active filters which will bring down the THDi level to 5% or less. VSD drives typically employ a B6 rectifier which will extinguish large parts of the harmonics produced by other non-linear loads with a B2 rectifier as being used by switched power supplies for building light, PC´s, etc.
Motors fed from a converter present additional losses, higher than during operation on a sinusoidal system. These additional losses depend on the harmonic spectrum of the impressed supply quantity (either current or voltage) from the converter. Additionally, harmonics may cause significant damage to the motor by producing bearing currents and insulation voltage stress. These problems can be mitigated by:
Keeping the link motor-VSD as short as possible;
Proper grounding;
Proper shielding;
Passive or active harmonic filters;
Isolation transformers.
Sophisticated control techniques have been developed in modern PWM-VSDs, to minimize harmonics, particularly on the motor side.
-1.5
-1
-0.5
0
0.5
1
1.5
0 30 60 90 120 150 180 210 240 270 300 330 360
Phase (degree)
Am
plitu
de
Fundamental
Combined w aveform
5th, 7th, 11th and 13th harmonics

13
The most efficient VSDs present in the market today have approximately 25% lower losses than the average product on the market as defined in Task 5.

14
6.10 Conclusions
There are a number of options to improve the efficiency of small motors both for single-phase and poly-phase motors. It is important to notice that most options involve the use of more active materials
In recent years, the area of energy-efficient motors, in the medium power rang (0,75 kW up to 375 kW) has experienced a fast evolution of motor technologies as shown in the figure below.
Figure 6 7 New energy-efficient motor technologies
Advances in motor design, tighter tolerances, the use of superior magnetic materials, larger copper/aluminium cross-section in the stator and rotor to reduce resistance are just some of the techniques that contribute to lowering the losses in induction motors and allowing them to reach very high (IE4) efficiency levels.
Other technologies, such as permanent magnet synchronous motors and synchronous reluctance motors, have been developed that also reach these high efficiency levels and are actually candidates to IE5 class.
6.11 References
[1] De Almeida, Anibal, Ferreira, J . T . E . Fernando and Fong, João. Standards for efficiency of electric motors - Permanent magnet synchronous motor technology. IEEE Industry Applications Magazine. 2011.
[2] Knight, A. M. and McClay The design of high-efficiency line-start motors, C. I. 6, s.l. : IEEE, Nov-Dec 2000, IEEE Transactions on Industry Applications, Vol. 36, pp. 1555-1562.

15
[3] De Almeida et al, Beyond Induction Motors – Technology Trends to Move Up Efficiency, IEEE Industrial & Commercial Power Systems Conference - accepted for publication in the IEEE Transactions on Industry Applications 2014, Stone Mountain, GA, USA, 2013
[4] Advances in Brushless DC Motor Technology, Control, and Manufacture. Ellis, George. 1996.
[5] Alonso, E., Sherman, A. M., Wallington, T. J., Everson, M. P., Field, F. R., Roth, R., & Kirchain, R. E. (2012). Evaluating rare earth element availability: A case with revolutionary demand from clean technologies. Environmental science and technology, 46, 3406-3414
[6] U.S. Department of Energy, (2012). Critical materials strategy (DOE/PI-0009). Retrieved from website: http://energy.gov/sites/prod/files/DOE_CMS2011_FINAL_Full.pdf
[7] Baoming, G, de Almeida, A e Ferreira, Fernando J.T.E. Design of Transverse Flux Linear Switched Reluctance Motor. IEEE Transaction on Magnetics. January 2009, Vol. 45, No. 1, pp. 113-119.
[8] IEC 60034-31: Guide for the selection and application of energy efficient motors including variable-speed applications. International Electrotechnical Commision. 2010.
[9]De Almeida et al, VSD’s for Electric Motor Systems, SAVE, 2001
[10] M. Doppelbauer, “Line-Start Permanent-Magnet Motors And Their Use In Typical Industrial Applications,” EEMODS, 2013.
[11] Institute of Air Handling and Refrigeration (ILK), Dresden/Germany, Fachbericht, “Untersuchungen zur Energieeffizienz von Ventilatorsystemen”, ILK-B-31-13-3839, June 2013

EuP Lot 30: Electric Motors and Drives
Task 7: Improvement Potential
ENER/C3/413-2010
June 2014
Final
Anibal De Almeida
Hugh Falkner
João Fong

2
Contents 3 Task 7: Policy and Impact Analysis ................................................................................................. 3
3.1 Options .................................................................................................................................... 3
3.2 Basis of analysis for the different products ............................................................................ 3
3.2.1 Induction Motors ............................................................................................................ 3
3.2.2 Variable Speed Drives ..................................................................................................... 4
3.2.3 Submersible Motors ........................................................................................................ 4
3.2.4 Motor + Controllers ........................................................................................................ 4
3.3 Impacts .................................................................................................................................... 6
3.3.1 Key assumptions underpinning environmental impacts ................................................ 6
3.3.2 Environmental impact of improved technology ............................................................. 7
3.4 Costs ........................................................................................................................................ 9
3.5 Analysis LLCC and BAT ............................................................................................................. 9
3.5.1 Ranking of the Design options ........................................................................................ 9
3.5.2 Analysis of indirect impacts of the individual design option ........................................ 12
3.5.3 Impact of cumulative design options – comparison of Net energy savings for each
option 13
3.6 Long-term targets (BNAT) and systems analysis ................................................................... 14
3.6.1 Long term potential of new products ........................................................................... 14
3.6.2 Long term changes in application of motors ................................................................ 15
3.7 Conclusions ........................................................................................................................... 16

3
7 Task 7: Policy and Impact Analysis
7.1 Options
This subtask identifies and describes the individual design options for environmental improvement,
based on the preceding technical analysis in Task 6.
The design options for each of the basecases are presented in Task 6, and are summarised in Table 1.
This table presents each basecase and the related Best Available Technology options (efficiency and
price) for each. It is these different design options that form the basis of the analysis in this section.
7.2 Basis of analysis for the different products
7.2.1 Induction Motors
The efficiencies in this category are taken from the IE classification scheme (IEC60034-30), for 4 pole
50Hz motors. The prices are best estimates from limited available information. An increase of 10%
in stock has been assumed to account for the Brake and Explosion proof motors that were explicitly
excluded from current regulation 640/2009. In all cases the frame size dimensions are kept the
same, although a longer stack is allowed where needed.
NB. Strictly this category should be considered to be “Any line start and run single speed motor”,
but the existing nomenclature is used as it matches closely the existing regulation 640/2009.
For the Small induction motors, 3 phase <0.75kW that are not currently subject to regulation, the
basecase is assumed to be IE1, with IE2 & IE3 shown as options using conventional technology. In
addition, a LSPM motor is shown as BAT3, although any product that is line start and run could in
theory be used as an alternative to an induction motor. It is acknowledged that there are technical
differences which mean that they are not always a direct replacement, but this factor is not critical
for this analysis. For small induction motors, 1 phase < 0.75kW, IE1 is also the assumed basecase.
Two options are shown for improved performance: Addition of a second capacitor to create a
Capacitor Start Capacitor Run motor (BAT1), and additional material (conventional technology) as
BAT2.
For the Medium induction motors, IE2 is the assumed basecase, as this power range (0.75 to
375kW) is already regulated with IE2 as the MEPS. BAT options include achieving IE3 and IE4 with
conventional technology, and also reaching IE4 with an LSPM.
Large induction motors >375kW are currently not regulated, but it is believed that they are typically
at IE2 efficiency. BAT1 is therefore the IE3 level, assumed to be achieved with conventional
induction motor technology. BAT2 and BAT3 represent higher efficiencies achieved through the use
of already available technologies.

4
7.2.2 Variable Speed Drives
The Variable Speed Drives considered in the study are based on PWM inverters for induction motors,
but are considered representative of controllers for all types of motor considered. This is
reasonable on the basis that many VSDs are actually able to control many different types of motor.
There is an advanced draft CENELEC Standard 50598-2 (to be finalized by the end of 2014) that
proposes IE levels for VSD performance.,. In particular the baseline efficiency level for VSDs has
been defined as the IE1 levels.
Little information is available on the standby power losses within VSDs, and so this is something that
should be considered separately.
NB. “BAT1” is actually the industry norm, and so this is used as the basis of comparison of improved
technologies. The Basecase data given represents the most energy intensive products sold, with the
additional energy relating largely to additional functions included in the VSD package. It is the
removal of the basecase that is one of the Policy Options considered.
7.2.3 Submersible Motors
These are analyzed here in order to provide data for their possible inclusion in an Extended Product
Regulation under the LOT29 study on clean water pumps. The only option shown is for an improved
conventional induction motor. Some are supplied with VSDs, but this will be accounted for within
the Extended Product Model being developed as part of LOT29.
7.2.4 Motor + Controllers
In each case it is assumed that the improvement in efficiency is due to the use of a more efficient
motor, both because this is easily quantifiable and the savings from improved VSDs are extremely
modest. The total energy consumption takes account of the losses in the motor and VSD, and
includes an increase in the motor losses due to the harmonic content of the waveform. BAT options
are shown for a conventional IE4 motor, Permanent Magnet and Synchronous reluctance motor.
Analysis of the different technologies is relative to the use of an IE3 motor and basecase VSD. Later
in this Task, separate analysis is shown that identifies the payback of new types of variable speed
motors such as Permanent Magnet and Synchronous Reluctance.
Table 1 shows the key price and energy consumption inputs used in this analysis:

5
Table 1 Assumed efficiency and price of different BAT/BNAT options

6
7.3 Impacts
7.3.1 Key assumptions underpinning environmental impacts
For the motors considered in this study, it was previously shown in Task 5 that it is the energy
consumption that dominated environmental emissions, and so is the focus of the analysis in this
section. In the absence of firm data on the non energy environmental impact of improved induction
motors, the following assumptions have been made:
Production phase. A nominal 20% increase of materials has been assumed for an increase
of one IE level.
Distribution. The distance and the packaged volume are assumed to be the same, as often
the design will comprise a longer stack of active materials within the same casing.
Maintenance. More efficient motors run cooler and so may have a longer time between
maintenance, but this is a modest effect and so is not taken account of.
Disposal. This is assumed to be the same.
If any of these parameters are found at a later stage to be important, further analysis can be
undertaken to refine this data, but from Task 5 analysis it is clear that over the lifetime,
material content is much less significant than the energy consumption.
The use of Permanent Magnet rare earth technology is the most important difference in
terms of material use, and so this is also considered as an option. However, it should also be
noted that the business models for the use of these motors assume the reclamation of this
material, and so in reality the environmental impact of these is spread in time over a large
number of motors.

7
7.3.2 Environmental impact of improved technology
The impact of improved technology is shown in three representative examples of basecases,
showing that for medium and large motors there is only a modest change in other environmental
emissions when moving to the next BAT. For small motors, the difference is larger both because the
efficiency jump is larger and because of the specific design constraints for this size of motor.
Table 2 Basecase 2 Small Motor - 0.37kW- Impact on moving from IE1 Motors to IE3

8
Table 3 Basecase 4 Medium Induction Motor – 11kW- Impact of moving from IE2 to IE3
Table 4 Basecase 6 Large Induction Motor – 550kW – Impact of moving from IE2 to IE3
Data for BAT motor designs was sourced from the EUP LOT 11 Motors study, sections 4.1 and 7.1.
Unfortunately the MEEUP model has no data on permanent magnet material, and so it was not
possible to model the change in material impact of their use to achieve high efficiencies.

9
7.4 Costs
For each design option, the additional cost has been estimated on the basis of incremental cost
relative to the basecase price. See Table 1 for the assumed price of each option.
7.5 Analysis LLCC and BAT
7.5.1 Ranking of the Design options
Methodology for calculation of LLCC
For each design option (BAT), a whole Life Cycle Costing (LCC) is calculated, which sums the following
factors;
Purchase price
+ Installation price
+ Maintenance price
+ Lifetime energy use
As expected for commercial motors, in each case the lifetime energy use was found to dominate the
LCC.
The LCC for each BAT was compared in order to identify the Lease Life Cycle Cost (LLCC) option,
which represents the best purchase option for the motor user (consumer). The breakdown of costs
are summarized in Table 5 and 6. Table 6 and Figure 1 show the total Lifecycle costs of each, with
the LLCC option shown in bold, ( Figure 1).

10
Table 5 Lifetime cost data for different options, by product.
Table 6 Life Cycle Costs of different Options

11
Figure 1 Total Life Cycle costs of different technological options for different product groups
Note that for clarity, all options are shown on the same graph, and so a log LLCC axis is used, with
the important aspect being the identification of the smallest total LLCC. In summary, the technology
options offering the LLCC for each basecase are:
Small Single Phase Induction Motor: Standard induction motor (IE1) with the addition of a second
capacitor to increase efficiency to IE2.
All 3-Phase Motors: IE3 is the LLCC technology in all cases, except for the 110kW basecase where
IE4 is the LLCC, and in general the LCC values for IE4 motors have values close to the values of IE3
motors.
VSDs: The only improvement option is too costly in all sizes, and so the assumed basecase remains
the LLCC.
Motor + Controller: In all cases the SR technology offered the LLCC, followed by the PM technology.
Sensitivity analysis of paybacks of BATs to changes in running hours.
The calculations are based on assumed basecase average duties, but there are some groups of
products such as portable cleaning machinery that will have a distinctly different duty profile. By
undertaking sensitivity analysis of the running hours, the impact on these different groups of
products can be identified through comparing paybacks with different assumed running hours, (see
Task 8 for a detailed sensitivity analysis of these products).
Electricity prices are also predicted to increase, but without information on projected motor prices it
is difficult to ascertain how paybacks might change into the future. The general assumption is that
electricity prices will rise faster, and so looking forward the paybacks shown in this analysis will if
anything be pessimistic.

12
7.5.2 Analysis of indirect impacts of the individual design option
An important issue is that more efficient induction motors inherently have lower slip, and so will run
slightly faster. In uncontrolled systems where advantage of the additional work performed cannot
be taken, then the energy saving will not be as large as hoped. To give an estimate of the magnitude
of this effect, in the worst case (quadratic torque load such as centrifugal fan or pump with low or no
static head), it may be considered that the power consumption will remain the same when a more
efficient motor is used. This might impact 40% of motors installed as replacements. However, in
the longer term this effect will reduce anyway because new motor driven equipment will be
designed to take account of this change in speed. Therefore, the impact of this is not considered to
be material when assessing the long term impact of more efficient motors.
A critical issue in the analysis of VSDs is that the system energy savings that they deliver are many
times greater than the additional losses their use incurs in both the motor and VSD itself. Care must
be taken that any MEPS applied to VSDs do not increase their price sufficiently that their use is
reduced, as this will lose these much larger system savings. Estimates vary, but indicatively a
reduction of 15% - 25% of all motor energy use can be achieved by the use of VSDs. This is
concentrated in applications where there is a high friction flow component, such as pump and fan
systems, and so the saving in those applications where it is technically and economically feasible is
individually much larger than this figure.
The re-bound effect of more efficient motors is thought to be negligible. This is because the
absolute saving in energy on any individual motor is only a few percentage points, and so insufficient
for users to consider using them with less care about their duty cycle or load. The energy savings
from the use of more efficient VSDs are similarly only very small, and so again there is no obvious
rebound effect.
Extended Product Approach
The attribution of energy savings to the use of VSDs and other system controls is considered in detail
in the Extended Product Approach (EPA) being developed within the LOT 28 and 29 Pump studies,
and the Cenelec TC22x committee. It is not yet ready to be used to other systems, and so it is
suggested that this is reviewed at an appropriate time with a view to use with a wider range of
motor driven systems at the time of First Review of any regulations following from this study.
In summary it is expected that this will look at the losses of the motor, controller, transmission and
driven load (fan, pump, compressor etc) under assumed operating conditions. It will therefore draw
on the efficiency levels (MEI) of individual components as analysed in this Preparatory study, and
then combine them to form an overall system energy efficiency index (EEI).
This means that all the motors and VSDs considered in this study will also be included in Extended
Product Approach based regulations for any systems for which they are devised. Care must
therefore be taken to avoid double counting of any energy savings identified. The protocol used in
this study is that the internal losses of the motor and of the VSD are counted in this study, but the
system savings are counted within studies such as LOT28, 29 and 31 pump and compressor studies.
This means that this study looks only at the negative (internal energy loss) aspect of VSDs, with the
system savings that their use enables being accounted for elsewhere.

13
7.5.3 Impact of cumulative design options – comparison of Net energy savings for
each option
Motors
For each motor technology option, the annual energy savings are shown in Figure 2 below. This shows several important features:
Small induction (or fixed speed) motors have the largest energy saving potential of products
considered in this study.
Medium sized induction motors have a smaller energy saving potential, due largely to the existing
regulations having captured much of the savings available. The savings shown relate only to the
motors assumed to take advantage of the “IE2 + VSD” option under current regulation being
changed to IE3.
Figure 2 Annual energy savings for different options, by motor size range, (TWhpa)
Submersible Pump Motors. These only have a small energy saving potential, which will be captured
within LOT29.

14
Variable Speed Drive
Based on the data received, the energy saving potential for VSDs is very small, and cost prohibitive.
However, the use of motors that can only work when connected to a VSD means that the use of a
VSD makes possible BAT4 and 5 motor technologies, as below.
Variable Speed Motor + Controller Options
It is difficult to identify representative prices for products where there are few suppliers, and so the
prices quoted for BAT4 and 5 are subject to a larger uncertainty than for the induction motor. In
addition, as volumes increase, the prices for the improved technologies will fall. This is particularly
true of the Synchronous Reluctance induction motor, where the technology inherently should cost
less to manufacture than an induction motor equivalent.
It is considered that in all cases a universal VSD is used, which is capable of driving any of the types
of motor shown here. On this basis the energy performance of each will be the same, and so these
VSD losses are not included in this comparison. However, there should be negligible induced
harmonic losses in the motors of these new technologies, and so the cost of these losses is
accounted for.
Figure 3 Payback (relative to IE3 induction motor) on BAT for variable speed driven motors
7.6 Long-term targets (BNAT) and systems analysis
7.6.1 Long term potential of new products
The induction motor is over a century old, and while changes in materials and design techniques
have improved it hugely in terms of efficiency and size, the fundamental principles remain the same.
The global focus on improving the efficiency of these products means that the limits of the
technology are now understood, with IE4 seen as the limit beyond which further gains in efficiency
are practically impossible or costly to achieve within the confines of the standard IEC frame sizes and

15
50Hz frequency that are the standard across Europe. Some manufacturers already have IE4 motors
available at commercial or prototype level in some sizes.
The only major new design option is the use of copper for the rotor, which is a practical option
already used by some manufacturers as a way to achieve higher efficiencies within the same volume.
Indicatively this method can achieve at least a further half IE grade1 for the same dimensions.
Disadvantages are a higher cost in some sizes, and higher rotor inertia due to the additional rotor
mass.
Beyond this, Line Start Permanent Magnet motors offer currently offer the only practical
opportunity to achieve higher efficiency. However, this is limited in the maximum size in which it is
available.
A VSD driven induction motor depresses the efficiency of the motor by an estimated 10-16%,
equivalent to about half one IE grade. Further improvements to the high frequency performance of
the motor are expected to help reduce this loss, which should be seen in the context of the large
(often >50%) energy savings in the system that it is controlling.
The energy losses within the VSD itself are small, and should again be seen in the context of the
bigger system savings that they enable.
New types of power semiconductor offer lower losses, both through lower switching losses and
lower on state losses. These might reduce losses by about 25%. This will impact all types of motor
controller by a similar amount, and is the likely basis of the BAT show.
New types of motors that require controllers are slowly being commercialized, which offer superior
energy performance to variable speed induction motors. The offering of motors sold with dedicated
controllers is changing the market towards considering the whole drive package as a “black box”.
This makes it easier for new technologies to gain market share, but until they reach a critical market
share they will always be at a disadvantage compared to the ready availability and inter-
changeability of the induction motor. In the context of this study they represent very best BAT or
BNAT, and so developments in this market should be closely followed to ensure that any policy
options selected encourage their uptake. Currently the two options are: Permanent Magnet and
Synchronous Reluctance.
7.6.2 Long term changes in application of motors
The application of Motor is so broad that no single change in end use will have much impact on the
overall market. However, in countries with a declining industrial base there is a shift from industrial
to commercial applications, with HVAC applications becoming more important. This phenomenon is
behind the growth in the application of VSDs, which are well suited to the varying flows found in
HVAC systems. This is also reflected in an increase in the relative share of smaller motors compared
to larger motors.
1 Reference, International Copper Association

16
7.7 Conclusions
This section has identified the technical improvement options for each of the basecase considered.
Provisional estimates of the energy saving potential of each have been made, with Least Life Cycle
Cost analysis to identify those products that represent the best purchasing option to the consumer.
The analysis has identified the following technically and economically preferred options for each of
the following technologies:
Single Phase and Small Three phase Induction motors: It is economic to increase the efficiency of
these motors to IE2.
Large motors (>375kW to 1000kW): It is economic to increase the efficiency of these motors to IE3.
Excluded motors: Explosion proof and brake motors should be bought into scope, closing a current
loophole.
The cost performance of IE4 motors looks attractive for some medium and large motors, but these
products to dat3 have only limited availability.
VSDs: It is not economic to define a MEPS for VSDs, but it seems relevant to remove from the
market low efficiency units (below IE1 as defined by EN 50598-2)..
Improved variable speed motor technology, in particular Permanent Magnet and Synchronous
Reluctance motors, can offer good energy savings. However, it is unreasonable to set MEPS
regulations at a level that effectively demands these, as they are only available from a small number
of suppliers, and there are technical reasons why they cannot be used in every application.
It should be noted that the wider system energy savings from the use of variable speed controlled
motors is not considered, which would represent considerable further energy savings. This point
should be kept foremost when considering regulatory options.

1
EuP Lot 30: Electric Motors and Drives
Task 8: ENER/C3/413-2010
Final
July 2014
Anibal De Almeida
Hugh Falkner
João Fong

2
Contents 8.1 Introduction ............................................................................................................................ 3
8.2 Policy analysis ......................................................................................................................... 3
8.3 Recommendations on Standardisation Mandates ................................................................. 4
8.4 Energy savings of Policy Options............................................................................................. 4
8.4.1 Basis of projected savings for different measures .......................................................... 4
8.4.2 Projected energy savings by measure ............................................................................ 6
8.4.3 Summary of Energy savings from suggested Policy Options .......................................... 8
8.4.4 Timeline of specific ecodesign measures ........................................................................ 9
8.5 Scenario analysis ................................................................................................................... 10
8.5.1 Type of scenarios considered ........................................................................................ 10
8.6 Sensitivity and Economic Analysis ........................................................................................ 21
8.6.1 Introduction .................................................................................................................. 21
8.6.2 Single phase Induction Motor (0.37kW) ....................................................................... 22
8.6.3 Small Three Phase induction motor (0.37kW) .............................................................. 24
8.6.4 Medium Induction Motor (S) (1.1kW) .......................................................................... 25
8.6.5 Medium Induction Motor (M) (11kW) ......................................................................... 26
8.6.6 Medium Induction Motor (L) (110kW) ......................................................................... 27
8.6.7 Very Large Induction Motor, 550kW Low Voltage ........................................................ 28
8.6.8 Very Large Induction Motor, 550kW Medium Voltage ................................................ 29
8.6.9 Small Submersible Pump Motor (2.2kW)...................................................................... 30
8.6.10 Large Submersible Pump Motor (37kW) ...................................................................... 31
8.6.11 LCC Analysis of Variable Speed Drives .......................................................................... 32
8.7 Impact analysis ...................................................................................................................... 33
8.7.1 Scope of Impact Analysis............................................................................................... 33
8.7.2 Impacts on manufacturers and competition ................................................................ 33
8.7.3 Impacts on customers ................................................................................................... 34
8.7.4 Impacts on innovation and development ..................................................................... 34
8.7.5 Social impacts ................................................................................................................ 35
3.1 Conclusions .............................................................................. Error! Bookmark not defined.

3
8.1 Introduction
This task summarises the outcomes of all previous tasks and tries to identify a suitable selection of
policy options that will lead to the reduction of environmental impacts with consideration to Life
Cycle Cost and the best available technologies in the market. Scenario analysis projects the energy
and economic savings for the period of 2013-2040 from each of these options.
Although Tasks 1-7 set the foundations for future work to be carried out by the European
Commission, Task 8 presents a summary of policies that the authors of the report believe to be
worthy of consideration in order to achieve the desired reduction of the environmental impacts of
electric motors. A sensitivity analysis on some of the key parameters is carried out in order to
examine the robustness of the results.
Note that the preliminary policy options suggested for consideration do not reflect the views of
the European Commission.
Notes on the Analysis in Task 8
Since completion of Task 7, the following changes of assumptions and references have been made.
Care should therefore be taken when comparing the analysis in Tasks 1-7 with the analysis in Task 8.
- The clarification from VSD suppliers that IE1 and not IE0 is the basecase has led to an IE2 VSD now
being considered as BAT1, not BAT2 as previously considered.
- The additional assumption is made that 50% of all medium sized motors are embedded in
machinery that is then exported out of the EU. Additionally, this reduction leads to the total
expected motor electricity consumption in the EU. This accounts for the reduction in energy losses
of these motors shown in Task 8. The environmental benefits of these motors that are exported are
unquantifiable, as many will be sold into markets with MEPS that already demand IE2 or IE3 motors;
but these additional savings will add to the overall global impact of any new policy measures
adopted.
8.2 Policy analysis
The purpose of Task 8 is to suggest the most beneficial policy options on the products studied. In this
section, policy options are identified considering the outcomes of all previous tasks. They are based
on the definition of the product, according to Task 1 and modified/ confirmed by the other tasks.
Specific recommendations to the motors and controls covered by the Lot 30 study are detailed in the
following sub-sections.
Note on underpinning energy calculations:
Some of the options considered in this section require the conversion of electricity into primary
energy. For that purpose, the conversion factor of 2.5 used is derived from Annex II of the Energy
Service Directive (2006/32/EC), reflecting the estimated 40% average EU generation efficiency. This
factor is also used in other parallel Ecodesign preparatory studies.

4
Please note that all other primary energy consumption values presented in this study (Task 5, Task 7
and in the other sections of Task 8) were calculated using the EcoReport tool, as required by the
European Commission to undertake the cost and environmental impact analysis in Ecodesign
preparatory studies.
8.3 Recommendations on Standardisation Mandates
There are no new requirements for standardization mandates to support the proposals for Induction
Motor measures.
This is because there are already well proven and recently revised technical standards in place that
adequately support the measures. These key standards are:
IEC60034-2-1 Rotating electrical machines – Part 2-1: Standard methods for determining losses and efficiency from tests (excluding machines for traction vehicles) IEC60034-30-1 Rotating electrical machines – Part 30-1: Efficiency classes of single-speed, three-
phase, cage-induction motors (IE-code). For motors fed by electronic controllers, IEC 60034-30-2 is
currently under development.
This standard currently only applies to LV motors, and so it is recommended that a mandate be
issued to formally expand this to include MV motors.
For the measures that might apply to submersible pump motors, an industry standard procedure
should be devised to formalize the procedure for changing to horizontal bearings, and for cooling
the motor during testing.
8.4 Energy savings of Policy Options
8.4.1 Basis of projected savings for different measures
Table 1 summarises the energy savings that could in theory be achieved by the implementation of
each different energy saving measure. These measures are further analysed and then selected
measures combined to create the Policy Options discussed in section 3.4. Important Notes:

5
Table 1 Energy Savings from the introduction of different improved technology options, relative to each basecase.
Notes on the interpretation of Table 1:
Not all measures in Table 1 are necessarily economic, and so the most ambitious energy
saving opportunities may not in practice be realizable.
Energy savings are in addition to those claimed for existing regulations.
As previously stated, the VSD BAT1 technology was previously designated as BAT2 in Tasks 1-
7.
Energy savings are all relative to the basecase technology, not the preceding technology
type.
The suggested Policy for each product is based on different BAT levels, and so it would not
be meaningful to totalise for example “All BAT1” options, as it is unlikely that this approach
would yield the most appropriate actions for each product.
The energy savings for medium sized motors BAT1 (IE3) have been adjusted to take account
of the assumed proportion (70%)of the medium sized induction motors sold each year that
are already IE3 rather than the IE2 basecase assumed.
Small induction motor 1-phase. BAT2 is based on the use of additional active material in a
CSIR (Capacitor Start Induction Run) motor. (BAT1 was shown in earlier versions of this
report as a Capacitor Start Capacitor Run motor, which is being used by many US
manufacturers to achieve higher efficiencies. However, subsequent analysis has shown that
the improvement in efficiency by the simple addition of a capacitor for the running mode, is
not sufficient to achieve IE2 efficiency levels.
In each case, the BAT3 column is for designs that are not yet or only just commercially
available products.
For such small motors, the additional weight and volume of using additional material would
be a problem in some weight or size restricted equipment.
Submersible borehole pump. The calculations are based on the IE0 to IE1 step, although the
basecase is actually slightly below the IE0 level. The energy savings shown therefore
represent a slight under-estimate. In addition the lack of an agreed procedure for testing
these water cooled motors means that the values shown here are only approximate.
For small motors, the jump in IE levels from IE1 to IE2 is much bigger than that from IE2 to
IE3, and hence proportionately fewer savings would be gained by moving from IE2 to IE3.

6
Figure 1 Illustration of the much larger jump from IE1 to IE2 than for subsequent IE jumps, explaining the variation in energy savings from each BAT improvement for small motors in particular.
8.4.2 Projected energy savings by measure
Tables 2a,b and Figure 2 summarise the projected energy savings from each of the energy saving
measures subsequently considered for inclusion in the suggested Policy Options. The numbers in
Table 2a are calculated by dividing the total energy saving for a measure by the lifetime of that
product, with the assumption being that the whole stock is changed at a uniform rate over this
time. Where more than one measure applies to a product, the savings for each additional IE level
is the net additional saving from the most ambitious measure.
Table 2 Energy savings of identified measures, by year.

7
Figure 2. Cumulative Energy Savings for all energy saving measures considered.
Notes on the interpretation of Table 2 and Figure 2
Only in some cases is the 2030 time horizon sufficient for the total stock to be changed, and
hence the 2030 total energy saving shown is less than the ultimate energy saving potential.
The suggested start dates for each measure are taken from Table 4.
The noticeable “kink” in 2026 is due to all small motors being changed, and hence the rate at
which total energy savings accumulate after this date is much less.
0.00
5.00
10.00
15.00
20.00
25.00
30.00
2014 2016 2018 2020 2022 2024 2026 2028 2030 2032
Cu
mu
lati
ve E
ne
rgy
Savi
ngs
(TW
h p
a)
Year
MEPS at IE2 for Single Phase Motors
MEPS at IE2 for Small Three Phase Motors
Removal of IE2+VSD option for Medium Induction Motors
MEPS at IE3 for Large Induction Motors
MEPS at IE3 for Brake & Explosion Proof Medium Induction Motors
MEPS at IE4 for Large Induction Motors
MEPS at IE4 for Medium Induction Motors
MEPS at IE4 for Brake & Explosion Proof Medium Induction Motors

8
8.4.3 Summary of Energy savings from suggested Policy Options
These energy saving measures are in some cases combined, giving the Total and 2030 projected energy savings for each of the suggested Policy Options shown in Table 3.
Table 2 Projected energy savings, by Policy Option.
Policy Option Projected Total Energy Saving (TWhpa)
Projected Energy Saving (TWhpa in 2030)
Policy Option 1a. Single Phase Motors to have a MEPS of IE2
4.6 TWhpa 4.6 TWhpa
Policy Option 1b. Small (<0.75 kW) Three Phase Motors to have a MEPS of IE2
9.9 TWhpa 9.9 TWhpa
Policy Option 1c. Large motors (375 – 1,000kW) LV and MV - Extension of existing regulation to introduce Mandatory MEPS at IE3. Of this, 3.1TWhpa is from LV motors, and 1.1TWhpa from MV motors.
4.2 TWhpa 2.9 TWhpa
Policy Option 2. Removal of Option to use an IE2 motor where a VSD is used – all motors 0.75kW – 375kW to be IE3.
2.7 TWhpa 2.7 TWhpa
Policy Option 3. Expanding the types of motor included in existing regulation– Explosion proof and brake motors (Medium sized motors only)
0.95 TWhpa 0.86 TWhpa
Policy Option 4. Mandatory Information Requirements
Not Applicable Not Applicable
Policy Option 5. Mandatory Measures for VSDs , to meet IE1 performance as MEPS
Unknown Unknown
Policy Option 6. Raising of MEPS for medium and large induction motors from IE3 to IE4
9.4 TWhpa (7.9 TWhpa Medium, 1.4 TWhpa Large)
5.6 TWhpa
Total Energy Savings 31.7 TWhpa 26 TWhpa

9
8.4.4 Timeline of specific ecodesign measures
The following table gives the suggested timelines for each of these Policy Options:
Table 3 Suggested Timelines for introduction of Policy Options
Policy Option Implementation Date
Rationale
Policy Option 1. Mandatory MEPS (Minimum Energy Performance Standards):
IE3 for large motors (375kW – 1,000kW LV and MV)
IE2 for all single phase motors >120W
IE2 for all three phase motors 120W – 0.75kW.
1 Jan 2018 This gives sufficient time for all manufacturers to design and bring to market motors that meet these MEPS requirements.
Policy Option 2. Make IE3 the MEPS level for all medium sized motors (0.75kW – 375kW).
1 Jan 2022 Removal of the IE2 option when a motor is sold with a VSD ensures all motors are at IE3 level. These products already exist, but time is needed for manufacturers and the market to adapt to this change.
Policy Option 3. Expanding the types of motor included – MEPS at IE3 for Medium sized (0.75kW – 375kW) Explosion proof and Brake motors.
1 Jan 2018 This analyses the impacts of removing the exemption granted to explosion proof and brake motors under Regulation 640/2009 Leading manufacturers already have these designs available. A tight timeline is therefore suggested.
Policy Option 4. Mandatory Information Requirements.
1 Jan 2018 The date of initiation for this should coincide with the timescales for the motors impacted by Policy Options.
Policy Options 5. Removal of low efficiency VSDs from the market
1 Jan 2018 (Date of first review)
VSDs must meet IE1 performance (as defined in CENELEC EN 50598 standard) Other possible Measures should be considered at the time of first review, by which time further information should be available.
Policy Option 6 Raising of MEPS from IE3 to IE4 for all Medium and Large motors, from 0.75kW to 1,000kW
1 Jan 2022 This gives sufficient time for all manufacturers to design and bring to market motors that meet these MEPS requirements. The timing shown would make this an alternative to Policy Option 2, but the timing of policy Option 2 or 6 could be changed to stagger these in two steps.

10
8.5 Scenario analysis
8.5.1 Type of scenarios considered
Policy Option 1. Mandatory MEPS (Minimum Energy Performance Standards) for small and
large motors set to IE3, (IE2 for single phase motors).
The energy saving for these measures is 23.1TWhpa (measures 1a-c in Table 3)
The current global situation for medium sized induction motors (in the EU the 0.75 – 375kW or 1 –
500hp range), is that leading countries globally are introducing MEPS at IE2, and then IE3.
Extract from regulation 640/2009, Article 3, Ecodesign requirements
1. from 16 June 2011, motors shall not be less efficient than the IE2 efficiency level, as defined in Annex I, point 1;
2. from 1 January 2015:
(i) motors with a rated output of 7,5-375 kW shall not be less efficient than the IE3 efficiency level, as defined in Annex I, point 1, or meet the IE2 efficiency level, as defined in Annex I, point 1, and be equipped with a variable speed drive.
3. from 1 January 2017:
(i) all motors with a rated output of 0,75-375 kW shall not be less efficient than the IE3 efficiency
level, as defined in Annex I, point 1, or meet the IE2 efficiency level, as defined in Annex I, point 1, and
be equipped with a variable speed drive.
Large Induction Motors
The current situation is that for large induction motors, China alone has a MEPS. This indicates that regulating large motors should be seriously considered; if the EU does not follow suit then it might lead to a commercial imbalance for manufacturers trading in these two markets. However, the savings are small and most motors above 375 kW are specified based on total cost of ownership. MV motors are defined as those operating from 1000 V and up to 6600 V. These are commonly designed for an individual site, with detailed design (and hence efficiency) subject to consideration of the impedance and short circuit capability of the local power supply. There are also technical reasons why it can be harder to achieve higher efficiencies than with comparable LV motors:
higher amount of insulation material in the slot (compared to LV motors) leads to a lower cross sectional area of utilizable copper.
higher motor cost requires high reliability of the insulation system (controlled partial discharges).
increased insulation material will reduce the heat transfer parameter.
thinner insulation would decrease the reliability of the motor.
bigger winding overhangs are thermally and mechanically critical.
motor size restrictions and application requirements lead to various cooling methods.

11
It should be noted that according to GB30254-2013 the China Grade 3 mandatory limit values are
generally at a lower efficiency level than IE2.
Figure 2 IEC efficiency levels in comparison with Chinese efficiency levels for MV motors (source: CEMEP)
As shown in the example below, considering the entire power supply and motor combination, it can
be seen that the overall efficiency of a MV motor might be higher than that of a LV motor, even
where the MV motor efficiency is apparently less.
Table 4 Example showing the overall efficiency advantage of a MV motor system (source: CEMEP)
Small Motors
The current situation is that for small motors, the US has already passed a MEPS regulation. Again,
this is a positive indication that adopting MEPS for small motors should be considered. The US
regulations (Figure 3) for single phase motors are between the IE2 and IE3 levels. For the important
smaller sizes, they are close to the IE3 level. However, because of the differences in mains supplies

12
to domestic and light commercial premises, single phase motors are much more common in light
commercial applications in the US than they are in Europe.
Figure 3 US MEPS for small 1-phase motors VS. IEC 60034-30 efficiency levels
Regulations are only proposed for induction (both single phase and three-phase) including shaded
pole motors. Mechanically commutated motors, such as universal motors have too low running
hours to justify regulation, (the brushgear used only has a limited life). This exclusion does not lead
to a loophole, as this limited lifetime means that it would not be practical to use universal motors in
applications that currently use induction motors.
Some of these motors are in domestic products that are already regulated, but in many cases these
would anyway be excluded types (such as in hermetic pumps), and in any case this is not an
automatic reason for not regulating a product. The regulations on circulators used in boilers is an
example of where a product and a component within it are both regulated. It is estimated that 70%
of these motors are sold within products that are themselves already regulated. Swimming pool
pump motors are an example of an application that is not currently regulated, and so would be
captured by this regulation. It is of note that these motors are used in a very wide range of domestic
and commercial applications, and so the 400 hours pa average duty assumed in the calculations will
include many products with much lower annual operating hours. Again, it should be noted that only
motors rated on the basis of continuous duty would be included within the regulation.
Proposed General Exclusion
Motors to be used in portable apparatus where weight is an issue and/or there is a low duty should
be specifically excluded. A possible basis of distinction is:
• Cordless or battery powered products.
• Products whose weight is supported by hand during operation, (e.g. hand held
power tools).
Corded mobile products that move as part of their operation (e.g. mobile cleaning equipment) are
included in scope.

13
Note that for single phase motors, the corresponding IE levels required will be one level below that
of three phase motors. The higher material content, and hence price of single phase motors of the
same size, means that this difference in MEPS will not cause any significant loophole through
applications being changed to single phase to avoid the 3 phase regulation.
→ Policy Option 1 is that the Ecodesign requirement in Article 3ª of the current regulation
640/2009 is extended to the following motors:
Small motors (including induction and shaded pole types), in the ranges;
- Single phase; Motors in the range 120 W and greater.
- Three phase; Motors in the range 120 W up to 0.75 kW.
Large motors (LV and MV) in the range > 375 kW – up to 1000 kW.
Again, this only extends to continuous duty motors.
In summary, this would mean an amendment to the size range in the existing text within Article 3ª,
which would now become
(i) all three phase motors with a rated output of 120 W to 1000 kW shall not be less efficient than
the IE3 efficiency level, as defined in Annex I, point 1, or (for motors with a rated output of 7.5kW to
375kW)) meet the IE2 efficiency level, as defined in Annex I, point 1, and be equipped with a variable
speed drive. All single phase motors with a rated output of greater than or equal to 120W shall not
be less efficient than the IE2 efficiency level, as defined in Annex I, point 1.

14
Policy Option 2. Make IE3 the MEPS level for all motors 0.75kW to 375kW
The Energy Saving for this measure is 2.7TWhpa.
This option is to remove the” IE2+VSD” alternative to the mandatory purchase of an IE3 motor. The
economics of these two options vary with size, but for an 11kW motor the price difference is shown
in Table 5 below:
Table 5. Net price of motor purchase options under regulation 640/2009
11kW Motor options Motor Price (Euros) VSD Price (Euros) Total Price (Euros)
IE3 Motor 690 690
IE2 Motor + VSD 600 1,130 1,730
Price Difference 1,040
This shows that on the basis of economics alone, this concession will not be sufficient to induce
Users to specify a VSD where they would otherwise not have done so. The only exception is where
the saving in motor cost will reduce the payback on investment below the required organisational
threshold, but even here the increase in motor losses needs to be taken into account in order to get
a true total cost of ownership. However, under the existing regulation 640/2009 applicable to
Motors, substantial energy savings were claimed for the increased uptake of VSDs through the
incentive of being able to use a lower cost motor. Because this IE2+VSD concession does not come
into force until 2015, it is impossible at this stage to understand what impact the concession might
have in reality on future sales
It should also be stated that IE3 are not only more efficient than IE2 motors when driven directly
from the power line, but also they have reduced additional load losses when driven by a VSD,1 as
seen in the figure below.
As already stated, it is unclear what impact the concession is really having, but its removal so soon
after implementation would send a negative message about VSDs to motor Users. The timing of
removal of this IE2+VSD concession is therefore critical.
1- Motor efficiency and total losses at full load, with and without VSD, for several 7.5 kW
motors (Source: ISR – University of Coimbra). Note that this only shows the full load performance, not that at part load, which will often be important on inverter driven motors where the duty profiles will mean that they spend proportionately more time operating at part load.

15
Longer term, it is hoped that the Extended Product Approach will be launched and focus attention
on the design of the whole system, with a likely focus on the use of appropriate controls, such as
VSDs. However, until this is launched, the IE2+VSD concession is regarded by the industry as being
the best vehicle for promoting the energy saving benefits of VSDs.
Article 3. from 1 January 2017:
(i) all motors with a rated output of 0,75-375 kW shall not be less efficient than the IE3 efficiency
level, as defined in Annex I, point 1, or meet the IE2 efficiency level, as defined in Annex I, point 1, and
be equipped with a variable speed drive. Currently Canada, Mexico, Switzerland, USA have IE3 as
MEPS with no VSD concession.
The implications of changing a requirement that has not yet come into force would need to be
carefully considered. In addition, enough time should be given for adaptation if IE2 medium size
motors are to be taken out of the market. Hence a delayed implementation date of 2022 is
suggested in order to give 7 years for the existing policy to be used for the promotion of VSDs. At
this time, it is anticipated that the concession will anyway become redundant due to the
introduction of the Extended Product Approach by this time.
→ Policy Option 2 is for the removal of the alternative Ecodesign requirement in Article 3ª (i) of
the current regulation 640/2009 that allows for the use of an IE2 motor where a VSD is used.
Policy Option 3 Expanding the types of motor included – Explosion proof and brake motors
(including medium sized motors)
This measure would save 0.95TWhpa.
The current regulation specifically excludes several types of motor, with two types specified in
Article 2 that it is proposed should be repealed.
Article 2. This Regulation shall not apply to:
……
(c) motors specifically designed to operate:
(vi) in potentially explosive atmospheres as defined in Directive 94/9/EC of the European Parliament and of the Council ( 3 );
(d) brake motors;
Regulation 640/2009 includes an exemption from its application for explosion proof and brake
motors. It has been suggested that brake motors are used in applications with frequent starts-stops
and so the inertia will lead to greater start up losses, but in practice they are usually standard duty
motors with a brake added for additional speed of response. This is therefore considered not to be
an adequate reason for exclusion, and in any case only continuous duty motors are in scope of the
regulation. There is no technical or commercial reason why the exemption would need to be
maintained for either of these types of motor.
Motors with a brake attached. However, brake motors with a special rotor design and when the brake is an integral part of the inner motor construction and can neither be removed nor

16
supplied by a separate power source during the testing of motor, should be excluded from any Regulation
Motors for use in explosion proof atmospheres. For clarity, ExE safety motors with larger clearances should now be specifically excluded.
→Policy Option 3 is the removal of the current exclusion of explosion proof and brake motors.
This would mean the removal of clauses (d) of article 2 of the existing regulation. In addition, clause
(c) (vi) should be amended to :
(c) motors specifically designed to operate:
(vi) Class ExE safety motors. However, those used in potentially explosive atmospheres as defined in Directive 94/9/EC of the European Parliament and of the Council ( 3 ) are explicitly in scope.
Policy Option 4 Mandatory Information Requirements
Information requirements under the existing regulation 640/2009 can reasonably be extended to all types of motor within the proposed extended scope of this regulation. Extract from Annex I of regulation 640/2009
2. PRODUCT INFORMATION REQUIREMENTS ON MOTORS
From 16 June 2011, the information on motors set out in points 1 to 12 shall be visibly displayed on:
(a) the technical documentation of motors;
(b) the technical documentation of products in which motors are incorporated;
(c) free access websites of manufacturers of motors;
(d) free access websites of manufacturers of products in which motors are incorporated.
As regards to the technical documentation, the information must be provided in the order as presented in points 1 to 12. The exact wording used in the list does not need to be repeated. It may be displayed using graphs, figures or symbols rather than text.
1. nominal efficiency (η) at the full, 75 % and 50 % rated load and voltage (U N );
2. efficiency level: ‘IE2’ or ‘IE3’;
3. the year of manufacture;
4. manufacturer’s name or trade mark, commercial registration number and place of manufacturer;
5. product’s model number;
6. number of poles of the motor;
7. the rated power output(s) or range of rated power output (kW);
8. the rated input frequency(s) of the motor (Hz);
9. the rated voltage(s) or range of rated voltage (V);
10. the rated speed(s) or range of rated speed (rpm);
11. information relevant for disassembly, recycling or disposal at end-of-life;
12. information on the range of operating conditions for which the motor is specifically designed:
(i) altitudes above sea-level;
(ii) ambient air temperatures, including for motors with air cooling;
(iii) water coolant temperature at the inlet to the product;
(iv) maximum operating temperature;

17
(v) potentially explosive atmospheres.
The information referred to in points 1, 2 and 3 shall be durably marked on or near the rating plate of the motor.
The information listed in points 1 to 12 does not need to be published on motor manufacturer’s free access website for tailor-made motors with special mechanical and electrical design manufactured on the basis of client request. Information on the mandatory requirement to equip motors, which do not meet the IE3 efficiency level with a variable speed drive, shall be visibly displayed on the rating plate, technical documentation of the motor:
(a) from 1 January 2015 for motors with a rated output of 7,5-375 kW;
(b) from 1 January 2017 for motors with a rated output of 0,75-375 kW.
Manufacturers shall provide information in the technical documentation on any specific precautions that must be taken when motors are assembled, installed, maintained or used with variable speed drives, including information on how to minimise electrical and magnetic fields from variable speed drives.
→ Policy Option 4 is that the existing Product Information requirements within 640/2009 should be extended to include all motors under the extended power range of 0.12 kW to 1000 kW. This would mean a further addition to Annex I regarding the applicability of the information requirements: (c) from 1 January for motors with a rated output of 120W to 1,000kW.
Policy Option 5. Mandatory MEPS for VSDs at IE1
There is insufficient data to estimate the energy savings from this improvement, but it is thought
that they would be small (indicatively <1.0TWhpa), and so no specific energy savings are attributed
to this measure.
No measures relating to Soft Starters are suggested, but measures are proposed for VSDs. The VSD
market is dominated by models with IE1 performance (as defined in CENELEC EN 50598-2 standard)
or above this level. The analysis in this study has made clear that there is currently no economic
justification for setting a MEPS at a level higher than this. However it would be beneficial to remove
from the market VSDs with performance below IE1, mostly being imported into the EU. Although
this market segment is currently small, it would be opportune to put in place this regulation in order
to avoid the risk of the segment growing in future.

18
Table 6. Reference CDM (VSD) losses for IE class 1 definition (values proposed in the draft of EN50598)
PrM / kW Sr,equ / kVA Ir,out / A
of the 400V RCDM pL,RCDM (90,100) / % of Sr,equ
PL,RCDM (90,100) / W
0,12 0,278 0,401 35,87 100
0,18 0,381 0,550 27,31 104
0,25 0,500 0,722 21,82 109
0,37 0,697 1,01 16,86 118
0,55 0,977 1,41 13,22 129
0,75 1,29 1,86 11,03 142
1,1 1,71 2,47 9,53 163
1,5 2,29 3,31 8,23 188
2,2 3,30 4,77 7,21 238
3 4,44 6,41 6,74 299
4 5,85 8,44 6,41 375
5,5 7,94 11,5 6,03 479
7,5 9,95 14,4 5,86 583
11 14,4 20,8 5,45 784
15 19,5 28,1 5,20 1014
18,5 23,9 34,4 5,07 1212
22 28,3 40,8 4,99 1413
30 38,2 55,2 4,89 1866
37 47,0 67,8 4,81 2262
45 56,9 82,1 4,77 2712
55 68,4 98,7 4,76 3252
75 92,8 134 4,71 4370
90 111 160 4,68 5193
110 135 195 4,14 5582
132 162 234 4,12 6679
160 196 283 4,11 8058
200 245 353 4,09 10028
250 302 436 4,12 12445
315 381 550 4,11 15674
355 429 619 4,11 17628
400 483 698 4,11 19866
500 604 872 4,11 24794
560 677 977 4,10 27771
630 761 1099 4,10 31224
710 858 1239 4,10 35187
800 967 1396 4,10 39637
900 1088 1570 4,10 44564
1000 1209 1745 4,10 49521
Key
CDM – Complete Drive Module (VSD)
RCDM – Reference CDM
PrM – Reference Motor rated Power
Sr,equ - Rated apparent output power of the CDM
Ir,out - Rated CDM output current

19
pL,RCDM – Relative power losses of the RCDM, referred to its rated apparent power
PL,RCDM - Electrical power losses of the RCDM
The preceding analysis has shown that it is not cost effective to require the introduction of a MEPS
for VSDs at a higher level than the current basecase models assumed. However, it would be useful
to ensure that the worse performing VSDs are removed from the market, and hence a MEPS at IE1 is
proposed for VSDs. No improved Soft Starter designs were identified, and so no MEPS are proposed.
There is the technical potential for further reduction in losses as technology improves, and as the
understanding and characterisation of VSD losses improves. It is therefore suggested that Policy
Options for relating to VSDs in particular are considered at the time of first revision.
The following aspects in particular of VSDs should be considered, with a view to introducing labelling
requirements.
The Extended Product Approach for motor systems would require the part load efficiency of
VSDs to be stated, based on EN 50598, giving the information required. The technical
specification2 IEC 60034-2-3, regarding the efficiency of converter-fed motors has recently
been approved.
New technologies such as Permanent Magnet and synchronous reluctance motors offer
efficiencies beyond those of VSD driven induction motors, namely in the low power range.
While it would not be justifiable to mandate the use of VSD+motor combinations of these
types, it might be useful to indicate to the user the existence of these improved products
through a labeling requirement. The recently approved classification standard IEC 60034-30-
1 already includes technologies other than induction motors.
It is noted that no other regulations on motor controllers elsewhere in the world have been
identified.
→ Policy Option 5 is that VSDs must meet IE1 performance (as defined in CENELEC EN 50598-2
standard)
Policy Option 6. MEPS raised to IE4 for all medium and Large sized Low Voltage three
phase induction motors (0.75kW to 1,000kW).
This measure would save 9.4 TWhpa.
Based on the flatness of the LCC curve, it can be justified to consider making IE4 the MEPS for all low
voltage motors within scope of the current regulation in the power range 0.75kW to 1000 kW.
However, the sensitivity analysis presented later in this report should be reviewed in order to
understand the cost effectiveness of this measure under a range of operating conditions. It has not
been possible to accurately predict the scope for price reduction through high volume production.
However, there are two reasons to suppose that the scope for further price decrease below the
premum used in the calculations is only modest:
2 Technical Specifications are often published when the subject under question is still under development or
when insufficient consensus for approval of an international standard is available (standardization is seen to be premature).

20
The R&D effort to be recouped is comparatively modest, and if in line with normal product re-
design cycles then the marginal cost of an IE4 design will be even less.
The additional cost is mostly attributed to material costs, which will not be reduced through
higher volume production of a new design.
In addition, the IE3 to IE4 premium is very similar to that of the IE2 to IE3 premium used, and so
gives a good sense check on the validity of the assumed price premium for the IE4 motor. However,
it is suggested that this price premium is monitored and the economics reconsidered at the time of
first review.
IE4 induction motors are already available over a wide power range, although so far with limited
manufacturer availability and very low sales. In addition there are practical considerations that will
need taking into account, including the need to use non-standard frame sizes. So while it is true that
it is technically challenging, especially in the small sizes, it is clearly possible to overcome these
problems and produce commercial products. If the IE4 markets develops well in the next three
years, a new clause may be added to Article 3 of the existing regulation 640/2009:
4. from 1 January 2022:
(i) all motors with a rated output of 0,75-1000 kW shall not be less efficient than the IE4 efficiency
level, as defined in Annex I, point 1.

21
8.6 Sensitivity and Economic Analysis
8.6.1 Introduction
The previous payback calculations are based on assumed basecase average duties, but there are
some groups of products such as portable cleaning machinery that will have a distinctly different
duty profile. By undertaking sensitivity analysis of the running hours, the impact on these different
groups of products can be identified through comparing paybacks with different assumed running
hours. For each motor, the basecase running hours are shown in the caption.
Electricity prices are also predicted to increase, but without information on projected motor prices it
is difficult to ascertain how paybacks might change into the future. While it is expected that
electricity prices will continue to rise, three electricity price scenarios are considered:
0.0935Euro/kWh (basecase), 0.7Euro/kWh (Optimistic) and 0.15Euro/kWh (Pessimistic).
In this section, Life Cycle cost curves are also shown, as the best Payback may not always yield the
Lowest Life Cycle (LCC) cost to the user. Careful comparison of the different methods is needed to
identify the most appropriate Policy Option.
Note that the LCC curves are based on the assumed basecase running hours and cost of electricity,
whereas the Payback curves take account of possible variation in these parameters.
It should be noted that in many cases the scaling of the LCC curves significantly exaggerates the
actual variation in costs between different technologies.

22
8.6.2 Single phase Induction Motor (0.37kW)
Figures 2a & 2b. Payback and LCC analysis: Small induction motor - 1 phase IE1, 0.37kW (400 hours pa basecase).

23
Figure 4c Payback and LCC analysis: Small induction motor - 1 phase IE1, 0.37kW (400 hours pa basecase).
For these small motors, some might have duties as low as 100 hours pa, and so the above diagram
shows the payback seen in this more extreme case. Note that the apparent negative payback at
2,000-3,000 hours is just a function of the smoothing used in the graph plotting, it is not real.

24
8.6.3 Small Three Phase induction motor (0.37kW)
Figures 3a and 3b. Payback and LCC analysis: Small induction motor - 3 phase IE1, 0.37kW (2,000 hours pa basecase)

25
8.6.4 Medium Induction Motor (S) (1.1kW)
Figure 4a and 4b. Payback and LCC Analysis: Medium induction motor (S) - 3 phase IE2, 1.1kW (2,250 hours pa basecase)

26
8.6.5 Medium Induction Motor (M) (11kW)
Figure 5a and 5b. Payback and LCC Analysis: Medium induction motor (M), 11kW - 3 phase IE2, 11kW (3,000 hours pa basecase)

27
8.6.6 Medium Induction Motor (L) (110kW)
Figure 6a and 6b. Payback and LCC analysis: Medium induction motor (L) - 3 phase IE2, (6,000 hours pa basecase).

28
8.6.7 Very Large Induction Motor, 550kW Low Voltage
Figure 7a and 7b. Payback and LCC analysis: Large induction motor - LV IE2, (6,000 hours pa basecase).

29
8.6.8 Very Large Induction Motor, 550kW Medium Voltage
Figure 8a and 8b. Payback and LCC analysis: Large induction motor - MV IE2, (6,000 hours pa basecase).

30
8.6.9 Small Submersible Pump Motor (2.2kW)
Figure 9a and 9b. Payback and LCC Analysis: Small Submersible Pump motor, (1,000 hours pa basecase)

31
8.6.10 Large Submersible Pump Motor (37kW)
Figure 10a and 10b. Payback and LCC analysis: Large Submersible Pump motor, (4,000 hours pa basecase)

32
8.6.11 LCC Analysis of Variable Speed Drives
For VSDs, the market is larger based at the IE1 level, only a small proportion of VSDs are sold at the
IE0 level, and hence IE1 is considered as the basecase. The extremely high relative costs of IE2 VSDs
means that the paybacks are extremely long, and so only a LCC analysis is shown here.
Figure 5 a-e. LCC analysis of VSD options (0.37kW, 1.1kW, 11kW, 110kW, 550kW)

33
8.7 Impact analysis
8.7.1 Scope of Impact Analysis
The Ecodesign requirements should not entail excessive costs nor undermine the competitiveness of
European enterprises and should not have a significant negative impact on consumers or others
users. In this section, the following impacts are assessed:
Impacts on manufacturers and competition;
Impacts on consumers;
Impacts on innovation and development; and
Social impacts.
8.7.2 Impacts on manufacturers and competition
The timeline to implement the MEPS should take into account the development of efficiency test
standards, product redesign cycle and adaptation of production lines. All the technologies described
in this study and considered as improvement options in the scenarios are already available on the
market. As a result, the implementation of MEPS is technically achievable, although it may require
additional expenditure by the manufacturers.
While some manufacturers already have available improved motors available in the EU, not all the
manufacturers include them in their designs, and the launching of these new products will require
some redesign work. Therefore the possible implementation of MEPS could require some
investment in technology and product development, or in adapting their production lines to offer
the more efficient products. For the typical SME manufacturer, the cost of re-designing motors in
the IEC80 to IEC180 frame size range is estimated at 5 MEuro per manufacturer (CEMEP estimate).
The actual additional cost to manufacturers will depend on when new designs were anyway
planned. Hence giving longer time to implementation will reduce the financial impact on them.
There are claims that the efficiency levels demanded for single phase motors will mean that new
specific laminations will need to be designed, as the shared used of three phase laminations will no
longer be possible.
As the considered design improvement options are already understood, the critical issue is the
availability of resources (technical experts and finance) to develop the products. Therefore, a notice
period of at least 24 months from date of agreement on possible measures should be sufficient for
all the manufacturers to redesign their products, adapt the production lines and develop test
methods to verify the compliance with the legal requirements. All suggested measures have this as
a minimum time, with other factors such as the need to make changes to different product ranges
accounting for the longer times suggested for some measures.
The motor market is international, and so manufacturers outside of Europe will also be impacted.
However, there is a move internationally to adopt high levels of efficiency as MEPS, and so raising EU
MEPS in line with these will in many cases not need lead to any additional costs. The EU with first
class manufacturers at World level also benefits from taking a leading role in the promotion of cost-
effective energy-efficient technologies. This is already happening at the standardization level,

34
namely addressing power drive systems. Low volume manufacturers can reduce the investment cost
by purchasing components (for example cases) or sub-assemblies (for example rotors) from third
parties.
Technical standards are in place to support the regulation of low voltage motors in the 120W to
1000kW range.
But work is required to define industry standard testing for submersible pump motors, where
agreement on changing of bearings and motor cooling during test is required.
8.7.3 Impacts on customers
For the improvement options presented in Task 6, the functional unit and the quality of service given
by the improved product will not always remain the same. Key issues include:
Higher efficiency models create less heat and usually have a lower surface temperature,
potentially leading to longer lifetimes. However, the use of Class H insulation in place of
Class F previously used allows higher running temperatures, and so any advantage is less
significant.
LSPM motors have problematic starting behavior.
More efficient induction motors will be longer, that might present mounting problems and
higher transport costs. This will in some cases incur additional re-design costs for the
products they are used on.
More efficient induction motors will be heavier, creating additional cost for transport and
maybe mounting. This additional weight represents a particular problem in portable
equipment.
Synchronous reluctance and converter driven PM motors always require a converter to drive
them, whereas induction motors can run without a controller.
In the case of any additional costs to manufacturers, these could be reflected in a higher purchase
price for customers. However, the lower energy consumption during the use phase would
compensate for the higher purchase price of the motor – the payback times are shown in section
3.5. This would also mean that more capital to purchase the more efficient products would be
required. The scenario analysis already shows some of the expected monetary impacts for users.
8.7.4 Impacts on innovation and development
The proposed policy options will remove inefficient motors and VSDs from the market but it is
unlikely to lead to big technological changes. This happens mainly because the products with the
improvement options identified in this study already exist in the market.
The proposed MEPS can be seen as an opportunity for manufacturers to search for innovative and
efficient technological solutions. As mentioned, it seems that with the current trend of research and
development activities in EU manufacturing companies, it should be feasible that most
manufacturers can meet the proposed requirements.
However, in general the technology required to achieve these levels is well understood; the focus
will be on trying to achieve it at minimum additional cost.

35
8.7.5 Social impacts
Most of the manufacturers of motors have production plants within the EU. Upgrading or changing
production lines in the EU is often viewed as an opportunity to decide whether to relocate the
production plant to another country – within or outside the EU – or not. If performance standards
were set, they are not thought to have a detrimental impact on the number of jobs or the well-being
of the EU manufacturers’ employees.
In addition, the technologies to fulfill the proposed Ecodesign requirements presented do not
require any specific material that might be difficult to obtain within the EU.
8.8 Conclusions
This Task report brings together the findings of the previous tasks of the preparatory study for
Ecodesign requirements of motors and motor controls. It has presented possible Ecodesign
requirements for motors and controls to achieve environmental and economic improvements at EU
level with a potential cost-effective savings of up to 31.2 TWhpa, of which 26 TWhpa is achievable
by 2030.
MEPS for Motor and VSDs
Several of these Policy Options are in line with the already expressed sentiments of many of the
stakeholders following this study:
PO 1: Expansion of scope of existing regulation to include MEPS at IE3 for small and large
three phase induction motors, and at IE2 for single phase motors. Saving 18.7 TWhpa.
PO 3: Removal of the exemption given to explosion proof and brake motors under
Regulation 640/2009. Saving 0.95 TWhpa.
PO 5: Set a MEPS at IE1 for VSDs so as to remove the poorest efficiency models from the
market. Energy savings very small, none attributed to this measure.
In addition, the analysis has identified two further additional options that yield appreciable energy
savings:
PO 2: Removal of the current option to use an IE2 motor instead of an IE3 motor, providing
that a VSD is used. Saving 2.7 TWhpa.
PO 6: Raising of MEPS for medium and large motors to IE4. Saving 9.4 TWhpa.
In addition, PO4 regarding information requirements has no directly attributable energy savings, but
is necessary to increase the scope of the information requirements to support the expanded scope
of proposed motor regulation.
Global harmonization of motor and drive regulations is an advantage to both producers and users of
motors, with the important USA market for example having regulations that can be considered
equivalent to PO1 (small motors only), PO2 and PO3.

36
IE4 motors are at an early stage of development, and currently most appropriate for applications
with long running hours. However, the economics might change in future, and so it is suggested that
if PO6 is not adopted now, it is reconsidered at the time of first review.
Submersible Borehole Pumps
Small energy savings from the introduction of MEPS or submersible borehole pumps have also been
identified. These are usually sold as part of integrated pumps, and so the decision on any measures
related to these products will be made through the stakeholders of LOT29. However, it is
anticipated that any measures would be part of this motor regulation.
Variable Speed Motors
The use of VSDs for saving energy is very important, and although their losses are relatively small, it
seems relevant to remove from the market the lower efficiency units (below IE1).
Task 7 showed how for variable speed applications there are motors that offer lower losses than
conventional induction motors: Permanent Magnet motors offer excellent performance, but are
prohibitively expensive to be used as the basis for MEPS. Synchronous Reluctance motors offer
similar performance but at lower cost, however they are only available from one major supplier.
Both these alternatives to induction motors also lack the essential ability that induction motors
possess of being capable of direct line operation. It was therefore not obvious how MEPS could be
introduced that might effectively remove the induction motor from this market. If any applicable
MEPS was too demanding, users may decide not to use variable speed control at all.