EUG Bike Share Feasibility_Final
116
Eugene Bike Share Feasibility Study June 2014 Prepared by: Toole Design Group Prepared for: Lane Transit District City of Eugene Photo by Evan Bailey
-
Upload
briana-orr -
Category
Documents
-
view
284 -
download
0
Transcript of EUG Bike Share Feasibility_Final

Eugene Bike Share Feasibility
Study
June 2014
Prepared by: Toole Design Group
Prepared for:Lane Transit DistrictCity of Eugene
Photo b
y Evan Bailey

June 16, 2014
Eugene Bike Share Feasibility Study │ii
Contents Executive Summary ...................................................................................................................................... iv
1 Introduction .......................................................................................................................................... 2
1.1 Report Organization ...................................................................................................................... 2
2 What is Bike Share? .............................................................................................................................. 5
3 Benefits of Bike Share ........................................................................................................................... 9
3.1 Mobility, Transportation, and Community Building Benefits ....................................................... 9
3.2 Economic Benefits ....................................................................................................................... 13
3.3 Health Benefits ............................................................................................................................ 15
3.4 Environmental Benefits ............................................................................................................... 16
3.5 Safety Benefits ............................................................................................................................ 17
3.6 Summary of Benefits and Risks ................................................................................................... 21
4 Comparable Cities ............................................................................................................................... 23
4.1 Boulder B-Cycle ........................................................................................................................... 26
4.2 Chattanooga Bike Transit System ............................................................................................... 28
4.3 Fort Worth Bike Sharing .............................................................................................................. 29
4.4 GREENbike – Salt Lake City ......................................................................................................... 29
4.5 Summary of Experience in Peer Cities ........................................................................................ 31
5 System Goals ....................................................................................................................................... 34
6 Public and Stakeholder Engagement .................................................................................................. 36
6.1 Public Input ................................................................................................................................. 36
6.2 Stakeholder Engagement ............................................................................................................ 43
6.3 Compatibility with the University of Oregon Bike Share System ............................................... 45
7 System Planning .................................................................................................................................. 49
7.1 Community Analysis .................................................................................................................... 49
8 Preliminary System Plan ..................................................................................................................... 66
8.1 System Phasing ........................................................................................................................... 66
8.2 Preliminary Station Locations ..................................................................................................... 68
8.3 Permitting and Station Siting Guidelines .................................................................................... 70
9 Business Model Evaluation ................................................................................................................. 74
10 Financial Analysis ................................................................................................................................ 81

June 16, 2014
Eugene Bike Share Feasibility Study │iii
10.1 Financial Pro-Forma .................................................................................................................... 81
10.2 Funding Plan ................................................................................................................................ 89
11 Implementation Plan .......................................................................................................................... 95
11.1 Site Planning and Permitting ....................................................................................................... 95
11.2 Marketing Plan ............................................................................................................................ 98
11.3 Operations Preparation ............................................................................................................ 104
11.4 Performance Standards ............................................................................................................ 105
11.5 Implementation Timeline.......................................................................................................... 106
12 Summary and Conclusion ................................................................................................................. 109
Appendices (under separate cover)
Appendix A – Public Meeting Summary
Appendix B – Online Survey Results
Appendix C – Stakeholder Meeting Themes
Appendix D – Example Memorandum of Understanding from Hubway
Appendix E – Community Analysis Mapping
Appendix F – Preliminary Phase-by-Phase Station Maps
Appendix G – Site Planning Guidelines
Appendix H – Station Examples
Appendix I – Business Model Evaluation
Appendix J – U.S. Bike Share System Data Summary
Appendix K – Sponsorship Examples
Appendix L – Sponsorship Marketing Packet – Portland, OR
Appendix M – Implementation Flow Chart

June 16, 2014
Eugene Bike Share Feasibility Study │iv
Executive Summary Lane Transit District (LTD) and the City of Eugene (City) engaged Toole Design Group to assess the feasibility of implementing a bike share system in Eugene, Oregon. Bike share would build on the City’s existing reputation as a Bicycle Friendly Community and continue efforts to grow bicycling as a transportation mode and integrate it with the region’s transit options.
The University of Oregon is also an important player. The University of Oregon Bike Program is planning to launch a four station bike share system on the University of Oregon campus in 2015 and it is logical that any expansion into the City of Eugene (and potentially to other parts of the region in the future) be integrated with one another, allowing a seamless user experience between jurisdictions.
Bike share is a public transportation option that allows users to access bicycles located at self-service stations around the community and take bicycles from one station to another. The feasibility study explores the benefits and challenges of launching a bike share system, drawing from experience in cities of similar size, with a college presence, and similar transportation infrastructure to Eugene.
Some of the major benefits that bike share could bring to Eugene include:
• Providing an additional transportation option that, combined with other transportation options, presents an opportunity to reduce dependence on automobile transportation.
• Expanding and enhancing existing transit services by providing a first- and last-mile option and an opportunity to relieve already over-capacity transit services.
• Introducing new riders to the benefits of bicycling and spurring new impetus for further investment in bicycling facilities.
• Building on the City’s reputation as a forward-thinking, bicycle-friendly community and using bike share to promote the City to potential employers, residents, and visitors.
The major challenges are:
• Ensuring that sufficient funding is available to support capital, expansion, and ongoing operations. Most bike share systems are not economically self-sustaining from membership and usage fees alone.
• Understanding local policies that may limit the placement of stations and the ability to generate revenue through sponsorship or advertising.
Figure 1: Greenbikes is a Bike Share System in Salt Lake City.

June 16, 2014
Eugene Bike Share Feasibility Study │v
To understand the areas most suited to bike share, the project team undertook a community analysis, a demand mapping exercise, and engaged the public (in person and via the project website) to suggest potential station locations. This information was assembled to produce the phasing and preliminary station plan shown in Figure 2.
The plan calls for a 46 station / 420 bike system to be deployed in five phases starting with the four station system on the University of Oregon campus in 2015. The system would then expand into Downtown, to the Whiteaker, Amazon, and Jefferson Westside neighborhoods as well as into the north side of the Willamette River.
Figure 2: Preliminary Phasing and Station Plan for Eugene Bike Share.
Based on input received from public meetings, online surveys, and stakeholder engagement, a set of goals and objectives were developed for a potential bike share system in Eugene. System priorities include:
1. Personal Mobility: integrating bike share with existing transit services and connecting Downtown Eugene and the University of Oregon.
2. Bicycling, Health, and Safety: increasing the prevalence and role of bicycling in Eugene and encouraging improved health and safety outcomes.
3. System Quality: operating a well-designed and well maintained system that is oriented towards high customer service standards.
4. Long Term Financial Sustainability: ensuring sustainable sources of capital and operations funding relying on minimal local public assistance.
5. Social and Geographic Equity: ensuring the system is accessible and affordable to all socioeconomic groups.

June 16, 2014
Eugene Bike Share Feasibility Study │vi
6. Economic Benefits: create a system that will benefit local business, draw national attention, and attract new employers, residents, and businesses.
After establishing the goals and objectives consideration moved into determining a governance structure for the system that would be able to best achieve local priorities. The most common bike share business models from the United States were assessed, including agency owned and privately operated, non-profit owned and operated, and privately owned and operated. Considering the advantages and disadvantages of each operating model resulted in the selection of a non-profit run system for Eugene. This operating model has the following advantages:
• The non-profit model maximizes fundraising opportunities. • The community-oriented mission of the non-profit aligns with many of the goals of bike share in
Eugene. • The non-profit model is able to span jurisdictional boundaries. • The non-profit model makes for the easiest integration with the University of Oregon system. • The non-profit model transfers risk and financial responsibility away from the public agencies. • The non-profit model maintains transparency through agency representation on the Board of
Directors.
The 46 station / 420 bike system is expected to cost approximately $2.3 million. With University of Oregon already committing $0.2 million to the first four stations, there is a capital funding shortfall of $2.1 million. It is proposed that a capital funding grant be sought from federal or state grant opportunities, which will require a 20-percent local match that could come from the University of Oregon’s campus bike share fund and a combination of private, philanthropic, or local public funding sources.
The system will cost approximately $2.6 million to operate for the first five years. User revenues are expected to cover approximately $1.4 million (or 54-percent) of the operating expenses. The remaining $1.2 million could come from sponsorship or advertising on the stations and bikes, direct contributions from the University of Oregon and other private interests, and local public funding.
A year-by-year breakdown of costs and revenues is included in Table 1.
Figure 3: Riders Using the Fort Worth Bike Share System.

June 16, 2014
Eugene Bike Share Feasibility Study │vii
Table 1: Summary of Funding Need for Eugene Bike Share System
Year 1 Year 2 Year 3 Year 4 Year 5 Total
Capital Cost $ (1.1 M) - $ (0.4 M) $ (0.5 M) $ (0.3 M) $ (2.3 M)
University of Oregon Funding $ 0.2 M - - - - $ 0.2 M
Capital Funding Need $ (0.9 M) - $ (0.4 M) $ (0.5 M) $ (0.3 M) $ (2.1 M)
Operating Cost $ (0.3 M) $ (0.4 M) $ (0.5 M) $ (0.6 M) $ (0.8 M) $ (2.6 M)
User Revenue $ 0.1 M $ 0.2 M $ 0.3 M $ 0.4 M $ 0.4 M $ 1.4 M
Operating Funding Need $ (0.2 M) $ (0.2 M) $ (0.2 M) $ (0.2 M) $ (0.4 M) $ (1.2 M)
Implementation would take anywhere between 12 and 24 months and the process would include:
• Organizing and administering the non-profit. • Fundraising and procurement. • Site planning. • Branding and marketing. • Setting up operations. • Deployment. • System launch.
Based on this analysis, a bike share system in Eugene appears feasible. Partner agencies should begin organizing a non-profit organization charged with taking the concept forward and securing capital funding for the system.

Introduction
Source: Bike Chattanooga

June 16, 2014
Eugene Bike Share Feasibility Study │2
1 Introduction Lane Transit District (LTD) and the City of Eugene (City) engaged Toole Design Group (TDG) to investigate and determine the feasibility of a bike share system in Eugene, Oregon. TDG was also tasked with identifying an appropriate scale and operational model to implement an effective system that complements the proposed bike share system on the University of Oregon campus, integrates with the transit network, provides high visibility and improved mobility options, and draws the attention of potential employers, future residents, and visitors.
There have been several recent initiatives aimed at introducing bike share to Lane County. The City and LTD have actively sought capital funding and previously applied for a Federal Transit Administration (FTA) Livability Grant. While that application was denied, the City recently applied for a ConnectOregon Grant and although it also was not successful, the application showed that there is a groundswell of support for bike share in the community with letters of support provided by developers, businesses, and community organizations. The intent of this study is to focus efforts and to develop a guiding document that can be used as an implementation blueprint for partner agencies and a tool for attracting funding and support for the system.
The University of Oregon was also a partner in the FTA Livability Grant. In 2012, the student government granted the University of Oregon Bike Program $199,000 and agreed to use this funding for FTA Livability grant match requirements. Since the grant was unsuccessful, the funds will be used to purchase and install four stations and 40 bikes on campus in 2015.
Initially, the University of Oregon Bike Program will operate the bike share system on campus. However, they have indicated that operations would likely be turned over to another organization once the system expands beyond the campus1. Membership is likely to be offered at a reduced rate to University of Oregon students, while the general public and faculty / staff will pay more. The service could also become part of the University of Oregon group bus pass program, though this would require coordination with LTD as the group pass program administrator.
An important part of this study is to determine how the University of Oregon system will integrate with an expanded system in Eugene. This includes equipment compatibility, overcoming sponsorship and advertising limitations on the University campus, maintaining compatible fee structures, and contracting and income distribution across multiple jurisdictions.
1.1 Report Organization This feasibility study follows the framework outlined in Figure 1.1. It includes phases for information gathering, goal setting, community and environmental analysis, evaluation of feasibility, system development, and implementation considerations. The completion of each phase resulted in the chapters described below.
1 Based on conversations with Briana Orr, University of Oregon Bike Program Coordinator on November 19, 2013.
“The intent of this study is to focus efforts and to develop a guiding document that can
be used as an implementation blueprint for partner agencies and a tool for attracting funding and support for the program.”

June 16, 2014
Eugene Bike Share Feasibility Study │3
Chapter 1 (this chapter) introduces the purpose of the study and provides background on the past efforts of the City, LTD, and University of Oregon.
Chapter 2 introduces bike share and Chapter 3 describes the economic, transportation, health, environmental, and safety benefits and risks of bike share. Chapter 4 describes the experiences of cities similar to Eugene, identifying how their systems were established and how they overcame certain challenges in those communities.
Chapter 5 outlines the system goals identified by the project partners. These are important as they set the parameters for how the system will be set up and what will constitute success. Chapter 6 outlines the public and stakeholder engagement process, feedback received from that process, and how public comment was incorporated into the study. Chapter 7 presents the results of a community analysis that explores the preparedness of the region for bike share and these results are combined with the proposed system goals and community and stakeholder feedback to develop a preliminary system plan and phasing strategy that is outlined in Chapter 8.
Chapter 9 evaluates different business models that have been used to operate bike share systems in the United States and offers a recommendation on the most appropriate model and the roles of the regional partners under this model.
A financial analysis, which includes a business pro-forma that compares costs and revenues based on experience in other cities, is included in Chapter 10. A potential funding plan for capital and operations is also presented.
Implementation is considered in Chapter 11, including development of an implementation flow chart and advice on station permitting, performance standards, and liability considerations. A marketing plan is also included in this chapter.
Chapter 12 concludes the report with a summary of study outcomes and recommendations. Public process documents, maps, and sample agreements are provided in the appendices.
Information Gathering
Goal Setting
Community & Environmental Analysis
Assess Feasibility
Program Development
Implementation Considerations
Figure 1.1: Feasibility Study Process.

Section I
Background
Source: Capital Bikeshare

June 16, 2014
Eugene Bike Share Feasibility Study │5
2 What is Bike Share? Bike share is an innovative transportation system, whereby system subscribers have access to public bicycles through self-service kiosk locations around the community. The system is accessed through low-cost subscriptions ranging from a few dollars for one-day to between $50 and $100 for annual membership.
There are a number of different bike share technologies available. Most of the systems in the United States utilize “station-based” technology that include a computerized terminal where transactions and information are processed to release and lock the bicycles at a series of connected docks. The components of station-based bike share system are shown on Figure 2.22 and include:
• Station: the collective grouping of the following elements: o Kiosk: the electronic terminal where all rental transactions are made; o Information Panel: a display that can be used to provide maps, information about the system,
and space for advertising; o Dock: the mechanism that holds the bicycles. Each dock has a mechanized locking system that
locks and releases the bicycles;
2 Bike Sharing in the United States: State of the Practice and Guide to Implementation. Federal Highway Administration. United States Department of Transportation. September 2012.
Figure 2.1: Example of a Bike Share System in Minneapolis / St. Paul, MN.
Source: Dunn Bros Coffee

June 16, 2014
Eugene Bike Share Feasibility Study │6
o Platform: the structure that holds the kiosk, information panel, and docks. Most systems utilize wireless technology and solar power so that intrusion into the surface is not necessary. Most systems are modular allowing various sizes and arrangements;
o Bicycle: the bicycles are specifically designed for short trips and constructed of customized components to limit their appeal to theft and vandalism; and
• RFID Card: Radio Frequency Identification technology, usually in the form of a card or fob, allows users to check out a bicycle directly from the dock and speeds up transactions. This also provides an added layer of security and accountability to each transaction.
A bike share member swipes either their membership key or credit card to release a bicycle from the station and returns it to any station within the system service area. The check-in and check-out transactions take a few seconds each. Therefore, bike share is ideal for short distance, point-to-point trips. Most systems allow subscribers to make as many trips as they like without additional charge, provided they return the bicycles to a station within 30 to 60 minutes. Operators generally begin to charge gradually increasing fees after this free period to discourage users from holding onto the bicycles when they are not being used, encouraging turnover and ensuring that bicycles are readily available for other subscribers. In cities across the U.S. bike share systems have proven very popular and successful by giving residents and visitors alike a fast, affordable, easy-to-use transportation option.
Figure 2.2: Components of a Station-Based Bike Share System.

June 16, 2014
Eugene Bike Share Feasibility Study │7
An emerging technology in bike share is the use of “smart bikes” rather than “smart stations”. This technology takes the features of the station-based systems and moves them onto the bicycles. For example, the bicycle shown on Figure 2.3 includes a transaction terminal, a locking mechanism, and a GPS unit on the bicycle itself. This allows more flexibility as to where bicycles can be locked but doesn’t necessarily provide the reliability of knowing where bicycles are compared to the station-based systems. Although, smart-bike vendors are setting up de facto stations using regular bicycle racks to replicate the visibility of bike share stations in the community. In general, smart bike systems are cheaper per bicycle than station-based systems but are largely untested to date in large-scale municipal bike share systems.
For the most part, operators in the United States limit users to those who are over 16 to 18 years old (depending on the city). This is primarily a result of the size of the bicycles being suited to adults and in some areas the requirement for persons under this age to wear a helmet.
Although helmets are not required for adults in any of the currently operating bike share systems, operators do encourage the use of helmets through discount programs, helmet giveaways (often funded by public health and medical partners), locating nearby helmet retailers on the system maps, and through safety messaging. Some cities with helmet laws, and some without, are considering or testing prototypes for helmet vending machines (see Figure 2.4).
Some systems offer independent locks so that users can lock the bicycle while it is still in their possession (e.g. to run an errand at a location without a station). However, the time the bicycle is locked is counted to the user and could impose usage fees.
Figure 2.4: Prototype Helmet Vending Machine in Boston.
Figure 2.3: Example of Technology Integrated into a “Smart Bike”.

June 16, 2014
Eugene Bike Share Feasibility Study │8
Some of the characteristics of bike share are:
• It is oriented to short-term, point-to-point use: most U.S. operators record the average ride at 15 to 20 minutes and between one-to-three miles long;3
• The bicycle can be returned to any number of self-serve bike share stations, including the original check out location;
• Generally, the bicycles are one style and easy to operate with simple components and adjustable seats; and
• The rental transaction is fully automated and there is no need for on-site staff.
As a transportation investment, bike share is relatively inexpensive. A 30 station / 300 bike share system such as those in Chattanooga, Tennessee or Columbus, Ohio, costs in the order of $1.5 million to implement. This is less than one quarter of the cost of constructing a mile of new four lane urban highway.4
They are also relatively quick to implement. Systems typically launch within two years of concept, although some cities have experienced delays from grant funding disbursement, equipment production, force majeure, and other factors. The stations themselves make use of wireless and solar technologies and take less than two hours to install (see Figure 2.5).
3 Bike Sharing in the United States: State of the Practice and Guide to Implementation. Federal Highway Administration. United States Department of Transportation. September 2012. 4 One mile of new four lane urban highway costs$8 - $10 million based on information from the American Road & Transportation Builders Association, accessed online at http://www.artba.org/faqs/#20 on December 12, 2013.
Figure 2.5: Bike Share Station Lifted into Place in Chicago.

June 16, 2014
Eugene Bike Share Feasibility Study │9
3 Benefits of Bike Share Bike share is a relatively inexpensive and quick-to-implement transportation option that can deliver a variety of mobility, economic, health, safety, and quality of life benefits. When combined with other modes of transportation, bike share can provide a fundamental shift in the way people move about and make decisions about transportation.
The benefits of bike share to a community include mobility, economic, health, environmental and safety. For Eugene, bike share could be a means to:
• Expand and enhance existing transit services; • Reduce dependence on automobile transportation; • Introduce new riders to the benefits of bicycling; • Promote the city to potential employers, residents, and visitors; • Provide an economic uplift to local businesses; • Reduce household transportation expenditure; • Improve physical and mental health, and reduce health care costs; and • Reduce greenhouse gas emissions.
These benefits are described in more detail in the sections below.
3.1 Mobility, Transportation, and Community Building Benefits Bike share creates additional mobility in a community by adding transportation options. Bike share trips tend to be short – between one to two miles in length and about 20 minutes in duration. As a result, they provide an option for trips too far to walk and trips too short to wait for transit; a perfect first-mile / last-mile solution to access public transit. Many bike share users combine membership in a bike share system with transit, car-share, walking, and other transportation options to reduce their dependency on automobile travel. In some places, this has resulted in a fundamental shift in trip-making and household vehicle ownership. As well, cities have found that bike share contributes positively to increasing people’s perception and enjoyment of the city and increased social interaction through the physical presence on the stations and through social networking.
Following is a summary of the mobility, transportation, and community building benefits:
• Augments a community’s existing transit system; • Relieves already over-capacity transit services; • Encourages active transportation by lowering barriers to entry; • Provides the impetus for further investment in bicycling facilities; • Contributes positively to people’s attitude towards the City; and • Acts as a conversation starter and increased social interaction.

June 16, 2014
Eugene Bike Share Feasibility Study │10
Transit Benefits
A bike share system complements existing transit services by offering a first- and last-mile option that extends the reach of existing fixed-route services, connects transit lines that do not cross, and adds capacity to already congested transit routes. Following are some examples of how bike share has augmented transit in other cities:
• In New York City, two-thirds of Citi Bike users link their bike share trips with transit and the busiest stations are clustered near transit hubs5. An example of bike share’s role in extending transit can be seen on the Lower East Side. These stations provide a first- and last-mile connection for an area currently under-served by mass transit. Daily usage patterns at these stations follow an outward flow of bicycles from the neighborhood in the morning and a reverse of this pattern in the afternoon;6
• Several cities including New York City and Vancouver, Canada have identified bike share as a means to alleviate over-capacity transit routes by providing an option for bicycling to less crowded stops or to replace certain transit trips altogether;7,8 and
• In Washington D.C. over half (54%) of respondents to Capital Bikeshare’s member survey stated that at least one of their bike share trips in the previous month had started or ended at a Metrorail station and about a quarter (23%) of respondents used bike share to access the bus in the previous month.9
Recognizing that transit agencies are important partners in bike share systems, the Federal Transit Administration (FTA) has funded several different systems including Boston and Chattanooga. To be eligible for FTA funding stations must be within a 3 mile radius of transit and funds can be used towards bike share docks, equipment and other capital costs (the cost of the bicycles and operating costs are not eligible).10
Active Transportation Benefits
Cities across the United States are looking for effective ways to encourage active transportation and promote the benefits of walking and biking. Bike share has proven one of the most effective ways to quickly and affordably introduce new riders to bicycling. In using the momentum around bike share, cities can drive further investment in active transportation.
5 New York City Department of Transportation Press Release (December 12, 2013). After First 200 Days of Citi Bike, NYC DOT Releases New Data Showing that Significant Number of New Yorkers are Biking, Complementing Transit System. 6 For example, view the E 10th Street & Avenue A bike share station in New York: http://bikes.oobrien.com/newyork/. 7 New York City (2009). Bike Share Opportunities in New York City. Accessed online at: http://www.nyc.gov/html/dcp/pdf/transportation/bike_share_complete.pdf on January 2, 2014. 8 Johnston, S. (July 2013). Presentation to Vancouver City Council: City of Vancouver Public Bike Share System. Accessed online at: http://vancouver.ca/files/cov/public-bike-share-staff-presentation-to-council-07232013.pdf on January 2, 2014. 9 LDA Consulting (2013). 2013 Capital Bikeshare Member Survey Report. Accessed online at http://capitalbikeshare.com/assets/pdf/CABI-2013SurveyReport.pdf on December 13, 2013. 10 Federal Transit Administration’s Frequently Asked Questions and Answers Concerning Bike Sharing Relative to the United States Department of Transportation. Accessed online at http://www.fta.dot.gov/documents/Informal_Q_and_As_Final_6-14-12.pdf on December 26, 2013.

June 16, 2014
Eugene Bike Share Feasibility Study │11
Bike share’s ability to reduce some of the common barriers to entry, (i.e., allowing new users to try bicycling without needing to own or store a bicycle) as well as the design of the bicycles and the visibility of the stations has a significant impact in attracting new riders. In Minneapolis for example, 33% of new members surveyed in 2010 by Nice Ride Minnesota had ridden less than once per month before joining.11
In addition, bike share is often coupled with an increase in bicycle infrastructure. Figure 3.1 shows an example of how the City of Boston increased the amount of on-street bikeways in conjunction with the implementation and launch of bike share. While the exact correlation between bike share and investment in bikeways has not been studied, it is clear that utilization of bike share increases the desire for a more comfortable riding environment and may prompt increased investment in the bicycling network as a result of public demand.
Figure 3.1: Increase in On-Street Bikeways in Boston with the Launch of Bike Share.
11 Two-thirds of members also said they had increased their amount of bicycling since joining Nice Ride. Figures taken from Nice Ride 2010 Annual Report.
“Life will never be the same. I’ve always loved getting around by bike, but since I
know so little about bike repair, it only took a flat tire to keep me off bikes for months. Capital Bikeshare got me riding again, so I
use my own bike more and it’s caused me to get my son interested in bicycling as well.”
-Capital Bikeshare annual member.

June 16, 2014
Eugene Bike Share Feasibility Study │12
Community Building Benefits
As well as providing an additional transportation and mobility option for residents and visitors, cities implementing bike share systems have found that there are also a number of positive community-building benefits including:
• People’s perception of the city can be shifted by the presence of bike share. Of Nice Ride Minnesota users surveyed in 2011, 95% agreed or strongly agreed that bike share had made the Twin Cities a more enjoyable place to live;12
• Two-thirds of Capital Bikeshare survey participants reported that they like bicycling because it is “fun”; Eighty-five percent reported that biking is an easier and faster way to get around;13
• After the installation of bike share kiosks in New York City, it was observed that the kiosks created a social space where people meet and gather as well as acting as a conversation starter;14 and
• Social networking is a large part of how bike share systems communicate to users and how users interact with each other. For example, Boston’s Hubway has 6,000 followers and very active interaction among users.
Mobility Risks
Although 20-40% of bike share trips replace single occupancy vehicle trips,5,15,16 the remainder of trips are entirely new trips, augment public transit trips, or may actually replace public transit or walking trips. A full, holistic analysis of the impact of bike share on public transit and active transportation has not been undertaken. However, some bike share trips may replace other public transit or active transportation trips.
Overall Mobility Impacts for Eugene
Overall, in Eugene, bike share could be a positive addition to the existing transportation options. Bike share can not only augment the existing transit network, but can relieve already over-capacity transit services such as the EmX service between Downtown Eugene and the University of Oregon campus. Bike share could be a tool in delaying the need for costly increases in bus service frequency or additional fleet capacity.
Eugene is already recognized as a Gold Bicycle Friendly Community by the League of American Bicyclists. The addition of more bicyclists could provide the impetus for further investment in bicycling facilities.
12 Nice Ride Minnesota Annual Report 2011. Accessed online at: https://www.niceridemn.org/_asset/9n2z8n/ 13 LDA Consulting (2012). Capital Bikeshare 2011 Member Survey Report. Accessed online at http://capitalbikeshare.com/assets/pdf/Capital%20Bikeshare-SurveyReport-Final.pdf on December 3, 2013. 14 Nelson, David M. and David Leyzerovsky. The Social Life of CitiBike Stations. Project for Public Spaces. http://www.pps.org/blog/the-social-life-of-citibike/. December 3, 2013. 15 National League of Cities (2011) Integrating Bike Share Programs into a Sustainable Transportation System. 16 Nice Ride Minnesota (October 2011) Presentation about Nice Ride Minnesota.

June 16, 2014
Eugene Bike Share Feasibility Study │13
3.2 Economic Benefits There are a number of economic benefits that bike share offers at a community, business, and individual level. These include making the community attractive for employers, individual transportation savings, dollars spent by bike share users at local businesses, and bike share memberships as part of employee benefits packages.
Following is a summary of the economic benefits of bike share:
• At a community level, bike share is recognized as a means for attracting or retaining workforce talent and in providing visitors with a unique way to experience the city;
• For businesses, bike share riders spend more money at local businesses, and offer potential employee benefits for employees; and
• For individuals, bike share reduces the costs of transportation and health care.
Community Benefits
A bike share system can help a community attract and retain residents. Many communities see bike share as part of a (re)vitalization effort for their downtown area. In addition, it provides a new and different way for tourists to see a city, helping attract more tourists and their spending power to communities.
The amount of national and international press coverage generated by a bike share system would serve to emphasize the city to visitors, businesses, and employers. For example, the launch of Charlotte B-Cycle in North Carolina received exposure in 18 newspapers including the New York Times.17
A bike share system also creates a small number of local jobs operating and maintaining the system.
Business Benefits
There are many ways that local businesses and employers benefit from bike share. Some of the business benefits of bike share are described below:
• Increased sales: in other cities, businesses located near bike share stations have seen an economic uplift. A recent study of the Nice Ride Minnesota bike share system in Minneapolis / St. Paul found that bike share users spent an additional $150,000 at local businesses over the course of one bike share season compared to the prior year before bike share was implemented18. Increased sales in the bicycle retail sector can also be expected. Although there is limited data available in the United States, in Paris, city-wide bicycle sales increased 39% following the launch of Velib19. The sale of bicycle-related products and accessories could also increase as a result of bike share.
17 From the Sponsor’s Perspective (2013). Accessed online at www.bikeshare.com on December 12, 2013. 18 Schoner, J.E., Harrison, A. and Wang, X. (2012). Sharing to Grow: Economic Activity Associated with Nice Ride Bike Share Stations. Humphrey School of Public Affairs, University of Minnesota. 19 Bike Europe (2007). Strong Shifts in 2007 French Market. Accessed online at http://www.bike-eu.com/Home/General/2008/4/Strong-Shifts-in-2007-French-Market-BIK002778W/ on December 3, 2013.
“Although I am a native to the area, seeing Chattanooga by bicycle adds an entirely new
perspective. It is so nice to slow down, not worry about parking and get to explore and check out
bars, restaurants, and shops you might not regularly. We go downtown and do so much more now with the bike share than we ever did before.”
-Recommendation of Chattanooga Bicycle Transit System on TripAdvisor

June 16, 2014
Eugene Bike Share Feasibility Study │14
• Corporate membership: most bike share systems offer corporate membership packages where annual memberships are purchased in bulk by the organization at a discounted rate. Some systems, such as Hubway in the Boston area, offer packages where employers choose how much of the membership cost they contribute and whether they cover usage fees or not.20 Corporate membership could be offered as part of a company’s travel demand management program, as a way to decrease the inventory of fleet vehicles or vehicle maintenance costs, or as an employee benefit.
• Sponsorship and promotions: most bike share systems offer sponsorship or advertising opportunities on the stations and bicycles. This can range from one large system sponsor to many smaller station-based sponsors. In some communities, sponsors become involved in bike share promotions, such as discounted goods or services for bike share members.
Individual Benefits
The economic benefits to individuals and households come in the form of reduced household expenditure on transportation and health care, which combined make up over 22% of annual average household expenditure in the United States.21 Compared to the cost of operating an automobile, bike share membership is relatively inexpensive with most systems costing between $50 and $100 per year. In comparison, the median cost of annual car ownership is approximately $9,100.22 Eighty-seven percent of annual members in Washington D.C. said they saved money on weekly travel costs by using Capital Bikeshare.9 On average, this resulted in an $800 per year saving on personal transportation costs for these users.
Economic Risks
There are some economic risks related to a bike share system:
• Most bike share systems are not economically self-sustaining, i.e. operating costs are greater than membership and usage fees. Therefore, the responsible organization (public agency, non-profit, or private company) must ensure that the requisite funding is available to support capital purchases, expansion, and ongoing operations. If membership and ridership are not significant, then the cost of operations needs to be recouped through a higher burden on other funding sources;
• Although there have been few examples in the United States of failed systems, should a system not garner membership and ridership, it could act negatively on the city’s image; and
• There has been a fear in many communities that bike share will threaten the local bicycle rental and bicycle retail businesses. Some actions can be taken to reduce this risk, including developing a price structure to deter long term rental of the bike share bicycles and identifying bicycle rental and retail locations on the station maps.
20 Hubway Corporate / University Accounts, accessed online at http://www.thehubway.com/corporate on December 27, 2013. 21 U.S. Department of Labor, Bureau of Labor Statistics, Consumer Expenditure Survey, 2010. 22 For comparison, the median annual cost of car ownership is approximately $9,100 based on information from www.consumerreports.org accessed on December 12, 2013.

June 16, 2014
Eugene Bike Share Feasibility Study │15
Overall Economic Impact on Eugene
Overall, communities that have implemented a bike share system have faced the economic risks, and have overcome them (i.e., no system has shut down due to financial non-compliance). The most impactful potential net benefits to Eugene are:
• Augmenting the image of Eugene as a forward-thinking, bicycle-friendly city to attract and retain students, residents, and visitors;
• Increased likelihood that bike share users will patronize businesses located near a bike share station; • Opportunity for employers and businesses to sponsor, advertise, and provide bike share as an employee
benefit; and • Individual savings on transportation.
3.3 Health Benefits The health benefits of bicycling are well known in helping to address preventable diseases such as obesity, heart disease, and diabetes. As such, bike share can have a positive impact on both physical and mental health.
Physical Health Benefits
Bike share is a means for people to incorporate active transportation into their daily lives and lower medical and health care costs. Bicycling for 30 minutes a day, e.g., using bike share to go to and from work each day, can reduce the risk of heart disease by 82%23 and reduce the risk of diabetes by up to 58%.24
A study of the Bicing bike share system in Barcelona, Spain published in the British Medical Journal in 2011 compared the benefits of increased physical activity to the additional risks introduced from increased inhalation of air pollutants and increased exposure to traffic crashes. The study found that over 10 deaths were avoided each year due to increased physical activity, offsetting any smaller increases in expected deaths from air pollutant inhalation and traffic crash exposure.25
The health benefits of bike share are recognized by the health care industry. The federal government, through the Centers for Disease Control (CDC), has funded several systems including Boston and Nashville. The private sector is also represented with many bike share systems in the United States supported by health care providers such as Blue Cross Blue Shield (Nice Ride Minnesota) and Kaiser Permanente (Denver B-Cycle) through partnerships and sponsorships.17
23 British Medical Association (1992). Cycling Towards Health and Safety. Oxford University Press. 24 Lindström, J. et al. The Finnish Diabetes Prevention Study: Lifestyle intervention and 3-year results on diet and physical activity. Diabetes Care, December 2002, vol. 26 no. 12 3230-3236. Accessed online at http://care.diabetesjournals.org/content/26/12/3230.full on December 13, 2013. 25 Rojas-Rueda, D. et. al. (2011). The Health Risks and Benefits of Cycling in Urban Environments Compared with Car Use: Health Impact Assessment Study. British Medical Journal 2011; 343:d4521. Accessed online at: http://www.bmj.com/content/343/bmj.d4521 on January 2, 2014. Statistics reported are based on the sensitivity analysis that assumes 10% of Bicing trips replace car trips.

June 16, 2014
Eugene Bike Share Feasibility Study │16
Mental Health Benefits
Bike share can also have a positive impact on mental health. Users in other cities have expressed that bike share has positively contributed to an improved outlook, increased recreation, and improved sociability.
Health Risks
Safety is a large concern for bike share users. This risk is described more in the Safety Benefits section below.
Health Impact for Eugene
Overall, bike share can have a positive health impact on Lane County and Eugene. Considering that in Lane County over half of the adult population is obese or overweight,26 bike share can be a useful tool in addressing obesity. Additionally, businesses in the health care industry may be interested in sponsoring part of a bike share system as a prevention strategy.
3.4 Environmental Benefits Bike share can have an impact on reducing greenhouse gas emissions by replacing trips taken previously by automobile. These impacts can be multiplied when bike share is used in combination with transit and other modes to reduce dependence on automobile use, change travel patterns, and increase environmental consciousness.
Reduction in Greenhouse Gas Emissions
In communities where bike share is an active transportation option, surveys have shown that approximately 20 – 40 percent of annual member bike share trips replace what would have been an automobile trip.5,15,16 A survey of Capital Bikeshare members in Washington D.C. in 2011 showed that bike share trips had replaced approximately 4.4 million vehicle miles, representing a 4 percent decrease in the city’s annual driving mileage.27
In its first season of operation, Denver B-Cycle users took over 100,000 trips and rode more than 200,000 miles. A survey of members showed that over 40% of trips replaced a motor vehicle trip, resulting in savings of almost 16,000 gallons of gasoline consumption and avoiding over 300,000 pounds of greenhouse gas emissions.
Increase Environmental Consciousness
Bike share helps to increase environmental consciousness for both individuals and communities as a whole. For individuals, most bike share systems offer member logins where people can track the amount of greenhouse gas emissions avoided through their bike share trips. Employers can use these statistics to help track the organization’s greenhouse gas emission reductions. The data tracked through a bike share system can also be
26 Lane County Health Department (2013). Lane County Community Health Assessment. Accessed online at http://www.scribd.com/fullscreen/185874216?access_key=key-2m3hzkve1a466udwfhsq&allow_share=true&view_mode=scroll on December 10, 2013. 27 Federal Highway Administration, Highway Statistics 2011: Urbanized Areas – 2010 Miles and Daily Vehicle – Miles Traveled. Accessed online at http://www.fhwa.dot.gov/policyinformation/statistics/2011/hm71.cfm on December 27, 2013.

June 16, 2014
Eugene Bike Share Feasibility Study │17
used to foster contests among employees for distance ridden. Such contests are already frequently used with pedometers at workplaces.
Bike share is also a high-profile endeavor for a community which garners significant press attention. In 2011 at the launch of Hubway, Boston Mayor Thomas Menino famously commented, “The car is no longer king”. This quote was memorialized on a Hubway bicycle. The press attention allows politicians to publicly support a popular and convenient transportation system that has a positive environmental benefit. There have been many images of celebrities on bike share bicycles, including Raphael Nadal on Toronto Bixi, Leonardo DeCaprio on Citi Bike, and many images and mentions of Citi Bike on late-night television, including Bruce Willis on David Letterman and Paul McCartney on Saturday Night Live. Such high-profile attention brings attention to the bike share system as well as increases overall environmental awareness.
Environmental Risks
A major part of bike share operations is balancing the system – that is, moving bicycles around from full stations to empty stations to ensure the availability of bicycles and empty docking points. Typically, this operation is undertaken by vans. Because of the relatively high cost and low availability of non-fossil fuel burning options, there are few operations that utilize electric or other environmentally friendly vehicles. There have been no studies on the emissions of such vehicles, or other aspects of operations on the overall environmental impact of a bike share system. However, this negative impact should be noted.
Overall Environmental Impact for Eugene
Overall, a bike share system could provide a positive environmental impact for Eugene, increasing public transit accessibility and usage, lowering single occupancy vehicle trips, and increasing environmental awareness.
3.5 Safety Benefits The safety of bicycling in a community is a significant concern to bike share users. Although still relatively new, bike share has an extremely impressive safety record. To date, no system in the United States has recorded a fatality and the rates of injury crashes are typically lower than private bicycling, as shown on Figure 3.2.28
The safety benefits of bike share include:
• Introducing more riders to a community for a “safety in numbers” effect; • Exposure of riders to road rules and safety hints through safety messaging at bike share stations and
websites; and • Introducing safer bicycles in good repair that feature permanent lighting systems to the community.
28 Only Capital Bikeshare has a higher injury crash rate than private bicycling. It is uncertain why the injury crash rate is higher in Capital Bikeshare than in other systems and higher than the private bicycling rate.

June 16, 2014
Eugene Bike Share Feasibility Study │18
Figure 3.2: Comparison of Injury Rates for Bike Share and Private Bicycling.29
Safety in Numbers
Millions of bike share trips were taken in almost 30 U.S. cities in 2013 significantly increasing the number of bicycling trips in these cities. For example, in New York, there were an additional 40,000 bicycle trips per day due to Citi Bike and bike share trips made up approximately 29% of the 113,000 daily bicycle trips made within the bike share service area. Bike share has been effective in attracting new and previously infrequent bicyclists. A survey of Hubway members in Boston found that 12% bicycled less than once per year prior to joining Hubway and a further 16% bicycled less than once per month prior to joining.30
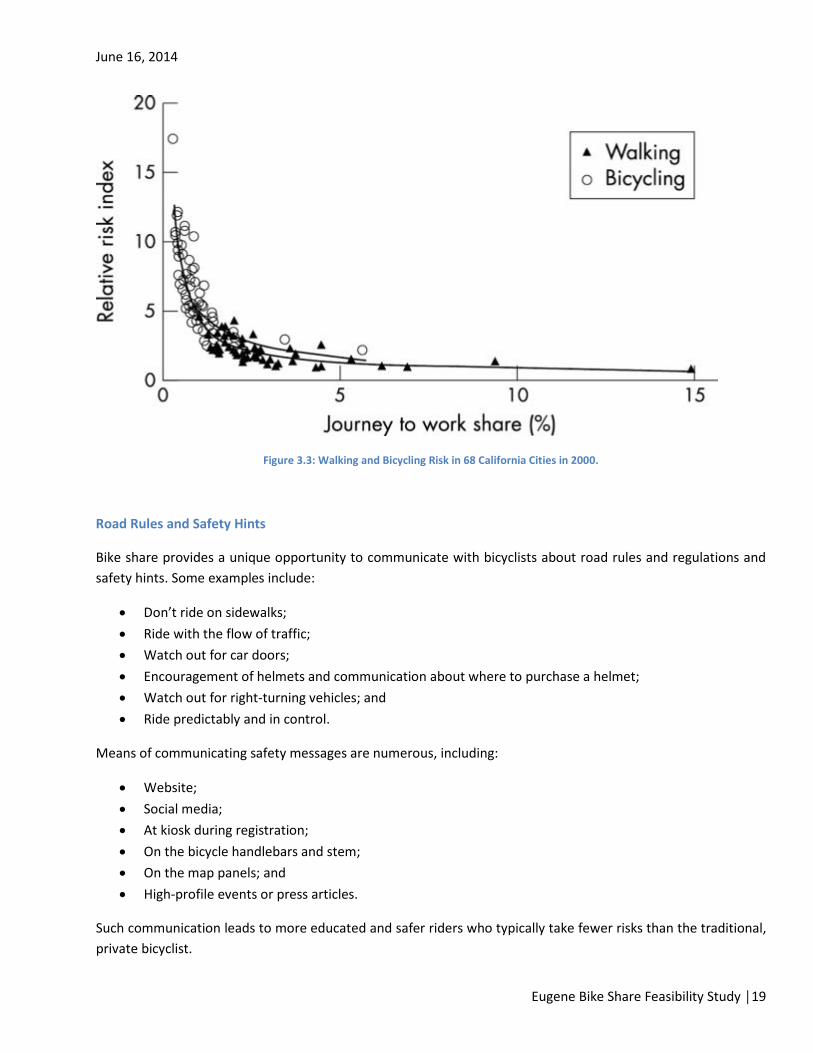
Along with the high visibility of stations, the high volume of riders result in greater awareness of bicyclists by drivers. In fact, the “safety in numbers effect” is well established. A study published in Injury Prevention in 2003 showed that the “likelihood of a person walking or bicycling being struck by a motorist varies inversely with the amount of walking and bicycling”.31 Figure 3.3 shows how the injury rate (referred to as “relative risk index” in Figure 3.3) reduces exponentially with the number of cyclists using the road system (in this case using journey to work mode share as a proxy for the overall amount of bicycling).
29 Injury rates for private bicycling obtained from: Beck, L. et al. (2007). Motor Vehicle Crash Injury Rates by Mode of Travel, United States. Published in the American Journal of Epidemiology. 30 Presentation titled The Hubway Influence on New Riders given by Nicole Freedman, 2013. Accessed online at: http://baystateroads.eot.state.ma.us/movingtogether/docs/Freedman-Moving%20Together%202013.ppt.pdf. 31 Jacobsen, P.L. (2003). Safety in Numbers: More Walkers and Bicyclists, Safer Walking and Bicycling. Injury Prevention 2003;9:205-209.
June 16, 2014
Eugene Bike Share Feasibility Study │19
Figure 3.3: Walking and Bicycling Risk in 68 California Cities in 2000.
Road Rules and Safety Hints
Bike share provides a unique opportunity to communicate with bicyclists about road rules and regulations and safety hints. Some examples include:
• Don’t ride on sidewalks; • Ride with the flow of traffic; • Watch out for car doors; • Encouragement of helmets and communication about where to purchase a helmet; • Watch out for right-turning vehicles; and • Ride predictably and in control.
Means of communicating safety messages are numerous, including:
• Website; • Social media; • At kiosk during registration; • On the bicycle handlebars and stem; • On the map panels; and • High-profile events or press articles.
Such communication leads to more educated and safer riders who typically take fewer risks than the traditional, private bicyclist.

June 16, 2014
Eugene Bike Share Feasibility Study │20
Safe Bicycles
The strong safety record of bike share is also impacted by the introduction of bicycles with many safety features. These are shown on Figure 3.4 and include:
• Built-in safety features such as front and rear lights, brakes, and reflectors; • An upright position of the rider; and • A heavy bicycle (typically 40-45 lbs.) with wide handlebars where riders generally keep slow speeds and
do not weave in traffic.
In addition, the operator undertakes regular maintenance of the bicycle fleet to ensure safety.
Figure 3.4: Safety Features of Bike Share Bicycle.32
32 Atlanta Bicycle Coalition (2013). Atlanta – Decatur Bike Share Feasibility Study. Accessed online at: http://issuu.com/atlantabike/docs/atl-dec_bikeshare_book_lowres# on January 2, 2014.
Sturdy tires and wheels for urban riding
Step-through frame provides durability and a universal fit
Multiple gears allow users to adjust effort for a variety of terrain and traffic conditions
Adjustable seats allow quick sizing
Basket for purse or bags
Front and rear lights improve visibility during day and night

June 16, 2014
Eugene Bike Share Feasibility Study │21
Safety Risks
Many communities have had strong concerns about safety prior to implementation, including:
• Lack of bicycle infrastructure for safe bicycling; • Introducing inexperienced riders to the streets; • Low helmet usage rate among bike share users (a study of bike share trips in Boston and Washington
D.C. showed that less than 20% of bike share riders wore a helmet)33; and • Pedestrian concerns of riders breaking rules such as riding on the sidewalk or against traffic (particularly
for the elderly pedestrian population).
Overall Safety Impact on Eugene
Although the safety risks are real and should be considered and mitigated for a system in Eugene, none of these fears have proven to be a large factor once a system is up and running in a city. This is evidenced by the aforementioned strong safety record of bike share in almost all communities that it has been introduced.
3.6 Summary of Benefits and Risks Bike share provides a multitude of mobility, transportation, community-building, economic, health, environmental and safety benefits. However, there are also risks associated with launching a bike share system.
Some of the major benefits that bike share could bring to Eugene include:
• Providing an additional transportation option that by itself or combined with other options presents an opportunity to reduce dependence on automobile transportation;
• Expand and enhance existing transit services providing a first- and last-mile option and an opportunity to relieve already over-capacity transit services;
• Introducing new riders to the benefits of bicycling and spurring new impetus for further investment in bicycling facilities;
• Building on the City’s reputation as a forward-thinking, bicycle-friendly community and using bike share to promote the city to potential employers, residents, and visitors;
• Providing an economic uplift to local businesses; • Reducing household transportation expenditure; • Improve physical and mental health and reduce health care costs; • Reduce greenhouse gas emissions and increase environmental consciousness; • Introducing more riders on safely designed and well maintained bicycles to positively contribute to the
safety in numbers effect; and • Introducing new opportunities to promote safety messaging to all road users.
The major risks include: 33 Fischer, C.M. et al. (2012). Prevalence of Bicycle Helmet Use by Users of Public Bikeshare Programs. Published in the Annals of Emergency Medicine, Vol. 60, Issue 2, pp. 228-231.

June 16, 2014
Eugene Bike Share Feasibility Study │22
• The possibility that some bike share trips may replace other public transit or active transportation trips; • The need to ensure that sufficient funding is available to support capital, expansion, and ongoing
operations. Most bike share systems are not economically self-sustaining from membership and usage fees alone;
• Concerns that bike share may threaten the local bicycle rental and retail markets; and • Ensuring that rebalancing efforts do not offset the greenhouse gas emission benefits of the system.

June 16, 2014
Eugene Bike Share Feasibility Study │23
4 Comparable Cities Most of the major North American bike share systems launched after 2010. Several systems, in cities of comparable size to Eugene, have come on line recently and provide a unique opportunity to deliver data for this feasibility study. Four peer cities were selected from among active systems based on their similarities in population size, system scale, integration with transit, and proximity to a major university campus. The selected systems also highlight several different ownership and operational models. Characteristics of the following peer cities are summarized in Table 4.1 and discussed in more detail below:
• Boulder B-Cycle: Boulder, CO (120 bikes / 23 stations); • Chattanooga Bike Transit System: Chattanooga, TN (300 bikes / 30 stations); • Fort Worth Bike Sharing: Fort Worth, TX (300 bikes / 27 stations); and • GREENbike: Salt Lake City, UT (85 bikes / 12 stations).
From Table 4.1 the following comparisons can be drawn:
• Station densities vary significantly ranging from 2.1 stations / sq. mi. in Boulder to 15.5 stations / sq. mi. in Chattanooga. Higher densities are generally seen as more conducive to a successful bike share system allowing stations to be close by no matter where a user is in the system. However, in the case of Chattanooga, the system is only 2 square miles in area making many point-to-point trips a short walk;
• The number of bicycles provided per station also ranges from just over 5 bikes per station in Salt Lake City (although this system is still growing and will likely increase this ratio in the future) to 10 bikes per station in Fort Worth. In all systems a significant portion of open docks are provided with the minimum ratio being 1.5 docks per bike. This is typically considered by operators as the lowest acceptable ratio in terms of how often the bicycles need to be redistributed. Higher dock ratios such as the 1.8 to 1.9 docks per bike in Boulder and Chattanooga are more typical and allow less frequent rebalancing;
• The fee structures for the case study cities are very similar with all offering annual membership for between $65 and $80 per year, and 24-hour membership for between $5 and $8. Some systems offer 3-day, weekly, or monthly membership options. Three of the systems offer the user the first 60 minutes for free before charging additional fees. These fees vary from $3 per half hour to $5 per half hour; and
• All systems operate year-round and (except for Boulder) for 24-hours a day.
Performance data for the four peer city bike share systems are shown on Table 4.2. For two of these cities, Boulder and Chattanooga, full year data from the second year of operations is presented. For Fort Worth and Salt Lake City, partial year data from the first year of operations is included because these systems started more recently.

June 16, 2014
Eugene Bike Share Feasibility Study │24
Table 4.1: Bike Share Case Study System Characteristics34
Boulder B-Cycle (started: May 20, 2011)
Chattanooga Bike Transit System (started: July 23, 2012)
Fort Worth Bike Sharing (started: April 22, 2013)
Salt Lake City GREENbike (started: April, 2013)
Population 102,000 171,000 778,000 189,000
System Characteristics
22 stations 150 bikes 279 docks
31 stations 300 bikes 547 docks
30 stations 300 bikes 450 docks
12 stations 65 bikes
182 docks
Service Area 10.6 sq.mi. 2.0 sq.mi. - -
System Ratios 2.1 stations / sq.mi. 6.8 bikes / station 1.86 docks / bike
15.5 stations / sq.mi. 9.7 bikes / station 1.82 docks / bike
10 bikes / station 1.5 docks / bike
5.4 bikes / station 2.8 docks / bike
Membership Cost $65 annual $20 weekly $7 24-hour
$75 annual $6 24-hour
$80 annual $30 monthly $20 weekly $15 3-day
$8 24-hour
$75 annual $15 weekly $5 24-hour
Trip Fees First 60 minutes free $4.50 / additional half hour
First 60 minutes free $5.00 / additional half hour
First 60 minutes free $3.00 / additional half hour
First 30 minutes free $2.00 / second half hour
$5.00 / additional half hour
Operating Practices Year-round, 5am to midnight Year-round, 24-hours a day Year-round, 24-hours a day Year-round, 24-hours a day
Average High Temperatures 88 F (summer) / 45 F (winter) 90 F (summer) / 50 F (winter) 97 F (summer) / 57 F (winter) 90 F (summer) / 38 F (winter)
Average Monthly Precipitation 1.8” (summer) / 0.9” (winter) 4.9” (summer) / 4.9” (winter) 1.9” (summer) / 1.9” (winter) 0.6” (summer) / 1.5” (winter)
34 Maps taken from screenshots of http://bikes.oobrien.com/global.php.

June 16, 2014
Eugene Bike Share Feasibility Study │25
Table 4.2: Performance Metrics for Case Study Bike Share Systems
Boulder B-Cycle
(started: May 20, 2011)
Chattanooga Bike Transit System
(started: July 23, 2012)
Fort Worth Bike Sharing
(started: April 22, 2013)
Salt Lake City GREENbike
(started: April, 2013)
System Characteristics 22 stations 150 bikes 279 docks
31 stations 300 bikes 547 docks
30 stations 300 bikes 450 docks
12 stations 65 bikes
182 docks DATA CHARACTERISTICS Data for the Period 2012 Aug 2012 – Jul 2013 2013 (partial) 2013 (partial) Days in Operation 250 365 183 248 MEMBERSHIP CHARACTERISTICS Casual Members 9,059 8,578 7,000 - Annual Members 869 696 383 -
RIDERSHIP CHARACTERISTICS Casual Trips 11,786 - 9,783 - Annual Member Trips 13,568 - 5,637 - Total Trips 25,354 32,000 15,420 26,000
PERFORMANCE METRICS Annual Members / Population
0.85% 0.41% 0.05% -
Casual Members / Station 410 275 235 - Trips per Casual Member 1.3 1.8 1.4 - Trips per Annual Member 15.6 23.3 14.7 (6 months) - Trips per Bike per Day 0.81 0.29 0.28 1.61
Farebox Recovery35 36% 26% - 30%
In terms of membership draw, Boulder has been very successful in attracting high volumes of annual and casual members relative to the population of the city. Annual membership success in Boulder is likely a result of the community-based business model used to start the system and follow-on from early membership drives to support the system. The high number of visitors and tourists to Boulder drives the high casual membership. Eugene could expect to see relatively high rates of annual membership uptake (the average of the peer cities represents an uptake rate of approximately 0.4% of the population purchasing annual membership). Casual membership could be expected to draw up to 250 casual members per station per year.
The number of trips made per bike per day varies amongst the peer cities. Salt Lake City has a high ridership rate with each bicycle being ridden an average of 1.6 times per day. This is comparable with larger, more established cities such as Denver and Minneapolis that record approximately 1.0 to 1.5 trips per bike per day. However, smaller markets typically observe lower ridership rates. Boulder sees an average of 0.8 trips per bike per day, a lot coming from its high number of casual users. Chattanooga and Fort Worth are lower still with approximately 0.3 trips per bike per day. The system in Fort Worth is still establishing and results in Chattanooga could be
35 Farebox recovery is the amount of operating cost recouped by membership and usage charges.

June 16, 2014
Eugene Bike Share Feasibility Study │26
influenced by some early technical difficulties as well as delays in opening the system (i.e. losing the momentum of early excitement around the system) as well as the small area covered by the system.
Financial information is not available for all of the case study cities, however, information from the Boulder B-Cycle system shows that operating revenues come from a combination of sponsorships (38%), contributions (26%), memberships (25%), usage fees (10%), and other sources (1%).36
Farebox recovery, which represents the amount of operating cost recouped by membership and user fees, is presented for Boulder and Chattanooga. These cities recorded recoveries of 36% and 26% in 2012 respectively. For comparison, farebox recoveries in larger cities include 54% in Denver and Minneapolis, 60% in Toronto, and 88% in Boston in 2012. Traditional transit services such as those provided by LTD typically recover around 20% of their operating costs.37
4.1 Boulder B-Cycle Boulder B-Cycle is a public - private partnership between the City of Boulder and a non-profit group that owns and operates the system. Boulder B-Cycle was formed by individuals interested in bringing bike share to the city.38 The system initially launched in May 2011 with 85 bikes at 12 stations and has since expanded to 150 bikes at the 22 stations shown on Figure 4.1. In 2012, Boulder B-Cycle had 869 annual members and over 9,000 casual users and recorded over 25,000 rides.39
Capital funding was obtained through a combination of federal, state, and local government grants and gifts from individuals and businesses in the community. The City of Boulder is a major partner and has an agreement with Boulder B-Cycle that it will pursue grant funding for capital expansion with Boulder B-Cycle responsible for securing any local match. As of June 2013, the City had contributed $330,800 of city funds and $332,733 of state and federal grants to purchase 18 of the 22 stations. The other four stations were funded through the Boulder County Capital Improvement Fund (2 stations), a grant from the University of Colorado student group (1 station), and contributions from a private property owner (1 station).40
The system is set to expand to 32 stations and 200 bikes through a Federal Highway Administration (FHWA) Transportation, Community, and System Preservation (TCSP) grant secured by the City. Grant matches are fundraised by Boulder B-Cycle through grass-roots campaigns targeted towards individuals and businesses in the community and businesses and property owners adjacent to the stations.
36 Boulder B-Cycle 2012 Annual Report. 37 Lane Transit District, 2012-2013 Comprehensive Annual Financial Report for fiscal year ended June 30, 2013. http://www.ltd.org/pdf/boardmeetings/2012-13%20CAFR.pdf 38 Momentum Magazine (September 23, 2013). Bike Share Finds Success in Small Cities. Accessed online on December 5, 2013 at http://momentummag.com/features/bike-share-finds-success-in-small-cities/. 39 Boulder B-Cycle (July 2013). Boulder B-Cycle – 2012 Annual Report. Accessed online on December 5, 2013 at https://boulder.bcycle.com/About/DataandReports.aspx. 40 Boulder B-Cycle (August 2013). Station Master Plan. Accessed online on December 5, 2013 at https://boulder.bcycle.com/About/DataandReports.aspx.

June 16, 2014
Eugene Bike Share Feasibility Study │27
Figure 4.1: Boulder B-Cycle System Map.
Operating expenses are funded through a combination of membership and usage fees and sponsorships. The City has also committed to contributing to an operating reserve, although details of the amount and use of these funds were not available for this study. As is the case in many smaller cities, Boulder B-Cycle has had reasonable success with sponsorship requests in the $1,000 to $10,000 range where decisions can be made at a local level. They have also had some success with contributors in the $10,000 to $50,000 range that need regional or national approval, but to date have not had any success with requests over $50,000.
The University of Colorado (CU), located in Boulder, is under-represented in the current system with just one station located on CU property. However, Boulder B-Cycle has identified the University as a key partner and critical to the system’s growth and success. There are plans to find more opportunities for stations on the campus and Boulder B-Cycle offers discounted student membership to the system. CU is also a sponsor.
The transit provider in Boulder, the Regional Transportation District (RTD), is not a recognized partner, however, the system integrates with transit by locating stations near RTD stops. In 2012, 80% of annual members surveyed had an RTD transit pass and 33% use B-Cycle to connect to public transit.

June 16, 2014
Eugene Bike Share Feasibility Study │28
4.2 Chattanooga Bike Transit System The City of Chattanooga started to explore bike share as early as 2007, however system development commenced with the award of $100,000 in funding from the local Lyndhurst Foundation in 2009. The City, partnering with the local transit system CARTA, then won a federal CMAQ (air-quality) grant the following year to start the system.41 The system cost approximately $528,000 to operate for the first 12 months.42
The system currently features 300 bikes at 30 stations as shown on Figure 4.2. The City of Chattanooga owns the system and it is administered by Outdoor Chattanooga (OC), a division of the City’s Parks and Recreation Department. OC contracts operations to a private operator with an agreement to share any profits (75% City / 25% private operator).
Figure 4.2: Chattanooga Bike Transit System Map.
41 Streetsblog (February 2013). Chattanooga Bike-Share: Lessons for Smaller Cities. Accessed on December 5, 2013 at http://dc.streetsblog.org/2013/02/11/chattanooga-bike-share-lessons-for-smaller-cities/. 42 Chattanooga Bicycle Transit System (2013). Bike Chattanooga – First Year of Operations.

June 16, 2014
Eugene Bike Share Feasibility Study │29
The system has faced a number of challenges including delays in disbursing federal grant money due to early understanding of Buy America requirements, technology challenges as the vendor updated its operating system, difficulty attracting major sponsors, and a generally auto-oriented culture in the city.
The University of Tennessee Chattanooga plays a large role in the system with five stations (and 80 docks) in and around the campus and a large number of members through subsidized memberships to students. The system has also partnered with the University to conduct bicycle and pedestrian related research and analysis.
The connection with transit is emphasized through the system’s name as a “bicycle transit system” and stations located at major transit stations and stops. CARTA was also a major partner in securing federal funding.
4.3 Fort Worth Bike Sharing The Fort Worth Bike Sharing system is relatively recent opening in April 2013 with 300 bikes at 27 stations in Downtown, the Cultural District, and on the Texas Christian University (TCU) campus shown on Figure 4.3.
The concept was driven by the Planning Department at the Fort Worth Transportation Authority (the local transit agency) who obtained a $1 million Federal Transit Administration (FTA) grant to launch the system. The system is operated by a non-profit, however transit has remained an integral partner with part of the system’s mission to “complement our existing public transportation system” with bike share stations near transit stations such as the Fort Worth Intermodal Transportation Center.
4.4 GREENbike – Salt Lake City GREENbike in Salt Lake City is a relatively new bike share system that opened in April 2013. It is primarily located downtown with 65 bikes at the 12 stations shown on Figure 4.4.
The operating model is unique in that GREENbike, SLC Bike Share is a 501(c)3 non-profit organization that is a public / private partnership between Salt Lake City, the Salt Lake Chamber of Commerce and the Salt Lake City Downtown Alliance. The system is operated by the Downtown Alliance. Local public funding and significant sponsorship was used to launch and operate the system.
University of Utah is connected to Downtown by light rail but is not part of the bike share system at this stage. The Utah Transit Authority (UTA) (the local transit operator) is recognized as a “strategic partner”.

June 16, 2014
Eugene Bike Share Feasibility Study │30
Figure 4.3: Fort Worth Bike Share System Map.

June 16, 2014
Eugene Bike Share Feasibility Study │31
Figure 4.4: GREENbike System Map.
4.5 Summary of Experience in Peer Cities Table 4.3 summarizes the business models and funding strategies for the peer city bike share systems showcased above. These case studies show that there is no single “right” way to form, implement, or operate a bike share system in a small community. In all cases, cities have built on the momentum created by those championing the idea. In some instances this is a grass-roots community group (such as in Boulder and Aspen)43, a business improvement association (such as in Salt Lake City), or through the local transit agency (in the case of Fort Worth). Most systems however, receive their impetus through the support of city government, and, in particular, systems have tended to be most successful (especially in obtaining capital and sponsorship dollars) when there has been early and visible mayoral support.
There is no one business model for these smaller communities. However, the involvement of a non-profit is the most common model, in part due to the community-minded mission of these organizations and the fact that large, sophisticated (and potentially expensive) operations are not necessary for a smaller system. Non-profits are also well placed to receive funding from a variety of sources, but in most cases rely on the city or transit agency to identify, seek, and disburse federal, state, or local grants for capital funding. The responsibility for local matches can fall to either the public agency or the non-profit or both.
43 The WE-Cycle system in Aspen, Colorado was also established through the grass-roots efforts of local champions of the concept.

June 16, 2014
Eugene Bike Share Feasibility Study │32
Membership and user fees generally cover only a portion of the operating cost (up to 35% in Boulder) with the remainder needing to be supplemented by other sources – in particular from sponsorship and advertising. Smaller markets tend to attract numerous smaller sponsors rather than a few large ones. This means a lot of time and effort is required to identify, commit, and retain sufficient sponsorship to make the system financially sustainable.
Table 4.3: Case Studies of Small and Mid-Sized Community Bike Share Systems in the United States
Boulder B-Cycle
Chattanooga Bike Transit System
Fort Worth Bike Sharing
Salt Lake City GREENbike
BUSINESS MODEL Impetus Driven By
Local community group City Transit Agency City and Chamber of Commerce
Ownership Non-Profit City Non-Profit Non-Profit Contract Administrator
- City - Non-Profit
Operator Non-Profit Private Non-Profit Downtown Alliance City Role Funding agent, federal
/ state grant agent, Board representation,
planning
Owner, administrator, fundraising, planning
Project partner Part of non-profit, funding partner
Transit Agency Role
Project partner Federal grant agent, station planning
Initiated bike share idea, FTA grant agent,
project partner, sponsor, station
planning
Strategic partner, funding partner
College Role Project partner, one station on campus, sponsor, planning
partner
Stations on campus, subsidized
membership, research
Stations on campus, discounted
membership, sponsor
Limited involvement
FUNDING Capital City pursues federal,
state, local grants; BBC fundraises local match
Federal grant Transit Authority pursued FTA grant
Local funding and strategic partner
contributions Operations Membership and usage
fees (35%); sponsorship; local
funds
Membership and usage fees (25%) and
sponsorship
- Strategic partner contributions and
sponsorship
June 12, 2014
Eugene Bike Share Feasibility Study │33
Section II
System Planning

June 16, 2014
Eugene Bike Share Feasibility Study │34
5 System Goals An important component in determining the feasibility of a bike share system is to understand the system’s role in the community, decide what benefits are considered most valuable, and determine what will be considered a successful system. To this end, the project team developed a set of goals and objectives based on meetings with key regional stakeholders and initial feedback from the public.
These initial goals were then sent back to local stakeholders to get their position on what are the most important priorities for a potential bike share system in Eugene. Nineteen stakeholders responded to the survey and from these responses a set of final goals and objectives were established. Table 5.1 shows the final proposed goals and objectives in priority order from most important to least important. The objectives underneath each goal have also been ranked similarly.
Table 5.1: Proposed Goals and Objectives for a Potential Eugene Bike Share System
Goal Objectives 1. Personal Mobility • Integrate the bike share system with compatible adjacent land uses, including
transit facilities and high activity centers. • Increase the reach of complementary transportation modes such as transit and
walking. • Increase transit capacity between Downtown Eugene and the University of Oregon. • Increase the accessibility of neighborhoods that are currently underserved by
transit. 2. Bicycling, Health and Safety
• Divert single occupancy vehicle trips to bicycling and foster an active lifestyle. • Increase the prevalence of people riding bicycles to enhance bicycling “safety in
numbers” and encourage investment in new bicycling infrastructure. • Increase the bicycle mode share for short distance trips (less than 2 miles). • Educate the public about safe bicycling practices and rules of the road.
3. System Quality • Create and maintain a customer-service focused system that is tidy, with bicycles that are well-maintained and stations that are well-balanced.
• Create and maintain a system that is integrated into the urban fabric, and has a self-contained power and communication system with minimal need for infrastructure improvement.
• Identify system performance targets based on community expectations and develop measures to hold system operators accountable.
4. Long Term Financial Sustainability
• Create and maintain a contract structure whereby the system owner and operator are both incentivized to sustain a financially sustainable system.
• Plan for and ensure sustainable capital and operational funding for system growth and ongoing equipment replacement.
• Create a pricing structure that encourages ridership and increases revenues, and lowers barrier to entry to encourage low-cost trial usage.
• After initial seed funding, operating expenses should be funded with minimal public assistance.
• Clearly communicate system performance and effectiveness to partner agencies and the public.
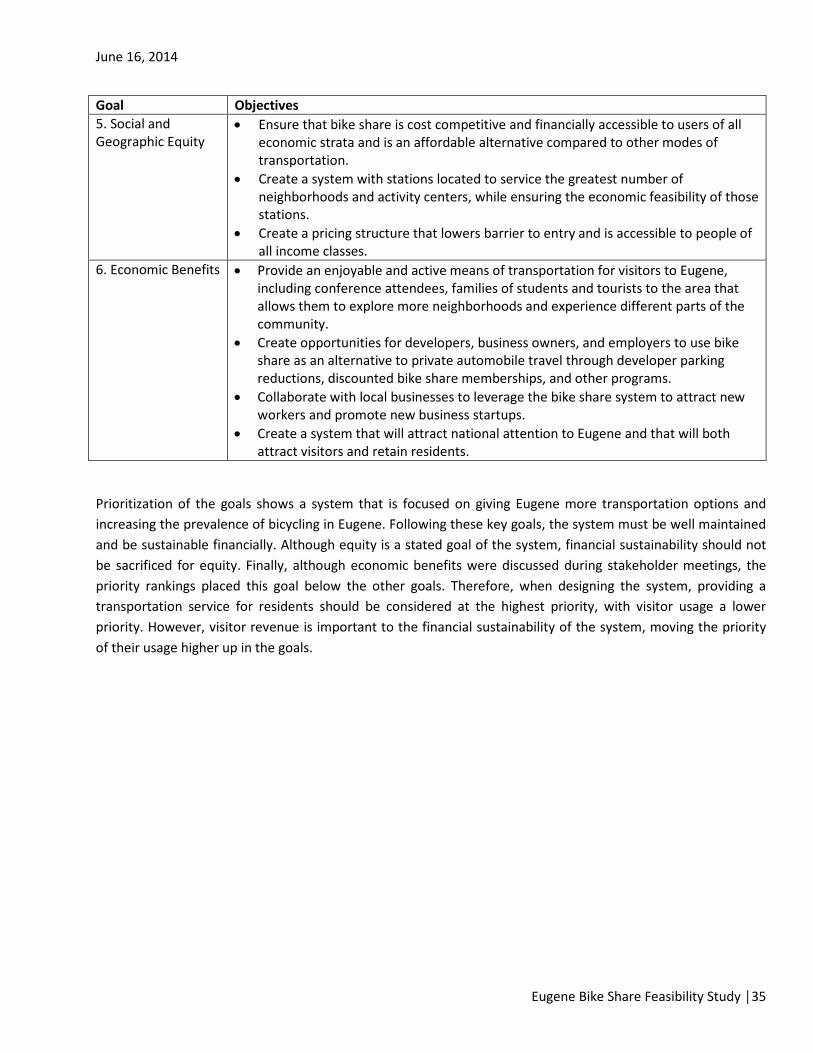
June 16, 2014
Eugene Bike Share Feasibility Study │35
Goal Objectives 5. Social and Geographic Equity
• Ensure that bike share is cost competitive and financially accessible to users of all economic strata and is an affordable alternative compared to other modes of transportation.
• Create a system with stations located to service the greatest number of neighborhoods and activity centers, while ensuring the economic feasibility of those stations.
• Create a pricing structure that lowers barrier to entry and is accessible to people of all income classes.
6. Economic Benefits • Provide an enjoyable and active means of transportation for visitors to Eugene, including conference attendees, families of students and tourists to the area that allows them to explore more neighborhoods and experience different parts of the community.
• Create opportunities for developers, business owners, and employers to use bike share as an alternative to private automobile travel through developer parking reductions, discounted bike share memberships, and other programs.
• Collaborate with local businesses to leverage the bike share system to attract new workers and promote new business startups.
• Create a system that will attract national attention to Eugene and that will both attract visitors and retain residents.
Prioritization of the goals shows a system that is focused on giving Eugene more transportation options and increasing the prevalence of bicycling in Eugene. Following these key goals, the system must be well maintained and be sustainable financially. Although equity is a stated goal of the system, financial sustainability should not be sacrificed for equity. Finally, although economic benefits were discussed during stakeholder meetings, the priority rankings placed this goal below the other goals. Therefore, when designing the system, providing a transportation service for residents should be considered at the highest priority, with visitor usage a lower priority. However, visitor revenue is important to the financial sustainability of the system, moving the priority of their usage higher up in the goals.

June 16, 2014
Eugene Bike Share Feasibility Study │36
6 Public and Stakeholder Engagement Public and stakeholder outreach was undertaken to gather input from the local community about the potential for bike share in Eugene and the surrounding region. The overall input was that there is significant support for bike share in Eugene, both in the general public and among small and large organizations. The most significant use of the system was clearly to connect the University of Oregon with Downtown Eugene, and it would be important to have a system that fully integrates the University of Oregon system with a system in Downtown.
Both the general public and most stakeholders, however, expressed strong concern with the potential financial sustainability of a bike share system in Eugene. Questions were raised as to whether large sponsorship funding would be available in the Eugene community, and whether a sustainable operations model could be created for bike share in Eugene. Finally, there were many comments that neither the City nor LTD should directly own a bike share system given current large commitments and funding difficulties.
The biggest overall impact on the recommendation for bike share in Eugene from the public and stakeholder engagement is that a non-profit governance structure likely addresses all of these issues most effectively. A non-profit organization can have the lowest potential operating costs, put together the most diverse set of funding, and most easily allow for University of Oregon integration. This option is discussed in further detail in Section 9.
Details of the public outreach effort, as well as an analysis of University of Oregon integration, are described below.
6.1 Public Input Public outreach included an open house information session and the creation of a project website (www.eugene-or.gov/bikeshare). The project website included information about the project, links to a bike share survey, and an online map where users could locate or support potential station locations.
6.1.1 Public Meeting A public meeting was held at Lane Community College’s downtown campus on Wednesday February 12, 2014 to introduce the project and obtain initial feedback from the community. The meeting was attended by sixteen people and included a presentation introducing bike share and outlining the project schedule, followed by a question and answer session. There were also hard copy versions of the bike share survey and maps for attendees to suggest station locations.
Participants were asked to select what they considered to be the major priorities for a bike share system in Eugene. The top priorities identified were high membership and ridership, and integration with the University of Oregon system. Social and geographic equity, improving livability, economic competitiveness, and financial performance were also considered
Figure 6.1: Public Open House Presentation.

June 16, 2014
Eugene Bike Share Feasibility Study │37
important. The top priorities lined up with the ultimate prioritization of goals and objectives by stakeholders, as discussed in Section 5.
Overall, attendees were generally supportive of the concept of bike share and the questions asked included the following themes:
• Integration of the system with the University of Oregon and other systems in the state; • Social equity: ensuring the system is affordable and engages lower-income communities; and • Funding: utilizing innovative funding mechanisms given the traditional avenues of public funding or large
corporate sponsors may not be available.
A summary of the public meeting is included in Appendix A.
6.1.2 Bike Share Survey An online survey was made available during February and March 2014 on the project website and was promoted through a variety of sources including links from the Lane Transit District, City of Eugene, and Point2Point websites, student media at the University of Oregon, press releases, local publications, at the public open house, and through social media. The survey included 20 questions asking respondents demographic and employment information; current bicycling habits; and opinions on bike share implementation.
The survey results helped to understand:
• What role bike share could play in Eugene; • What kind of support (or opposition) there is for a possible bike share system; and • How much people might use and be willing to pay for the system.
The following section provides a summary of the 91 responses received. Complete survey results can be found in Appendix B. It should be noted that there are some limitations to this survey and the results should not be considered a statistically valid sample. Many of the respondents are self-selecting individuals who either strongly support or oppose bike share and may be more inclined to complete the survey, rather than a randomly chosen sample.
Demographic and Employment Information
Survey participants were asked to provide demographic and employment information. Based on the results of the survey, Table 6.1 compares the demographics of respondents with the citywide population of Eugene. This shows that survey respondents tended to over-represent younger, male, and higher income populations.
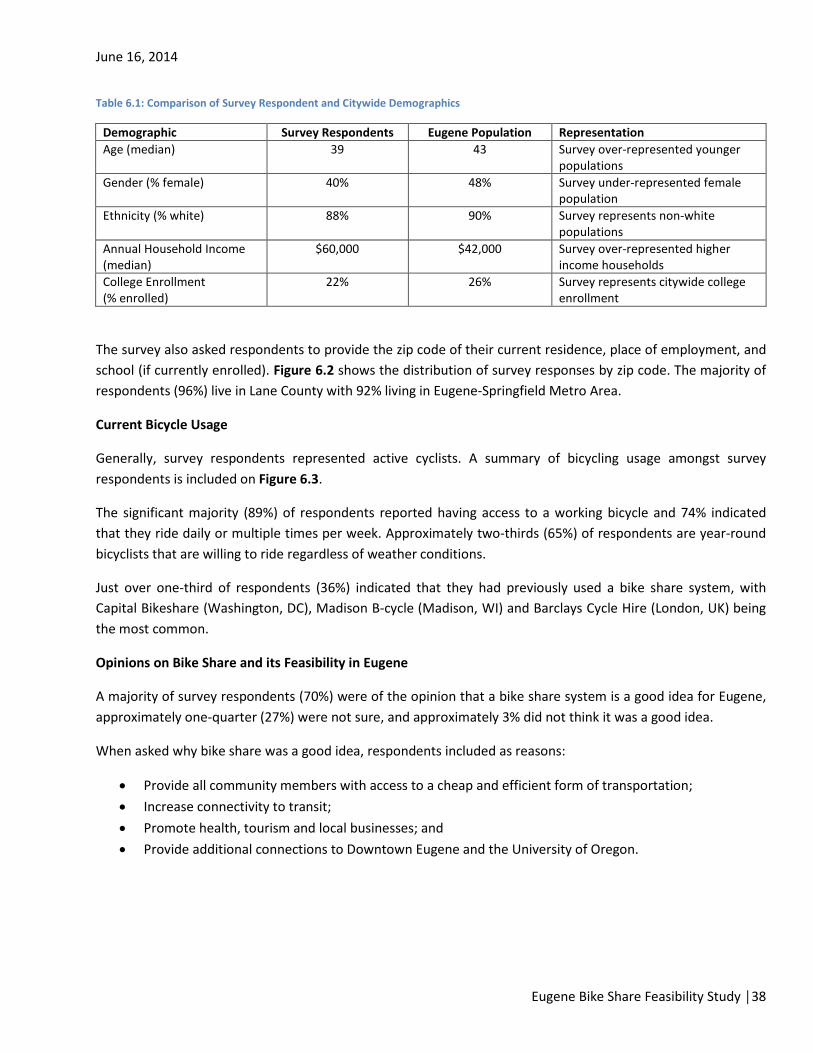
June 16, 2014
Eugene Bike Share Feasibility Study │38
Table 6.1: Comparison of Survey Respondent and Citywide Demographics
Demographic Survey Respondents Eugene Population Representation Age (median) 39 43 Survey over-represented younger
populations Gender (% female) 40% 48% Survey under-represented female
population Ethnicity (% white) 88% 90% Survey represents non-white
populations Annual Household Income (median)
$60,000 $42,000 Survey over-represented higher income households
College Enrollment (% enrolled)
22% 26% Survey represents citywide college enrollment
The survey also asked respondents to provide the zip code of their current residence, place of employment, and school (if currently enrolled). Figure 6.2 shows the distribution of survey responses by zip code. The majority of respondents (96%) live in Lane County with 92% living in Eugene-Springfield Metro Area.
Current Bicycle Usage
Generally, survey respondents represented active cyclists. A summary of bicycling usage amongst survey respondents is included on Figure 6.3.
The significant majority (89%) of respondents reported having access to a working bicycle and 74% indicated that they ride daily or multiple times per week. Approximately two-thirds (65%) of respondents are year-round bicyclists that are willing to ride regardless of weather conditions.
Just over one-third of respondents (36%) indicated that they had previously used a bike share system, with Capital Bikeshare (Washington, DC), Madison B-cycle (Madison, WI) and Barclays Cycle Hire (London, UK) being the most common.
Opinions on Bike Share and its Feasibility in Eugene
A majority of survey respondents (70%) were of the opinion that a bike share system is a good idea for Eugene, approximately one-quarter (27%) were not sure, and approximately 3% did not think it was a good idea.
When asked why bike share was a good idea, respondents included as reasons:
• Provide all community members with access to a cheap and efficient form of transportation; • Increase connectivity to transit; • Promote health, tourism and local businesses; and • Provide additional connections to Downtown Eugene and the University of Oregon.

June 16, 2014
Eugene Bike Share Feasibility Study │39
Figure 6.2: Distribution of Survey Responses by Zip Code.
Respondent Household Zip Code, Normalized By Area
Respondent School Zip Code, Normalized By Area
Respondent Employment Zip Code, Normalized By Area
0-1 2-5 6-16 17-35
0 1-2 3-4 5-10
0-1 2-4 5-14 15-25

June 16, 2014
Eugene Bike Share Feasibility Study │40
Figure 6.3: Current Bicycling Usage Trends Amongst Survey Respondents.
Respondents who indicated they didn’t think bike share was a good idea for Eugene were also asked to share their reasoning. Explanations for not supporting the system included:
• Cost of implementation and maintenance; • Opportunity cost, i.e., other bicycling investments may have larger returns; • The high number of people in Eugene that already own bicycles; and • Relatively small tourist and visitor market.
Forty-percent of survey respondents stated that they would utilize a bike share system at least once a week (42%), while only 6% stated that they would never use the system.
Respondents stated that the most likely trips that they would use bike share for included: running errands; going to or from transit stops; going to meetings; and shopping or dining out. A full break down of anticipated trip types is included on Figure 6.4.

June 16, 2014
Eugene Bike Share Feasibility Study │41
Figure 6.4: Stated Frequency and Trip Purpose for Bike Share Trips in Eugene.

June 16, 2014
Eugene Bike Share Feasibility Study │42
When asked about what prices they would likely pay for annual, weekly and daily memberships, survey respondents stated that they would pay an average of $67, $15 and $8 respectively.
Other Results
Further analysis of the survey responses found that:
• Of those people that do not currently have access to a working bicycle (11% of respondents), 60% stated that they would use bike share frequently, i.e., at least once a week. Similarly, of the 14% of people who bicycle only a few times per year, 60% stated that they would use bike share frequently.
• Under-represented population groups provided the following responses: o Female respondents (39%) identified that they would use bike share primarily for running
errands, going to meetings and riding to transit. o About 20% of respondents self-selected as non-white and most (80%) stated they would use
bike share frequently. o Lower income individuals (i.e., those people earning less than the median income in Eugene)
represented 38% of respondents and of these, 88% stated that they would use bike share at least once a month. These individuals reported that if bike share were available they would use bicycles for running errands, riding to transit, and meeting family and friends most often.
• Of the 36% of respondents that had previously used bike share, 77% supported a bike share system in Eugene.
6.1.3 Interactive Web-Based Mapping Tool The project website provided a link to an interactive web map that provided an opportunity for the public to suggest possible bike share station locations. The interactive map was opened for public comment in early February 2014 and as of March 4, 2014, 193 station suggestions were submitted, with many of these locations being preferred (“liked”) by multiple users.
Suggested station locations were exported as a Geographic Information System (GIS) shapefile and mapped by the project team on Figure 6.5 (with each station weighted by the number of “likes”). This feedback was used along with the community analysis to produce a demand analysis map.
6.1.4 Summary of Public Input Based on public input, the following opportunities and challenges were identified:
Challenges:
• Some survey respondents expressed concerns about the feasibility of a bike share system in Eugene given the (low) density of land use and the financial investment required; and
• Some survey respondents believe that even if capital funds are raised, operational costs will present on-going challenges.
$67 Annual membership
$15 Weekly membership
$8 24-hour access

June 16, 2014
Eugene Bike Share Feasibility Study │43
Figure 6.5: Public Suggested Bike Share Station Locations.
Opportunities:
• Public feedback generally indicates strong public support for a potential bike share system; • Survey respondents indicated that they would be willing to pay prices commensurate with comparable
bike share systems in other parts of the country; and • Public suggestions for bike share station locations generally align with the demand analysis (presented
in Deliverable 2 and shown on Figure 12 of that memorandum).
6.2 Stakeholder Engagement Stakeholder outreach was conducted through several workshops with individuals and organizations that could play a role as supporters, sponsors, or participants of the bike share system. The project team gathered information from over 30 organizations during the course of the feasibility study. The bulk of stakeholder engagement was conducted through a series of workshops held on February 11 - 12, 2014 in Eugene. Each group was asked to provide input on what they thought a bike share system could provide for the community, the challenges they saw to implementation, and how their organization could become involved.

June 16, 2014
Eugene Bike Share Feasibility Study │44
Given the number of stakeholders, workshops were conducted with stakeholders in smaller groups. The workshop groups included: transportation and permitting, food and beverage, large businesses and developers, business associations, sponsorship, tourism, and health and wellness.
Following were the organizations represented in stakeholder meetings:
• City of Eugene (many different agencies) • Lane Transit District • University of Oregon (many different departments) • City of Springfield • Oakshire Brewing • Hot Mamas Wings • Lane Community College • NW Community Credit Union • CAWOOD (Marketing Agency) • University Small Business Association • Downtown Eugene Incorporated • Bell+Funk (Marketing Agency) • Hilton Eugene • Eugene, Cascades & Coast Sports • VA Hospital • Falling Sky Brewing • IMG (Sports Marketing) • PeaceHealth (Health Care) • Concentric Sky (Software)
Each meeting included an introduction to bike share in the United States and in the region and then turned to a group discussion where participants were asked to introduce themselves and identify how bike share might be relevant to their organization. Participants were also asked to identify any challenges they saw to implementing a bike share system and, depending on the group, the appropriateness of potential sponsorship scenarios.
The majority of the organizations were supportive of a bike share system in Eugene. In particular, organizations believed that bike share could help Eugene in the following ways:
• Connect Downtown and the University of Oregon; • Enhance the livability of Eugene to retain younger employees in the growing technology sector; • Alleviate congestion on the EmX; • Potential large sponsor opportunities, as well as smaller businesses banding together for group
sponsorships and employee bike share membership packages; and • Connect neighborhoods that are not currently connected by other forms of public transit such as the
Whiteaker Neighborhood.

June 16, 2014
Eugene Bike Share Feasibility Study │45
The most-often cited potential challenges were:
• Creating a sustainable business model to operate the system on an ongoing basis; • Difficulty in attracting major sponsorship; and • Removing parking could be met with resistance in some areas. As well, there were concerns about the
available space on sidewalks for bike share infrastructure. Most stakeholders expressed an interest in supporting and promoting the system and many of the businesses suggested they would be interested in financial support, either through system sponsorship, station sponsorship, or corporate membership.
A summary of unique content of each of the meetings is included in Appendix C.
6.3 Compatibility with the University of Oregon Bike Share System The project team explored opportunities and challenges to integrating a bike share system in Eugene to the four-station bike share system proposed on the University of Oregon campus in 2014. For background, the University of Oregon issued a Request for Proposals in 2013 for an equipment provider for their system, using $199,000 in student over-realized funds. As of the date of this report, the University is in contract negotiations with the chosen equipment provider. The University of Oregon Bike Program is planning on operating the system itself. The City, University of Oregon, LTD and stakeholders expressed the desire for any broader system to be compatible with the proposed University of Oregon system.
Therefore, the project team’s analysis included a review of equipment compatibility, overcoming sponsorship and advertising limitations on the University of Oregon campus, maintaining compatible fee structures, and contracting and income distribution across multiple jurisdictions.
6.3.1 Equipment Compatibility To date, no U.S. city has attempted to deploy technologies from two different vendors. There are a number of obstacles that would need to be overcome. First, it would need to be decided whether one operator would operate both systems, or whether independent operators would be allowed (or needed) to operate each system. An agreement for when and how independent operators would coordinate would need to be established. Multiple operators of the same system can be very complex, even if each portion is small. Issues such as bicycle maintenance are very important to the safety of the system, and because bicycles move around within the system, a plan would have to be coordinated between operators to ensure each bicycle is checked on a regular basis.
The biggest obstacle, however, is the difficulty of potentially having two different equipment vendors. To date, there are no vendors who have compatibility of software and locking technologies with another vendor. For example, if a bicycle is ridden from one vendor’s station in Downtown Eugene it cannot be docked into another vendor’s station on the University of Oregon campus because the docking and locking mechanisms are different. The use of independent locks may be possible, but there would need to be a mechanism for the user to close out the trip so that additional fees for keeping the bicycle in user service are not charged. There would also need to be a way for another user to check that bicycle out again. Technology integration is not currently possible

June 16, 2014
Eugene Bike Share Feasibility Study │46
between two station-based systems, nor is it between a station-based and a smart-bike system (because the station-based bicycle would need to be docked or locked somewhere where there are no stations). However, integration could be possible with two smart-bike systems because the locking mechanisms are carried on the bicycles themselves and can be locked anywhere. Equipment compatibility between vendors may happen in the future, but it will take some investment and years to overcome this issue.
Regardless, integrating two different technologies into one system brings up the question of whether users would need to carry two memberships. This could increase the cost of entry for the user and detract from the convenience of only having to use one technology. It is technologically feasible to have a single membership card for two different systems where both membership databases are synchronized. However, this would require cooperation and technology development between two vendors, and that has not happened to date in the U.S. A revenue sharing agreement would likely be required between the University of Oregon system and the City system.
In summary, there are many complex issues involved in having equipment for an urban system that is different from the University of Oregon system. It is recommended that the same technology be implemented for both systems.
6.3.2 On-Campus Sponsorship and Advertising Overall, University of Oregon sponsorship potential is very strong, and its presence could help attract national sponsors who are interested in accessing the difficult-to-reach student population. Some national sponsors are interested in large-school towns, such as Ann Arbor, MI, Lawrence, KS and Eugene.
However, restrictions on the University of Oregon campus may limit the sponsorship potential for a bike share system. University policy restricts the use of graphic displays on system infrastructure such as the station information panels and the docks. However, it is expected that advertising on the bicycles, the movement of which cannot be controlled as bicycles are expected to come onto campus from stations outside of campus, will be acceptable to the University of Oregon. The restrictions may also preclude a major sponsor buying the rights to brand the entire system. For example, the Citi Bike system in New York City is sponsored by Citibank. The Citi Bike logo on every bicycle and information display incorporates the Citi logo and color.
The sale of sponsorship or advertising space on the stations is often necessary to fill the operating funding gap, particularly in smaller, less dense communities where user revenues do not cover the entire cost of operating the system. There are a number of ways that these restrictions could be addressed:
• Consider approaching the University for a relaxation of these restrictions to allow sponsorship and or advertising on the stations;
• Understand if the University has “approved partners” that could provide sponsorship or support to the system, or sponsor the stations located on the University campus; or
• Find other ways to fund the operating contribution of these stations. This could include direct purchase by the university or departmental sponsorship of stations (that would not require logos or branding).
If University of Oregon can fund its portion of the system, then the following guidelines could be followed so as not to violate on-campus advertising or sponsorship policies:

June 16, 2014
Eugene Bike Share Feasibility Study │47
• University of Oregon must allow bicycles on its campus with sponsorship. No operator should be expected to control the location of specific bicycles;
• System name and branding must be allowed on informational panels, maps, at the kiosk, on the University of Oregon campus; and
• The sponsor would not be allowed to advertise on the informational panel on the University of Oregon campus.
6.3.3 Fee Structure Different operators can bring different approaches to how they structure their membership and user fees. These would need to be consistent between the University of Oregon and the larger community-wide system so as not to initiate “price wars” between the systems where users are purchasing membership based on which system is cheapest. Also, user fees should be consistent to avoid confusion amongst riders. Agreements may need to be put in place if there are to be more than one operator.
It is also important that the first system to launch thoroughly consider their pricing structure as it will dictate the pricing structure for the rest of the system. Therefore, it is recommended that University of Oregon collaborate with other potential jurisdictional partners such as the City of Eugene when creating its pricing structure.
6.3.4 Inter-Jurisdictional Issues There are several regional bike share systems in the U.S. that span jurisdictional boundaries, e.g., Hubway includes the cities of Boston, Cambridge, Somerville, and Brookline; Capital Bikeshare includes the District of Columbia and the cities of Arlington and Alexandria in Virginia; and Bay Area Bike Share includes San Francisco, Palo Alto, Mountain View, San Jose, and Redwood City. These systems operate one technology and with one operator.
A bike share system in Lane County could be multi-jurisdictional with the City of Eugene, the University of Oregon, Lane Transit District, and potentially the City of Springfield all playing a role in the system. Including these additional organizations and jurisdictions can create a bike share system with larger reach and impact than multiple smaller systems. However, there are several issues that need to be addressed when considering a multi-jurisdictional system:
• Procurement and contracts: o Process: Ideally, there should be one procurement process for all new jurisdictions following the
initial University of Oregon procurement; o Equipment: The region should have the same equipment (to avoid integration issues described
above); o Operations: The region should have a single operator; o Business model: The region should have a single business model that is the same across
jurisdictions; o Equipment pricing: Every jurisdiction should obtain the same pricing on equipment and
operations; o Service levels: Every jurisdiction should have the same service levels and reporting requirements
so an operator does not have multiple requirements causing high administrative costs; and

June 16, 2014
Eugene Bike Share Feasibility Study │48
o Contract timing: It should be ensured that contract end dates align across jurisdictions. Therefore, if a change in operator or equipment is desired, the region can do a replacement at one time;
• Revenue and expense sharing among jurisdictions: formulas will need to be developed to calculate the financial responsibility and revenue split among jurisdictions. For example, what is the revenue split for a rider that purchases a casual membership at one station in one jurisdiction and rides to a station in another jurisdiction incurring usage fees?
• Sponsorship and funding: o Decide whether each jurisdiction will find its own sponsor(s), or whether sponsors are shared
across the whole system; o If different jurisdictions have strong restrictions on sponsorship and advertising, local policy as
to whether bicycles with sponsorship or advertising are allowed; and o If public funding is secured, decision as to whether funding is shared across jurisdictions, and
whether local matching funds must be procured by each jurisdiction; • Board representation and voting: policies should be formed regarding how decisions are made for the
system, and how voting power is determined; • Name and branding of system:
o Should allow for multi-jurisdictional participation; and o Will each jurisdiction require a “seal” on the bicycle, and if so, will it be on the whole fleet or on
a portion of the bicycles? • Pricing: should be the same across the system.
An example of a multi-jurisdictional Memorandum of Understanding from the Boston region is included as Appendix D to this report. Given the multi-jurisdictional nature of the area, the governance structure for the system should ensure that the issues outlined above can be overcome.
Opportunities:
• Expand on the University of Oregon system; • Utilize University of Oregon sponsorship power to obtain larger sponsor; and • Create a bike share system that can have a larger geographic reach, more potential funding sources and
ultimately larger impact than a system confined to the City of Eugene, or several smaller systems.
Challenges:
• Difficult to integrate a different technology than the University of Oregon system; • Sponsorship and advertising restrictions on the University of Oregon campus may limit some sponsors;
and • Multi-jurisdictional contracting can be complex, and requires significant and ongoing negotiations
among several organizations.

June 16, 2014
Eugene Bike Share Feasibility Study │49
7 System Planning Two of the key questions to answer in assessing the feasibility of a bike share system are:
• Who will use it? and; • Where should it be implemented?
To answer these questions the project team undertook several analysis tasks. Firstly, public and stakeholder outreach was undertaken to gather input from the local community about how bike share might be used and where stations would be most appropriate (see Sections 6.1 and 6.2). The project team also explored the integration of a larger bike share system with the system proposed for the University of Oregon campus in 2015 (see Section 6.3). Lastly, and the focus of this chapter, a demand analysis was prepared using available GIS information to understand the spatial distribution of various populations, trip generators, and trip attractors. The resulting heat maps identify areas of the community with the highest potential demand for bike share and were used to identify a potential service area and phasing plan for the system. This analysis and a description of each of the variables considered is described below. Detailed mapping is included in Appendix E.
7.1 Community Analysis The project team undertook a GIS-based demand mapping exercise to understand where bike share might be most successful in Eugene and Springfield. They also conducted a review of how some of the physical, demographic, and cultural characteristics of Eugene might impact the potential demand for bike share.
The heat mapping process included spatially analyzing several variables believed to influence bike share demand including:
• Physical conditions, climate, and topography; • Population density and housing; • Employment density; • Colleges and student populations; • Visitors and tourism; • Transportation, including transit, car share, and regional transportation; and • Bicycling infrastructure and culture.
Each of these variables were mapped and scored with weightings based on the project team’s experience in understanding usage and uptake rates in other cities with bike share systems. These scores were then compiled to develop a “heat map” that shows the areas of the community most likely to embrace bike share. The spatial analysis of each variable and the resulting heat mapping process are described below.
7.1.1 Physical Conditions Eugene is situated along the Willamette River with a central downtown and the University of Oregon campus located approximately one mile east of Downtown. The city covers an area of approximately 44 square miles and the downtown and core area immediately surrounding Downtown – including the Whiteaker, Jefferson, and West University neighborhoods – is a mix of higher density residential and commercial land uses with densities

June 16, 2014
Eugene Bike Share Feasibility Study │50
generally decreasing outside of these neighborhoods. Beyond the core, commercial development follows the major arterial corridors to the west, north, and south surrounded by lower density residential land uses.
The City of Springfield is located to the east of Eugene and separated by the I-5 corridor. The City includes an area of approximately 16 square miles with major development generally following the Main Street corridor and clustered in Gateway and along Mohawk Boulevard and Marcola Road.
Both cities are generally flat with some hills in the southern parts of Eugene. A topography map is shown on Figure 7.1.
Figure 7.1: Topography Map.
Eugene and Springfield exhibit the typical climate of Oregon cities located between the Coastal and Cascade mountain ranges with short, mild summers and long periods of the year with overcast or rainy conditions. Temperatures are generally mild year-round with a summer average high temperature of 83 F and a winter high temperature average of 46 F. The mild temperatures encourage year-round bicycling, however bicyclists do need to be prepared for frequent rainfall.

June 16, 2014
Eugene Bike Share Feasibility Study │51
Challenges:
• Outside of the core area of Eugene, land use tends to be fairly low density and follows the major arterials and highways; and
• Frequent rain will likely result in lower demands during fall, winter, and spring.
Opportunities:
• Downtown Eugene and the core area offer a variety of high density land uses. The street system is well-connected with a grid-like street pattern that encourages bicycling;
• Generally mild temperatures encourage year-round operation; and • Generally flat topography.
7.1.2 Population Density and Housing The success of bike share depends on attracting a variety of users. The areas being served need to have a critical mass of users as stations located in higher density areas are generally more successful. Figure 7.2 shows the distribution of population density by census block based on data from the 2012 U.S. Census. It shows that the highest population densities are in the downtown core (although there are some areas of downtown with very low population densities) and around the University of Oregon campus. There are also pockets of higher density areas to the south, west, and north-west of Downtown.
Figure 7.2: Population Density in Eugene and Springfield.

June 16, 2014
Eugene Bike Share Feasibility Study │52
Surveys of annual members in U.S. bike share cities have shown that certain populations tend to be early adopters of bike share. For example, in Washington D.C. a survey of Capital Bikeshare users was conducted in 201244 and found that annual members were typically:
• Well educated: 95% of annual members surveyed had a bachelor’s degree or higher, compared to 51% of the entire Washington D.C. population;
• High-income: the median salary amongst annual members was between $75,000 and $100,000 per year, compared to the city-wide median salary of $64,267 per year; and
• Young: approximately 63% of annual members were between the ages of 18 and 35 compared to 17% of the regional employee population.
These data suggest that areas of Eugene with a high proportion of young, well educated (or student), and/or wealthy populations will be more conducive to early adoption of a bike share system. To identify concentrations of these populations, Figure 7.3 shows a map of census blocks where at least two of the following criteria were met:
1. The number of people with bachelor’s degrees or higher, or currently enrolled as a college student is higher than the regional average.
2. The percentage of the population aged between 18 and 35 is higher than the regional average. 3. The average salary is higher than the regional average.
These areas are most likely to be early-adopters of a bike share system.
Challenges:
• Population densities are low in many parts of Eugene. Bike share will need to be more strategically located in these areas and focused around specific attractions or activity centers.
Opportunities:
• There are relatively high population densities in the downtown and core areas of Eugene; and • There are several areas with high proportions of young, wealthy, and well-educated populations, who
tend to be early adopters of the system.
44 LDA Consulting (2013). 2013 Capital Bikeshare Member Survey Report. Accessed online at http://capitalbikeshare.com/assets/pdf/CABI-2013SurveyReport.pdf on January 6, 2014.
Eugene Snapshot
(Based on 2010 U.S. Census)
158,000 population (2012)
40% bachelor’s degree or higher
$41,525 median household income
3,572 persons per square mile
28% aged 20 – 35 years old

June 16, 2014
Eugene Bike Share Feasibility Study │53
Figure 7.3: Possible Early Adopters of Bike Share in Eugene and Springfield.
7.1.3 Employment Density Figure 7.4 shows the distribution of employment density by census block based on data from the 2012 U.S. Census. It shows that the highest employment densities are, as expected, in the downtown core, around the University of Oregon campus, and along the W 11th Avenue corridor. Other high employment areas include the Valley River Center and Gateway Malls as well as several other arterial-oriented developments.
Zoning maps for Eugene and Springfield can be found on the respective cities’ websites.45 These maps show clusters of commercial activity outside of the downtown core that are often located in lower density neighborhoods but may still serve as popular attractions for the bike share system. Land use has been incorporated into the heat mapping process described later in this report.
45 Eugene: http://www.eugene-or.gov/index.aspx?NID=1951and Springfield: http://www.ci.springfield.or.us/Pubworks/TechnicalServices/SpatialDataProducts/StandardMaps/std_map_zoning.pdf

June 16, 2014
Eugene Bike Share Feasibility Study │54
Figure 7.4: Employment Density in Eugene and Springfield.
Challenges:
• Outside of the core area of Eugene, commercial land use tends to be more spread out and follows the major arterials and highways.
Opportunities:
• The downtown areas of Eugene and Springfield both have high densities of employment; and • The mix and density of land use in the downtown and core areas of Eugene are conducive to bike share
activity throughout the day.

June 16, 2014
Eugene Bike Share Feasibility Study │55
7.1.4 Colleges and Student Populations Eugene is home to the University of Oregon. The University of Oregon plays a large role in the community with almost 25,000 students and over 4,500 faculty and staff. The 295-acre campus is located approximately one mile east of Downtown Eugene with the main campus on the south side of the Willamette River and the athletic facilities on the north side of the Willamette River connected by a bicycle and pedestrian bridge. The main campus is generally bound by 11th and 18th Avenues to the north and south and Alder Street and Villard Street to the west and east.
The University of Oregon provides a significant attraction for the bike share system. Bike share could be used to move to and from the campus as well as between campus and student housing. College students tend also to be early adopters of the system and it is expected that a significant percentage of early users would come from student, staff, and faculty. The University of Oregon Bike Program will launch a four-station bike share system on the campus in 2015. Analysis on how a larger system would integrate with the University of Oregon system was included in Section 6.3.
Lane Community College is also a significant educational institution. It had over 18,000 students enrolled in fall 2012. The main campus is located approximately 5 miles south-east of Downtown Eugene and is fairly isolated from other development. However, Lane Community College recently opened a 90,000 square foot downtown campus at W 10th Avenue and Olive Street that will serve as a major attraction for bike share.
The University of Oregon and Lane Community College both have already invested in bicycle initiatives on their campuses. Both institutions currently operate bike loan programs, which offer students the option to rent a bike for the term or entire year.
Other colleges in Eugene include the Northwest Christian University located to the northwest of the University of Oregon campus and the New Hope Christian College located approximately 3 miles west of Downtown Eugene. These colleges are much smaller in terms of enrollment but could also benefit from bike share. Colleges with enrollments over 100 students are listed in Table 7.1 and shown on Figure 7.5.
Table 7.1: College Enrollment in Eugene and Springfield
Institution Enrollment University of Oregon 24,548 Lane Community College 18,585 Northwest Christian University 623 New Hope Christian College 187
Figure 7.5 also shows the location of existing and future student housing projects. It shows a considerable amount of student housing located in and around the University of Oregon campus, but also an increasing amount of student housing being developed in Downtown Eugene with projects such as “13th & Olive” and “The Hub” at the corner of Broadway and Ferry Street. Bike share offers a convenient way to connect student housing to the main University of Oregon campus, a trip of approximately 1 mile.

June 16, 2014
Eugene Bike Share Feasibility Study │56
Figure 7.5: College and Student Housing Locations in Eugene and Springfield.
Challenges:
• The main Lane Community College campus is approximately 5 miles from Downtown Eugene, relatively isolated, and is separated by a significant hill. It may be difficult to serve this campus with bike share.
Opportunities:
• University of Oregon is expected to be a big supporter of an expanded bike share system. Students, staff, and faculty are expected to be early adopters of the system especially if it integrates with the four station bike share system scheduled to launch on the campus in 2015;
• University of Oregon will provide a major attraction in the community both for students moving within the campus as well as travelling to and from the campus and running errands during the day;

June 16, 2014
Eugene Bike Share Feasibility Study │57
• Bike share provides an opportunity to connect student housing to the main University of Oregon campus and to provide students with a low cost travel option for getting around town; and
• The Lane Community College downtown campus will be a major destination for the bike share system.
7.1.5 Visitors and Tourism Visitors and tourists are an important element of a successful bike share system. These users tend to purchase 24-hour passes rather than annual memberships, and are typically more profitable for the system as they take fewer trips, pay a higher rate per trip, and are more willing to exceed the “free ride period” and incur additional trip fees. In other cities, casual trips make up approximately 40- to 50-percent of all bike share trips. Table 7.2 shows the relationship between the number of annual visitors and the number and percentage of casual trips taken in the case study cities.
Although Eugene does not attract the same number of tourists as some other bike share cities, there are a significant number of day visitors from Portland and other parts of Oregon as well as visitors drawn by the University and sporting events.
The major visitor attractions in and around Downtown include the Hult Center for the Performing Arts and several arts, cultural, and sporting venues on the University of Oregon campus. Across the river from Downtown and the University of Oregon campus is Alton Baker Park a popular recreational area in the city that hosts the Science and Children’s Museum, the Cuthbert Amphitheater, and Autzen Stadium. Eugene is referred to as “Track Town USA” and frequently hosts high-quality track and field events at Hayward Field including the Prefontaine Classic and the past two summer Olympic trials. The City is also recognized for its recreational trails within the city and for its arts and crafts studios and several well-known local breweries and restaurants.
Table 7.2: Comparison of Visitor Numbers and Casual Bike Share Usage in U.S. Bike Share Cities
City Annual Visitors Casual Users Percentage of Casual Trips
Casual Trips per Station
Boulder1 n/a 9,059 47% 535 Chattanooga2 3 million 8,578 49% 510 Fort Worth3 5.5 million 7,000 n/a 465
1 Bike share statistics based on 2012 data provided by Boulder B-Cycle in July 2013. 2 Annual visitor statistics obtained from Downtown Chattanooga. Bike share statistics based on 2012 data included in Bike Chattanooga – First Year of Operations, published July 2013. 3 Annual visitor statistics obtained from the Fort Worth Chamber of Commerce and includes the Dallas – Fort Worth region. Bike share statistics based on six months of data in 2013 accessed online at: http://fortworthtexas.gov/mayor/message.aspx?id=117968 on January 21, 2014.
Travel Lane County Visitor Statistics1
Hotel room inventory: 4,711 rooms
Occupancy rate (FY 2012): 57%
Annual visitor spending: $543 million
Annual Eugene Airport Arrivals: over 400,000
Annual Amtrak Arrivals / Departures: 64,000

June 16, 2014
Eugene Bike Share Feasibility Study │58
Visitor accommodations vary from small bed & breakfasts to large-scale hotel chains. The majority of major hotels are located in and around the University of Oregon campus and along Franklin Boulevard to the west of Downtown Eugene. These may be good locations to coordinate with bike share stations so as to provide visitors with a quick and easy way to move around town without needing a motor vehicle.
Figure 7.6 shows the location of some of the major visitor attractions, large hotels, and community amenities (e.g., community centers, libraries, etc. that may be bike share attractions) in the downtown and surrounding areas.
Figure 7.6: Visitor and Community Attractions in Downtown Eugene and Surrounding Neighborhoods.
Challenges:
• Eugene attracts a relatively small number of tourists compared to some other cities employing bike share in the United States. This may result in fewer casual members and low user revenues.
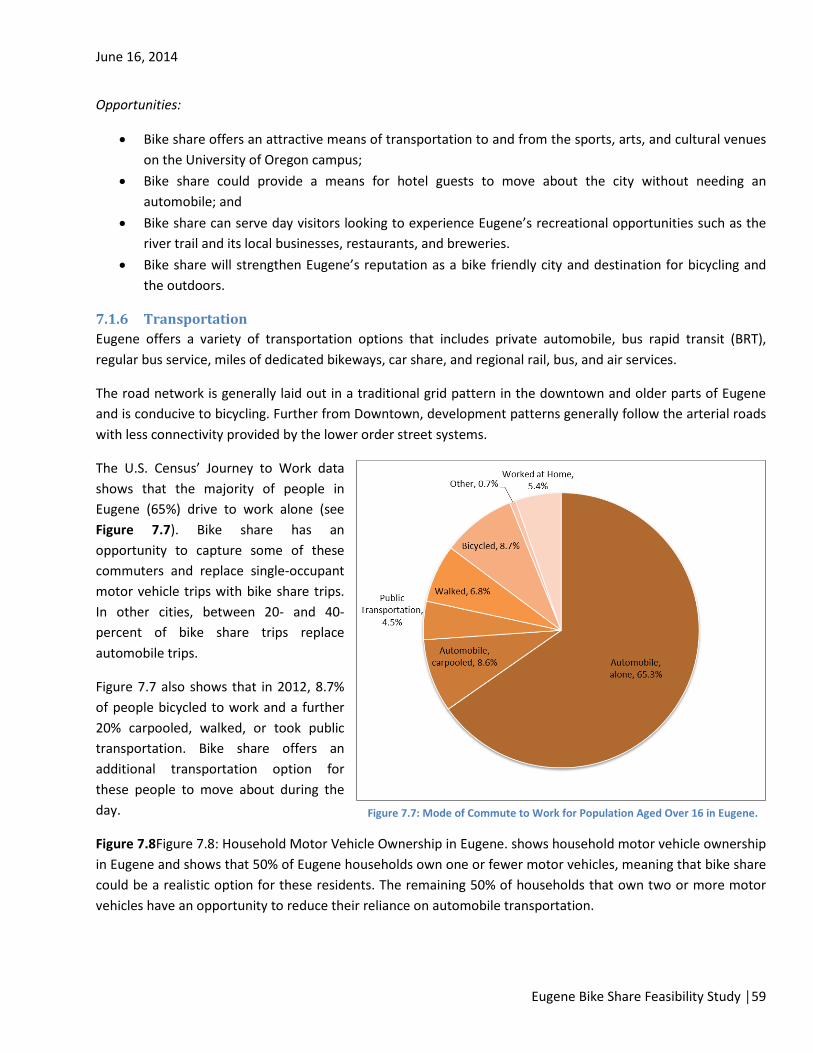
June 16, 2014
Eugene Bike Share Feasibility Study │59
Opportunities:
• Bike share offers an attractive means of transportation to and from the sports, arts, and cultural venues on the University of Oregon campus;
• Bike share could provide a means for hotel guests to move about the city without needing an automobile; and
• Bike share can serve day visitors looking to experience Eugene’s recreational opportunities such as the river trail and its local businesses, restaurants, and breweries.
• Bike share will strengthen Eugene’s reputation as a bike friendly city and destination for bicycling and the outdoors.
7.1.6 Transportation Eugene offers a variety of transportation options that includes private automobile, bus rapid transit (BRT), regular bus service, miles of dedicated bikeways, car share, and regional rail, bus, and air services.
The road network is generally laid out in a traditional grid pattern in the downtown and older parts of Eugene and is conducive to bicycling. Further from Downtown, development patterns generally follow the arterial roads with less connectivity provided by the lower order street systems.
The U.S. Census’ Journey to Work data shows that the majority of people in Eugene (65%) drive to work alone (see Figure 7.7). Bike share has an opportunity to capture some of these commuters and replace single-occupant motor vehicle trips with bike share trips. In other cities, between 20- and 40-percent of bike share trips replace automobile trips.
Figure 7.7 also shows that in 2012, 8.7% of people bicycled to work and a further 20% carpooled, walked, or took public transportation. Bike share offers an additional transportation option for these people to move about during the day.
Figure 7.8Figure 7.8: Household Motor Vehicle Ownership in Eugene. shows household motor vehicle ownership in Eugene and shows that 50% of Eugene households own one or fewer motor vehicles, meaning that bike share could be a realistic option for these residents. The remaining 50% of households that own two or more motor vehicles have an opportunity to reduce their reliance on automobile transportation.
Figure 7.7: Mode of Commute to Work for Population Aged Over 16 in Eugene.

June 16, 2014
Eugene Bike Share Feasibility Study │60
Transit in Eugene and Springfield includes an extensive network shown on Figure 7.9 that includes the EmX (LTD’s bus rapid transit (BRT) system) and regular bus services. The EmX line runs from Downtown Eugene along Franklin Boulevard through the University of Oregon campus and into Downtown Springfield. From there the service runs north along Pioneer Parkway to Sacred Heart Medical Center and loops around International Way and Gateway Street via the Gateway Mall.
The rest of Eugene and Springfield is served by regular bus services. Most of the routes follow the major roadway corridors feeding into either or both Downtown Eugene and Downtown Springfield. There are a number of transit stations in Eugene and Springfield that represent locations to transfer between services. These locations will be important hubs for bike share stations.
Figure 7.9: Lane Transit District Service Map.
Figure 7.8: Household Motor Vehicle Ownership in Eugene.

June 16, 2014
Eugene Bike Share Feasibility Study │61
Figure 7.10 shows a map of annual ridership based on boarding and alighting data at transit stops in Eugene and Springfield. The map shows that the busiest stations are in Downtown Eugene, on the University of Oregon campus, in Downtown Springfield, and along the EmX line. These should be the initial focus of bike share stations designed to extend and enhance transit services.
Figure 7.10: Transit Ridership by Stop in Eugene and Springfield.
Other transportation options with synergies to bike share in Eugene include:
• Car share services offered by Enterprise Car Share and WeCar. These services could be coupled with bike share to complete a suite of transportation options as an alternative to motor vehicle ownership. Bike share could also be used to access car share locations;
• Regional rail service on the Cascade Line. The Amtrak Station is located in Downtown Eugene and would be an ideal location for a bike share station to serve incoming visitors;
• Regional bus services such as Greyhound offering service from Downtown Eugene. Similarly, bike share could provide a last mile extension for incoming visitors; and

June 16, 2014
Eugene Bike Share Feasibility Study │62
• Eugene Airport, which serves over 400,000 arrivals each year and is located approximately 9 miles from Downtown Eugene. Although the airport itself may be too far to initially serve with bike share, this service could be coupled with door-to-door shuttle and / or taxi services to offer visitors a non-automobile way to move around town.
Bicycling is a popular and effective way to get around town. In 2012, 8.7% of workers 16 years and older commuted to work by bicycle. Eugene has been recognized by the League of American Bicyclists as a Gold Level Bicycle Friendly Community since 2004 and features over 165 miles of bikeways46 including:
• 42 miles of shared use paths; • 81 miles of on-street bike lanes; • 35 miles of signed bikeways; • 5 bridges across the Willamette River; and • 2 overcrossings of major roadways.
A map of bicycle facilities in Eugene is included on Figure 7.11.
Figure 7.11: Existing Bikeways in Eugene and Springfield.
46 City of Eugene website accessed at http://www.eugene-or.gov/index.aspx?NID=489 on January 6, 2014.

June 16, 2014
Eugene Bike Share Feasibility Study │63
Challenges:
• Single occupant motor vehicle travel is still a high portion of trip-making in the region. Parking is generally low cost and provides little disincentive to driving.
Opportunities:
• Bike share provides an additional mobility option that can be coupled with other transportation options to reduce reliance on automobile travel. It will be a realistic option for the nearly 50% of households that own one or fewer motor vehicles;
• Bike share offers a first- and last-mile connection to and from transit and in particular should be provided as an option at major transit stations and connection points;
• Linked with regional travel options and car share services, bike share completes a realistic set of transportation options that will allow residents and visitors to move around the city without the need for a private automobile; and
• Eugene has a strong bicycling culture and an extensive bikeway network that can be utilized to provide bike share users with a comfortable and safe way to move between stations. Eugene has a proven record of investment in bicycle infrastructure.
7.1.7 Demand Analysis / Heat Mapping A demand (or “heat mapping”) analysis was performed using GIS data provided by Lane Transit District, the City of Eugene, and from publicly available sources. Bike share works best where there is a variety and density of different land uses and as such the bike share demand map was created by aggregating various population, employment, housing, attraction and proximity data. This included:
• Population Density; • Employment Density; • Student Housing; • College Enrollment; • Community and Tourist Attractions (e.g. libraries, community centers, sports venues, etc.); • Transit; • Bicycle Infrastructure; and • Topography.
The heat mapping methodology includes a point-scoring system where points are allocated for an area based on its performance in each of the above categories. These are then summed to give a total “suitability” score. The weighting and methodology used for each variable is described in Table 7.3.

June 16, 2014
Eugene Bike Share Feasibility Study │64
Table 7.3: Heat Mapping Scoring and Methodology
Variable Points Methodology
Population Density
20 Census blocks grouped into quartiles based on their population density. Census blocks assigned scores based on which quartile they fall, e.g. top quartile = 20/20, bottom quartile = 5/20.
Employment Density
20 Census blocks grouped into quartiles based on their employment density. Census blocks assigned scores based on which quartile they fall, e.g. top quartile = 20/20, bottom quartile = 5/20.
Student Housing 10 Point locations grouped into quartiles based on their number of units. Locations assigned scores based on which quartile they fall, e.g. top quartile = 10/10, bottom quartile = 2.5/10. Scores graduated from the maximum score within a ¼ mile radius from the point location and decreasing out to ½ mile radius from the point location.
College Enrollment
10 College campuses assigned scores based on enrollment, e.g. University of Oregon = 25,000 student enrollment = 10 points, LCC = 15,000 student enrollment = 6 points. Points assigned to the entire campus area.
Community and Tourist Attractions
20 Point locations based on information from LTD, the City, and publicly available maps. These locations include:
• Main library (20 points) • Community centers and branch libraries (15 points) • Major arts, culture, and sporting venues (15 points) • Tourist attractions (15 points) • Major hotels (10 points) • Local markets, restaurants, and breweries (10 points) • Parks (5 points)
Scores graduated from the maximum score within a ¼ mile radius from the point location and decreasing out to ½ mile radius from the point location.
Transit 15 Transit stops grouped into quartiles based on annual ridership data. Stops assigned scores based on which quartile they fall, e.g. top quartile = 15/15, bottom quartile = 4/15. Scores graduated from the maximum score within a ¼ mile radius from the point location and decreasing out to ½ mile radius from the point location.
Bicycle Infrastructure
5 Bikeways coded as line segments. 5 points assigned to every line segment that has a bikeway. Scores graduated from the maximum score within a ¼ mile radius from the line segment and decreasing out to ½ mile radius from the line segment.
Topography (-10 points) Negative points assigned to areas with steep topography. Areas with >3% average slope = -5 points; areas with >5% average slope = -10 points.
TOTAL 100 Combined total of above scores
The results of the heat map are shown on Figure 7.12. As expected, the major concentrations of activity are around Downtown Eugene and the University of Oregon campus with isolated pockets of activity along some of the commercial corridors and at particular attractions and destinations. The outputs from the heat map were combined with public and stakeholder input to define the bike share service area and develop a phasing plan (see Section 8).
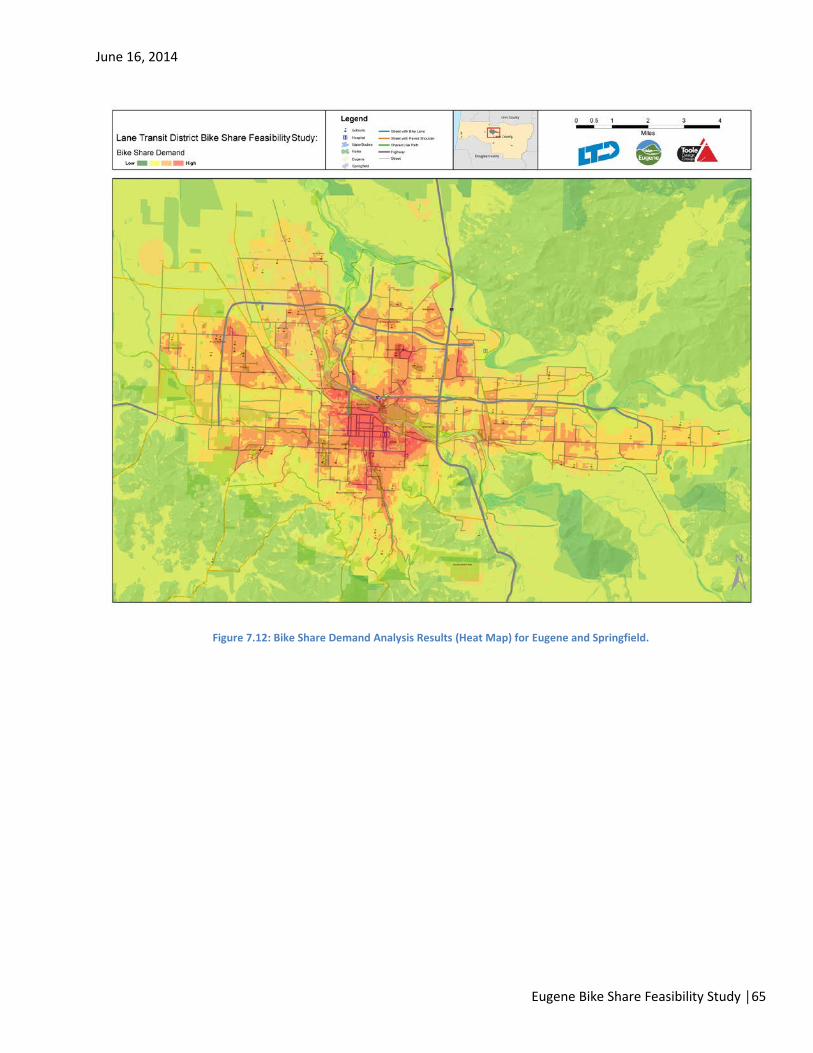
June 16, 2014
Eugene Bike Share Feasibility Study │65
Figure 7.12: Bike Share Demand Analysis Results (Heat Map) for Eugene and Springfield.

June 16, 2014
Eugene Bike Share Feasibility Study │66
8 Preliminary System Plan This chapter provides recommendations on phasing and station location based on the results of previous chapters. Specifically, the results of the community analysis and feedback received from the public and agency partners were used to define the boundaries of the first five phases of the system and determine the number of stations, bikes, and docks for each phase. This chapter also includes a set of siting guidelines for bike share station locations in the public right-of-way.
8.1 System Phasing Figure 8.1 shows phasing for the proposed bike share system. This was developed from overlays of the bike share suitability heat map (See Section 7.1) and the crowd-sourced bike share station map (See Section 6.1). It reflects areas with the highest potential demand and industry best practices for contiguous expansion of the system.
Figure 8.1: Proposed Phasing Plan for a Bike Share System in Eugene.

June 16, 2014
Eugene Bike Share Feasibility Study │67
Phase 1 includes the four station bike share system proposed for the University of Oregon in 2015. Phases 2, 3, 4, and 5 include expansion of the system on the University of Oregon campus as well as the introduction of bike share into the City of Eugene. The proposed Phase 2 service area represents the highest demand areas of Downtown, the Whiteaker neighborhood, and connections to the University of Oregon campus. Phase 3 will fill in more of Downtown and the Whiteaker neighborhood and start expanding into South Eugene. Phase 4 expands the system into the Jefferson Westside neighborhood, to the north side of the Willamette River, and extends further into South Eugene. Phase 5 focuses on infilling previous phases.
The size of each phase, i.e., the number of stations and bikes in each, was developed based on:
• System-wide station densities in other small- to medium-sized cities that range from 4 to 6 stations per square mile, but vary depending on the intensity of land use. Densities are higher in downtowns and other built up areas as these typically generate higher activity for bike share. As a general rule, stations should be placed at a consistent density so that users have an expectation that stations are available within a reasonable walking distance from anywhere in the system area. This also provides some redundancy so that if a station is empty or full a user can go to a nearby station and find an available bicycle or an empty dock. In high activity areas, stations may be spaced one quarter to one third of a mile apart (a five to ten minute walk), which represents station densities between 9 and 16 stations per square mile. In some cases, stations may be more “destination based”. In these cases, where there may not be other stations nearby, additional capacity (i.e., more docking points) should be considered to avoid users being faced with empty or full stations.
• Capital funding capacity, which requires that a phase not be so large that it could not be realistically funded.
• Although there are no definitive guidelines for the optimal size of a bike share system, new research has shown that ridership increases disproportionately with the number of stations. For example, Figure 8.2 shows that the growth in ridership of Washington D.C.’s Capital Bikeshare has increased at a higher rate than the increase in the number of stations since the system launched. In creating a critical mass for the system, too few stations will serve only a limited number of destinations and be less useful to potential riders. It is recommended that the initial system in the City of Eugene (Phase 2) start with no fewer than 10 stations.
• Peer cities have adopted dock-to-bike ratios ranging from 1.5 to 1.9 docks per bike. This ratio is important as higher ratios reduce rebalancing needs and therefore operating costs, but must consider the higher capital cost to provide more docks. A ratio of 1.8 docks-per-bike has been assumed for Eugene to balance these factors.
The identified phasing does not preclude future expansion into other areas and future phases could logically include expansion of the system into Springfield and other parts of Eugene. Expansion should only be considered after an initial operating period of six to twelve months when operation of the system is better understood and funding commitments for these expansions are in place.
A summary of system statistics for the first five phases of the proposed bike share system in Eugene is included in Table 8.1.

June 16, 2014
Eugene Bike Share Feasibility Study │68
Table 8.1: Proposed System Size for a Bike Share System in Eugene
Phase 1 Phase 2 Phase 3 Phase 4 Phase 5 TOTAL Description University of
Oregon Downtown, Whiteaker
Infill, Amazon Jefferson West, north side of
Willamette River
Infill
Coverage Area (square miles)
0.3 3.0 0.7 2.0 - 6.0
Station Density (stations / sq.mi.)
13.3 6.0 11.4 5.0 - 7.67
Stations 4 18 8 10 6 46 Bikes per Station 10 10 9 8 8 9.1 Bikes 40 180 72 80 48 420 Docks per Bike 1.8 1.8 1.8 1.8 1.8 1.8 Docks 72 324 130 144 86 756
8.2 Preliminary Station Locations Stations should generally be placed in safe, convenient, and visible locations. Station locations may include the public right-of-way in the street, on sidewalks, or in parks and other public lands. They can also be located on private property through the use of a License Agreement with the property owner. In all instances stations should be available at all times to the public and to the operator for the purposes of maintenance and bicycle redistribution.
Figure 8.2: Growth in Capital Bikeshare Ridership Compared to the Increase in System Size.
Source: Darren Buck.

June 16, 2014
Eugene Bike Share Feasibility Study │69
General station locations were identified for the first five phases of the bike share system at an intersection or location level. Locations were determined based on public input, stakeholder suggestions, local attractions, the results of the heat mapping analysis, and suggestions from City, LTD, and University of Oregon project staff. These were refined to more specific locations, (e.g., on the sidewalk on the east side of Willamette Street, just north of 13th Avenue), based on a desktop review of available aerial photographs and street-level photos. These locations will need to be confirmed considering available space, the specific needs of the equipment vendor, solar exposure, sponsorship, and outreach to adjacent land owners and businesses.
Preliminary station locations are shown on Figure 8.3 and listed in Table 8.2. Identification of a bike share station on these maps does not commit a bike share station to this location. These are suggested locations arranged to achieve the suggested station density and are a starting point for future refinement of the plan.
Figure 8.3: Preliminary Station Locations for a Bike Share System in Eugene.

June 16, 2014
Eugene Bike Share Feasibility Study │70
Station sizes (i.e., the number of docks) were determined based on the relative demand of each location from the heat map, manually adjusted with other considerations not captured by the heat mapping analysis, such as visitor attractions, local hang-outs, public and stakeholder popularity, and proximity to EmX stations. Individual phase maps are included in Appendix F.
Table 8.2: List of Preliminary Station Locations
Station Number
Station Name Docks Station Number
Station Name Docks
Phase 1 Phase 3 1 UO Transit 19 23 13th and Lawrence 17 2 EMU 19 24 5th and Lincoln 17 3 Knight Law School 17 25 17th and Charnelton 13 4 UO Education 17 26 18th and Pearl 15
Phase 2 27 24th and Amazon Path 15 5 Blair and Van Buren 17 28 24th and Alder 13 6 1st and Jackson 17 29 19th and Agate 19 7 Monroe and Blair 17 30 Matthew Knight Arena 19 8 Madison and 1st 15 Phase 4 9 Broadway and Charnelton 23 31 12th and Chambers 13
10 10th and Olive 23 32 18th and Chambers 13 11 Willamette and 5th 19 33 16th and Polk 15
12 Willamette and Broadway 23 34 Valley River Way and North Bank Path 15
13 13th and Willamette 21 35 25th and Willamette 13 14 16th and Willamette 15 36 29th and Willamette 15 15 5th and Pearl 19 37 29th and Amazon 15 16 8th and Pearl 19 38 Hilyard and 28th 13 17 13th and Pearl 17 39 Alton Baker Park/DeFazio Bridge 17 18 8th and Ferry 17 40 MLK and Kinsrow 17 19 Hilyard Station 15 Phase 5 20 Kincaid and 14th 15 41 Polk and 6th 15 21 UO Riverfront 15 42 13th and Monroe 13 22 13th and Agate 17 43 EWEB Riverfront 15
44 34th and Hilyard 13 45 Riverfront Research Park 15 46 Garden and Walnut 15
8.3 Permitting and Station Siting Guidelines This section addresses the station siting and permitting needs for implementing the proposed bike share system. General station locations were identified in the section above. The project team worked with staff at the City of Eugene, LTD, and the University of Oregon to understand the permitting process and station design considerations that will allow the future system operator to quickly work through the permitting process with each of these agencies.

June 16, 2014
Eugene Bike Share Feasibility Study │71
8.3.1 Permitting Process Station permitting can be a major time draw in the implementation of a bike share system. It is advised that a streamlined or bulk permitting process be established early in the project. It will also be important to get the necessary buy-in from all applicable agencies. This could include various departments of the City that may need to review the permit applications, public utility companies, fire and police departments, the local transit agency, etc. Depending on location and funding conditions, additional agencies such as the state Department of Transportation or Historic Preservation Office may need to be consulted. Public consultation and surrounding business outreach will also be an important part of the process to understand local conditions and concerns.
City of Eugene
Based on conversations with the City of Eugene’s permitting staff, bike share stations would be subject to the City’s encroachment permitting process and require a revocable permit, available through the Building and Permit Center, for stations installed in the public right-of-way.
Stations located on private property may need to be reviewed to determine whether the space that the bike share station would occupy was a requirement of the approved site plan. If it was a requirement, this may trigger the need for staff review and potentially an adjustment review if the site plan needs to be changed. Such instances will need to be reviewed on a case-by-case basis with the City’s Planning and Development Department.
Lane Transit District
Lane Transit District does not own a lot of properties being suggested for bike share stations. However, where stations are to be located on LTD property, stations will need to be reviewed and approved by LTD.
University of Oregon
Stations located on the University of Oregon are subject to review by Campus Planning as well as any City review if these sites are located on public right-of-way.
8.3.2 Station Guidelines The stations identified in the section above will need to be verified in the field prior to deployment and may need to be relocated depending on right-of-way availability and ownership, physical space availability away from utilities and other obstacles, operating requirements such as solar and wireless communication access, and consultation with adjacent land owners.
The following provides some of the key considerations for each station type. An example set of station guidelines were developed based on standards from other cities and will need to be reviewed and adapted to Eugene in consultation with City Engineering staff.47 These are included in Appendix G.
47 New York City DOT (2012). NYC Bike Share – Designed by New Yorkers. Report on Bike Share Outreach.

June 16, 2014
Eugene Bike Share Feasibility Study │72
Sidewalk Site Requirements
Sidewalk sites should not interfere with existing pedestrian travel patterns and must maintain sufficient clearance to fixed objects and utilities. Examples of sidewalk stations in other cities are included in Appendix H.
On-Street Site Requirements
On-street sites typically make use of converted parking spaces; however restricted parking areas may also be considered where these sites do not impact sight lines. Where possible, it is preferred that on-street sites first consider conversion of non-metered parking and that any metered parking conversion be reviewed by the City’s Parking Services Department.
Generally, on-street stations should first consider low traffic volume streets. However, higher traffic volume streets can be considered where there is sufficient width for a user to pull a bike from the station without encroaching into the traffic lane, or where there is a buffer provided between the station and moving traffic, e.g., a bike lane or painted buffer.
Standard safety treatments should be developed for on-street stations in consultation with the City’s Engineering Department and may include street markings, bollards, or other safety equipment. Examples of on-street stations in other cities are included in Appendix H.
Parks and Other City Property
Sites may be placed on Parks Department or other City property at the discretion of the relevant agency. In general, sidewalk siting guidelines apply to these sites.
Private Property
Sites may be placed on private property at the discretion of the owner. The operator must secure a License Agreement to establish the terms of use, to transfer liability, and to ensure the site is accessible to the public at all times. Generally, sidewalk siting guidelines apply to these sites. Examples of stations in other cities located on private property are included in Appendix H.

June 16, 2014
Eugene Bike Share Feasibility Study │73
Section III
Implementation
Source: Chicago Tribune

June 16, 2014
Eugene Bike Share Feasibility Study │74
9 Business Model Evaluation A key outcome of this Feasibility Study is to select a governance structure for the system. In general, the following functions are required to mobilize and operate a bike share system:
• Obtain political, public, and other support. • Raise funds for initial capital and early operating costs. • Procure the equipment vendor and the operator. • Administer contracts with the equipment vendor and the operator. • Own and maintain the system and its assets. • Evaluate and expand the system.
These functions can be undertaken by one or more organizations. Existing U.S. bike share systems operate under different business models depending on the jurisdiction’s funding environment, institutional capacity, and local transportation needs. The relationship between system owners and operators in U.S. bike share systems is shown on Figure 9.1. The most common models are systems owned by cities and operated by a private contractor, non-profit owned and operated, or privately owned and operated. Each model is reviewed in more detail in the section below and an evaluation of the role of public agencies, non-profit organizations, and the private sector in owning and managing a potential bike share system in Eugene are evaluated in Appendix I. The evaluation considers a number of criteria including key operating parameters and local priorities identified in the system goals and objectives of Section 5. The evaluation criteria included:
• Who will own the system? • Who will be responsible for raising capital funds? • Who will operate the system and be responsible for covering operating costs? • What potential funding sources are available under this business model? • What is the organizational capacity and interest for this model? • Does the model allow for regional expansion? • How does the model meet the goals and objectives for the system, including:
1. Personal mobility: integrating bike share with existing transit services and connecting to Downtown Eugene and the University of Oregon.
2. Bicycling, health, and safety: increasing the prevalence and role of bicycling in Eugene and encouraging improved health and safety outcomes.
3. System quality: operating a well-designed and well maintained system that is oriented towards high customer service standards.
4. Long term financial sustainability: ensuring sustainable sources of capital and operations funding relying on minimal local public assistance.
5. Social and geographic equity: ensuring the system is accessible and affordable to all socio-economic groups.
6. Economic benefits: creating a system that can benefit local business, draw national attention, and attract employers, new residents, and visitors.
These models and the results of the evaluation are described in the sections below.
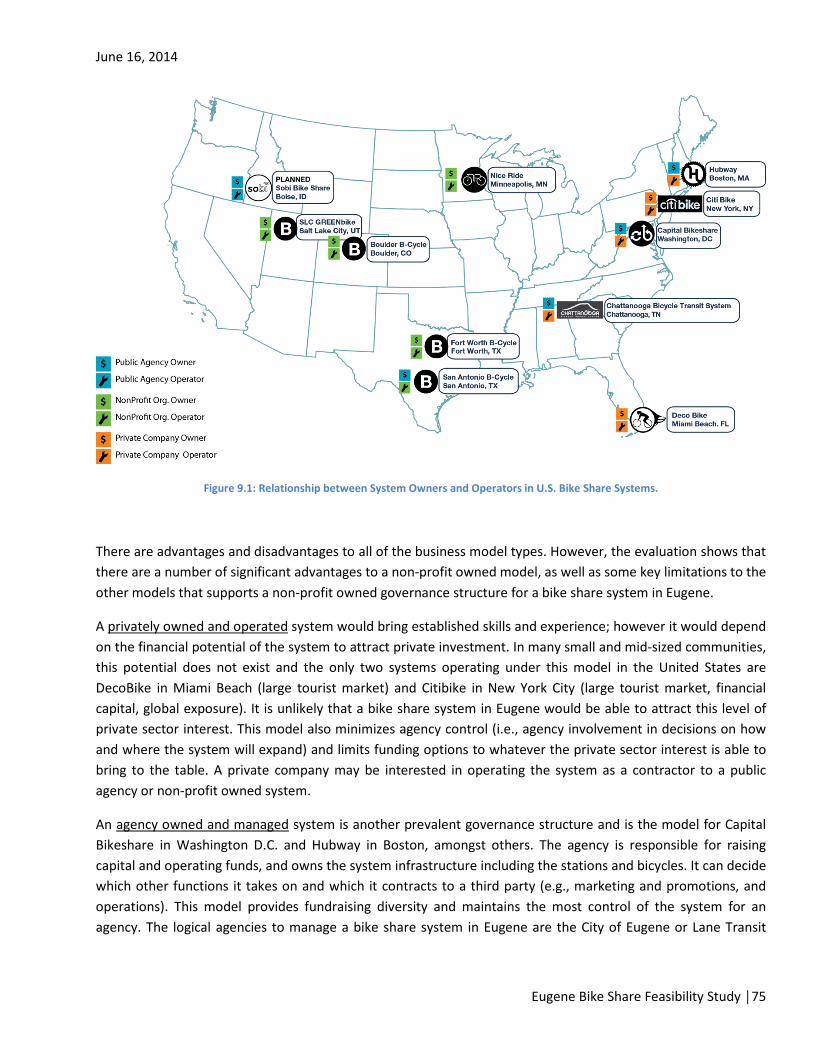
June 16, 2014
Eugene Bike Share Feasibility Study │75
Figure 9.1: Relationship between System Owners and Operators in U.S. Bike Share Systems.
There are advantages and disadvantages to all of the business model types. However, the evaluation shows that there are a number of significant advantages to a non-profit owned model, as well as some key limitations to the other models that supports a non-profit owned governance structure for a bike share system in Eugene.
A privately owned and operated system would bring established skills and experience; however it would depend on the financial potential of the system to attract private investment. In many small and mid-sized communities, this potential does not exist and the only two systems operating under this model in the United States are DecoBike in Miami Beach (large tourist market) and Citibike in New York City (large tourist market, financial capital, global exposure). It is unlikely that a bike share system in Eugene would be able to attract this level of private sector interest. This model also minimizes agency control (i.e., agency involvement in decisions on how and where the system will expand) and limits funding options to whatever the private sector interest is able to bring to the table. A private company may be interested in operating the system as a contractor to a public agency or non-profit owned system.
An agency owned and managed system is another prevalent governance structure and is the model for Capital Bikeshare in Washington D.C. and Hubway in Boston, amongst others. The agency is responsible for raising capital and operating funds, and owns the system infrastructure including the stations and bicycles. It can decide which other functions it takes on and which it contracts to a third party (e.g., marketing and promotions, and operations). This model provides fundraising diversity and maintains the most control of the system for an agency. The logical agencies to manage a bike share system in Eugene are the City of Eugene or Lane Transit
June 16, 2014
Eugene Bike Share Feasibility Study │76
District. However, discussions with City and LTD decision makers have indicated that these agencies do not have the capacity to take on this role as dedicated staff would be required to manage the system.
The non-profit governance structure provides a number of advantages that make it the most suitable governance structure for a bike share system in Eugene. The selection of an existing non-profit, or creation of a new non-profit specifically charged with managing bike share is a model that has been successful for small to medium-sized cities including Boulder B-Cycle and Salt Lake City GREENbike.
Funding for equipment typically comes to the non-profit in the form of public, private and philanthropic sources. The ongoing financial responsibility for operations and additional equipment falls to the non-profit. As a result of the constant need to cover operating costs and raise funds for expansion, some percentage of staff time must be committed to obtaining multiple sources of funding. The non-profit would have the option of operating the system directly or contracting this, and any other functions to a third party.
A non-profit model would:
• Simplify integration of the University of Oregon system by allowing the University of Oregon to turn over operations, be represented on the Board of Directors, and decide whether to maintain or transfer ownership of their system assets.
• Simplify regionalization of the bike share system allowing individual jurisdictions (such as Springfield) to enter the system via a central contracting authority.
• Allow for the most cost-effective operating model (if the non-profit decides to take on operations). Non-profits tend to have lower operating costs due to the efficiency of being small organizations, gaining assistance from in-kind donations and services, and paying somewhat lower salaries and wages due to the fact that it is a mission-based organization.
• Allow for the most diverse range of funding sources including public, private, and philanthropic sources. • Transfer risk and ongoing financial responsibility from the partner agencies to the non-profit, but still
maintain some level of transparency and control over decision making through Board representation and public reporting requirements.
Recommended Model: Non-Profit Owned and Managed
Based on the above analysis, this report recommends a Non-Profit Owned system for Eugene. The non-profit can either choose to operate directly or hire a private operator. The City, LTD, and University of Oregon should have representation on the Board of Directors, be funding partners, and offer varying levels of in-kind services to the non-profit organization. Other major stakeholders will be other jurisdictions that join the system, sponsors and potentially service-oriented community members and businesses who offer in-kind donations to the system. The non-profit will be ultimately responsible for covering operating costs and raising capital funds for the system startup and expansion.
“There are a number of significant advantages that supports a non-profit owned governance structure for a
bike share program in Eugene.”

June 16, 2014
Eugene Bike Share Feasibility Study │77
This model can take some time to ramp up to full operations. An existing non-profit will need to build new organizational structures and staff capacity, while a new non-profit may take time to navigate the application and certification process and may rely on agency or other organizational support during its initial stages. In other cities, there are a number of reasons existing non-profits have not taken on responsibility for bike share systems: (1) bike share is outside of the mission of many of these organizations; (2) taking on responsibility for management and operations of what is essentially a new public transportation system is a large undertaking and often outside of the skills and capacity of many existing non-profits; (3) there are specific liability, insurance and employment requirements that may be outside the budget or comfort of existing non-profits; and (4) it is advantageous for a bike share non-profit to allow for representation from multiple agencies, jurisdictions and sponsors on its board of directors, and such representation is difficult to achieve under an existing non-profit. There are structures that have been researched by other cities such that a new non-profit could be housed within an existing non-profit or agency, but with a separate board of directors and funding, but no such structure has yet been implemented.
The City, LTD, and University of Oregon should maintain an active involvement in the process and could provide assistance helping to form or select a non-profit to run the system, applying for grants, assisting or undertaking procurement, or site planning and launch assistance. An additional level of support could be for the City or LTD to provide administrative services, such as human resources and accounting for a regular management fee. Such assistance would be invaluable to the non-profit, particularly during the early, capacity building stages, which are the most difficult for any small organization. The non-profit organization will be responsible for procuring an equipment vendor and a third-party operator (if different from the non-profit), undertaking contract negotiations, administering the operating contract, marketing and promotion, and evaluating and setting the direction of the system.
Table 9.1 summarizes the role of partner organizations and funding strategies for non-profit run bike share systems in the peer cities. These case studies show that there is no single “right” way to form, implement, or operate a bike share system in a small community. In all cases, cities have built on the momentum created by those championing the idea of bike share. In some instances this is a grass-roots community group (such as in Boulder and Aspen48), a business improvement association (such as in Salt Lake City), or through the local transit agency (in the case of Fort Worth). Most systems however, receive their impetus through the support of city government. In particular, systems have tended to be most successful (especially in obtaining capital and sponsorship dollars) when there has been early and visible mayoral support for the system.
Membership and user fees generally cover only a portion of the operating cost (up to 35% in Boulder, although larger city non-profit bike share systems such as Minneapolis and Denver operate at 40% and 54% respectively) with the remainder needing to be supplemented by other sources, primarily from sponsorship and advertising. Smaller markets tend to attract numerous smaller sponsors rather than a few large ones. This means a lot of time and effort is required to identify, commit, and retain sufficient sponsorship to make the system financially sustainable.
48 The WE-Cycle system in Aspen, Colorado was also established through the grass-roots efforts of local champions.

June 16, 2014
Eugene Bike Share Feasibility Study │78
Table 9.1: Case Studies of Small Community Bike Share Systems in the United States
Boulder B-Cycle
Fort Worth Bike Sharing
Salt Lake City GREENbike
Eugene (Proposed)
BUSINESS MODEL Impetus Driven By
Local community advocates
Transit Agency City and Chamber of Commerce
LTD, City and University of Oregon
Ownership Non-Profit
Non-Profit Non-Profit Non-Profit
Operator Non-Profit
Non-Profit Downtown Alliance Non-Profit or Private
City Role Funding agent, federal / state grant agent,
Board representation, planning
Planning partner Board representation, funding partner
Board representation, funding partner, in-
kind services
Transit Agency Role
Project partner Initiated bike share idea, FTA grant agent,
project partner, sponsor, station
planning
Strategic partner, funding partner
Board representation, funding partner, in-
kind services
College Role Project partner, one station on campus, sponsor, planning
partner
Stations on campus, subsidized
membership, research
Stations on campus, discounted
membership, sponsor
Board representation, funding partner, in-
kind services
FUNDING Capital City pursues federal,
state, local grants; the non-profit fundraises
local match
Federal grant Transit Authority pursued FTA grant
Federal and state grants, local funding
match, developer contributions
Operations Membership and usage fees (35%);
sponsorship; local funds
Membership and usage fees (25%) and
sponsorship
Sponsorship and other forms of private
funding
Membership and usage fees, sponsorship, local
funds
Non-profits are well placed to receive capital funding from a variety of sources, but in most cases rely on the city or transit agency to identify, seek, and disburse federal, state, or local grants for capital funding. The responsibility for local matches can fall to the public agency, the non-profit, or both.
Two important considerations in setting up a non-profit are getting appropriate and effective representation on the Board of Directors and fulfilling staffing requirements.
Board representation varies between cities, but in other non-profit owned and operated systems the Board of Directors ranges from nine to nineteen members. It is recommended that in Eugene a Board of nine to eleven members is appropriate for the proposed size of the bike share system. There are two common Board structures. The traditional model, adopted in Boulder, Denver, and Minneapolis is more “skills-oriented” with Board representatives coming from a variety of sectors including:
June 16, 2014
Eugene Bike Share Feasibility Study │79
• Legal services; • Accounting and other financial services; • Communications and marketing; • University staff or faculty; • City government – typically someone representing transportation, planning or engineering services, and
in some cases someone representing the mayor’s office; • Regional or state agency representatives may also be appropriate; • Transit agency representative; and • Major sponsors.
Two recent systems in Salt Lake City and Fort Worth have adopted more “civic-sector” focused Board structures that include high-level representatives from:
• Chamber of Commerce or Business Improvement Districts; • Visitors and Convention Bureau; • City government (in the case of Salt Lake City, the Mayor is a Board representative along with a
transportation staff representative); • Transit agency (in the case of Fort Worth, this agency comprises four Board positions); and • Other well-connected individuals or organizations.
Staffing requirements will depend on what functions the non-profit decides to take on in-house and which functions it outsources to third parties. The number of staff varies based on the size of the system with smaller systems in Boulder, Madison, and Fort Worth employing 7 staff and larger systems in Denver and Minneapolis employing 11 to 13 staff. Some of these positions are part-time. The staff breakdown of the Boulder B-Cycle system may be a useful guide for the staffing needs for the system in Eugene, although these will depend on what functions the non-profit decides to take on. Boulder B-Cycle staff include:
• Executive Director; • Operations and Customer Service Manager; • Marketing and Communications Manager; • Service Manager; • Site Planner (part-time); and • Fleet Technicians (2) (part-time).
Summary of Business Model Recommendations
The following recommendations are made for the potential 46 station bike share system in Eugene based on the analysis above:
• A non-profit owned governance structure is recommended to facilitate integration with the University of Oregon system, enable future regionalization of the system, allow for the most diverse range of funding sources, and to allow the local public agencies to maintain some control of the system whilst transferring financial risk for the system;
June 16, 2014
Eugene Bike Share Feasibility Study │80
• The non-profit may take on operations of the system or contract these services to a third party. The non-profit will need to determine what services it keeps in-house and which services it contracts. Based on systems of similar size, approximately 10 staff will be required if operations are included; and
• A Board of Directors will need to be established and should be between 9 and 11 members including representatives from key skill sets such as accounting, legal services, communications and marketing, major sponsors, and agency staff or political leaders from LTD, City of Eugene, and University of Oregon.
A new non-profit may take some time to establish and ramp up to full operations. The City, LTD, and University of Oregon should maintain an active involvement in the interim process and may need to take on early fundraising, procurement, and site planning responsibilities.

June 16, 2014
Eugene Bike Share Feasibility Study │81
10 Financial Analysis This section explores the financial needs and performance of a potential bike share system in Eugene and recommends a funding plan for pursuing required funds. A financial pro-forma was prepared to understand the capital, installation, and operating costs of the proposed bike share system and to forecast potential revenues. The pro-forma evaluates a five-year initial operating period, which is a typical contract length for bike share in the United States. It also considers the sensitivity of a number of the assumptions used in the financial pro-forma, such as the impact of lower or higher than expected ridership.
The funding plan takes the results of the financial analysis to understand the level of funding that is expected to come from membership and user fees and explores what other funding sources are available to meet capital and operating funding requirements. This includes a review of possible federal and state funds, local public funding, as well as a review of the role that advertising or sponsorship might play in funding the system.
10.1 Financial Pro-Forma The financial pro-forma includes a five-year evaluation of expected system costs and revenues starting from when the non-profit takes over ownership and operations of the system (note that Phase 1 will initially be operated by the University of Oregon Bike Program before transferring to the non-profit structure when the system expands into the City of Eugene).
The pro-forma includes numerous inputs. Where these variables were unknown, information was gathered from membership, ridership and financial data for 18 systems of various sizes across North America. The data for these systems is included in Appendix J.
10.1.1 System Size and Phasing Assumptions The system sizes and phasing recommended in Section 8 were used to develop the financial pro-forma. Some assumptions were made regarding the timing of each phase as shown in Table 10.1. It is assumed that Phase 1 – the four station system at the University of Oregon – will be operational prior to Phase 2 launching. The pro-forma does not include costs and revenues for operation of Phase 1 prior to the non-profit taking over ownership of the system. To model the integration of the University of Oregon system into the expanded system in the City of Eugene, it was assumed that Phases 1 and 2 launch under the non-profit structure at the same time in Spring (Q2) of Year 1.
Phases 3, 4, and 5 are assumed to be implemented one per year beginning in Spring (Q2) of Year 3. This is an aggressive schedule but will give a sense of the costs involved in implementing all five phases of the initial system.
10.1.2 Business Model Assumptions The financial model assumes that the system is owned, managed, and operated by a new non-profit and as such all operating costs are taken on by this organization. The non-profit may decide to contract some services (such as site planning, marketing, or operations) to a third-party contractor. Operating costs would need to be revised to account for this change.

June 16, 2014
Eugene Bike Share Feasibility Study │82
Table 10.1 Recommended System Size and Phasing
Phase 1 Phase 2 Phase 3 Phase 4 Phase 5 Total
Installation Date Q2 Year 1 Q2 Year 1 Q2 Year 3 Q2 Year 4 Q2 Year 5
Number of Stations 4 18 8 10 6 46
Number of Bikes 40 180 71 81 48 420
Number of Docks 72 324 128 145 87 756
10.1.3 Capital and Installation Costs Based on an average of recent prices for the major bike share equipment vendors in the United States, a 10 bike / 17 dock station represents a total cost of $41,000 per station that includes the base equipment plus shipping and other fees, spare parts, system keys, stickers and a system map.
The pro-forma includes $1,000 per station for installation, which includes travel for the equipment vendor, and any extra labor and equipment not provided by the equipment vendor. If site planning and permitting is contracted to a third party, this cost is approximated at an additional $2,000 per station (this is included in the pro-forma). These costs are based on rates quoted in other cities.
10.1.4 Pre-Launch Costs The financial model includes a series of system startup costs during the pre-launch period. These costs include costs to the new non-profit to start up the organization and hire an Executive Director to oversee the approximately 6-month period between procurement and launch of the system. Tasks during the intensive startup effort include: coordinating equipment and operator procurement, contract negotiation, grants and sponsorship acquisition, inter- and intra-agency coordination, stakeholder outreach (e.g., city council members, community groups), public outreach on station siting (residences and businesses near station locations), general public meetings and any outreach for low-income communities. Some functions may be taken on by partners such as the City, LTD, University of Oregon, or others to reduce this funding need. An overall general system start-up cost of $225,000 is included in the pro-forma and includes:
• Six months’ salary for fundraising and procurement by the non-profit executive director • Six months’ salary for senior management and administration; • Administrative costs such as insurance, legal, and accounting; • Marketing costs such as hiring an agency to establish the name and brand of the system, website
development, and marketing materials (brochures, collateral, etc.) and event staff; and • Direct operational costs such as real estate acquisition for this period, vehicle costs, purchase of
uniforms and equipment and employee training.
10.1.5 Operational Costs The pro-forma includes operational costs after the “go-live” date that represent everything needed to keep the system operational, including rebalancing, bicycle maintenance, station maintenance, customer service,

June 16, 2014
Eugene Bike Share Feasibility Study │83
software support, reporting, insurance and all other day-to-day operations. It should also be noted that the cost of system marketing is included in the pro-forma. The operational cost is presented on a per-dock-per-month basis. This approach is taken for several reasons:
• Docking points are the most accurate representation of a system size, and represent stable infrastructure, as opposed to a bicycle fleet, which varies on a daily basis due to repairs, rebalancing and seasonality;
• Data is available for this metric from several contracts around the country; and • It is easily scalable as a system expands.
The pro-forma assumes a per-dock-per-month general operating cost of $79 in the first year. Systems operate anywhere between $38 and $120 per dock per month.
The operating cost will ultimately be determined by (1) the wages and salaries offered by the non-profit; (2) the level of service offered and intensity of system rebalancing required; and (3) operational efficiencies that can result in cost reductions (e.g., in-kind donations, use of City-owned property for operating space).
A certain amount of spare parts replacement will be covered by warranty and/or equipment insurance and therefore is not included in the financial model. However, some annual spare parts and bicycle replacement has been included for theft, vandalism and regular wear and tear.
10.1.6 System Revenue There are three basic drivers of system revenue: annual membership, casual membership, and usage fees. For revenue forecasting, the pro-forma assumes the rate structure shown in Table 10.2 that is based on similar pricing structures in other bike share systems and supported by responses to the online survey conducted as part of public outreach. The model of a membership fee, free-ride period, and usage fees for longer rides, has some shortcomings – such as being a potential barrier to entry for lower socio-economic populations. Other pricing structures should be considered, e.g., a monthly fee instead of annual membership (e.g., a model similar to cell phone plans) and / or a “per ride” trip fee similar to how transit is priced. Nevertheless, for this analysis, the traditional pricing structure has been assumed as there is significant data to support related membership and ridership assumptions using this structure.
Table 10.2 Suggested Fee Schedule for Eugene Bike Share
Access Fee Usage Fees
0-30 mins Additional Half Hours
Annual $65 $0.00 $4.00
24-hour $8
Revenue drivers and their related model inputs are summarized in Table 10.3 and are based on trends observed in peer cities.

June 16, 2014
Eugene Bike Share Feasibility Study │84
Table 10.3: Performance Metrics for Case Study Bike Share Systems and Eugene Model Inputs
Boulder B-Cycle
Chattanooga Bike Transit
System
Fort Worth Bike Sharing
Madison B-Cycle
SLC GREENbike
Model Input Comments
Annual Members / 1,000 Population / 100 bikes
6.8 1.4 0.2 2.7 2.5 2.7 (Year 2) Average
Casual Members / Station 412 277 467 439 500 420 Average
Trips per Casual Member 1.3 1.8 1.4 1.9 - 1.6 Average
Trips per Annual Member 16 23 15 29 - 23
Disregard Fort Worth, only 6
months of data
Annual Membership Revenues:
• Annual Membership Fee: the model assumes a $65 fee to become an annual member. This amount is in the range of current fees in the U.S. and is also the average rate identified by respondents to the online survey (See Section 6.1.2); and
• Members per Person: the model assumes that the system will have 2.7 persons / 1,000 residents / 100 bikes purchasing annual membership and growing 20% annually. This does not include any special membership promotions or group sales to increase membership.
Casual Membership Revenues:
• Casual Membership Fee: the model assumes an $8 daily fee to become a 24-hour member. This amount is in the range of current fees in the U.S.; and
• Casual Members per Station per Year: casual members typically find out about a bike share system by seeing a station. Therefore, the pro-forma uses the metric of casual members per station to estimate casual members. The model assumes that Eugene will annually attract 420 casual members per station.
Usage Fees: available data from other U.S. systems was used to estimate revenues coming from system usage fees.
• Rides per Member: data show a range of 15 to 30 rides per year per annual member amongst peer cities. The pro-forma assumes the rate of 23 rides per year for Eugene. For casual members, data show a range of 1.3 to 1.9 rides per member. The pro-forma assumes 1.6 rides per casual member for Eugene;
• Percent of Rides Incurring Usage Fees: data show that approximately 30% of casual trips and 2% of member trips incur usage fees. These numbers are consistent across the systems for which data is public; and
• Average Usage Fee Incurred: average usage fee incurred for annual members range from $4 to $6 for annual members and $6 to $10 for casual members. The pro-forma assumes an average usage fee of $5 for annual members and $9 for casual members.

June 16, 2014
Eugene Bike Share Feasibility Study │85
10.1.7 Forecast Results Using the inputs above, the pro-forma was prepared to forecast membership, ridership, capital and installation costs, annual operating costs and system revenues. The output was checked against metrics from peer cities (see Table 10.4) to ensure consistency with actual results and then analyzed to understand the funding needs for capital and operations.
Table 10.4: Performance Metrics for Case Study Bike Share Systems and Eugene Model Results
Boulder B-Cycle
Chattanooga Bike Transit
System
Fort Worth
Bike Sharing
Madison B-Cycle
SLC GREENbike
Peer City Averages Comments
Trips per Bike per Day 0.8 0.3 0.3 1.0 1.6 0.6 Disregard SLC -
outlier
Annual / Casual Ridership Split 54%/46% 51%/49% 37%/63% 65%/35% - 57%/43%
Disregard FW – early trends favor casuals
Farebox Recovery49 36% 26% - - 30% 31% Average
The forecast results are summarized in Table 10.5 including the following metrics:
• Membership and Ridership Metrics: o Trips / Bike / Day: used globally to measure system usage. The pro-forma predicts an average
ridership of approximately 0.5 trips per bike per day over five years. This is slightly less than the average rate of 0.6 trips per bike per day (Year 2 average rate) observed in peer cities; and
o Percentage of Casual and Annual Member Rides: the forecast output predicts a split of approximately 62% of rides made by annual members and 38% by casual users. This split is similar to that observed in Madison, a similar sized college town to Eugene.
• Financial Metrics: o Farebox Recovery: this factor is important in understanding the financial needs of the system.
The pro-forma shows that approximately 46% of operating expenses will be recouped through membership and usage fees in Year 2. This will improve to approximately 53% in Year 5. This is higher than the peer cities listed in Table 4.2 but within the range of other non-profit operated systems such as Denver and Minneapolis (that recovered approximately 54% of operating costs in 2012). Strong farebox recovery is expected in Eugene because of the lower cost of living, detailed understanding of operations needs because of lessons learned from other systems (and therefore the ability to forecast more accurately), a 1.7 dock-to-bicycle ratio which will allow for lower costs, and a strong projected annual membership base that will increase revenues; and
o User Revenue Split: user revenues are expected to be split approximately 40% from annual membership sales / 38% from casual membership sales / 22% from usage fees. Data for this metric is not released by all cities, however, in larger cities this split tends to be approximately 33% / 33% / 33% and in Boulder usage fees accounted for approximately 32% of user revenues. The expected split in Eugene is reasonable given the system is expected to be well adopted by
49 Farebox recovery is the amount of operating cost recouped by membership and usage charges.

June 16, 2014
Eugene Bike Share Feasibility Study │86
local residents and students (this explains the higher annual membership sale percentage and the lower usage fee revenue – as annual members tend not to keep the bicycle longer than the free ride period).
Table 10.5: Forecast Membership, Ridership, and Financial Performance for Phases 1 and 2 of the Eugene Bike Share System
Year 1 Year 2 Year 3 Year 4 Year 5 5-Year Total Stations 22 22 28 38 45 46 Bikes 220 220 273 352 408 420 Docks 396 396 492 633 734 756
Capital Capital Purchase and Installation
$(970,000) - $(375,000) $(480,000) $(295,000) $(2,120,000)
System Startup $(225,000) - - - - $(225,000) Total Capital Cost $(1,195,000) - $(375,000) $(480,000) $(295,000) $(2,345,000)
Identified Capital Funding UO Capital Funding $200,000 - - - - $200,000
Capital Fundraising Need Total Capital Fundraising Need
$(995,000) - $(375,000) $(480,000) $(295,000) $(2,145,000)
Membership and Ridership Annual Members 700 940 1,450 2,235 3,060 8,385 Casual Members 8,300 9,250 12,250 16,400 19,050 65,250 Annual Member Rides 9,800 20,300 28,900 44,900 63,700 167,600 Casual Member Rides 13,300 14,800 19,600 26,200 30,500 104,400 Total Rides 23,100 35,100 48,500 71,100 94,200 272,000 Trips per Bike per Day 0.29 0.44 0.49 0.55 0.63 0.51
Operations Bike Share Operating Costs
$(280,000) $(385,000) $(495,000) $(655,000) $(785,000) $(2,600,000)
Revenues Bike Share Revenue $150,000 $175,000 $250,000 $350,000 $440,000 $1,365,000 User Fee Recovery 53% 46% 50% 54% 56% 52%
Operations Fundraising Need Total Operating Fundraising Need
$(130,000) $(210,000) $(245,000) $(305,000) $(345,000) $(1,235,000)
Per Bike Per Year $591 $955 $897 $866 $845 $837 Total Fundraising Need
Total Fundraising Need $(1,125,000) $(210,000) $(620,000) $(785,000) $(640,000) $(3,380,000)
A summary of the five-year funding need for implementation of the five phase initial bike share system in Eugene includes:
• Capital and Installation Costs: $2.3 million that includes capital, installation, system startup, and pre-launch administrative costs for the non-profit;
• Operating Costs: $2.6 million to operate for the first five years. This includes operating costs and system upkeep;
• Revenue: $1.4 million earned in membership sales and trip fees during the first five years of operation;
June 16, 2014
Eugene Bike Share Feasibility Study │87
• Identified Funding: University of Oregon funding of $0.2 million has already been identified for Phase 1 of the system;
• Fundraising Need: o Capital: $2.1 million with incremental funding of $1.0 million required by Year 1, $0.4 million by
Year 3, $0.5 million by Year 4, and $0.3 million by Year 5 if the proposed roll-out schedule is to be maintained; and
o Operations: $1.2 million over five years. This represents an average of $240,000 per year, however, the per-bike funding need will be higher in earlier years and will reduce as the fleet size grows and the system reacts to economies of scale.
10.1.8 Sensitivity Analyses The financial model shows that there is a funding shortfall. Capital and installation costs, which are one-time costs, lend themselves to one-time funding sources such as grants or private donations. Nevertheless the choice of vendor or type of equipment (i.e., smart dock versus smart bike) may reduce the capital funding need.
Ongoing operating costs are more difficult to fund and typically rely on user-generated revenues and sponsorship. Therefore, reducing operating costs or increasing revenues will reduce the amount of funding required.
A sensitivity test was conducted on the effect of varying assumptions in the financial model and the resulting impact on the five-year operating commitment. For example, increasing the uptake of annual membership by 25% (which could be achieved through targeted marketing, etc.) would reduce the operating funding need by approximately 11%. The effect of changing other variables by 25% is shown on Figure 10.1.
The tests show that the factors that most influence operational funding need are:
• The operating cost per dock per month: shown to decrease funding need by 53% for a 25% decrease in costs;
• The attraction of casual members (i.e., the number of casual members per station): a 25% increase in casual membership results in a 16% decrease in funding need; and
• The uptake and price of annual membership: increasing the number of members or raising the cost of membership by 25% both result in an 11% decrease in funding need. This assumes no offset in demand from raising the price.

June 16, 2014
Eugene Bike Share Feasibility Study │88
Figure 10.1: Impact on Operational Funding Need with 25% Variation in Operating Cost Assumptions.
10.1.9 Long-Term Planning for Bike Share System As mentioned above, the financial forecast for Eugene’s bike share system includes capital and pre-launch, as well as five years of operations. The forecast includes for basic upkeep of the system including bicycle and station loss replacement, as well as spare parts upkeep on an annual basis. However, it does not include recapitalization of the system when new equipment is required. As of the writing of this report the oldest bike share systems in the U.S. are in their fifth year. Most equipment vendors indicate their bicycles and stations have a 5-10 year life cycle. Therefore, when financial sustainability of a bike share system in Eugene is established, presumably in the second year of operations, the non-profit should begin to think about setting aside money for recapitalization of the system when required. Although equipment prices are unknown, considering the system will be implemented gradually, the original phasing would indicate that a capital infusion of $1 million for the oldest equipment would be a reasonable initial target.

June 16, 2014
Eugene Bike Share Feasibility Study │89
There has been considerable change in the equipment options in the first five years of the industry, and there will likely be incremental change between when the system is implemented until when it will be recapitalized. Similar to the initial implementation of the system, it is likely that public funds will be available for the equipment portion of the system. The non-profit should be apprised of public funding possibilities and procurement timelines for recapitalization. In addition, the non-profit should always be seeking more revenue and sponsorship opportunities past the initial goals to begin to set aside funds.
In terms of system revenue, as mentioned, the revenue forecast includes 20% growth in annual members, and operational costs increasing at a small inflation rate. It is not expected that the growth in annual members will continue at that rapid rate for the long term after completion of system installation. Therefore, the non-profit must continue to look for revenue opportunities from sponsorship and visitors should it desire to have additional funds for reinvestment, recapitalization or further expansion the system.
10.2 Funding Plan Beyond membership and usage fees, bike share systems in the U.S. have generally used three other types of funding: public, private, and advertising/sponsorship. While most systems use a combination of funding sources, generally, public funds and private foundation grants are used towards capital costs whereas membership and usage fees and advertising/sponsorship revenues are used towards on-going operating costs.
10.2.1 Public Funding Public funding sources include federal, state, and local funds. Federal funding opportunities include transportation, health, and sustainability programs from agencies such as Federal Highways Administration (FHWA), Federal Transit Administration (FTA), Centers for Disease Control (CDC), Department of Health and Human Services (HHS), and the Department of Energy. There are often additional requirements to the use of these funds such as use only for fixed equipment, “Buy-America” provisions, NEPA requirements, etc. These funds are often less flexible in terms of timing. Approximately two-thirds of current bike share systems in the U.S. have used federal funding for capital costs.
The Federal Highway Administration has established a web page for addressing the US DOT position on federal funding and bike share.50 Bike share system capital costs are eligible under several federal-aid highway program categories. The following table reflects FHWA guidance that was updated June 13, 2013, to incorporate programs authorized under the Moving Ahead for Progress in the 21st Century Act (MAP-21).
State-administered funding programs include ConnectOregon and the Statewide Transportation Improvement Program (STIP). The City of Eugene applied in the most recent round of applications for a ConnectOregon V grant and requested funding of $909,066.40 to accompany a local match of $227,266.60 for a project total of $1,136,333. ConnectOregon V applications are currently under review but early indications are that this is unlikely to be funded.
Bike share would also be eligible for STIP funding under the Oregon Department of Transportation’s “Enhance” program. However, the deadline for funding to be included in the 2015-2018 STIP passed in November 2012 and the timing for the next round of applications for the 2018 – 2020 STIP are yet to be announced.
50 http://www.fhwa.dot.gov/environment/bicycle_pedestrian/funding/faq_bikeshare.cfm

June 16, 2014
Eugene Bike Share Feasibility Study │90
Table 10.6 Bike Share Eligibility by Federal Program (capital and equipment costs; operations not eligible)
Program Fund Applicability FTA Federal Transit Administration Capital Funds YES ATI Associated Transit Improvement YES CMAQ Congestion Mitigation and Air Quality Improvement Program NO HSIP Highway Safety Improvement Program NO NHPP NHPP/NHS: National Highway Performance Program (National Highway System) YES STP Surface Transportation Program YES TAP TAP/TE: Transportation Alternatives Program / Transportation Enhancement Activities YES RTP Recreational Trails Program NO SRTS Safe Routes to School Program NO PLAN Statewide or Metropolitan Planning NO 402 State and Community Traffic Safety Program NO FLH Federal Lands Highway Program (Federal Lands Access Program, Federal Lands
Transportation Program, Tribal Transportation Program) YES
BYW National Scenic Byways Program NO TCSP Transportation, Community, and System Preservation Program YES
Local public funding could also be considered. The City of Columbus used 100% local funds to cover the $2.2 million capital and first year operating cost of their 30 station / 300 bike share system that launched in July, 2013. They did consider state and federal funding through the CMAQ program, but would not have been able to receive funds until 2016 and elected to use local funds to expedite the system launch.
The City could consider funding a portion of the system through its existing Capital Improvement Program (CIP) or working bike share into the framework of the System Development Charges (SDC) program. There may be other opportunities, such as parking charges or parking-in-lieu fees paid towards bike share for developments providing less than the minimum parking requirement.
Lane Transit District, as the regional transit provider, is the direct recipient and manager of FTA funding including from Section 5307 Urbanized Area, Job Access Reverse Commute, and New Freedom program funds. LTD also receives revenues from payroll and self-employment taxes collected within the LTD service district. These funds are allocated to existing transit services. However, LTD should continue to explore new grant opportunities through FTA and/or expansion of existing grants to include bike share funding.
10.2.2 Private Funding Private funding sources are various and include grants from private foundations, private gifts and donations from individuals, and private sector investment. These sources are used in many U.S. cities. Private funding makes up approximately 5% - 10% of funding in Boulder and Denver.
Some other ways the private sector could get involved is through large membership commitments and programs offered by employers, University of Oregon, and the City. This could include:

June 16, 2014
Eugene Bike Share Feasibility Study │91
• Bike share membership tied to existing transit pass programs, e.g., discounted memberships could be offered to University of Oregon students through an increase to the student Incidental Fee;
• Bike share membership could be added to the offerings available to city employees; • Corporate membership programs can be used to build enrollment by offering reduced annual
membership rates and the opportunity for employers to sponsor all or a portion of membership costs for their employees. The City is well positioned to encourage employer support of bike share (corporate memberships or sponsorship) through its SmartTrips program;
• Developer incentives and parking offsets could be used to create a mechanism for a development to contribute to capital funding for bike share (included as part of new campus related housing); and
• Crowdsourcing through individuals donating or making contributions online. Kansas City B-Cycle recently raised $400,000 to help expand the system.51
10.2.3 Sponsorship / Advertising Sponsorship and/or advertising are an important element of most U.S. bike share systems. It will be no exception in Eugene and will be required to help fund operations. There are several levels of sponsorship that other cities have been able to achieve. Examples for each of the different levels are shown in Appendix K and include:
• Title sponsorship: includes branding of all elements of the system including name, color, and representation on all sponsorship elements including at the station, on the bicycles, on electronic media, and all other components. Title sponsorship has only been achieved in a few systems around the world – New York (Citibike) and London (Barclay’s Cycle Hire), which garner values upwards of $1,000 per bike per year in those markets;
• Presenting sponsorship: in these systems, branding is already developed, e.g. the bright colored bicycles and the name Nice Ride Minnesota in Minneapolis. A single sponsor (such as in Minneapolis or Boston) or multiple sponsors (such as in Montreal) purchase the right for system-wide logo placement, typically on all bicycle fenders or at all stations, and may negotiate for other sponsorship elements. In Minneapolis, Blue Cross Blue Shield has their logo and colors on every bicycle fender as well as placement on the system website and other media. However, other sponsorship opportunities are available to other organizations and bicycle and station sponsors can augment larger presenting sponsors. Presenting sponsorship garners in the order of $400 to $600 per bike per year; and
• Individual sponsorship offerings: in this model sponsorship offerings are broken into individual elements and sold off to many smaller sponsors. This is often the model followed in the interim prior to presenting sponsorship (such as in San Antonio), but may also suit markets with smaller capacity or a desire for broader community support (such as in Boulder).
Overall, sponsorship will be required to support the bike share system in Eugene. The amount that will be able to be generated will depend on the specific assets offered (e.g., whether or not it can include an advertising panel). Based on the business pro-forma, Eugene requires $210,000 per year in sponsorship to support the 220 bikes in phases 1 and 2. This equates to approximately $950 per bike per year. Local companies may be
51 Neighbor.ly Helps Communities Build Better Towns. Accessed on May 16, 2014 at: http://www.crowdsourcing.org/article/neighborly-helps-communities-build-better-towns-/21377

June 16, 2014
Eugene Bike Share Feasibility Study │92
interested in sponsoring stations and larger sponsors (perhaps wanting to get exposure in the student market) may be interested in larger presenting sponsorships.
In Eugene, the city code prohibits advertising in the public street right-of-way. Although the bicycles themselves could carry advertising under this policy, it will impact advertising on the stations and kiosks and reduce the income generating potential of the system. Further follow-up is required with the City’s legal department to fully understand the restrictions, however, it may be possible to use a small space on the kiosk to provide “sponsorship information”. 52
There is a precedent in Eugene where LTD has a contract with an advertising agency to sell advertising space on LTD shelters and benches that is within City code. The advertising agency guarantees LTD a rate of $255,000 per year (in 2014) and 40% of sales exceeding the guarantee – this represents an average rate on a shelter or bench of approximately $300/month. Bike share, being an extension of transit, may be able to advertise similarly within the City code.
10.2.4 Possible Funding Plan The 46 station / 420 bike potential bike share system in Eugene will require approximately $2.1 million in capital funds and ongoing operating funds of approximately $1.2 million over five years. The following section recommends a potential funding plan for the system.
Stations on the University of Oregon Campus
The University of Oregon has already secured capital for the first four stations in Phase 1. Table 10.7 shows the additional capital and operating costs associated with stations located on the University of Oregon campus. This was calculated by pro-rating the number of stations located on the University of Oregon campus and accounting for the University’s existing commitment of $199,000. Table 10.7 shows that stations on the University campus would require additional capital of approximately $290,000 and ongoing operations funding of approximately $305,000 over 5 years.
Table 10.7: Potential University of Oregon Commitment to Eugene Bike Share System
Year 1 Year 2 Year 3 Year 4 Year 5 5-Year Total Phases 1 and 2 1 and 2 1, 2, and 3 1, 2, 3, and 4 1, 2, 3, 4, and 5 Stations on UO Campus 6 6 8 10 10 Total Stations 22 22 30 40 46 Capital Purchase $(260,000) - $(85,000) $(85,000) - $(430,000) System Startup $(60,000) - - - - $(60,000) Already Committed Funding
$200,000 - - - - $200,000
Additional Capital Commitment
$(120,000) - $(85,000) $(85,000) - $(290,000)
Portion of Operating Shortfall
$(35,000) $(55,000) $(65,000) $(75,000) $(75,000) $(305,000)
Total Additional Commitment
$(155,000) $(55,000) $(150,000) $(160,000) $(75,000) $(595,000)
52 http://www.businessweek.com/articles/2013-10-31/citi-bike-citibanks-new-york-marketing-coup#p1

June 16, 2014
Eugene Bike Share Feasibility Study │93
System Capital Funding
Grant funding should be sought to fund the initial capital for Phase 2. Most grants require a 20% local match. Therefore, an application should be submitted for $1.2 million with a local match of $240,000. The local match could come from some combination of University of Oregon funding, commitments from other private interests, and some local public funding. The University of Oregon has already committed $199,000 to the start-up of Phase 1. The University may also be interested in directly purchasing the stations on the University campus in additional phases through internal grants such as the University of Oregon Over-Realized Fund (this was used to fund the first four stations), or from other revenues such as parking and transportation fees.
Federal and state grants would again be sought to fund expansion of the system into Phases 3, 4, and 5, a $1.15 million application requiring a $230,000 local match with again some combination of University, private interest, and local public funds being used for the local match.
Regardless, capital funding should be opportunistic. There may be smaller, more nimble health or social equity focused grants that become available and could be used to fund stations, particularly where there are no obvious funding partners. Similarly, as development or redevelopment occurs, providing a bike share station should become a part of a developer’s transportation demand management options. This may require policy changes or incentives to encourage this activity.
Operations Funding
Funding sources for operations are more limited primarily because grant moneys are typically allocated to capital projects and not ongoing operations and maintenance. Fundraising for operations should consider all available sources including private, philanthropic, sponsorship, and public funding:
• Membership and user revenues are expected to earn approximately $1.4 million in the first five years of operations;
• Sponsorship will be an important source of operating funds. Realistically, based on rates obtained in other cities and average revenues from LTD shelter and bench advertising, sponsorship could be expected to generate up to $400 per bike per year for title or presenting sponsorship, or approximately $600,000 over five years;
• The University of Oregon could raise operating funds through an increase in the Incidental Fee, departmental sponsorships, or from the University choosing to purchase advertising on these (and potentially other) stations;
• Some stations could be funded through direct contributions from private foundations, large employers, business districts, large campuses (e.g., LCC), developers and interested businesses. Likely, these deals will need to be incentivized with group or discounted membership for employees of these organizations, or providing sponsorship presence on the stations and bicycles that they have purchased;
• Private partners could be sought, such as large employers, business districts, large campuses, developers and interested businesses to take part in group or discounted memberships and sponsorship opportunities. Stakeholder engagement indicated that such sponsorship could bring in $5,000 to $10,000 per station per year. Assuming the low end of the rate ($5,000 per station per year) and a 50% uptake rate, station sponsorship could generate $400,000 over five years; and

June 16, 2014
Eugene Bike Share Feasibility Study │94
• Local public funding through the City, LTD, or both may also be required to fill any operational funding gap.
Other Strategies
There are several ways to reduce the funding commitment. Capital costs can be reduced through consideration of different vendors and different technologies (note that there could be increases in operating expenses for reductions in capital cost, and University of Oregon integration would have to be seriously considered). Most impactful, operating costs can be reduced as shown by very low operating costs implemented by Nice Ride Minnesota. Some strategies include garnering in-kind support, providing discounted or free operating space, and other strategies that have been employed in other cities. Most importantly, in a small operation, employees should be multi-faceted to operate the most efficient system. For example, a marketing manager can also manage customer service. Such flexibility will allow the operation to have a smaller headcount and lower the personnel costs, which are about 2/3 of the operating costs.

June 16, 2014
Eugene Bike Share Feasibility Study │95
11 Implementation Plan This section addresses some of the common considerations that will need to be determined prior to and during implementation of the bike share system. Final determination of a preferred direction for these and other considerations should occur at each appropriate stage of implementation, as many factors change over time and during the implementation process, to inform the correct direction at that time. In addition, please note that this is a partial description meant to identify the key issues.
11.1 Site Planning and Permitting Obtaining appropriate sites for the bike share stations is an important and long-lead time aspect of implementation. Sites may be located on City of Eugene, or other public property, or on private property, including University of Oregon or other private property owners.
For stations located on private property, a license agreement is usually executed between the operator and the property owner. It addresses procedures for installation, maintenance, includes a liability indemnification and insurance requirements for the operator. Typically, an easement is not required.
For stations located on public property, the exact process for site planning and permitting is typically determined during implementation, and varies from jurisdiction to jurisdiction. During stakeholder outreach for this study, the consultant group engaged various departments from the City of Eugene. It is recommended that these and other departments determine a protocol for site permitting.
In addition, the consultant group examined the following policies and regulations that might influence bike share implementation and operation in Eugene including:
• The City of Eugene Pedestrian and Bicycle Master Plan (PBMP). • LTD’s Long Range Transit Plan (LRTP). • The City’s Zoning Code as it relates to right-of-way advertising. • The City’s Sign Code as it relates to off-premise advertising. • UO Campus Plan – particularly as they relate to station advertising.
All of these policies and regulations should be considered as the final procedures for site planning and permitting are created. A summary is included below.
11.1.1 City of Eugene Pedestrian and Bicycle Master Plan The 2012 PBMP provides recommendations to further enhance the City’s reputation as a pedestrian and bicycle friendly community. In addition, the Plan serves as the basis for the pedestrian and bicycle elements of the City’s Transportation System Plan (TSP) and recommends approximately 39 miles of sidewalk improvements, 14 miles of shared-use paths, over 120 miles of bicycle facilities, and an assortment of City programs. While the PBMP does not directly address a bike share system, such a system would tie in naturally and help to achieve a number of goals, objectives, and policies of the PBMP, including:
• Doubling the percentage of trips made on foot and by bicycle between 2011 and 2013. • Creating 20-minute neighborhoods - communities where people can easily walk or bike to everyday
destinations such as grocery stores, retail, recreation facilities, schools, etc.
June 16, 2014
Eugene Bike Share Feasibility Study │96
• Providing infrastructure to make walking and bicycling convenient and enjoyable. • Building a multimodal system that addresses the needs of all users including youth, elderly, people with
disabilities, and people of all races, ethnicities and incomes.
The Plan makes note of the already established bicycling culture, the high number of bicyclists and the desire for more infrastructure in central Eugene. Bike share would further enhance this culture and introduce new people to bicycling and initial success could be a vehicle for introducing bicycling into other areas of the City, which is a key recommendation of the Plan.
The PBMP identifies future pedestrian facilities and bikeways to develop a connected network. As implementation of bike share occurs, placement of stations near existing or future bikeways should be a consideration.
The PBMP provides a summary of local, state, federal funding sources, several of which could be utilized to fund a bike share system including:
• ODOT Flexible Federal Funds; • Community Development Block Grants; and • Surface Transportation Program – Urban (STP-U).
11.1.2 Lane Transit District’s Long Range Transit Plan The 2013 LRTP provides a framework for delivering “the long-term transit service needs of the community” It establishes goals around supporting the economy, social equity, and contributing to a healthy environment and an overall mission to provide a transportation service that will “enhance the community’s quality of life”. These values are supported and enhanced with a bike share system tied to existing and future transit service.
The Plan focuses on two key themes in thinking about future service: resources and community connectivity. Overall challenges associated with revenue and cost-management may impact service and could result in service cuts. Bike share can play a role in enhancing the viability of transit and delivering more people to transit services as well as offering a low cost solution that may be able to substitute for certain transit services or reduce the pressure and need to expand some services.
Bike share can enhance community connectivity, i.e., fulfilling transit’s role in connecting riders to the places they want to travel. Bike share is a connection to emerging travel markets and trends as well as being a natural connection between transit, active transportation, and the community – delivering more people to a broader range of places.
The way in which bike share can address each of the goals in the Plan include:
1. Provide attractive travel options to improve ease of connectivity throughout LTD’s service area: connect and deliver patrons to the Frequent Transit Network and expanded bus rapid transit services, provide or supplement local transit service, encourage private bicycling and investment in active transportation infrastructure, provide a localized transportation option for new development.
June 16, 2014
Eugene Bike Share Feasibility Study │97
2. Sustain and enhance economic prosperity, environmental health, and quality of life in the community through investment in transit service and infrastructure: the economic benefits of bike share to individuals, businesses, and the broader community are outlined in Section 3.
3. Ensure equitable and accessible transit service throughout LTD’s service area: although the initial bike share system will be provided in the core area of Eugene, future expansion could include other parts of the region. Providing affordable and non-exclusive access to the system is a priority.
4. Maintain and enhance safety and security of LTD’s services: safety was identified as a priority of the bike share system and there will be opportunities to tie in broader safety messaging into the system.
5. Use LTD’s resources sustainably in adapting to future conditions: bike share can address many of the specific policies in this goal including, maintaining appropriate transit service levels and performance standards and responding to emerging economic, social, and environmental trends.
6. Engage the regional community in LTD’s short and long-term planning processes: this project is a working example of collaboration between LTD, the City of Eugene, the University of Oregon, and other regional stakeholders. The recommended non-profit model will continue this collaboration into management and operation of the system.
11.1.3 City Policies For the placement of stations, the Eugene Code, Section 7.445 states that the City Manager (or the City Manager’s designee) can issue a revocable permit for the use of public right-of-way for private commercial purposes so long as plans are approved by the City Engineer and meet the requirements of applicable codes and ordinances, do not adversely affect adjoining properties, and do not interfere with the use of the public way.
Signage on the stations is permitted under the City’s Sign Code as a “public sign”, i.e., “signs placed in a public right-of-way by or with the approval of a governmental agency having legal control or ownership over the right-of-way.”
For stations on private property, the owner’s agreement is needed and the terms of the station placement are laid out in a License Agreement. From a permitting perspective, potential issues for station placement on private property include determining whether the existing use at the location of the potential bike share station (e.g., parking lot, landscaping, etc.) was a requirement of the approved site plan. If so, this could require an adjustment review or a staff review.
Signs on private property may be exempt from the sign code if they are outside of vision clearance areas and (a) could be considered a parking sign (i.e., located in a parking lot and used for the purpose of directing traffic, parking, and towing); (b) is a sign used for activities authorized by Downtown Activity Permits; or (c) is a sign which forms an integral part of a vending machine.
Although signage is permitted on the stations, the use of advertising may not be permitted (although the bicycles themselves could most likely carry advertising). This could reduce the income generating potential of the system. Further follow-up is required with the City’s legal department to fully understand the use of advertising. It may be possible to use a small space on the kiosk to provide “sponsorship information” or may be necessary to seek a code change to allow sponsorship.

June 16, 2014
Eugene Bike Share Feasibility Study │98
11.1.4 University of Oregon Campus Plan The University of Oregon Campus Planning Committee approves design and siting of signs and structures on the University of Oregon campus. The four stations planned for the University of Oregon have already been approved by this Committee. Any additional stations or design modifications will need to be reviewed. University of Oregon does not permit advertising on its campus. This will restrict sponsorship of stations and fixed infrastructure, although advertising and sponsorship on the bicycles themselves will likely be acceptable. It is possible that the University itself may want to sponsor stations on its campus.
Applicable Campus Plan Patterns and Policies:53
• Policy 2: Open-space Framework, specifically, Designated Open Space and Pathways policy refinements (13th Avenue Axis, University Street Axis, 15th Avenue Axis, Agate Street Axis, and East Campus Axis) pp. 27-29; Landscape Features sub-policy (a), p. 34;
• Policy 6: Maintenance and Building Service, pp. 45-46; • Policy 8: Universal Access, pp 53-54 • Policy 9: Transportation, pp. 55-56; • Policy 11: Patterns, including Activity Nodes; Bike Paths, Racks, and Lockers; Future Expansion, Local
Transport Area; Main Building Entrance; Main Gateways; Open-space Framework; Pedestrian Pathways; Places to Wait; Public Outdoor Room; Site Repair, pp. 61-78;
• Policy 12: Design Area Special Conditions o Academic Center and Historic Core Design Area, particularly University Street Axis (pp 89-90);
and o East Campus Design Area, particularly East Campus Green (p 121), and East Campus Axis (p 122)
OR 15th Avenue Axis (p. 118), and Agate Street Axis.
11.2 Marketing Plan This section addresses some of the key issues that go into promoting and marketing a bike share system and draws on examples from other cities in the United States to understand some of the strategies and limitations to existing bike share marketing strategies.
11.2.1 Branding Branding is the creation of an identity that users and the general public can attach to, recognize, and associate with the bike share system. Branding is also the use of consistent messaging that is representative of the core values of the system. The key branding decisions include coming up with the system name, logo, and color. These are described in detail below.
Some cities have hired outside marketing consultants to develop branding, e.g., New York City and Chicago, while others have developed branding in house either as a public agency (e.g., Capital Bikeshare in Washington D.C. or CoGo in Columbus), non-profit organization (e.g., Nice Ride Minneapolis), or as a private company (e.g., Miami DecoBike). 53 http://uplan.uoregon.edu/plandoc/CampusPlan/CampusPlan.html

June 16, 2014
Eugene Bike Share Feasibility Study │99
Name
Naming the system is probably the most critical marketing decision and needs to take in a number of factors including:
• Representing the core values of the system: Bixi in Montreal is a shortening of the words “bicycle” and “taxi” to represent personal, independent, spontaneous mobility by bicycle; and GREENbike in Salt Lake City uses the word “green” to represent environmental consciousness;
• Geographic representation: Capital Bikeshare in Washington D.C. representing the capital region; CoGo in Columbus; and Bay Area Bike Share (BABS) to represent an area with multiple cities;
• Sponsor representation: Citi Bike in New York City; and Barclay’s Cycle Hire in London; • Equipment vendor branding: many B-cycle systems have opted to use the name B-cycle, which avoids
some of the complications and cost of creating a new name for the system; • Other considerations may include:
o Integrating a play on words: Nice Ride Minnesota in Minneapolis and St. Paul is a play on the phrase “Minnesota nice” and the popular term for a comfortable bicycle;
o Use of the name as a noun or a verb: Hubway in the Boston area – “I’m going to hubway to Cambridge on a Hubway”; and
o Naming competitions can be a good way to connect people to the system and generate early interest, e.g., Columbus issued a contest to come up with the name CoGo.
Logo
The system logo is the visual equivalent of the name and will become synonymous with the system being branded on all infrastructure, system elements, online media, and merchandise. Most cities include the following features in some form in their logo:
• A bicycling element or reference: the Nice Ride logo incorporates a bicycle; the Hubway logo uses a gear sprocket; Divvy uses the arrow elements of a “sharrow” roadway marking;
• Core values: the Hubway gear sprocket invokes forward movement and regional connectivity; • Sponsor branding: the Citi Bike logo includes the brand mark for Citi; and • Equipment vendor branding: many B-cycle systems have opted to use the B-cycle logo, which avoids the
complications and cost of creating a new branding scheme for the system.
Color
Color is important not only from a branding perspective but also from a safety and urban aesthetic perspective. The decision on color may factor in:
• Cost: most vendors offer basic colors at the standard price with other color options costing more per unit;
• City or campus colors: the initial University of Oregon bike share bikes will feature grey, green, and yellow; and
• Visibility / eye-catching: the Nice Ride bicycles have a vibrant green color;

June 16, 2014
Eugene Bike Share Feasibility Study │100
• Reiterate a theme: Salt Lake City’s GREENbikes promote environmental consciousness; • Aesthetics: powder blue in the Bay Area – this is also a “neutral” color as the system represents multiple
cities; and • Sponsor: the color of the Citi Bike system is a shade of Citi’s corporate colors.
11.2.2 Marketing Package Sponsorships are a critical component to raising the necessary funds to launch and operate Eugene’s bike share system. Sponsorships extend beyond a large scale title sponsor, and many systems employ a mix of local sponsors along with a presenting sponsor; companies can sponsor stations to gain more local visibility or provide additional amenities to their employees; universities may fund stations to enhance the mobility of the student population; and foundations can help fund stations to extend the reach of the system to target populations. In seeking sponsorship, the needs of the target audience must be considered in preparing an appropriate sponsorship request. An example of sponsorship content prepared for different audiences in Portland, OR is included in Appendix L.
Another example of a sponsorship deck put together by Miami Beach’s DecoBike, which relies on advertising and sponsorship to fund the system, can be found online at www.slideshare.net/decobike/decobike-6906631#. The deck is a graphics-heavy document that includes:
• Content that captures the opportunity. DecoBike highlight the exclusivity and unique form of street advertising provided by bike share through a full page quote stating, “You can brand an entire city!”;
• Key themes that make connections with potential advertisers. DecoBike promote the opportunity to combine advertising exposure with environmental consciousness, e.g., “Going green and gaining exposure has never been easier!”;
• An introduction to bike share and why it’s a good idea for Miami Beach; • An outline of the proposed bike share system – how it works and where it will be located; • Quantification of the system’s assets and their expected exposure rates; and • Statistics and demographics of the target market / audience.
11.2.3 Marketing Plan Marketing and promotions are an essential part of the success of a bike share system and marketing activities need to start prior to the first stations being placed on the street and continue all the way through operations. Success relies on creating “buzz” for the system. Traditionally, bike share has relied very little on traditional media with buzz generated by the stations and bikes themselves. Marketing campaigns have focused on low-cost opportunities such as social media, earned media, and generating attention through targeted activities and stunts. For example, Citi has indicated that in the first year of operation of Citi Bike in New York City, the company has received $4.4 million in earned media.54 The investment in sales and marketing must be balanced with the return on investment. Most systems to date have invested little in marketing and promotions. Should a private operator be hired, it is important that appropriate incentives be put in place to encourage the operator spend appropriately on marketing efforts.
54 http://adage.com/article/special-report-digital-conference/citibank-elyssa-gray-citi-bike-marketing-challenges/292447/

June 16, 2014
Eugene Bike Share Feasibility Study │101
Timing of Marketing Efforts
There are several stages to the marketing campaign:
1. Prior to the first stations being placed on the ground (“preparation”): marketing budgets should be focused on the development and launch of the website and preparation of promotional materials;
2. When the first stations are deployed on the street (“visibility”): marketing efforts should build on the excitement generated by station deployments and the lead up to launch with activities focused on providing system information, directing people to the website, and signing members;
3. System launch (“excitement”): the buzz and attention created by the launch of the system brings forth numerous opportunities for free and widespread press coverage; and
4. Ongoing operations (“momentum”): once the system is launched, marketing efforts are focused on maintaining interest and excitement in the system, typically through social media networks, strategic events, stunts, and other activities.
Potential Marketing Activities
Various strategies for creating a buzz about bike share have been undertaken through a combination of free PR, community events, digital media (i.e. social media and blogs), and other activities. Existing systems have found creative ways to increase the significance of earned media (i.e. newspaper stories, TV stories, press releases, etc.), which have made it possible for the system to create buzz without utilizing traditional paid advertising such as television and radio commercials, newspaper advertising and billboards. To this end, a high percentage of the marketing budgets for existing systems are spent on creating earned media. Some potential marketing activities are included in Table 11.1.
Table 11.1: Potential Marketing and Promotional Activities for a Bike Share System in Eugene
Activity Description
Website The website should serve as a clearinghouse for information about sign up, benefits, and overall system information. All marketing and “buzz” should advertise and drive people to the website where, even prior to the first stations being deployed, people can register for the system.
Website Launch Stunt
It is important to gain members prior to launch so that people are there to ride on day one. An affordable way to drive earned media at this important time is to coordinate a “stunt” to garner social media attention and free PR. For example, at the launch of the Boston website, “Freedom Riders” rode Hubway bikes around the city. Press and blog outlets covered the story announcing the website launch, and dozens of pictures were posted on the Hubway Facebook page and Twitter feed, and the system was able to garner approximately 1,000 new members in the short two week timeframe prior to system launch.55
Earned Media Earned media (i.e. newspaper stories, TV stories, press releases, etc.) should be used wherever possible to focus attention on the deployment and impending system launch (prior to system launch) and to promote the success of the system (following launch).
Partnerships and Creating partnerships and/or co-promotions with established organizations and institutions is a critical way to
55 Hubway riders in Boston. Retrieved from http://transportationnation.org/2011/09/06/tn-moving-stories-boston-bike-share-booming-and-a-look-at-the-new-dc-metro-map/samsung/ on April 10, 2013.

June 16, 2014
Eugene Bike Share Feasibility Study │102
Activity Description
Co-Promotions promote the new bike share service. Announcements of partnerships with different organizations by city leaders can bring positive associations from different groups. Examples include:
• A partnership for discounted memberships with the Denver Housing Authority (DHA) was used to begin signing up DHA residents.
• Co-promotions with local sports teams such as Boston Hubway’s 2013 season opening coordinated with the Red Sox opening day and Hubway discount passes were distributed with Red Sox tickets. In Eugene, this may tie in with college sports at the University of Oregon.
• Other companies, institutions or organizations, such as universities, hospitals, or car-sharing companies. These partnerships may offer incentives to these large and influential organizations to associate themselves with bike share and promote the bike share brand, at no cost to the system.
Station Posters
Depending on the contractual agreement with the sponsor(s), one or both sides of a poster on the bike share station can be used to promote the system. In Washington, D.C., Capital Bikeshare has a map on one side of the poster and advertising for the system on the other. In New York City, as stations were deployed, they included “Coming Soon” messages of the impending system launch.
Outdoor and Digital Paid Advertising
Paid advertising has been used in a very limited fashion throughout existing U.S. systems because of small budgets and little need to date. One method of existing advertising is from the District Department of Transportation (DDOT) in Washington DC which has used some of its own advertising assets to place outdoor signs for Capital Bikeshare.56
Targeted Events
Targeted events can create free advertising in the neighborhoods. Ribbon-cutting events for particular stations with local politicians are great ways to imbue ownership of the system on a very local level. Attendance at neighborhood events such as street fairs and farmers markets can also create local interest and stories in local media.
Social Media
Growth of social networks like Facebook and Twitter can help augment the word-of-mouth “buzz” about bike share. Other systems have shown large and committed social media followings which have helped promote the system. Social media can also help promote new discounts, contests and events. In addition to the use of social media, creating and maintaining positive relationships with influential writers, columnists, bloggers and local media outlets is crucial to creating positive buzz for bike share.
Contests
Contests run by bike share systems garner both action on social media and earned media. For example, Capital Bikeshare ran a Winter Weather Warrior contest. The contest helped promote and increase use of the system through the winter months (when ridership tends to be lower), while garnering coverage in the Washington Post and blogs, which consequentially helped increase the number of members and bike share use.
City PR Department
No matter how good the non-profit, sponsors and/or operations team, the media is strongly attracted to actions and announcements by the City, typically more than any non-profit or private company. To this end, it is recommended that the City leverages existing PR assets throughout its different departments to help promote the system.
Sponsor Network and Marketing
There are significant opportunities for sponsors to help spread the word about the system, but the level of support depends on its means for communicating to its stakeholders and the resources it is willing to give. Sponsors can bring the sophistication of a business to the bike share non-profit.
56 Through its advertising contracts with Clear Channel, DDOT has been able to promote the Capital Bikeshare brand throughout some of the existing advertising panels in various parts of the city.

June 16, 2014
Eugene Bike Share Feasibility Study │103
Activity Description
The Citi sponsorship of New York City’s bike share system has provided the system a means to gain the marketing support of a large company and Citi an opportunity to augment the Citi brand. Citi has contributed the following marketing to the Citi Bike system:
• Using the 2-feet x 4-feet advertising panels on each bike share station that they received as part of the sponsorship package to advertise the Citi Bike system.
• Discounts to certain cardholders on bike share memberships. • Placement of Citi Bike branding at the bottom of credit card statements and on ATMs. • Distributing Citi Bike brochures at branches and internally communicating with branch employees
about the system.
Integration with Transit
Bike share will complement the existing bus and EmX network in Eugene and bike share should be promoted as a tool that extends the reach and flexibility of transit. Close cooperation with LTD and utilizing their existing promotional and marketing channels will be important.
Transportation Demand Management
Transportation demand management (TDM) is an umbrella term for a range of policies and systems used to reduce single occupancy vehicle (SOV) use and promote alternative modes such as walking, biking, carpooling and transit. Bike share can build off of existing TDM programs in two ways:
• As part of the City’s site plan review process where developers could be encouraged to sponsor and locate bike share stations on their properties as a way to mitigate the traffic impacts of new development and even reduce development parking requirements.
• Incorporate bike share into existing TDM marketing materials promoting alternative modes and potentially reach a wider audience than through traditional marketing channels. The bike share system could coordinate with LTD’s existing Point2point program.
Visitor Market
Visitor and tourist usage is very important for the financial sustainability of bike share, however advertising to this market has not yet been undertaken in a consistent manner in other systems due to the increasingly higher costs to reach out to this market. Many short-term users become aware of the system simply by walking past a station. Strategies to reach this sector are generally focused around co-promotions with:
• Hotels: have brochures and educate their concierge desks about bike share and how the system works.
• Visitor and Convention Service Organizations: work with Eugene, Cascade & Coast Sports and other visitor service organizations to have promotional information on-hand regarding bike share.
• University and Hospitals: provide promotional materials to the UO and hospitals that could be distributed to families and campus visitors.
• Other institutions: work with other visitor attractions to ensure they have the appropriate information and education about bike share.
Budget
Each system has a different structure and level of resources for marketing and advertising. In Washington D.C.’s Capital Bikeshare, the public agencies (DDOT, Arlington County, and the City of Alexandria) provide the marketing resources. In Boston, the contractor undertakes marketing for the system. In Denver, it is up to the non-profit to promote the system leveraging its partnerships with funders, community organizations, and city government. The major lessons learned are related to the marketing and advertising budget and the structure of contracting and incentives.

June 16, 2014
Eugene Bike Share Feasibility Study │104
Some existing bike share systems have launched on too small a marketing budget that have not taken into account the necessary personnel and other resources required to promote the system as effectively as possible. As the region considers implementing a bike share system, it should ensure that the organization charged with managing the system prepare a budget that includes at least one full-time employee, as well as several part-time seasonal employees for event staffing. In addition, there should be enough funding to provide for system collateral, such as t-shirts, brochures, key chains, events and giveaways, and budgets for events, such as vehicles, fuel, tents, signage, and permits. A second dedicated person could also be included in the budget to cover social media, partnerships, coupons, or any other education or outreach needed for the system. Targeted, paid digital advertising through Facebook and Google should also be considered, as they are low cost, high impact strategies. However, it is important to balance financial sustainability with the cost of marketing. Therefore, a good strategy would be to start conservatively and if it is deemed worthwhile, increase spending on marketing after the first year of operations.
Contract Structure and Incentives
If marketing and operations are to be contracted to a third party, it is important that the contract be structured to incentivize the contractor to spend appropriately on marketing in line with the goals of the system. For example, if the contract calls for a flat fee to be paid to the contractor for operations with a marketing budget included, they are likely to spend as little as possible because their incentive is to operate efficiently, not to increase ridership.
A possible contract structure that should be considered is to propose a base budget for operations that includes a base level of marketing. Augmenting the base budget to meet membership, ridership, or other goals of the system would help incentivize the potential contractor to promote high membership and ridership, and would also penalize it for low membership or ridership. The contract should also align incentives for increasing membership and ridership of minority and low-income users to help meet the equity goal. If the bike share non-profit operates directly, then such incentives need not be considered, as operations are self-funding.
11.3 Operations Preparation The non-profit organization must make the decision as to whether to operate directly or hire an operations company. In either case, the following basic steps must be taken in order to prepare for operations, either by the non-profit or the operator:
• Insurance: the operator should have the following insurance coverage: o General liability; o Auto; o Vehicle; o Workers compensation; and o Equipment (likely stations only);
• Financial, human resources and administrative framework: the operator must set up accounting systems, inventory systems, and establish compliant employment practices for hiring, benefits, reporting, taxes, and all other administrative and legal needs;

June 16, 2014
Eugene Bike Share Feasibility Study │105
• Operations headquarters: the operator must locate an operational headquarters that includes both office and warehouse space. This space will house administration, bike maintenance, station maintenance, vehicles, and all other operations for the bike share system. It is anticipated that 1,000 square feet should be sufficient for a Eugene system. Please note that it is assumed that the equipment vendor will install the stations and that this space is not utilized for installation;
• Vehicles: the operator must acquire vehicles for operations. It is assumed that one truck will be sufficient for Eugene operations. Bikes with trailers for rebalancing can also be used;
• Tools and equipment: the operator must acquire whatever tools, spare parts, and equipment are needed for system operations and maintenance. An inventory can be requested from the equipment vendor for assistance in this purchase. Health and safety equipment should also be purchased prior to system launch;
• Hiring: the operator must undergo job listing, interviewing, screening, and hiring for all employees. It is assumed that approximately 5 employees will be on staff when operations begin for the Eugene system;
• Standard Operating Procedures (SOPs): the operator must establish standard operating procedures for bike maintenance, station maintenance, customer service, emergency response, system communications, weather response, and health and safety procedures. These SOPs can be updated over the lifetime of the system, but are an important framework to establish from the beginning prior to system expansion; and
• Training: the operator should work with the equipment vendor to obtain the proper training on bike and station maintenance. This could include training via written manual or traveling to an already operating system. The equipment vendor should also advise on policies and procedures for second-level technical support on the equipment.
11.4 Performance Standards To achieve operational excellence, performance standards should be specified in a contract with an operator, and could even be included in an agreement with a non-profit. However, the more stringent the performance standards, the more expensive contracted operations will be. Therefore, the agency issuing the contract must strike the right balance of operational excellence and affordability. These standards can include the following:
• System launch: o Delivery timeline; o Site planning timeline;
• System operations: o Bike redistribution metrics; o Fleet size on street; o On-street bike maintenance; o Station cleaning (standard and graffiti); o Station technical maintenance; o Station and docking point functionality; o Customer service; o System accuracy (station inventory, financial and ride reporting); o System and website functionality;

June 16, 2014
Eugene Bike Share Feasibility Study │106
• System marketing: o Membership; o Ridership; and o Equity achievement.
Basic performance levels for each set of metrics should be defined, and the contract should include incentives to surpass the basic level, as well as liquidated damages for failing to meet that level.
Reporting and evaluation will also be important. Each year, a summary report should be prepared that includes system highlights, operational performance metrics, and other system statistics including:
• System size; • Membership and ridership statistics; • Station performance; • Health impacts; • Economic impacts for users; • Economic benefit for the City; • Safety; • Operational efficiency; • Financial performance; and • Emissions Reductions.
An annual survey of members should also be considered. This should include annual and casual members and if possible, non-members to understand why they don’t join the system. The intention of the report is to evaluate system performance and make decisions about its future direction and emphases, e.g., the individual station performance statistics can be used to make decisions on expanding, reducing, or relocating stations to fine tune the performance of the system.
11.5 Implementation Timeline The steps involved for implementation of a bike share system in Eugene are identified on the flow chart included in Appendix M. These steps are generally categorized into:
• Procurement; • Funding; • Branding and Marketing; • Site Planning and Permitting; • Deployment; • Operations; and • Launch.

June 16, 2014
Eugene Bike Share Feasibility Study │107
Funding is likely to be the critical path through the project with the timeliness of capital funding largely unknown and sponsorship needing to be obtained, often pieced together from various sources that require the attention of a dedicated staff resource. Prior to funding being secured, the non-profit organization must be created.
The implementation timeline could take 1.5 to 2 years, depending on the speed of funding. From the time a vendor has been secured and a contract signed, implementation can happen rapidly - approximately 6 months to system launch. As mentioned, funding and procurement can be lengthy processes, which have delayed the launch of many systems in the United States. Many systems have accelerated this timeline by utilizing public funding only for system capital and sponsorship funding for operations, and therefore having procurement and funding restrictions on the equipment only.
The key critical path items, once funding and procurement are secured, are:
• Site planning (discussed in Section 11.1); • Bike and station branding (discussed in 11.2); and • Operations preparation (discussed in 11.3).
After these three long-lead items are initiated many of the other steps to system launch naturally follow, as shown in Appendix M.

June 16, 2014
Eugene Bike Share Feasibility Study │108
Summary and Conclusion

June 16, 2014
Eugene Bike Share Feasibility Study │109
12 Summary and Conclusion This feasibility study explored the potential for a bike share system in Eugene, OR and identified a possible path for its implementation. A bike share system would build on the City’s existing reputation as a Bicycle Friendly Community, support existing and future transit services, and connect destinations and neighborhoods within the City with the potential to expand into other parts of the region.
Public and stakeholder feedback was used to determine priorities for the system and these were combined with a demand mapping exercise and public suggestions for where stations should be located to define an initial bike share system consisting of five phases, 46 stations, and 420 bikes serving the University of Oregon campus, Downtown Eugene, the Whiteaker, Amazon, and Jefferson West neighborhoods, and the north side of the Willamette River.
A number of business models were evaluated resulting in the determination that a non-profit owned system is the most appropriate model for the region as it provides maximum funding flexibility, facilitates regionalization of the system and integration with the University of Oregon system, and transfers risk and financial responsibility away from the public agencies. Participating agencies would maintain representation on the Board of Directors. The non-profit would need to sub-contract certain functions or build staff capacity to manage and operate the system.
Information from comparable cities including Boulder, Chattanooga, Fort Worth, and Salt Lake City was used to understand the opportunities and challenges associated with establishing a bike share system in a medium-sized community. Based on these data, it is expected that a bike share system in Eugene would attract over 900 annual members and 9,000 casual subscribers in its second (and first full) year of operation, growing to over 3,000 annual members and 19,000 casual subscribers in its fifth year. Ridership is expected to grow from approximately 35,000 trips in the second year to just under 95,000 trips in the fifth year. The system is expected to recoup approximately 52% of its operating costs from membership and usage fees.
A 46 station / 420 bike system will require approximately $2.3 million in capital. It is proposed that a capital funding grant be sought from federal or state grant opportunities, which will require a 20-percent local match that could come from the University of Oregon’s campus bike share fund and a combination of private, philanthropic, or local public funding sources.
Operating costs are expected to be in the order of $2.6 million for the first five years of operations and funding could come from some combination of user revenues, sponsorship on the stations and bikes, contributions from the University of Oregon and other private interests, and local public funding.
Based on this analysis, a bike share system appears feasible in Eugene and should be implemented with dedicated staff required to handle procurement, funding, branding and marketing, site planning and permitting, deployment, operations, and launch. Funding is likely to be the critical path with the timeliness of capital funding largely unknown and sponsorship being required and often pieced together from multiple contracts with participating organizations.