![[Pk Webtool Software] Software for Optimal Design Software for Optimal Design in Population Pkpd- In Population Pkpd- A Comparison](https://static.fdocuments.net/doc/165x107/577d29921a28ab4e1ea73219/pk-webtool-software-software-for-optimal-design-software-for-optimal-design.jpg)
Eufemed Conference, Brussels, Belgium, May 20, 2015 ... Background of PKPD Modeling Bernd Meibohm,...
40
© Bernd Meibohm, PhD, FCP, University of Tennessee Scientific Background of PKPD Modeling Bernd Meibohm, PhD, FCP Professor and Associate Dean for Research and Graduate Programs Interim Chair, Department of Pharmaceutical Sciences Department of Pharmaceutical Sciences, College of Pharmacy The University of Tennessee Health Science Center Memphis, TN, U.S.A. Eufemed Conference, Brussels, Belgium, May 20, 2015
Transcript of Eufemed Conference, Brussels, Belgium, May 20, 2015 ... Background of PKPD Modeling Bernd Meibohm,...

© Bernd Meibohm, PhD, FCP, University of Tennessee
Scientific Background of PKPD Modeling
Bernd Meibohm, PhD, FCP Professor and Associate Dean for Research and Graduate Programs
Interim Chair, Department of Pharmaceutical Sciences
Department of Pharmaceutical Sciences, College of Pharmacy
The University of Tennessee Health Science Center
Memphis, TN, U.S.A.
Eufemed Conference, Brussels, Belgium, May 20, 2015
© Bernd Meibohm, PhD, FCP, University of Tennessee 2
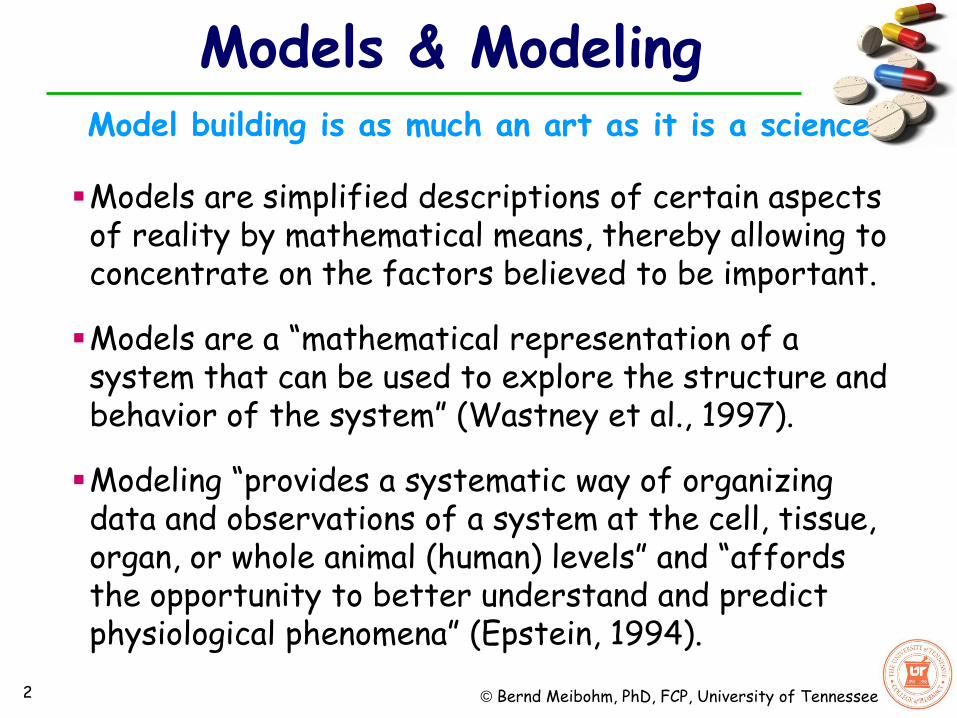
Models are simplified descriptions of certain aspects of reality by mathematical means, thereby allowing to concentrate on the factors believed to be important.
Models are a “mathematical representation of a system that can be used to explore the structure and behavior of the system” (Wastney et al., 1997).
Modeling “provides a systematic way of organizing data and observations of a system at the cell, tissue, organ, or whole animal (human) levels” and “affords the opportunity to better understand and predict physiological phenomena” (Epstein, 1994).
Models & Modeling Model building is as much an art as it is a science

© Bernd Meibohm, PhD, FCP, University of Tennessee 3
Modeling Summarizing measured data by integrating different measures and
prior knowledge about biological processes
Identify the best model that sufficiently describes the data (Rule of Parsimony: simplest model)
Purpose-driven: Level of model complexity defined by its intended use.
Modeling & Simulation
Simulation Modeling is a prerequisite for simulations: Application of the
developed model
Predictions beyond the measured data: inter- or extrapolations
Validity of simulations depends on model (and the purpose is was developed for)
Prediction error and uncertainty

© Bernd Meibohm, PhD, FCP, University of Tennessee
Deterministic “Best guess” parameter point estimates used for simulation One discrete outcome of simulation
o E.g. a discrete drug concentration vs. time profile
Parameters may be dependent on covariates Pro: Simplicity; ease of understanding Con: No uncertainty in parameter estimates considered
Simulation Approaches
Stochastic (Monte-Carlo Simulations) Distributions for each specific parameter that capture the degree
of uncertainty o Repeated random sampling of parameters from these distributions to simulate
the outcome based on the underlying structural model. Distribution of outcomes with central tendency and spread Pro: provides inherently a measure of credibility and likelihood for
simulation outcomes Con: increased complexity and thus difficult understanding and
acceptance
Deterministic vs. Stochastic

© Bernd Meibohm, PhD, FCP, University of Tennessee 5
M&S in Epidemiology
M&S in Astronomy
M&S in Engineering
M&S in Economics

© Bernd Meibohm, PhD, FCP, University of Tennessee 6
© Bernd Meibohm, PhD, FCP, University of Tennessee 7
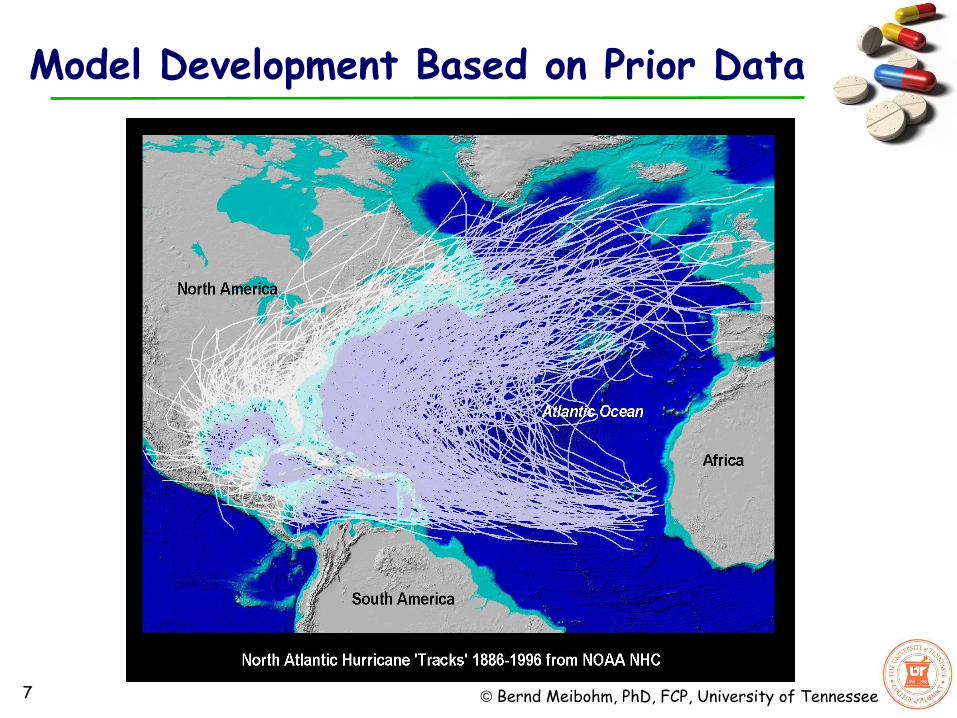
Model Development Based on Prior Data

© Bernd Meibohm, PhD, FCP, University of Tennessee 8
Prediction Error & Model Refinement
© Bernd Meibohm, PhD, FCP, University of Tennessee 9
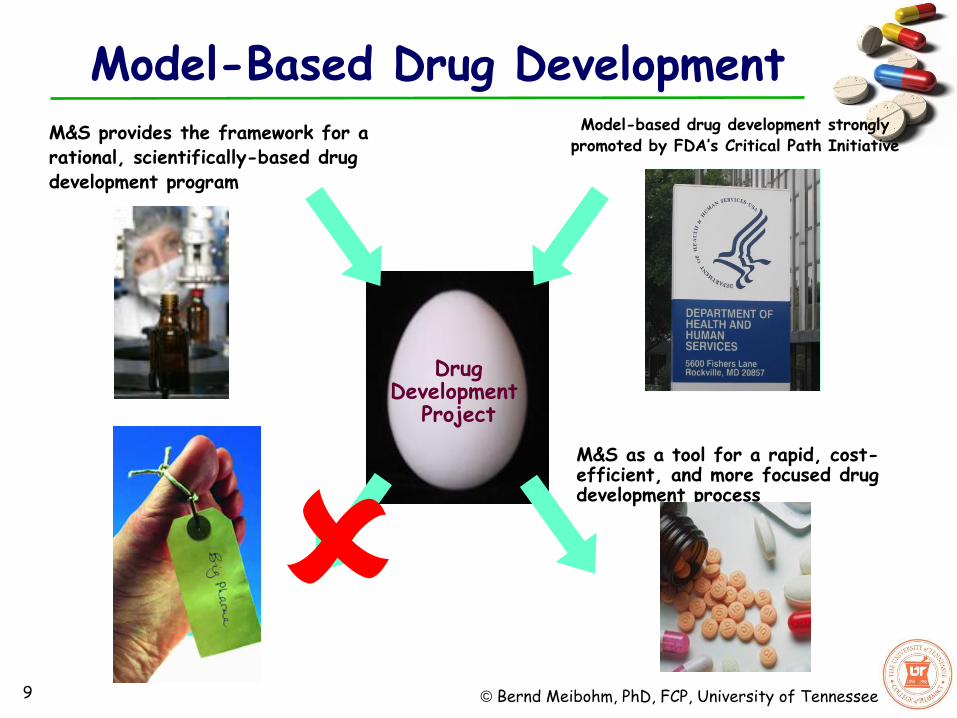
Drug Development
Project
M&S as a tool for a rapid, cost-efficient, and more focused drug development process
Model-based drug development strongly promoted by FDA’s Critical Path Initiative
M&S provides the framework for a rational, scientifically-based drug development program
Model-Based Drug Development

© Bernd Meibohm, PhD, FCP, University of Tennessee 10
Dose Conc
Efficacy
Toxicity
Pharmacokinetics Pharmacodynamics
Central Paradigm of Clinical Pharmacology

© Bernd Meibohm, PhD, FCP, University of Tennessee 11
Pharmacokinetics Concentration vs. Time
Co
nc
.
Time
PK/PD Effect vs. Time
Time
Eff
ec
t
PK/PD-Modeling Pharmacodynamics Concentration vs. Effect
Conc (log)
Eff
ec
t
Derendorf & Meibohm Pharm Res 1999, 16, 176-85
© Bernd Meibohm, PhD, FCP, University of Tennessee 12
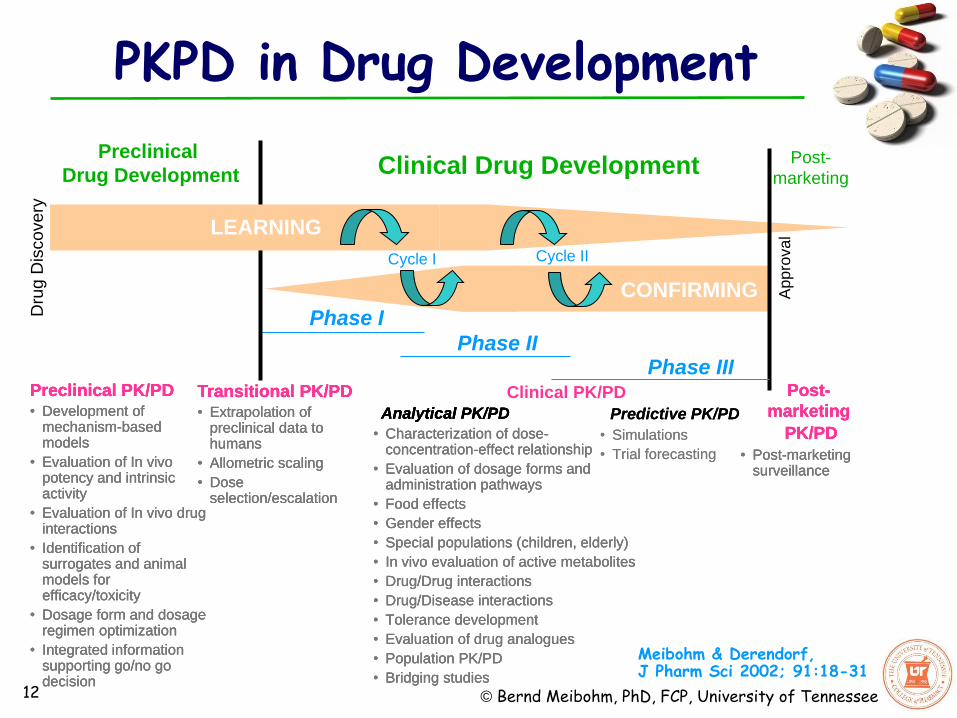
Clinical PK/PD Preclinical PK/PD
• Development of mechanism-based models
• Evaluation of In vivo potency and intrinsic activity
• Evaluation of In vivo drug interactions
• Identification of surrogates and animal models for efficacy/toxicity
• Dosage form and dosage regimen optimization
• Integrated information supporting go/no go decision
Transitional PK/PD
• Extrapolation of preclinical data to humans
• Allometric scaling
• Dose selection/escalation
Predictive PK/PD • Simulations
• Trial forecasting
Analytical PK/PD • Characterization of dose-
concentration-effect relationship
• Evaluation of dosage forms and administration pathways
• Food effects
• Gender effects
• Special populations (children, elderly)
• In vivo evaluation of active metabolites
• Drug/Drug interactions
• Drug/Disease interactions
• Tolerance development
• Evaluation of drug analogues
• Population PK/PD
• Bridging studies
Preclinical
Drug Development Clinical Drug Development
CONFIRMING
Dru
g D
isco
ve
ry
Post-
marketing
Phase I
Phase II Phase III
Appro
val LEARNING
Cycle I Cycle II
Post-
marketing
PK/PD • Post-marketing
surveillance
Meibohm & Derendorf, J Pharm Sci 2002; 91:18-31
PKPD in Drug Development
Preclinical PK/PD
• Development of mechanism-based models
• Evaluation of In vivo potency and intrinsic activity
• Evaluation of In vivo drug interactions
• Identification of surrogates and animal models for efficacy/toxicity
• Dosage form and dosage regimen optimization
• Integrated information supporting go/no go decision
Transitional PK/PD
• Extrapolation of preclinical data to humans
• Allometric scaling
• Dose selection/escalation
Analytical PK/PD • Characterization of dose-
concentration-effect relationship
• Evaluation of dosage forms and administration pathways
• Food effects
• Gender effects
• Special populations (children, elderly)
• In vivo evaluation of active metabolites
• Drug/Drug interactions
• Drug/Disease interactions
• Tolerance development
• Evaluation of drug analogues
• Population PK/PD
• Bridging studies
Post-
marketing
PK/PD • Post-marketing
surveillance
Predictive PK/PD • Simulations
• Trial forecasting
Preclinical PK/PD
• Development of mechanism-based models
• Evaluation of In vivo potency and intrinsic activity
• Evaluation of In vivo drug interactions
• Identification of surrogates and animal models for efficacy/toxicity
• Dosage form and dosage regimen optimization
• Integrated information supporting go/no go decision
Transitional PK/PD
• Extrapolation of preclinical data to humans
• Allometric scaling
• Dose selection/escalation
Analytical PK/PD • Characterization of dose-
concentration-effect relationship
• Evaluation of dosage forms and administration pathways
• Food effects
• Gender effects
• Special populations (children, elderly)
• In vivo evaluation of active metabolites
• Drug/Drug interactions
• Drug/Disease interactions
• Tolerance development
• Evaluation of drug analogues
• Population PK/PD
• Bridging studies
Post-
marketing
PK/PD • Post-marketing
surveillance

© Bernd Meibohm, PhD, FCP, University of Tennessee 13
Preclinical
Drug Development Clinical Drug Development
Dru
g D
iscovery
Post-
marketing
Phase I
Phase II Phase III
Appro
val
Learn-Confirm Cycle
Model-Based Drug Development (I)
Suryawanshi, Zhang, Pfister & Meibohm, Expert Opin Drug Discov 2010; 5:311-21

© Bernd Meibohm, PhD, FCP, University of Tennessee 14
A multi-disciplinary approach that integrates the relationships between diseases, drug characteristics, and individual variability
A framework for synthesizing information and extrapolating beyond what is traditionally studied in RCTs
A tool for rationale, critical decision making
From drug discovery to post-marketing
A mathematical explanation of the relationships needed to explain clinical outcomes over a timeframe of interest at its core
Away from study centric approach: seamless data mining and knowledge management strategy that quantitatively integrates data across studies and development phases
Model-Based Drug Development (II)

© Bernd Meibohm, PhD, FCP, University of Tennessee Clinical Development Post-
marketing
Phase I Phase II
Phase III
App
rova
l
Preclinical Development
Development Continuum
Disease Progression
Competitors
Patho- physiology
Genetics
Model-based Interdisciplinary Knowledgebase
Healthcare Outcome
Development Tool Kit
Model-Based Drug Development (III)
Zhang, Pfister, Meibohm AAPS J 2008, 4:552-9

© Bernd Meibohm, PhD, FCP, University of Tennessee 16 16
MADD vs. MBDD
Zhang, Pfister, Meibohm. AAPS J 2008, 4:552-9

© Bernd Meibohm, PhD, FCP, University of Tennessee 17 17
‘PKPD Reasoning’ in Discovery DMPK

© Bernd Meibohm, PhD, FCP, University of Tennessee 18 18
‘PKPD Reasoning’ in Discovery DMPK
Gabrielsson et al. Drug Discov Today 2009

© Bernd Meibohm, PhD, FCP, University of Tennessee 19 19
Biomarkers for PK/PD-Modeling
© Bernd Meibohm, PhD, FCP, University of Tennessee
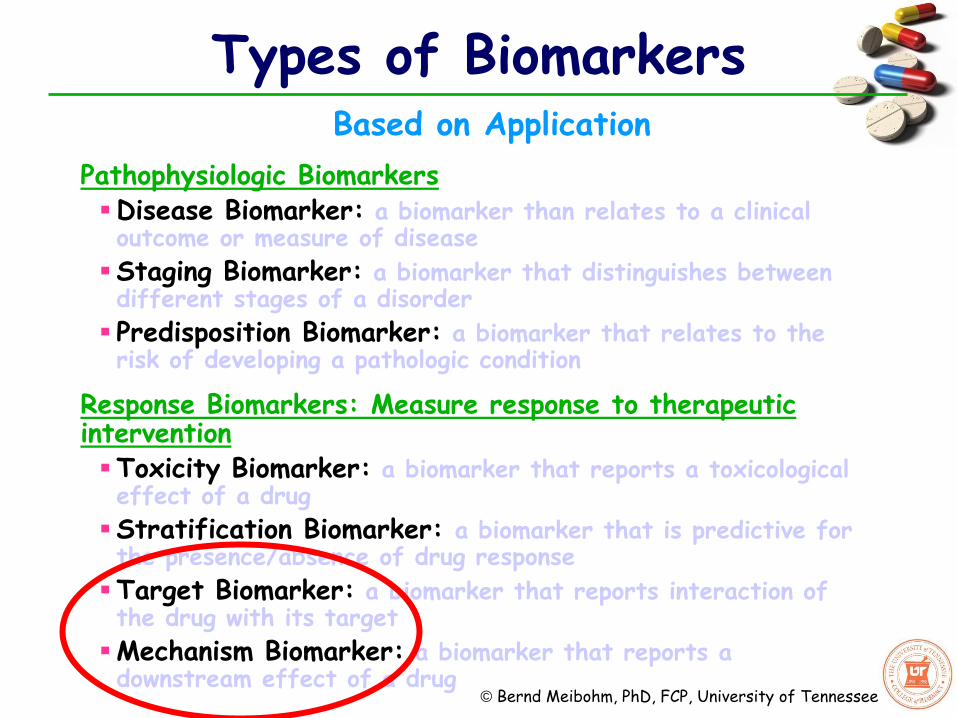
Types of Biomarkers Based on Application
Pathophysiologic Biomarkers Disease Biomarker: a biomarker than relates to a clinical outcome or measure of disease
Staging Biomarker: a biomarker that distinguishes between different stages of a disorder
Predisposition Biomarker: a biomarker that relates to the risk of developing a pathologic condition
Response Biomarkers: Measure response to therapeutic intervention Toxicity Biomarker: a biomarker that reports a toxicological effect of a drug
Stratification Biomarker: a biomarker that is predictive for the presence/absence of drug response
Target Biomarker: a biomarker that reports interaction of the drug with its target
Mechanism Biomarker: a biomarker that reports a downstream effect of a drug

© Bernd Meibohm, PhD, FCP, University of Tennessee 21
Drug Biomarker
Intermediate Measure of Drug Response
Clinical Endpoint
Disease Process
Physiology (e.g. Circadian Rhythm)
Environment
Therapeutic intervention
Drug Effects not mediated via Biomarker
Other Disease
Change in Disease Process
Natural Remission
Environment
Genetics
Biomarkers & Clinical Endpoints

© Bernd Meibohm, PhD, FCP, University of Tennessee
Cascade of Intermediary Biomarkers
Biomarkers & Clinical Endpoints
Visser et al., Drug Discov Today 2013, 18:764-75 22

© Bernd Meibohm, PhD, FCP, University of Tennessee
Cascade of Intermediary Biomarkers
Biomarkers & Clinical Endpoints
Biomarkers are usually more closely related to the drug’s mechanism of action than clinical endpoints
Biomarkers are usually more precisely measured with validated assays compared to clinical outcome
Biomarkers usually have a larger dynamic range compared to clinical endpoints.
Variations in biomarker signal(s) are usually more causally related to drug effect than variations in clinical endpoints
Biomarker may be useful even if not validated as surrogate endpoint predictive for clinical endpoints
Biomarkers may be superior to clinical endpoints for the characterization of exposure/response relationships
23

© Bernd Meibohm, PhD, FCP, University of Tennessee 24
Application of PKPD M&S Strategies in Drug Development
1.Exploring and optimizing study designs and treatment options
2.Integrating data over multiple studies and development phases
3.Confirmatory evidence for regulatory approval

© Bernd Meibohm, PhD, FCP, University of Tennessee 25
Clinical Trial Simulation (I)
Simulation in silico how a trial performs based on prior knowledge and assumptions for underlying distributions and mechanisms Study design: inclusion/exclusion criteria, setup, dosing regimens, measurements and interventions
Structural dose-concentration-response/toxicity relationship (PK-PD-model)
Between and within patient variability in PK and PD parameters
Effect of patient characteristics (covariates) on PK and PD
Natural progression of the disease
Adherence, drop-out rate, enrollment limitations
Simulation execution Monte-Carlo simulation
Hundreds to thousands of replicates
Analysis of each study according to predefined analysis plan for primary/secondary outcomes
o e.g. ANOVA between treatment arms for efficacy outcome parameters

© Bernd Meibohm, PhD, FCP, University of Tennessee 26
Clinical Trial Simulation (II)
Dose
Expo
sure
Eff
icacy
Biomark
er
Exposure
Tox
icity
Biom
ark
er
Exposure-Response Model
(PK/PD)
Biomarker
Relative
Risk Morbidity A
Morbidity B
Mortality
Disease Progression & Placebo Model
Biomark
er
Time
Trail Execution model 100 200
050
150
Caucasian Male80 120 180
02
46
Black Male80 120 160
02
46
8
Other races Male
100 200
0200
400
Caucasian Female80 140 200
020
40
60
Black Female80 120 160
010
30
Other races FemaleBaseline Body Weight Time
% D
rop-ou
t
%Adherence
% P
atient
s
In silico Clinical Trial

© Bernd Meibohm, PhD, FCP, University of Tennessee 27
Clinical Trial Simulation (III)
Outcome metric of simulation Probability distribution rather than p-value
Fraction of simulated studies that meet predefined outcome o What is the likelihood of a given trial design to achieve a certain outcome
o How sensitive is the trial outcome the underlying assumptions (e.g. efficacy, variability, adherence etc.)
Provides insights into trial performance and thus offers a rational basis for making decisions about a clinical study given different areas of uncertainty
0
10
20
30
40
50
60
70
80
90
100
15% 25% 35% 45%
Effect level
Pe
rce
nt
pro
ba
bilit
y
n=18 n=24 n=30 n=45 n=60 n=90
80% power

© Bernd Meibohm, PhD, FCP, University of Tennessee 28
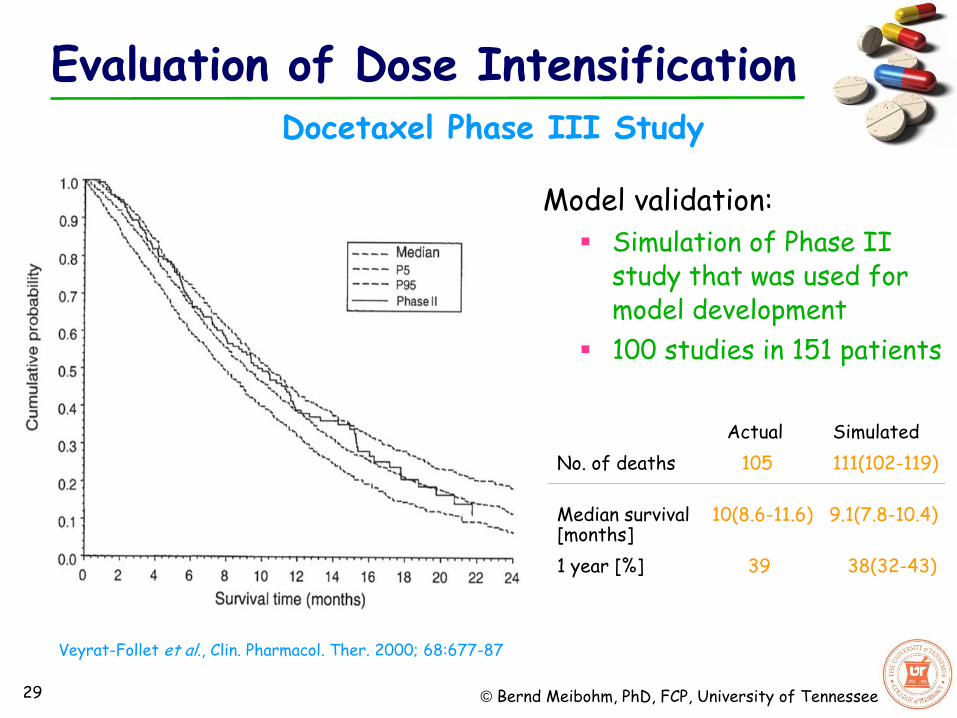
Population PK/PD analysis of Phase II data:
NSCLC patients with increased AAG have shorter TTP
and survival
AAG as docetaxel binding protein may alter distribution
processes
Do patients with increased AAG benefit from
dose intensification ?
Clinical trial simulation of Phase III study to
evaluate whether this question can be addressed
Veyrat-Follet et al., Clin. Pharmacol. Ther. 2000; 68:677-87
Docetaxel Phase III Study
Evaluation of Dose Intensification
© Bernd Meibohm, PhD, FCP, University of Tennessee 29
Model validation:
Simulation of Phase II study that was used for model development
100 studies in 151 patients
Actual Simulated
No. of deaths 105 111(102-119)
Median survival 10(8.6-11.6) 9.1(7.8-10.4) [months]
1 year [%] 39 38(32-43)
Docetaxel Phase III Study
Veyrat-Follet et al., Clin. Pharmacol. Ther. 2000; 68:677-87
Evaluation of Dose Intensification
© Bernd Meibohm, PhD, FCP, University of Tennessee 30
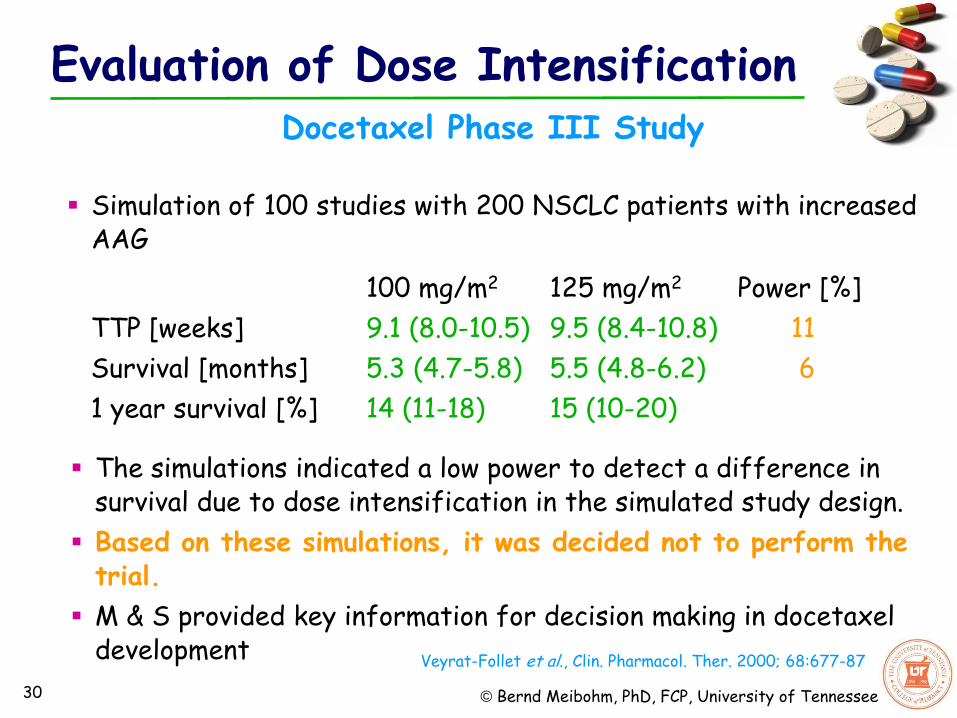
The simulations indicated a low power to detect a difference in survival due to dose intensification in the simulated study design.
Based on these simulations, it was decided not to perform the trial.
M & S provided key information for decision making in docetaxel development
Simulation of 100 studies with 200 NSCLC patients with increased AAG
100 mg/m2 125 mg/m2 Power [%]
TTP [weeks] 9.1 (8.0-10.5) 9.5 (8.4-10.8) 11
Survival [months] 5.3 (4.7-5.8) 5.5 (4.8-6.2) 6
1 year survival [%] 14 (11-18) 15 (10-20)
Docetaxel Phase III Study
Veyrat-Follet et al., Clin. Pharmacol. Ther. 2000; 68:677-87
Evaluation of Dose Intensification

© Bernd Meibohm, PhD, FCP, University of Tennessee 31
Application of PKPD M&S Strategies in Drug Development
1.Exploring and optimizing study designs and treatment options
2.Integrating data over multiple studies and development phases
3.Confirmatory evidence for regulatory approval
© Bernd Meibohm, PhD, FCP, University of Tennessee 32
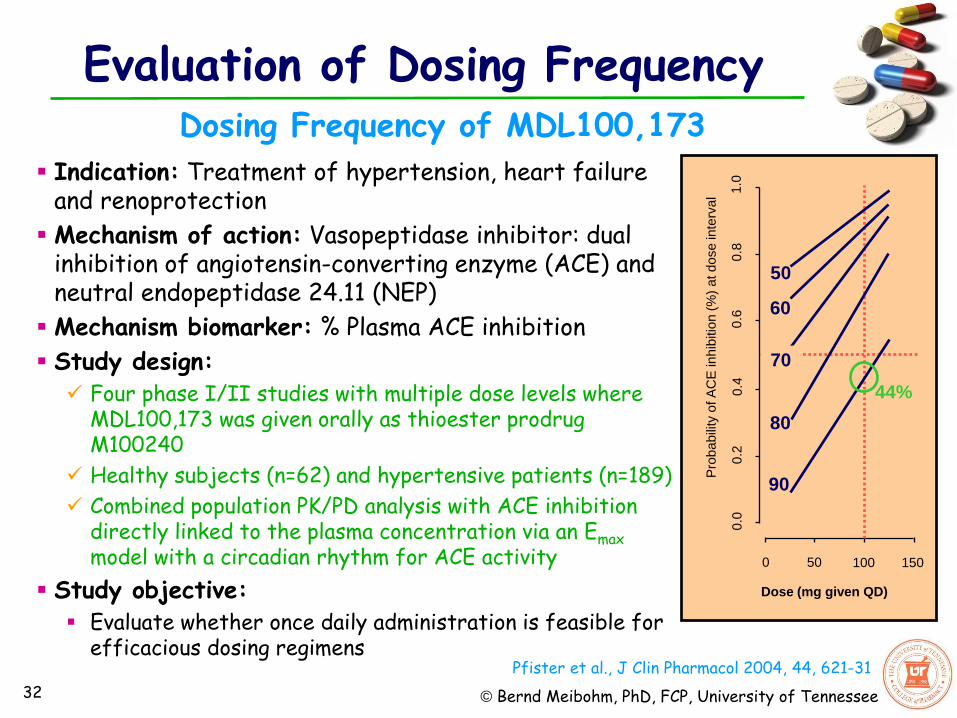
Dosing Frequency of MDL100,173
Pfister et al., J Clin Pharmacol 2004, 44, 621-31
Indication: Treatment of hypertension, heart failure and renoprotection
Mechanism of action: Vasopeptidase inhibitor: dual inhibition of angiotensin-converting enzyme (ACE) and neutral endopeptidase 24.11 (NEP)
Mechanism biomarker: % Plasma ACE inhibition
Study design: Four phase I/II studies with multiple dose levels where
MDL100,173 was given orally as thioester prodrug M100240
Healthy subjects (n=62) and hypertensive patients (n=189)
Combined population PK/PD analysis with ACE inhibition directly linked to the plasma concentration via an Emax model with a circadian rhythm for ACE activity
Study objective: Evaluate whether once daily administration is feasible for
efficacious dosing regimens
0 50 100 150
Dose (mg given QD)
1.0
0
.8
0.6
0
.2
0.4
0
.0
Pro
babili
ty o
f A
CE
in
hib
itio
n (
%)
at d
ose
inte
rva
l
50
60
70
80
90
44%
Evaluation of Dosing Frequency

© Bernd Meibohm, PhD, FCP, University of Tennessee 33
Target: 90% ACE inhibition over 24 hours in at least 50% of patients
Conclusion: Higher and/or more frequent doses are necessary to achieve target, e.g. 25 mg TID or 50 mg BID.
ACE Activity Profiles (median, 10-90th percentile)
Probability of ACE inhibition >90% (Target: 50% of the population)
0
Time [hr]
5 10 20
0
40
60
20
100
80
0
Time [hr]
5 10 20
0
40
60
20
100
80
AC
E a
ctivity [
%]
25 mg TID 50 mg BID
0
Time [hr]
5 10 20
25 mg TID 50 mg BID
0.8
0.0
0
.4
Pro
babili
ty o
f A
CE
in
hib
itio
n >
90
%
0
Time [hr]
5 10 20
0.8
0.0
0
.4
Pfister et al., J Clin Pharmacol 2004, 44, 621-31
Dosing Frequency of MDL100,173
Evaluation of Dosing Frequency

© Bernd Meibohm, PhD, FCP, University of Tennessee 34
Application of PKPD M&S Strategies in Drug Development
1.Exploring and optimizing study designs and treatment options
2.Integrating data over multiple studies and development phases
3.Confirmatory evidence for regulatory approval

© Bernd Meibohm, PhD, FCP, University of Tennessee 35
Simulation for Regulatory Approval
Gabapentin approved 1993 as adjunctive therapy in the treatment of partial seizures in epilepsia
Postmarketing, anecdotal evidence of efficacy in post herpectic neuralgia supplemental NDA
Two randomized placebo controlled trials, but different dose levels:
Regulatory concern: No replication of efficacy at tested doses
Exposure-response for gabapentin complicated by saturable absorption, leading to less than proportional increases in exposure with increasing dose
Gabapentin sNDA for neuropathic pain
© Bernd Meibohm, PhD, FCP, University of Tennessee 36
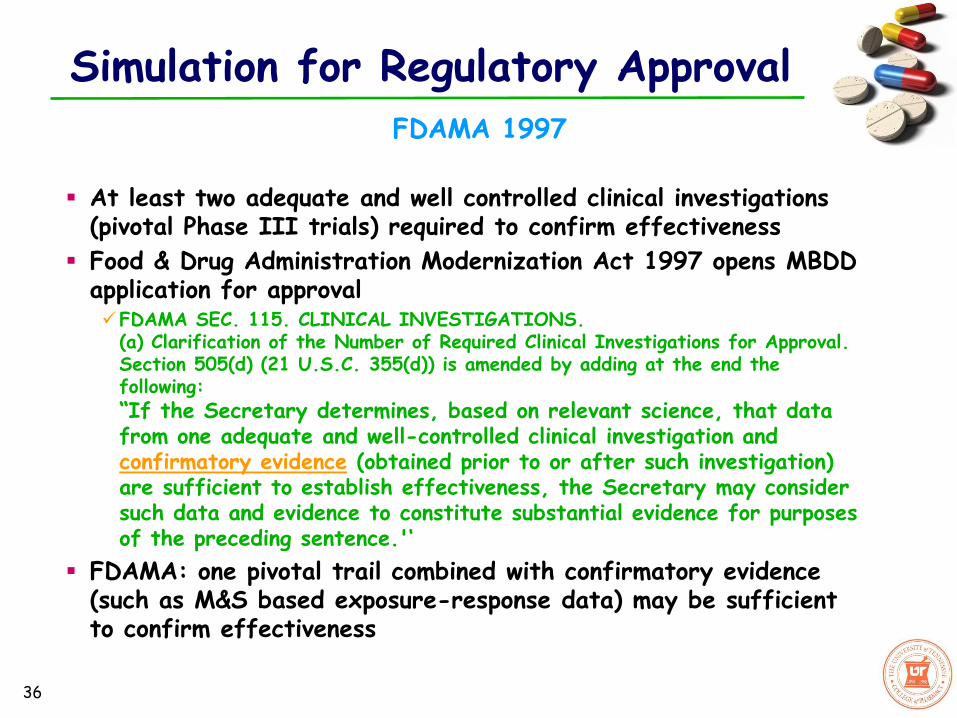
Simulation for Regulatory Approval
At least two adequate and well controlled clinical investigations (pivotal Phase III trials) required to confirm effectiveness
Food & Drug Administration Modernization Act 1997 opens MBDD application for approval FDAMA SEC. 115. CLINICAL INVESTIGATIONS.
(a) Clarification of the Number of Required Clinical Investigations for Approval. Section 505(d) (21 U.S.C. 355(d)) is amended by adding at the end the following: “If the Secretary determines, based on relevant science, that data from one adequate and well-controlled clinical investigation and confirmatory evidence (obtained prior to or after such investigation) are sufficient to establish effectiveness, the Secretary may consider such data and evidence to constitute substantial evidence for purposes of the preceding sentence.'‘
FDAMA: one pivotal trail combined with confirmatory evidence (such as M&S based exposure-response data) may be sufficient to confirm effectiveness
FDAMA 1997

© Bernd Meibohm, PhD, FCP, University of Tennessee 37
Simulation for Regulatory Approval
M&S based exposure-response information used to link the two pivotal trials Population PK/PD analyses quantifying exposure-dependent decreases in daily pain score with correction of estimated bioavailability and time-dependent placebo effect
Gabapentin sNDA for neuropathic pain
Miller et al., J Pharmacokinet Pharmacodyn 32, 185-197

© Bernd Meibohm, PhD, FCP, University of Tennessee 38
Simulation for Regulatory Approval
PK/PD analysis needed to withstand the same qualitative and quantitative review that data from a pivotal trial would:
Analysis tested and reviewed by FDA
Using data from additional 3 randomized, placebo-controlled phase II studies
Longitudinal analysis of all data simultaneously
By considering patient demographics, dose, baseline, treatment, and placebo effects, pain scores could be predicted with confidence based on information from either the four other studies or from the comparative pivotal study
Both pivotal clinical studies would have the same pain relief outcomes if doses were the same cross-confirming
Confirmation of efficacy across the three studied doses
Package insert/prescribing information: “PK/PD modeling provided confirmatory evidence of efficacy across all doses”
Gabapentin sNDA for neuropathic pain

© Bernd Meibohm, PhD, FCP, University of Tennessee 39
M&S and MBDD are multi-disciplinary approaches that integrate the relationships between disease, drug characteristics and individual variability in drug response.
M&S is already established in multiple areas of drug development, with a high likelihood of further expansion.
M&S provides a quantitative, data-driven framework that enables rational, scientifically–based choices at critical decisions points in drug development.
M&S allows for a more efficient drug development process through more informed go/no-go decisions and optimized resource allocation.
Conclusions
PKPD M&S in Drug Development

© Bernd Meibohm, PhD, FCP, University of Tennessee
www.P
KPD
ofPr
oteinThera
peut
ics.
com
April 1
1-15, 2
016
Time: April 11-15, 2016
6th