EU Project - Ribamapribamap.ormansu.gov.tr/shared/files/tr_1461921654.pdf · Critical issues have...
103
EU Project Technical Assistance for Conversion of River Basin Action Plans into River Basin Management Plans Workshop Identification of Impact and Pressures in Groundwater Bodies IMPRESS exercise for Groundwater Bodies in Italy National review and Tuscany case studies Dr. Stefano Menichetti, Geologist [email protected] ARPAT- Tuscany Environmental Protection Agency Ankara, 19 April 2016
Transcript of EU Project - Ribamapribamap.ormansu.gov.tr/shared/files/tr_1461921654.pdf · Critical issues have...

EU ProjectTechnical Assistance for Conversion of River Basin Action Plans
into River Basin Management Plans
Workshop Identification of Impact and Pressures in Groundwater Bodies
IMPRESS exercise for Groundwater Bodies in ItalyNational review and Tuscany case studies
Dr. Stefano Menichetti, [email protected]
ARPAT- Tuscany Environmental Protection Agency
Ankara, 19 April 2016

Index
● National review ● Tuscany IMPRESS case studies
● 2009, 2014: WFD (2000/60/EC) and GWWD (2006/118/EC)
● 2010: Nitrate Vulnerable Zones (91/676/EC)● 2010: Pesticide Vulnerable Zones

Legal Source
● Art. 5 of Water Framework Directive● Points out the need
for a "review of the impact of human activity"
● To be update every six years

Common Implementation Strategy● CONTENT
● Common understanding about pressures and impacts
● General approach for the analysis of pressures and impacts
● The “Toolbox” ● Sources of data and
information● Examples of current
practice

=> Reproducible and upgradeable over time.
7 + 1 (pilot) River Basin Districts in ITALY
Harmonization
● Harmonization at scale National would be desirable
● It's essential that the IMPRESS analysis is carried by defined methodology.

Administrative Boundaries
● Regional administrative authorities are also competent for the protection of water quality
● Environmental Agency that technically realize the Monitoring as IMPRESS studies are also regional

Established at the ISPRA with the task of promoting
the coordinated development the Agency System
(ISPRA / ARPA / APPA) as well as to ensure
uniformity in the performance of
Regional/Provincial Agencies as ISPRA itself is
continuing in an effort to harmonize
methodologies ...
Currently only some River Basin District has a standardized district IMPRESS analysis situation is not uniform throughout the country.
It is therefore strategic for the regional agency system a standardization of IMPRESS methods for direct implication:● risk assessment of non-achievement of water body quality objectives;● design of networks and monitoring programs,● reporting towards' European Union.
SNPA - Italian Environmental Agency Federal Council
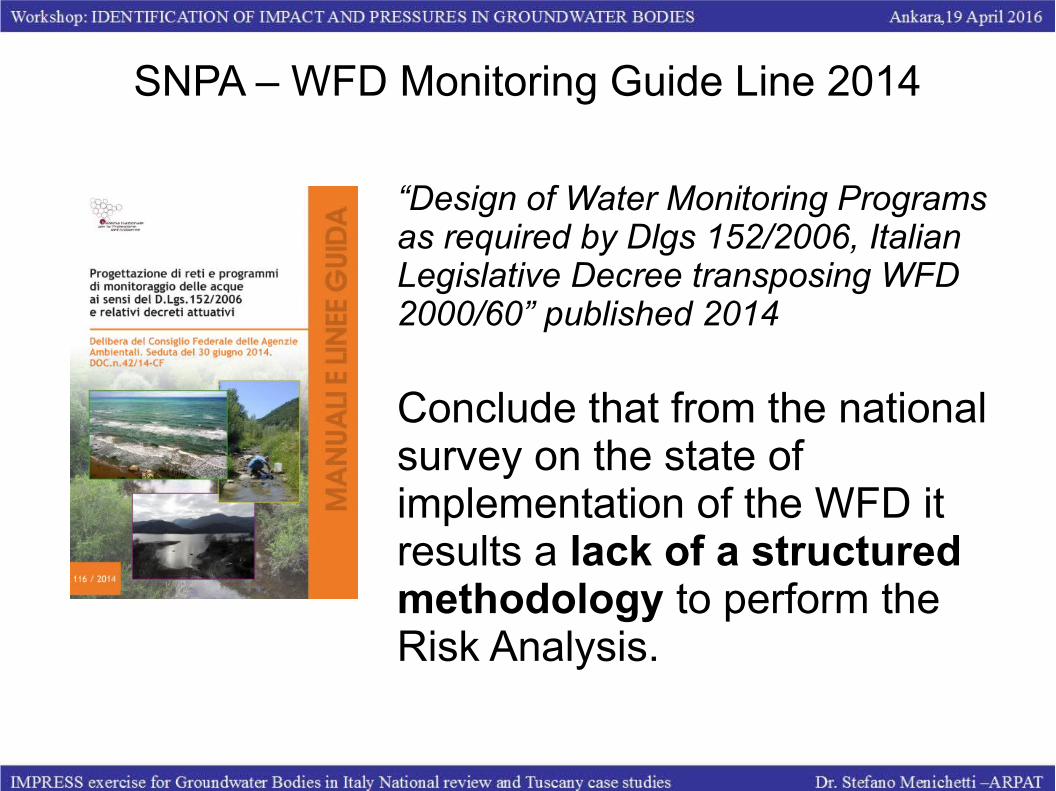
“Design of Water Monitoring Programs as required by Dlgs 152/2006, Italian Legislative Decree transposing WFD 2000/60” published 2014
Conclude that from the national survey on the state of implementation of the WFD it results a lack of a structured methodology to perform the Risk Analysis.
SNPA – WFD Monitoring Guide Line 2014

Three main objectives to be achieved during the 2015-2016 biennium:
● Acquiring a complete picture on the methodologies currently using by the District Authority on the analysis of pressures and risk assessment
● Identification of aspects that require greater harmonization
● Proposal for a shared criteria for the analysis of pressures and risk
Working Group n° 6
"Criteria for analysis of pressures on water bodies for the purpose homogenization of regional networks of water monitoring".
SNPA – Work in Progress

● It 'was considered this type of pressure?● If so in what terms? Qualitative or quantitative?● Indicator Description ● Formula / algorithm for each indicator used● Significance classes have been defined?● If so what threshold has been identified for each indicator for the allocation of significance?● The indicator was peopled?● They were found criticity in indicator population?● If so, what?● The indicator used is ill equipped result to detect specific pressure?● Critical issues have been encountered in the application of the thresholds of significance?● If so the thresholds were too cautious or pejorative?● It is considered useful for a review of the thresholds of significance?● Proposal for a new threshold
Questionary submitted to AgenciesQuestionary submitted to Agencies

ResultsResultsFor each pressure is reported a list of the indicators used, briefly described, critical issues and in conclusion two choices, for methodologies and consequent indicators:
● a basic indicator of low complexity applicable in all the national territory, immediate as based on databases of national or European level (eg. UWWTD, Corine Land Cover, Emission Inventory);➢ i.e. . simple ratio between numbers or extension of a pressure and the outcrop
(recharge) area of groundwater body (N° contaminated sites/Kmq, % urban areas)
● a more advanced indicator of medium high complexity closely linked to regional source of data or to methodologies more elaborated➢ (i.e. taking into account local vulnerability with contingency matrix :
,
Increasing pressure
Incr
easi
ng
vuln
erab
ility

Pressure Low complexity Medium High complexity
1.1 - Point – Urban waste water
PE/Kmq: Ratio of Sum of PE (popuation equivakent) by UWWTP reporting on outcropping (recharge) area fo GW body
Not used
1.3 - Point – Industrial IED plants
N/Kmq: Ratio of Number of IED plants by E-PRTR reporting on outcropping area of GW body
Not used
1.5 - Point - Contaminated sites or abandoned industrial sites
N/Kmq: Ratio of Number of Contaminated Sites by Regional Registry Office plants by E-PRTR reporting on outcropping area of GW body.
Significance level obtained from the comparative evaluation between MAGNITUDE of single pressure and local VULNERABILITY
1.6 - Point - Waste disposal sites
N/Kmq mq/Kmq mc/Kmq: Ratio of Number, Area or Volume of authorized Wastef Disposak Site on outcropping area of GW body.
Significance level obtained from the comparative evaluation between MAGNITUDE of single pressure and local VULNERABILITY
Point PressurePoint Pressure
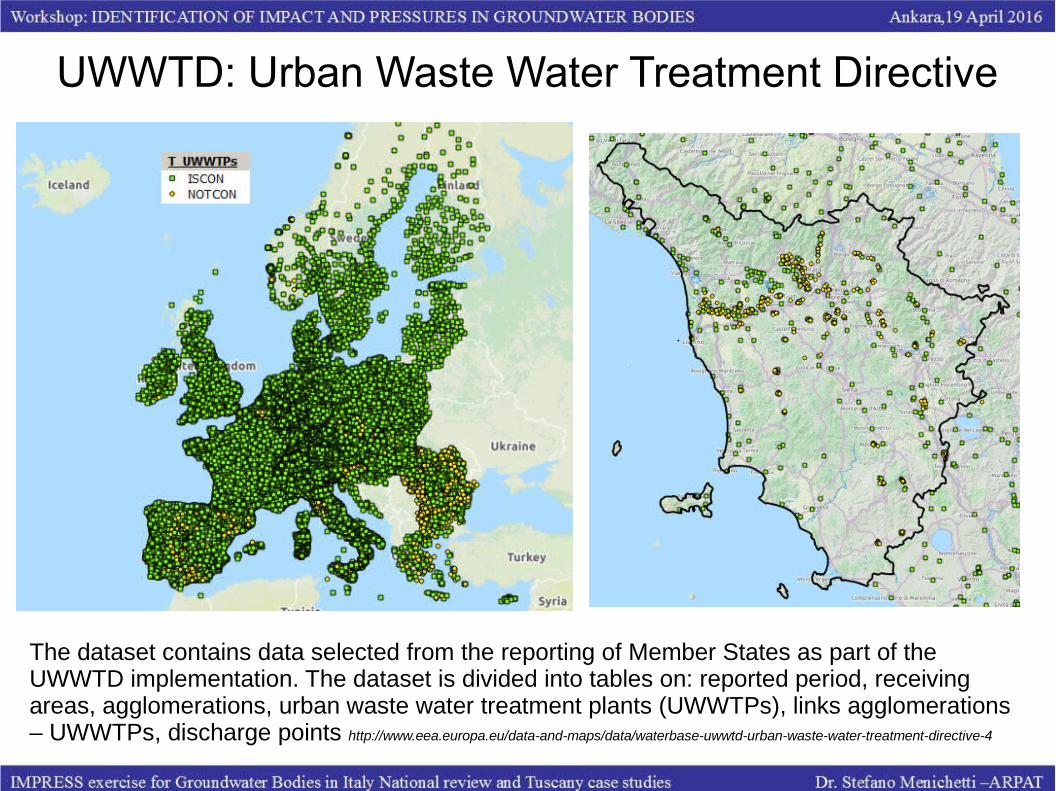
UWWTD: Urban Waste Water Treatment Directive
The dataset contains data selected from the reporting of Member States as part of the UWWTD implementation. The dataset is divided into tables on: reported period, receiving areas, agglomerations, urban waste water treatment plants (UWWTPs), links agglomerations – UWWTPs, discharge points http://www.eea.europa.eu/data-and-maps/data/waterbase-uwwtd-urban-waste-water-treatment-directive-4

The European Pollutant Release and Transfer Register (E-PRTR)
Article 7 of the Regulation sets the requirements for the annual reporting by Member States which covers the releases to air and water for 91 substances, as well as the transfers of pollutants in water and the transfer of waste from industrial facilities across 65 sectors. http://www.eea.europa.eu/data-and-maps/data/member-states-reporting-art-7-under-the-european-pollutant-release-and-transfer-register-e-prtr-regulation-8
Pressure Low complexity Medium High complexity
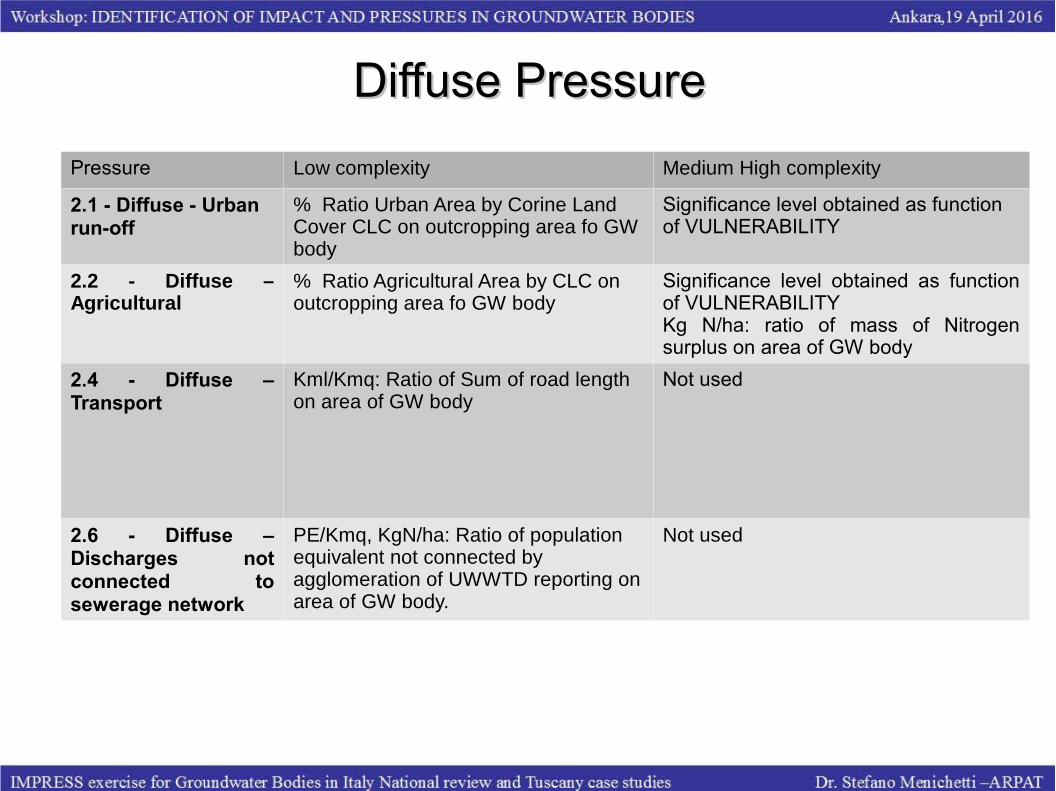
2.1 - Diffuse - Urban run-off
% Ratio Urban Area by Corine Land Cover CLC on outcropping area fo GW body
Significance level obtained as function of VULNERABILITY
2.2 - Diffuse – Agricultural
% Ratio Agricultural Area by CLC on outcropping area fo GW body
Significance level obtained as function of VULNERABILITYKg N/ha: ratio of mass of Nitrogen surplus on area of GW body
2.4 - Diffuse – Transport
Kml/Kmq: Ratio of Sum of road length on area of GW body
Not used
2.6 - Diffuse – Discharges not connected to sewerage network
PE/Kmq, KgN/ha: Ratio of population equivalent not connected by agglomeration of UWWTD reporting on area of GW body.
Not used
Diffuse PressureDiffuse Pressure

Corine Land Cover
Corine means 'Coordination of Information on the environment' and it was a prototype project working on many different environmental issues. The Corine databases and several of its programmes have been taken over by the EEA. One of these is an inventory of land cover in 44 classes, and presented as a cartographic product, at a scale of 1:100 000.http://www.eea.europa.eu/publications/COR0-landcover

Pressure Low complexity Medium High complexity
3.1 – Abstraction or flow diversion – Agriculture
N/Kmq: ratio of Number of wells on area of GW body
Mmc/year: Annual volume extracted
%: Summer Volume extracted/Storage (Plain GWB)
Annual Volume extracted/Area GW body (Mountain GWB)
3.2 – Abstraction or flow diversion – Public water supply
3.3 – Abstraction or flow diversion – Industry
AbstractionAbstraction
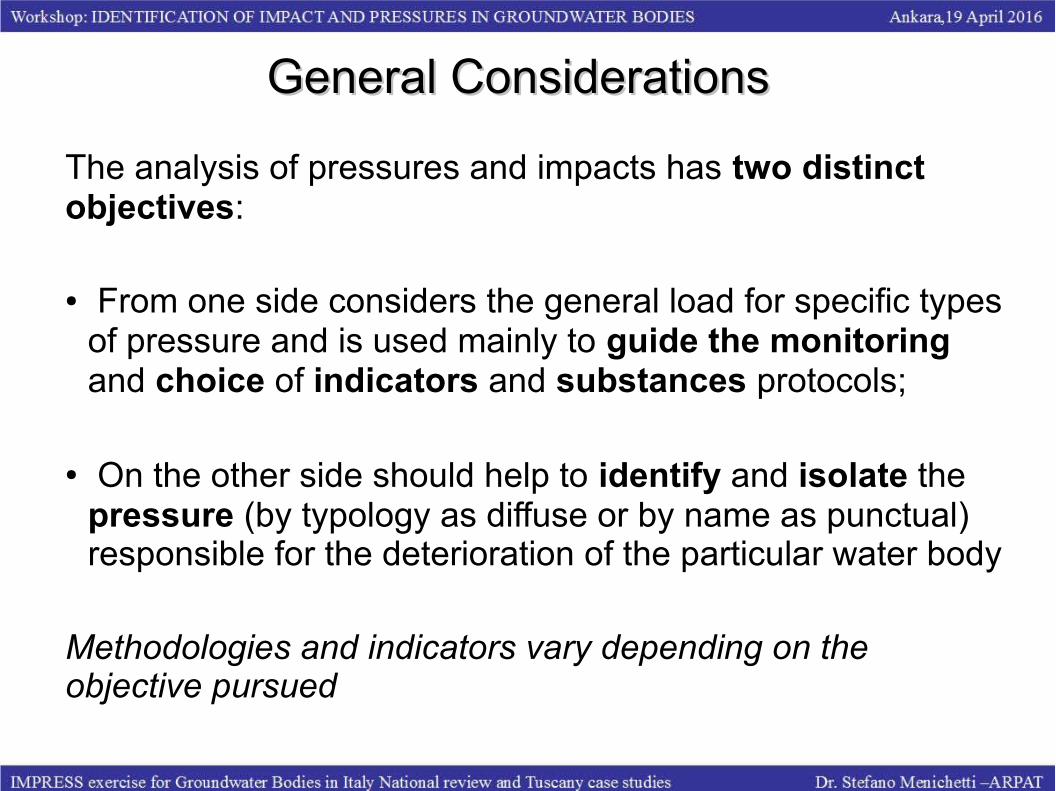
General ConsiderationsGeneral Considerations
The analysis of pressures and impacts has two distinct objectives:
● From one side considers the general load for specific types of pressure and is used mainly to guide the monitoring and choice of indicators and substances protocols;
● On the other side should help to identify and isolate the pressure (by typology as diffuse or by name as punctual) responsible for the deterioration of the particular water body
Methodologies and indicators vary depending on the objective pursued

IT established Methodologies IT established Methodologies
● ITA "PADANO"● Sintesi delle pressioni e degli impatti
significativi esercitati dalle attività umane sullo stato delle acque superficiali e sotterranee (22/12/2014)
● ITB "ALPI ORIENTALI"● Sintesi delle pressioni e degli impatti
significativi (Dicembre 2014)

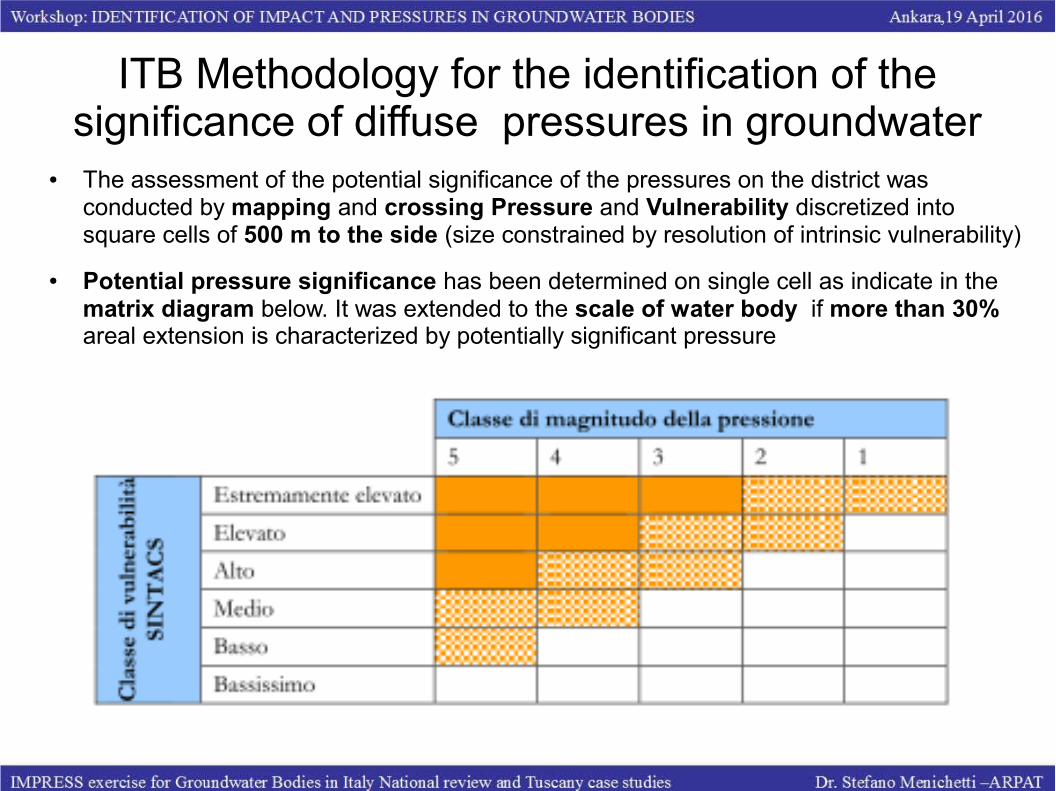
ITB Methodology for the identification of the significance of diffuse pressures in groundwater
● The identification of potentially significant diffuse pressures to groundwater has been associated by the application of a contamination risk assessment classic model of the aquifers (SPR model - Source, Pathway, Receptor) which defines the risk as a combination of three elements:
● The danger posed by a potentially polluting activity (equivalent to the source / pressure, or Source);
● The inherent vulnerability of groundwater to contamination water (equivalent to the route, or Pathway);
● The potential consequences of a contamination event on the receptor (Receptor) formed by the groundwaters itself.

● In agreement with the model defined, the potential significance of the single pressure has been established by identifying the risk, ie crossing the danger, represented by the "magnitude" of the pressure, with the inherent vulnerability of aquifers.
● The magnitude of the single pressure was represented by an indicator classified into 5 classes, representing different levels of magnitude of the specific pressure.
● The inherent vulnerability of aquifers, which represents the susceptibility of the route has been characterized through SINTACS (Civita, 1994) method where available, alternatively administrations have taken to homogenize similar representation into a final 6-class system.
ITB Methodology for the identification of the significance of diffuse pressures in groundwater
ITB Methodology for the identification of the significance of diffuse pressures in groundwater
● The assessment of the potential significance of the pressures on the district was conducted by mapping and crossing Pressure and Vulnerability discretized into square cells of 500 m to the side (size constrained by resolution of intrinsic vulnerability)
● Potential pressure significance has been determined on single cell as indicate in the matrix diagram below. It was extended to the scale of water body if more than 30% areal extension is characterized by potentially significant pressure

ITB Methodology for the identification of the significance of diffuse pressures in groundwater
● The methodology was easily applied to aquifers undifferentiated high plains where the recharge area coincides with the surface area;
● In the case of confined water bodies the potential significance judgment was based also on the indicator and the vulnerabilities in separate recharge areas of this water bodies;
● In any case in more complex conditions it was applied an expert assessment of the pressures still based on the available monitoring data.
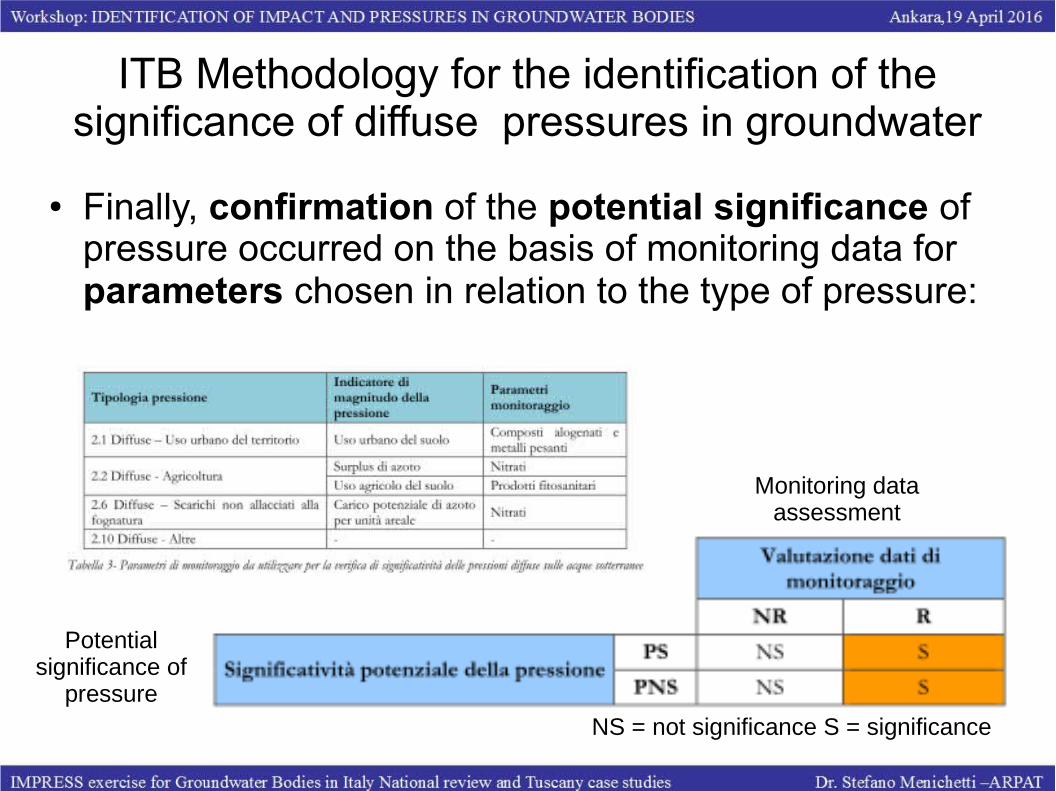
ITB Methodology for the identification of the significance of diffuse pressures in groundwater
● Finally, confirmation of the potential significance of pressure occurred on the basis of monitoring data for parameters chosen in relation to the type of pressure:
Monitoring data assessment
Potential significance of
pressureNS = not significance S = significance

Tuscany Case Studies – 1
IMPRESS for WFD (2000/60/EC) GWWD (2006/118/EC)

● Project assigned to ARPAT in 2014 ● Updating the analysis of pressures and impacts
performed in 2009 with indicators meet the WISE system.

Methodology
1) Identification of pressure where possible common for categories of water bodies:● CW - Water Surface Marino Coastal● RW, LW, TW - Internal Surface Waters (Rivers,
Lakes and transitional waters)● GW - subterranean waters
2) Identification of catchment/recharge areas of water bodies and appropriate metrics for the calculation of pressure indicators

Methodology3) Calculation by environmental monitoring data impact indicators for water bodies and development on a statistical basis or regulations of two thresholds for "not a Risk" (naR) and "at Risk" (aR)
4) Detection of possible correlations impact-pressure otherwise finding statistical threshold (75th percentile, natural break) for pressure indicators
5) Final classification of all water bodies on the basis of thresholds of both impact both pressure in:
● "at Risk" WB submitted to Operative Monitoring OM
● "not at Risk" WB submited to Surveillance Monitoring SM
● "probably at Risk" submitted at the beginning to SM to assess impact

Identification of PressurePoint Diffuse

2) Identification of catchment/recharge areas
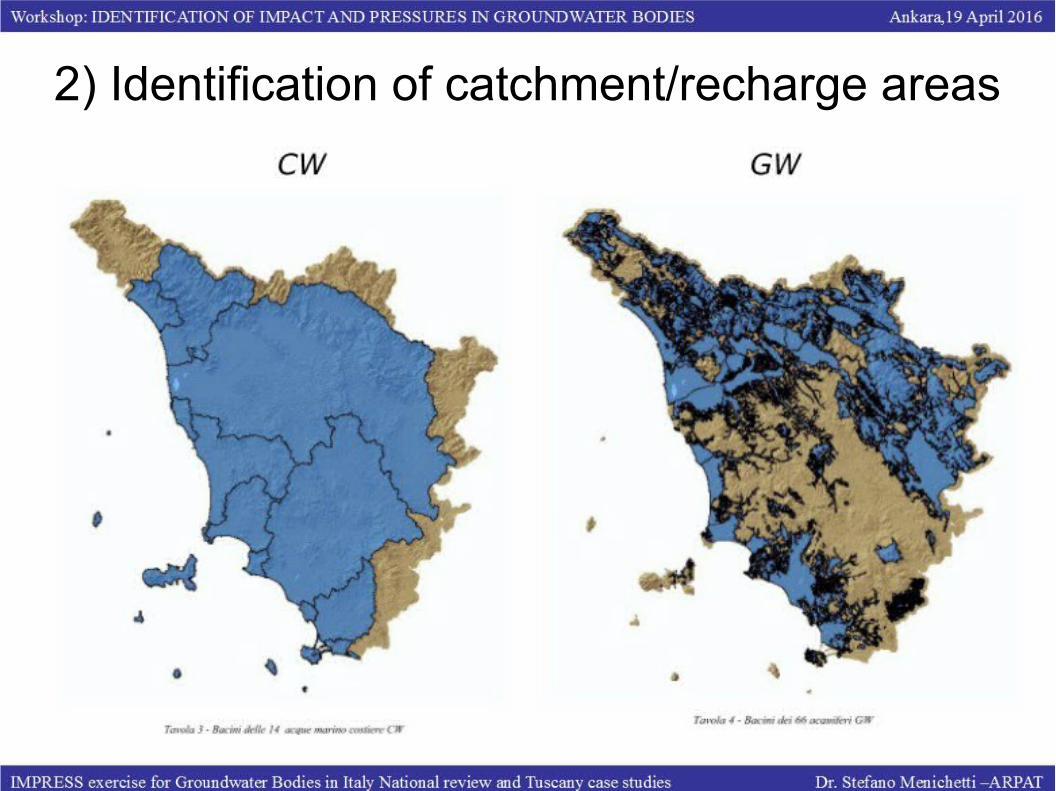
2) Identification of catchment/recharge areas

3) Calculation of impact indicators

4) Processing thresholds
● The procedure has the objective to associate to each impact and pressure indicator in respect of each type of water body a defined threshold as level of significance.
● The thresholds may have three different origins:● Normative Quality Standard and / or Literature: This
is the simplest case, as in the case of impact threshold nitrates > 50 mg/L; indications of literature can exist for pressure indicators, thresholds already identified by previous studies fall into this category;

4) Processing thresholds● Distributive: this is more specific thresholds, derived from
the same set of data collected; in case it may be the 75th percentile or third quartile or otherwise through a statistical procedure of separation of frequencies (Sinclair, 1974) that can separate distinct data populations representing, in hypothesis also distinct processes;
Example on Turkish Groundwater Nitrate concentration mg/L taken from EEA Waterbase_groundwater_v14:
Probability plot highlights two possible thresholds at 20 mg/L and 5 mg/L

4) Processing thresholds● Correlation: where it is possible to demonstrate a significant
correlation between impact and pressure indicators and it was finally possible, obtain a threshold of significance indicator of pressure by regression on impact indicator

4) Processing Threshold● Correlation was accepted for statistical significance
(p < 0,05 or p < 0,1) assessed by robust non-parametric Spearman correlation coefficient ρ, and in most favorable cases, by the parametric Pearson correlation coefficient r
● Trend line shown in the graphs, as the cases, indicate linear or logarithmic regression.
● Intensity of the positive correlation between the two indicators is described as follows:
Correlationnoneweakmoderatestrongperfect

Examples:
Moderate and statistically significant
Parametric correlation
4) Processing Threshold

Examples:
Moderate and statistically significant
Non Parametric correlation
4) Processing Threshold
susp
ende
d so
lids
halo
gena
ted
orga
nic
com
poun
ds
industrial wastewater Pe/sq km
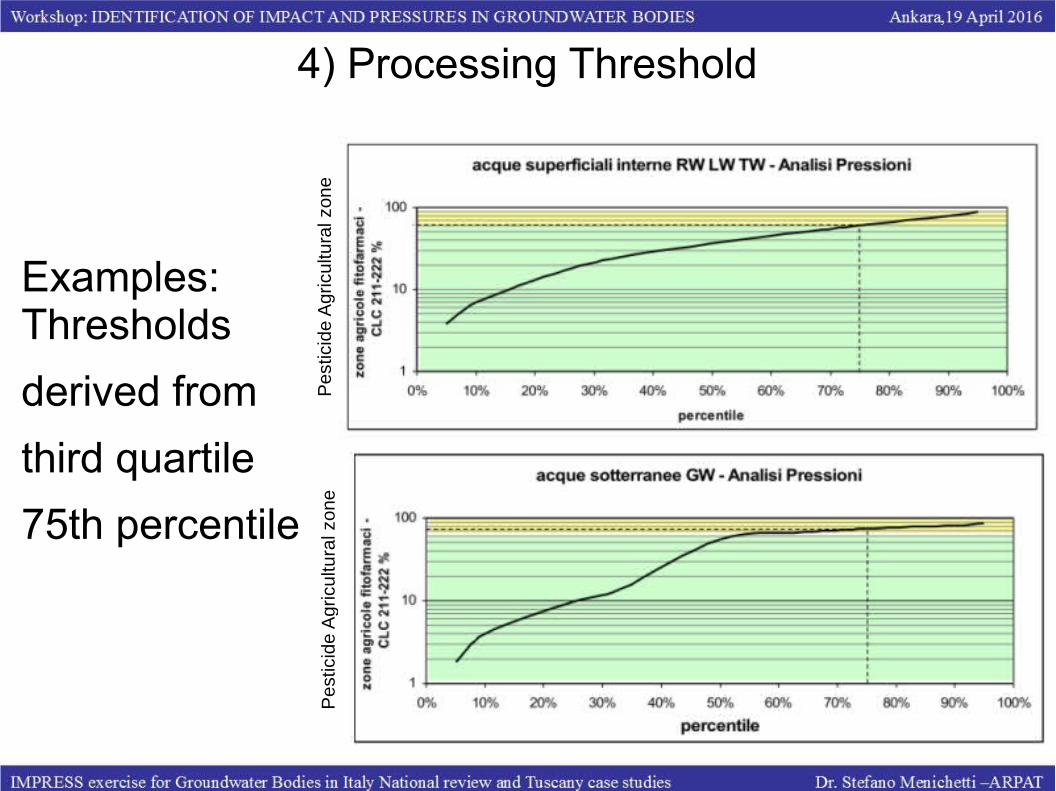
Examples: Thresholds
derived from
third quartile
75th percentile
4) Processing Threshold
Pes
ticid
e A
gric
ultu
ral z
one
industrial wastewater Pe/sq km
Pes
ticid
e A
gric
ultu
ral z
one

4) Processing ThresholdMetric | Thresholds Metric | Thresholds Metric | Thresholds

5) Water Bodies Classification

5) Water Bodies Classification

5) Water Bodies Classification
RW IMPRESS ANALYS
Co
rine
La
nd
Co
ver

Tuscany Case Studies – 2
Nitrate Vulnerable Zone (91/676/CE)
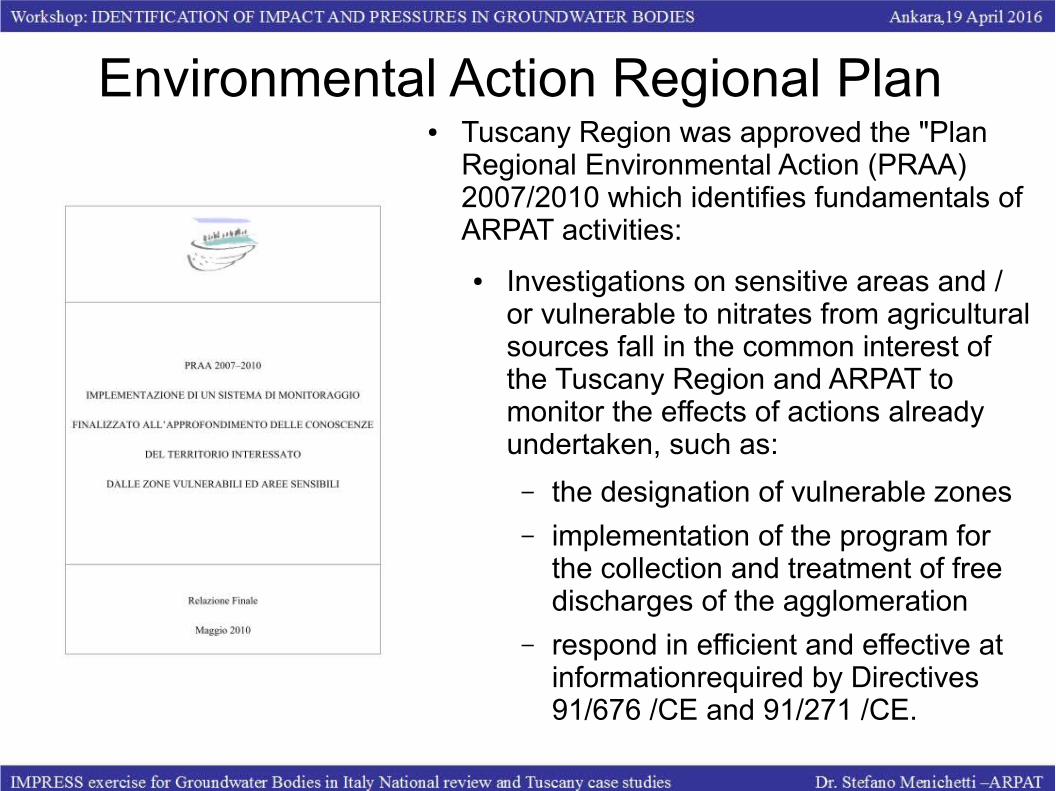
Environmental Action Regional Plan ● Tuscany Region was approved the "Plan
Regional Environmental Action (PRAA) 2007/2010 which identifies fundamentals of ARPAT activities:
● Investigations on sensitive areas and / or vulnerable to nitrates from agricultural sources fall in the common interest of the Tuscany Region and ARPAT to monitor the effects of actions already undertaken, such as:
– the designation of vulnerable zones – implementation of the program for
the collection and treatment of free discharges of the agglomeration
– respond in efficient and effective at informationrequired by Directives 91/676 /CE and 91/271 /CE.

ARPAT Investigation● ARPAT has therefore setup a project to consolidate knowledge in
Sensitive Areas (91/271/CE) as Nitrate Vulnerable Zone (91/676/CE).
● The project has investigated already designated NVZ by Tuscan D.C.R. 170,171,172, 173/2003 and D.C.R. 3/2007 as well as those considered worthy of attention in relation to the state of the aquatic environment and the pressures imposed on it and / or for the presence of already potentially critical situations.
● The hazard aspects and territorial vulnerability as regards the problem of Nitrates from agricultural sources have been addressed in accordance with the methodology already tested in the context of a national research project conducted in 2006 by ARPAT in collaboration with the University of Florence on Vulnerable Coastal Zone between Rosignano and San Vincenzo, methodology which is embodied in the latest in a Risk Map of pollution by nitrates.

● The reference data for the evaluation of impairment signals on surface as groundwater, referring, as indicated from the Nitrate Directive to eutrophication of surface water bodies and concentrations of nitrate ion in excess drinking water threshold of 50 mg/L, has covered all points belonging to environmental monitoring networks of surface water (MAS) and groundwater (MAT) and special purpose of drinking water (POT) and fish life (VTP)
Indicators & Thresholds
Indicators & Thresholds
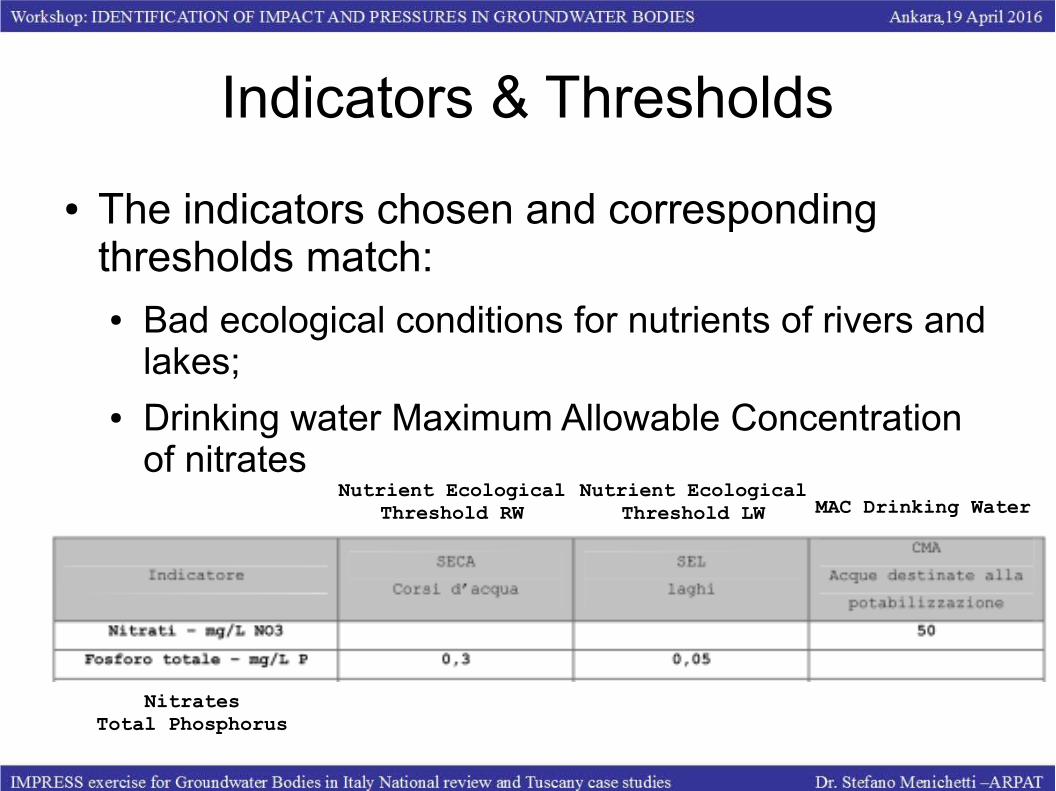
● The indicators chosen and corresponding thresholds match:● Bad ecological conditions for nutrients of rivers and
lakes;● Drinking water Maximum Allowable Concentration
of nitrates
NitratesTotal Phosphorus
Nutrient Ecological Threshold RW
Nutrient Ecological Threshold LW MAC Drinking Water

Risk assessment
● On the basis of parameters nitrates and total phosphorous were evaluated "at risk" situations by:● trend assessment in individual sampling points
inside the NVZ in reference to the period 2002-2007;
● other possible correlations with pressure indicators for the purpose of identification of areas vulnerable, based on the analysis of pressures and impacts and thne to support the validation of NVZ since designated here.

Trend assessment● The trends were assessed for monitoring stations
identified as "at risk" where the UCL95 excess 75% of threshold values (37.5 mg / L for nitrate and for total phosphorus, 0.75 mg/L lakes and reservoirs, in 0,225 in courses and channels).
● Further conditions for the reliability of the evaluation of trends was derived from the text of the proposal European Directive 2003 n ° 550, preparatory to Directive 2006 n ° 118 about numerosity:
● The software used was the GWSTAT made available by the WFD-GW Austrian Environmental Agency project http://www.umweltbundesamt.at/en_wfdgw_waterframework
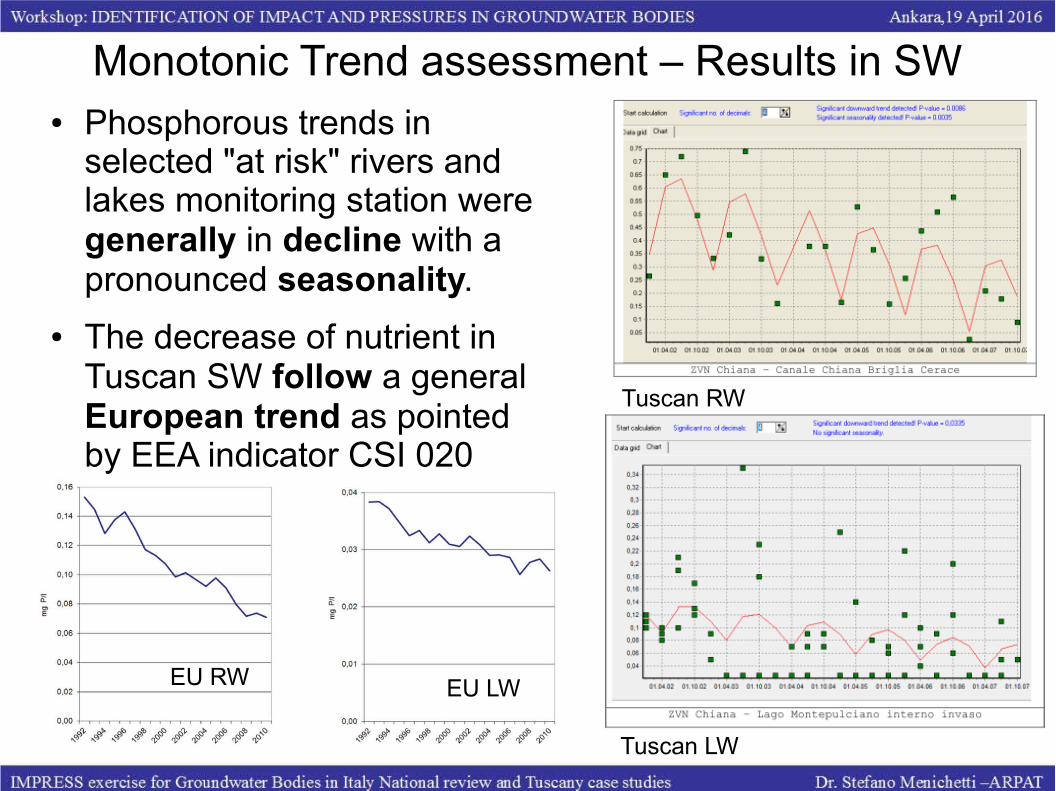
Monotonic Trend assessment – Results in SW● Phosphorous trends in
selected "at risk" rivers and lakes monitoring station were generally in decline with a pronounced seasonality.
● The decrease of nutrient in Tuscan SW follow a general European trend as pointed by EEA indicator CSI 020
Tuscan RW
Tuscan LW
EU RW EU LW

Monotonic Trend assessment – Results in GW● Nitrate trends in 22 selected
"at risk" station in gw were more various with 5 increasing and 2 decreasing, generally in growth
● A similar situation is shown for nitrate also in general European trend Tuscan GW station (+)
EU GW
Tuscan GW station (-)

Reversal Trend assessment – Results● In SW were not observed
reversal trends while in GW Nitrate result 3 reversal trend starting from year 2004 to 2005
● Also in this case a similarity is shown for nitrate general European trend Tuscan GW reversal trend in NVZ Cecina
EU GW
Tuscan GW reversal trend in NVZ Cecina

Nitrate Continuous Monitoring● Since September 2005 ARPAT has installed a continuous
monitoring station of the content of Nitrates in the aquifer of the Val di Chiana. The selected station has located at BROLIO, in municipality of Castiglion Fiorentino (AR).
● The continuous monitoring of nitrate was performed using a S:can UV-VIS spectrometer
● Piezometric levels coming from near well field ”Pinetina”

Nitrate Continuous Monitoring● The continuous monitoring of nitrate showed that increasing
concentration follow recharge period and groundwater rise with a short delay up to 2-3 months.
Hydrologic year 2005-2006 Mean Hydrologic Year 2002-2007 monthly mean
Pie
zom
etric
leve
l mm
eter
s fr
om g
roun
d le
vel
Nitr
ate
mg/
L
Continuous Monitoring DIscrete Monitoring

IMPRESS Analysis for Nitrate Directive1) Calculation of IPNOA Agricultural Nitrate Hazard Index according to
methodology indicated by Padovani and Trevisan (2002);
2) Processing 2002-2006 monitoring data from GW and SW monitoring networks for definition of "vulnerate water bodies" by previous thresholds (NO3 GW, Ptot SW);
3) Analysis of pressures and impacts, comparing and, as possible, correlating, pressure indicator IPNOA, averaged on outcop/rechage areas of water bodies to impact indicators (NO3, Ptot);
4) identification of "potentially vulnerable areas" based on appropriate thresholds pressure derived from the assessed correlations with impacts;
5) elaboration of nitrates and nutrients risk maps, take into account effective vulnerability of water bodies, for groundwater and surface water;
6) proposal of Agricultural Origin Nitrates (and Nutrients) Vulnerable Zones as indicated by Directive (vulnerate areas and vulnerable) selecting highest risk within those areas.

IPNOA methodology● Padovani & Trevisan 2002
● Sum of Hazard Factor wheighted by Control Factor
FPfm: Hazard factor for mineral fertilizers
FPfo: Hazard factor for organic fertilizers
FPfd: Hazard factor for sewage sludge
FCa: Control factor for soil nitrogen content
FCc: Control factor for climatic conditions
FCpa: Control factor for agronomic practices
FCa: Control factor for irrigation practices

Hazard Factor from mineral fertilizer
● For hazard factor for mineral fertilizers (FPfm) data coming from 2006 cultivation declarations, collected in ARTEA the Agricultural Payments Regional Agency for 2006, very detailed;● Estimate of the hazard factor, and relate nitrates load from mineral fertilizers, for the many crop types, has been defined starting from categories specified by Padovani and Trevisan (2002),
N supply Kg/ha Crop FPfm
class

Hazard Factor for Organic Fertlizer
● Data at municipal level coming from Agricultural Statistical Census of 2001 (ISTAT) on organic residues from livestock and vegetable origin, resulting of farming activities.
● Starting from livestock and farming products waste (cubic meters per hectare per year) through the coefficients (ERSAL) was determined annual intake of kg N per hectare per municipality as the basis for classification of the hazard factor in 5 class
N supply Kg/ha
FPfo class

Hazard Factor from Sewage Sludge
● Finally, for the last hazard factor of danger from sewage sludge (FP fd), the data source relates to authorization requests issued by the Tuscany region for the spreading of sludge coming from UWW Treatment Plants
● From these data, it is possible to relate the cadastral sheets that correspond to the particles where the permissions and the quantity of nitrogen were released.
N supply Kg/ha
FPfd class
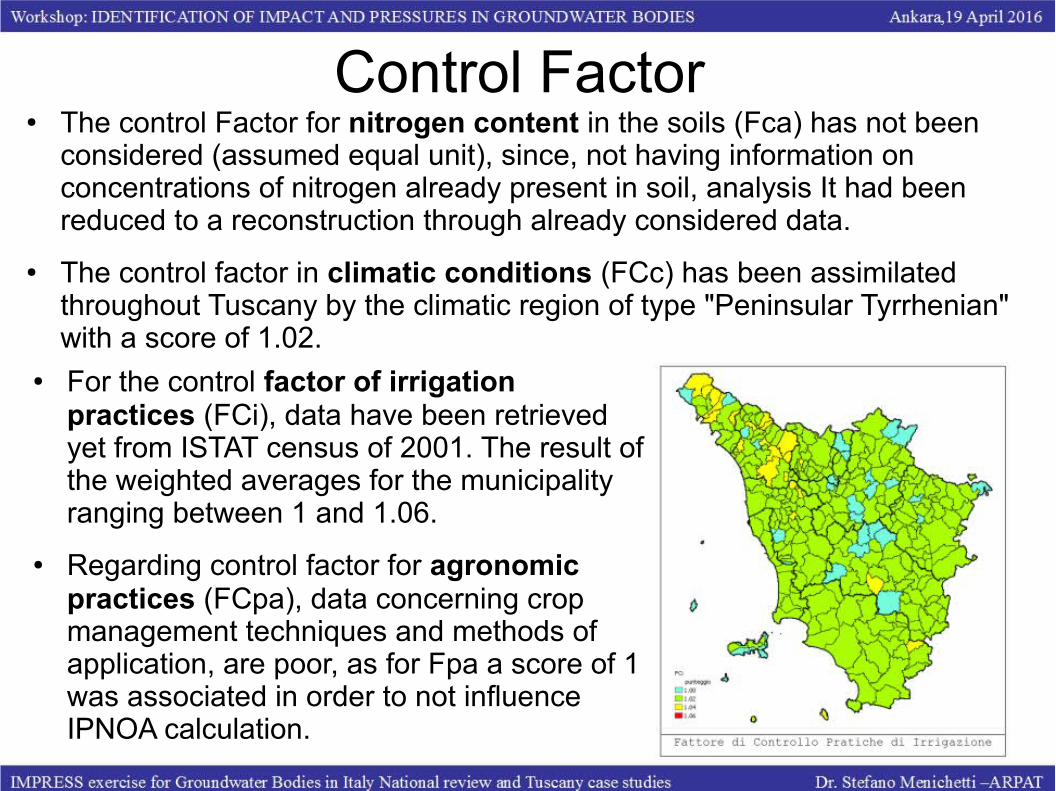
Control Factor ● The control Factor for nitrogen content in the soils (Fca) has not been
considered (assumed equal unit), since, not having information on concentrations of nitrogen already present in soil, analysis It had been reduced to a reconstruction through already considered data.
● The control factor in climatic conditions (FCc) has been assimilated throughout Tuscany by the climatic region of type "Peninsular Tyrrhenian" with a score of 1.02.
● For the control factor of irrigation practices (FCi), data have been retrieved yet from ISTAT census of 2001. The result of the weighted averages for the municipality ranging between 1 and 1.06.
● Regarding control factor for agronomic practices (FCpa), data concerning crop management techniques and methods of application, are poor, as for Fpa a score of 1 was associated in order to not influence IPNOA calculation.
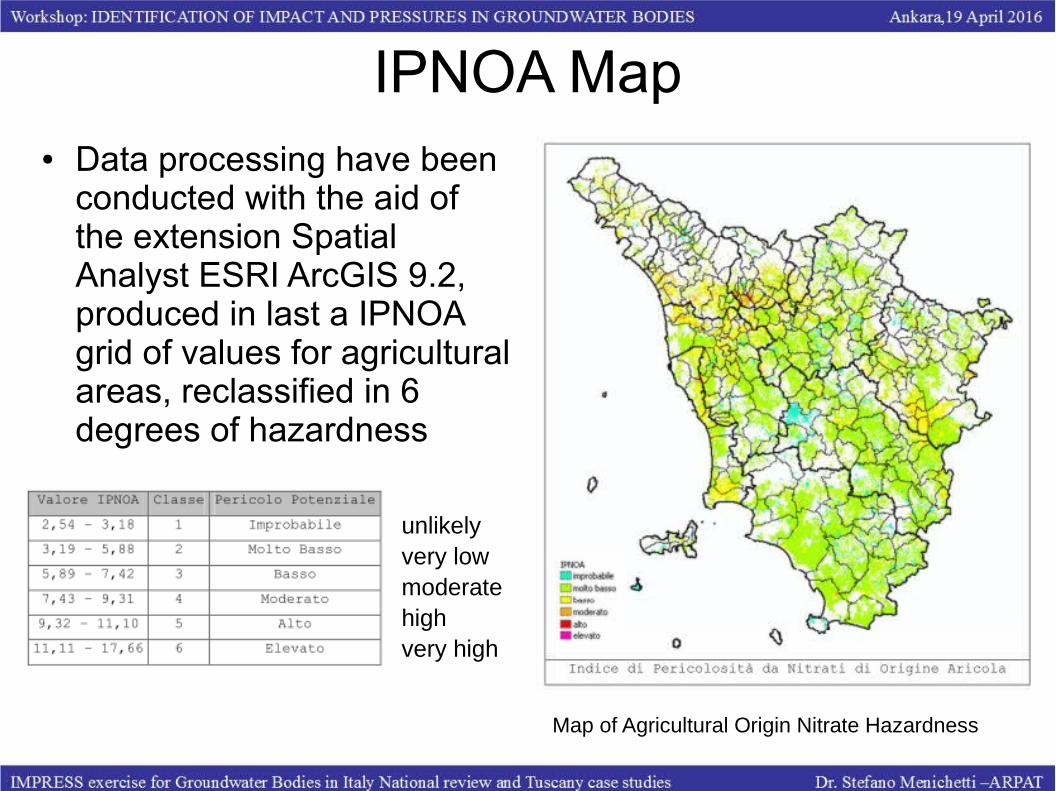
IPNOA Map● Data processing have been
conducted with the aid of the extension Spatial Analyst ESRI ArcGIS 9.2, produced in last a IPNOA grid of values for agricultural areas, reclassified in 6 degrees of hazardness
unlikelyvery lowmoderatehighvery high
Map of Agricultural Origin Nitrate Hazardness

Vulnerate Water Bodies● The reference thresholds, for the definition of the Vulnerate
Water Body were still:
● Nitrate content of 50 mg/L for GW related to drinking use;● Total phosphorus content of 0.3 and 0.05 mg/L, respectively, in
reference to the ecological conditions of RW and LW
RW LW GW● RW LW: 148 basins and sub-basins underlying the monitoring stations
● GW: 45 groundwater bodies and related outcrop areas for 400 monitoring stations

Vulnerate Water Bodies
RW LW GW
VulnerateVulnerate (red) > Threshold Value
At RiskAt Risk (orange) > 75% Threshold Value
RW LW
GW

IMPRESS Analysis● The pressures identified by the index IPNOA, were then
averaged on outcrop/recharge areas of water bodies and finding possible correlation and regression between impact (NO3 and Ptot) and the pressure (IPNOA) indicators
LWRW GW
Nitrates mg/LTotal Phosphorous mg/L
IPN
OA
IPN
OA
IPNOA threshold as derived by NO3 Ptot ones

IMPRESS Analysis: SW Results
● Despite inaccurate correlation a general agreement is given between “risk level” by monitoring data (impact) and “potential risk level” by pressure
● To evaluate statistical significance χ2 test is limited by the existence of low frequencies (<5);
● Non parametric Fisher's test remains possible arranging data in a more simple 2x2 table:● Fisher exact test is significant,
with p = 4E-8 << 0,01

IMPRESS Analysis: GW Results
● As in SW despite inaccurate correlation general agreement is given between “risk level” by monitoring data (impact) and “potential risk level” by pressure
● To evaluate statistical significance χ2 test is limited, here even more, by low frequencies (<5);
● Non parametric Fisher's test possible arranging data in a more simple 2x2 table:● Fisher exact test is again
significant, with p = 0,04 < 0,05

VULNERABILITY
● Comparing p-values previously obtained the lower significance for the matrix of the groundwater bodies, can be explained to an important role of hydrogeologic vulnerabilities due to different stratigraphic conditions.
● A greater or lesser vulnerability, at the same pressure can indeed produce very different impacts
● Necessary step, to complete study on NVZ, was therefore to assess the specific vulnerability of water bodies

GW VULNERABILITY ● A Vulnerability
Hydrogeological as prepared by the Regional Geological and Soil Survey takes into account:● Lithological permeability● Attenuation Capacity ● Depth to groundwater● Climatic data● Land use● Slope
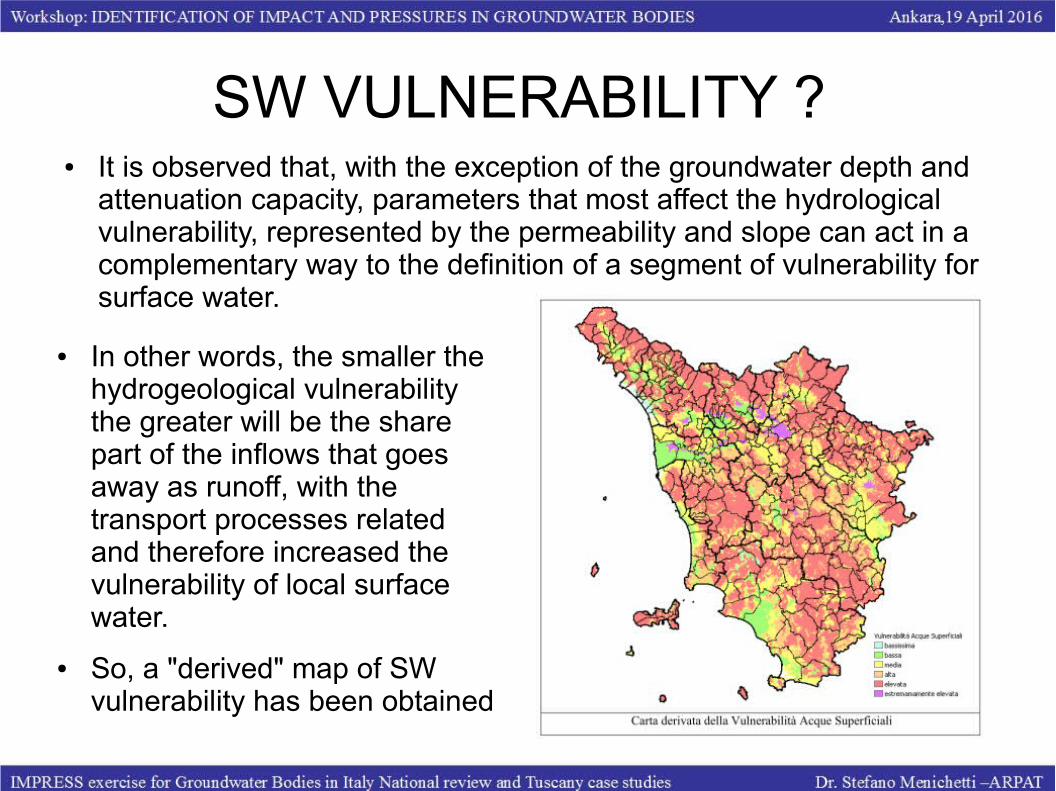
SW VULNERABILITY ? ● It is observed that, with the exception of the groundwater depth and
attenuation capacity, parameters that most affect the hydrological vulnerability, represented by the permeability and slope can act in a complementary way to the definition of a segment of vulnerability for surface water.
● In other words, the smaller the hydrogeological vulnerability the greater will be the share part of the inflows that goes away as runoff, with the transport processes related and therefore increased the vulnerability of local surface water.
● So, a "derived" map of SW vulnerability has been obtained

Risk Assessment● The risk of pollution by nitrates
and more generally by nutrients from agriculture, to both surface and groundwaters, is therefore derived from the product of the 6 classes Index IPNOA first defined for the 6 classes vulnerability
● RGW
= IPNOA Class X GW Vulnerability Class● R
sw = IPNOA Class X SW Vulnerability Class
● The classification of risk, in 6 classes, was finally reported in usual three classes of analysis indicated by the WFD (not Risk, probably Risk, Risk).
Haz
ard
(IP
NO
A)
Vulnerability

Nitrate and Nutrients Risk Map
SW GW

Nitrate and Nutrients Vulnerable Zone● NVZ can finally match to:
A) areas that discharge into vulnerate water bodies, ie the basins and sub-basins of surface water bodies and the outcrop/recharge areas of groundwater which exceed risk thresholds by available monitoring data of impacts;
B) areas that discharge into bodies of water that could be vulnerati, ie the basins and sub-basins reference of surface water bodies and the outcrop/recharge areas of groundwater bodies wich exceed risk threshold, by available pressure data;
C) More specificaly, the areas, among the above troubleshooting, which are actually at risk of pollution, as a result of hazard and vulnerabilities.
Nitrate and Nutrients Vulnerable Zone
SW, GW Vulnerable Zone and “at risk” areas
RW LW GW

Tuscany Case Studies – 3
Pesticide Vulnerable Areas

Defining Pesticide Vulnerable ZoneDefining Pesticide Vulnerable Zone
Italian Republic Legislative Decree 152/2006 – Annex 7 (WFD transposition)
=> possible analogy with vulnerable zones by Nitrates (91/676 / EC) always the Legislative Decree 152/06 - Annex 6... Areas that discharge directly or indirectly ... (pesticides) ... in already polluted waters or could be as a result of such discharges ...
- Vulnerate areas (already polluted waters)- Pressures (discharges)- correlation state - pressure (could be)
We talk about:
Part B of vulnerable zones by pesticides
Criteria for identification
“An area is considered vulnerable when using authorized products fitosaniari puts under risk water resources, and other relevant environmental media”

Vulnerate AreasVulnerate Areas
For the definition of vulnerate areas they were employed two
indices on the total of samples analyzed on the water body as part of the 2002-2006 Monitoring Program pursuant to Italian Legislative Decree 152/99:● Rpos % "positive" samples (with residual greater than the Limit of
Quantification)● Rsso % "suprathreshold" samples (with more than VL of 0.1 mg/L)
More indicators also on diffuse substances such as:● terbuthylazine,● atrazine● metolachlor

Vulnerate AreasVulnerate Areas
2002-2006 monitoring data coming from environmental station were statistically aggregated for plausible “water body recharge areas” either for Groundwater GW as for Surface Water SW
Surface waters: 148 basins and sub-basins underlying swbody monitoring stations
Groundwaters: 45 outcrop areas of gwbodies that aggregate data from ca. 400 monitoring stations

Stazione N R pos% R sso%
MAS-129 OMBRONE - PONTE DELLA CASERANA 44 98% 80%
MAS-130 OMBRONE - CARMIGNANO STAZIONE FFSS 34 82% 53%
MAS-140 PESCIA DI COLLODI - PONTE SETTEPASSI 37 65% 30%
…
…
MAS-131 PESA - PRESA SAMBUCA 11 36% 0%
MAS-005 SERCHIO - PONTE SAN PIETRO – LUCCA 23 30% 0%
MAS-122 BILANCINO - INTERNO INVASO 23 30% 0%
…
MAS-003 SERCHIO – GHIVIZZANO 24 0% 0%
MAS-015 VERDE - A MONTE DI GUINADI - PONTE DI CADUGO 15 0% 0%
MAS-016 MAGRA - AULLA 200 M A MONTE DEL MUNICIPIO 15 0% 0%
Surface water: 40% of the examined areas showed values above the threshold and a remaining 30%, however, positive valuesThey were unpolluted, at least as regards the sought parameters, the remaining 30% of the investigated basins
Vulnerate AreasVulnerate Areas
Vulnerate AreasVulnerate Areas
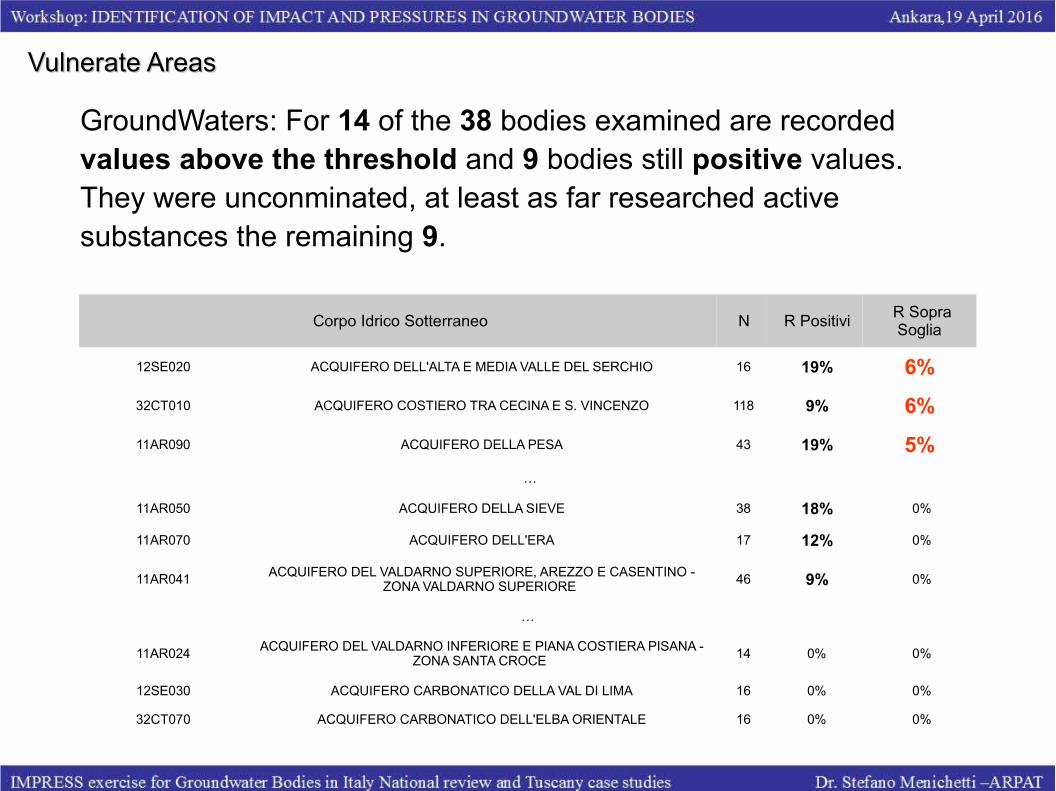
Corpo Idrico Sotterraneo N R PositiviR Sopra Soglia
12SE020 ACQUIFERO DELL'ALTA E MEDIA VALLE DEL SERCHIO 16 19% 6%
32CT010 ACQUIFERO COSTIERO TRA CECINA E S. VINCENZO 118 9% 6%
11AR090 ACQUIFERO DELLA PESA 43 19% 5%
…
11AR050 ACQUIFERO DELLA SIEVE 38 18% 0%
11AR070 ACQUIFERO DELL'ERA 17 12% 0%
11AR041 ACQUIFERO DEL VALDARNO SUPERIORE, AREZZO E CASENTINO - ZONA VALDARNO SUPERIORE 46 9% 0%
…
11AR024 ACQUIFERO DEL VALDARNO INFERIORE E PIANA COSTIERA PISANA - ZONA SANTA CROCE 14 0% 0%
12SE030 ACQUIFERO CARBONATICO DELLA VAL DI LIMA 16 0% 0%
32CT070 ACQUIFERO CARBONATICO DELL'ELBA ORIENTALE 16 0% 0%
GroundWaters: For 14 of the 38 bodies examined are recorded values above the threshold and 9 bodies still positive values.They were unconminated, at least as far researched active substances the remaining 9.

PressuresPressuresThe consumption data of pesticides represent more effective pressure indicator Estimate of consumption can be derived from sales data of pesticides measured at regional level and provinciale. Currently there are two sources for this information:● Statistical Institution ISTAT provides annual data taken from declarations of producer of
plant protection products. Data at regional provincial scale area very accurate , but little detailed, because it does not allows to go back to the quantities of individual active substances.
● Agriculture Informative System SIAN provides annual data taken from declarations of retailers of plant protection products, as collected by regional authorities. Data at regional and provincial scale are very detailed, because it allows you to go back to the quantities of individual active substances, but inaccurate because not representative for quantity.
Comparison of Annual Quantity Sold ton/y between ISTAT and SIAN information sources

PressuresPressures
The amount of pesticides used in a certain territory is the pressure indicator for excellence but not all pesticides exert a pressure on the water resource in equal measure.The different potential for contamination of the active substances in respect of the water which is related to the chemical-physical characteristics, partitive and stability in respect of the biotic and abiotic degradation is evaluated through various indices:
Priority Intrinsic Index (IPI): takes into account:mode of use of the product (on the ground or on plant parts), the chemical and physical characteristics of the substance as partitive properties and persistence.IPI can take on values between 0.4 and 6.
Classes (CIPI) of increasing contamination potential-CIPI 1 (IPI between 0.4 and 1.5) Minimum-CIPI 2 (IPI between 1.5 and 2.6) poor-CIPI 3 (IPI between 2.6 and 3.7) moderate-CIPI 4 (IPI 3,7 to 4,8) relevant-CIPI 5 (IPI between 4.8 and 6.0) high
Index Risk of Contamination of water monitoring data (IRCA) is derived from the processing of a large number of data collected over several years of monitoring activities carried out in Italy and takes account of recurrence over time, the numerosity, and geographical distribution. It can take on values between - 5 and + 5.
Classes (CIRCA) of increasing contamination potential
CIRCA1 - non-contaminating (IRCA between -5 and -2.5)CIRCA2 - not likely contaminant (IRCA between - 2.5 and - 1)CIRCA3 - insufficient evidence (IRCA between - 1 and + 1)CIRCA4 - probable contaminant (IRCA between + 1 and + 2.5)CIRCA5 - contaminant (IRCA between +2.5 and + 5)ABOUT 0 - unclassifiable (lack of monitoring data)
PressioniPressioni
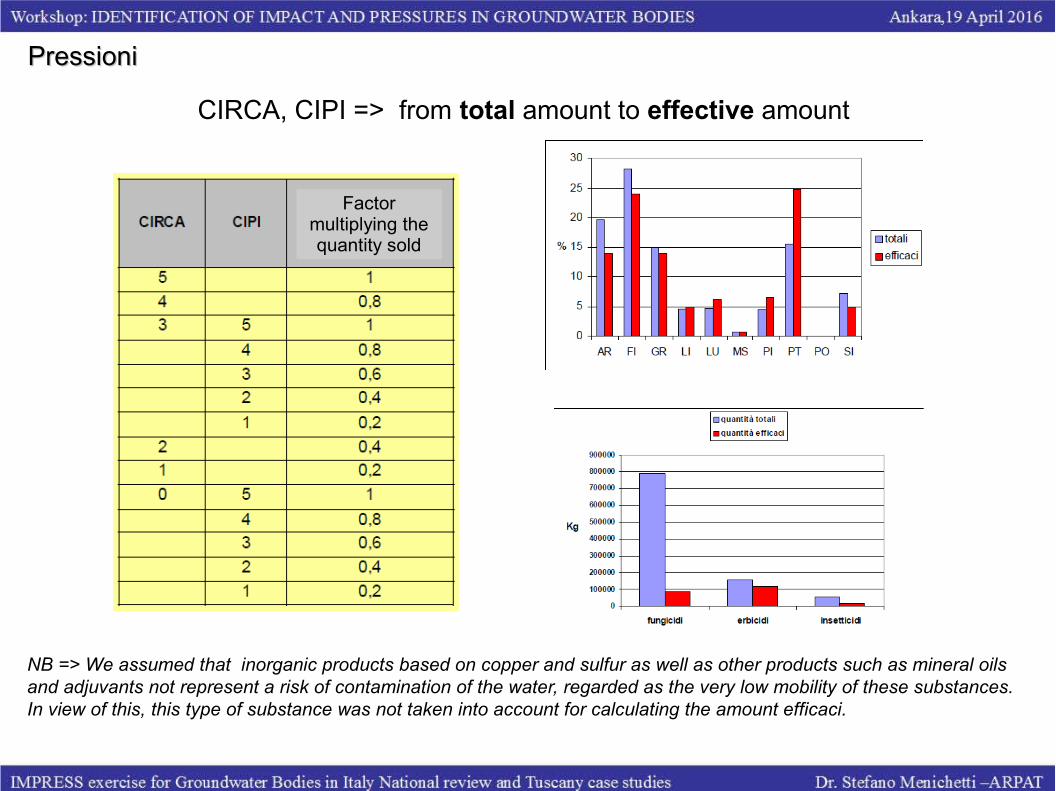
CIRCA, CIPI => from total amount to effective amount
NB => We assumed that inorganic products based on copper and sulfur as well as other products such as mineral oils and adjuvants not represent a risk of contamination of the water, regarded as the very low mobility of these substances. In view of this, this type of substance was not taken into account for calculating the amount efficaci.
Factor multiplying the quantity sold

PressuresPressures
Effective loads were then divided both on the provincial territorial basis, or on the basis of different types of cultures derived from the declarations for the Tuscany Regional Agency for Agricultural Payments (ARTEA).They were made of rough estimates of the percentage distribution in terms of insecticides, fungicides and herbicides used in accordance with the common agricultural practice for the different types of crops.
Carta d’uso del suolo CORINE LAND COVER
Banca dati ARTEA dichiarazioni colturali
Dati di vendita elaborati in quantità efficaci
Associazione tipo di coltura - trattamento di difesa
EFFECTIVE LOAD MAP (kg/ha)
● CLC Land use map
● ARTEA cultivation declarations
● ISTAT SIAN Sales data as effective amounts
● Association by Crop of treatment amount
cerealsindustrialvineyardolive treefruithorticultureNurserysum

PressuresPressures
EFFECTIVE LOAD MAP (kg/ha)

Impact - Pressure relationshipImpact - Pressure relationshipValues like an impact indicator collected on large
area often shows the presence of multiple statistical
populations.
●These can be represent processes and / or distinct
environmental contexts.
●The probability scale cumulative frequency
diagrams, as denonstrated in mining prospection
(Sinclair, 1976) help us to recognize such
discontinuities.
● If it is recognizable, also, a possible roughly
correlation between impact and pressure indicators,
then we can obtain unknown pressure thresholdsas
regression from well defined impact thresholds

Impact - Pressure relationshipImpact - Pressure relationship
0%
10%
20%
30%
40%
50%
60%
70%
80%
90%
100%
0.01 0.10
Terbutilazina - ug/L
Fre
qu
enza
Cu
mu
lata
0.00
0.05
0.10
0.15
0.20
0.25
0.30
0.35
0.40
0.45
0.50
0.01 0.10
Terbutilazina - [ug/L]
Ca
rico
Eff
ica
ce F
ito
ps
anit
ari
- [
Kg
/ha]
0%
10%
20%
30%
40%
50%
60%
70%
80%
90%
100%
0% 10% 20% 30% 40% 50% 60% 70% 80% 90% 100%
Rpos %
0.00
0.05
0.10
0.15
0.20
0.25
0.30
0.35
0.40
0.45
0.50
0.00 0.10 0.20 0.30 0.40 0.50 0.60 0.70 0.80 0.90 1.00
Rpos %
Ca
rico
Eff
ica
ce T
ota
le K
g/h
a
Surface waters: relations for 64 basins and sub-basins underlying the monitoring stations
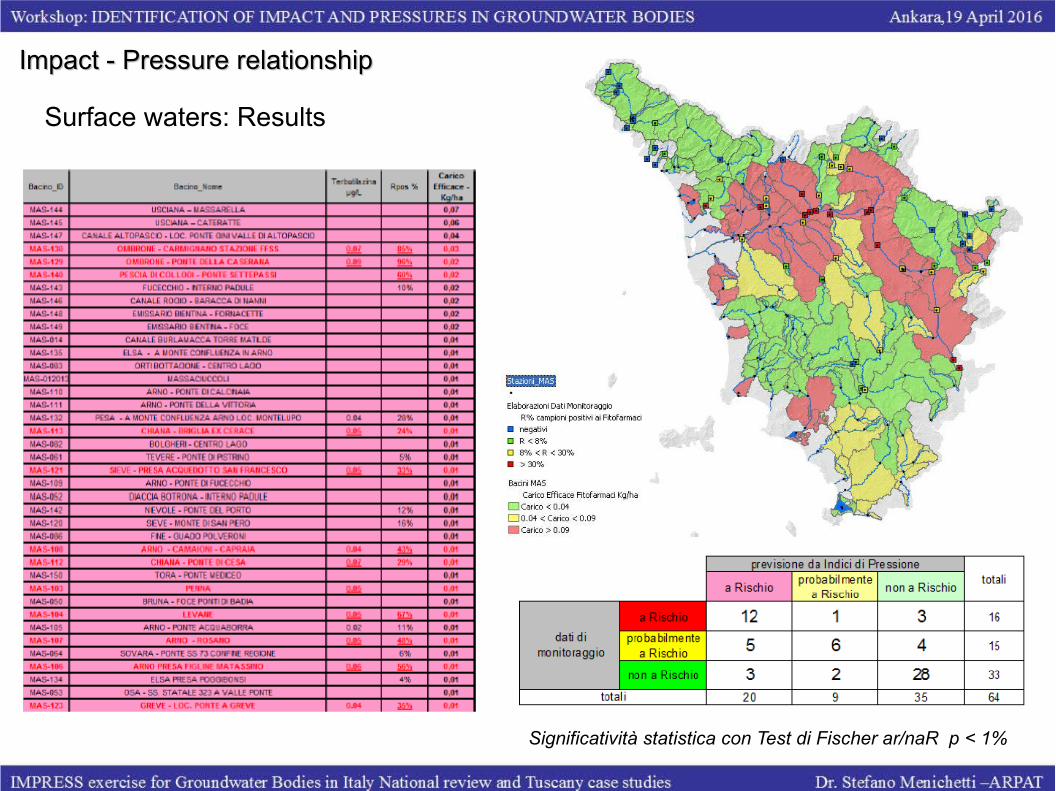
Impact - Pressure relationshipImpact - Pressure relationship
Surface waters: Results
Significatività statistica con Test di Fischer ar/naR p < 1%

Groundwaters: relations for 32 aquifers
0%
10%
20%
30%
40%
50%
60%
70%
80%
90%
100%
0% 2% 4% 6% 8% 10% 12% 14% 16% 18% 20%
% campioni positivi Fitofarmaci
fre
qu
en
ze c
um
ula
te %
0.00
0.10
0.20
0.30
0.40
0.50
0.60
0% 2% 4% 6% 8% 10% 12% 14% 16% 18% 20%
Rpos [%]
Ca
rico
Eff
ica
ce T
ota
le -
[K
g/h
a]
Impact - Pressure relationshipImpact - Pressure relationship

Grounwaters: Result
Statistical significance by Fisher Test ar/naR p = 0.16
Impact - Pressure relationshipImpact - Pressure relationship

Pesticide Pollution RiskPesticide Pollution Risk
In analogy with the IPNOA method for the definition of a pollution hazard Index by
Nitrates of Agricultural Origin (Padovani and Trevisan, 2002) and the subsequent
risk for contamination of groundwater resources obtained from the intersection of
the degree of danger with IPNOA with degrees of intrinsic vulnerability
hydrogeological (Civita, 1994), the Pollution Risk Map to Pesticides has been
defined through the following steps:
definition of a hazard from pesticides given by the product of a danger factor for a FP of FC control
factor; the danger factor is derived from the distribution of total effective loads articulated in five hazard
classes calculated on a percentile basis (20, 40, 60, 80%), and the control factor obtained from the in
Organic Substance Content derived from the Soil Map of Tuscany made by the regional Geological Survey
definition of the vulnerability of surface and groundwater bodies, noting that the most influential
parameters hydrogeological vulnerability, represented by the permeability Lithological and the Slope, act in a
complementary way to the definition of a vulnerability of surface water;
calculation of the risk of pesticide pollution to both surface and underground segments derived from the
product of 6 Index hazard classes of pesticides (IPF) for the 6 vulnerability classes.

Pesticide Pollution RiskPesticide Pollution Risk
Hazard Class and Factors Control
*

Hazard Pesticide
Map
Pesticide Pollution RiskPesticide Pollution Risk

Pesticide Pollution RiskPesticide Pollution Risk
Hydrogeology Groundwater Vulnerability
Surface Water Vulnerability (derived)
Vulnerability Maps

Pesticide Pollution RiskPesticide Pollution Risk
Hazard * Vulnerability
Risk Level Matrix

Pesticide Pollution RIskPesticide Pollution RIsk
Surface Water Pesticide Pollution Risk
Pesticide Pollution Risk Maps
Gruoundwater Pesticide Pollution Risk

Pesticide Vulnerable Areas match, at last:Pesticide Vulnerable Areas match, at last:
● areas that discharge into vulnerate water bodies ie the basins and sub-basins of reference of surface water bodies and the outcrop areas of groundwater bodies that cross, based on the available monitoring data, the threshold at Risk;
● areas which discharge into bodies of water that could be vulnerate ie the basins and sub-basins of surface water bodies and the outcrop areas of groundwater bodies that cross on the basis of pressure data available, at the risk threshold;
● the areas, among the above troubleshooting, which are actually at risk of pollution as a result of the hazard indices (pressure and attenuation) and the specific vulnerability of surface and underground waters compartments.

Pesticide Vulnerable AreasPesticide Vulnerable Areas
AAreas that disharge in
vulnerate water body on the baisi of monitoring data
Impact Indicators Thresholds B
Areas that disharge in water body that can be vulnerate on the baisi of pressure data
Pressure Indicators Thresholds
CAreas that actually are at pollution risk on the basis of
harzard indexes, attenuation capacity and specifici vulnerability
Risk Maps
PESTICIDE VULNERABLE AREAS

Pesticide Vulnerable AreasPesticide Vulnerable Areas
At Risk Surface Water Bodies (subbasin)
and Pesticide Vulnerable Areas
At Risk Groundwtaer Bodies
and Pesticide Vulnerable Areas

Pesticide Vulnerable AreasPesticide Vulnerable Areas
Proposal for Pesticide Vulnerable Areas
Example: SW Subbasin of Ombrone allla Caserana (PT)
Example: Grounwater Body Cecina - San Vincenzo (LI)

Conclusions - the Tuscan experience in pesticide vulnerable zonesConclusions - the Tuscan experience in pesticide vulnerable zones
=> The proposed Vulnerable Areas of Pesticides was based on an approach taken from areas vulnerable to nitrates from agricultural sources, either for a more explicit definition either for use of spatial analysis methods (risk maps) consolidated for NVZ ([1994] Padovani & Trevisan [2002], Civita)
Researched and defined indicators specific of impact and pressure, albeit complex, related to:
percentage of samples with positivity, where in the absence of defined impact thresholds was employed the method of frequency separation;
pesticide sales data on a provincial basis distinct for different phytoiatric divided for crop categories as derived from cultivation maps obtained by declaration made at the Agency for funding in agriculture.
The results, in terms of significance of roughly relationship impact-pressure, were judged adequate approximation to the limits of a study of regional scale.
The less significant impact-pressure relationship for groundwater confirms the important role of the specific vulnerability of soils in the pressure control.
Within generic Pesticide Vulnerable Areas corresponding recharge areas of vulnerate or potentially vulnerable water bodies, is possible, through spatial analysis, to indicate the areas most at risk, both in relation to soil characteristics, both in relation to crop types used.These are areas where limiting interventions of pesticides under the law will certainly take more effective

Thanks for your attention

Bibliography
● Civita M. (1994) – Le Carte della vulnerabilità degli acquiferi all’inquinamento: teoria e pratica. Pitagora Editrice, Bologna, pp. 325
● Padovani L. e Trevisan M. (2002): I nitrati di origine agricola nelle acque sotterranee: Un indice parametrico per l’individuazione di aree vulnerabili. Consiglio nazionale delle Ricerche, Pubblicazione n° 2478.
● Sinclair (1976): Application of probability graphs in mineral exploration. Spec. Vol. 4 Association of Exploration geochemist, 95 pp