EU-28 Sugar Annual Report - USDA GAIN Publications/Sugar...Executive Summary: The EU-28 sugar...
16
THIS REPORT CONTAINS ASSESSMENTS OF COMMODITY AND TRADE ISSUES MADE BY USDA STAFF AND NOT NECESSARILY STATEMENTS OF OFFICIAL U.S. GOVERNMENT POLICY Date: GAIN Report Number: Approved By: Prepared By: Report Highlights: The EU-28 sugar production for food purposes for MY 2016/17 is forecasted at 16.5 million MT in raw sugar equivalent (RSE), with another 0.9 million MT produced for industrial purposes. The estimate for the MY 2015/16 production under the EU sugar regime is decreased to 14.0 million MT RSE, as EU sugar processors carried over 2.89 million MT RSE of unsold out-of-quota sugar from MY 2014/15. The surplus for industrial uses for MY 2015/16 was a 2.2 million MT. EU-28 quota production for MY 2014/15 was 18.45 million MT in RSE, including the 2.89 million MT carry-over and another 2.7 million MT for industrial purposes. EU sugar consumption for food continues its increase reaching 18.8 million MT RSE, fueled by increased immigration. Sugar imports for MY 2015/2016 and MY 2016/17 may increase to 3.5 million MT because Brazil has started to ship again. Sugar exports remain Yvan Polet Mary Ellen Smith Report Sugar Annual EU-28 E16020 4/25/2016 Required Report - public distribution
Transcript of EU-28 Sugar Annual Report - USDA GAIN Publications/Sugar...Executive Summary: The EU-28 sugar...

THIS REPORT CONTAINS ASSESSMENTS OF COMMODITY AND TRADE ISSUES MADE BY
USDA STAFF AND NOT NECESSARILY STATEMENTS OF OFFICIAL U.S. GOVERNMENT
POLICY
Date:
GAIN Report Number:
Approved By:
Prepared By:
Report Highlights:
The EU-28 sugar production for food purposes for MY 2016/17 is forecasted at 16.5 million MT in raw
sugar equivalent (RSE), with another 0.9 million MT produced for industrial purposes. The estimate
for the MY 2015/16 production under the EU sugar regime is decreased to 14.0 million MT RSE, as EU
sugar processors carried over 2.89 million MT RSE of unsold out-of-quota sugar from MY 2014/15.
The surplus for industrial uses for MY 2015/16 was a 2.2 million MT. EU-28 quota production for MY
2014/15 was 18.45 million MT in RSE, including the 2.89 million MT carry-over and another 2.7
million MT for industrial purposes. EU sugar consumption for food continues its increase reaching
18.8 million MT RSE, fueled by increased immigration. Sugar imports for MY 2015/2016 and MY
2016/17 may increase to 3.5 million MT because Brazil has started to ship again. Sugar exports remain
Yvan Polet
Mary Ellen Smith
Report
Sugar Annual
EU-28
E16020
4/25/2016
Required Report - public distribution

limited to 1.5 million MT by the EU’s WTO sugar export ceiling. EU sugar stocks for MY 2014/15
jumped to 4.1 million MT, decreasing again to 1.3 million MT in MY 2015/16 and 1.0 million MT in
MY 2016/17.

Executive Summary:
The EU-28 sugar production forecast for food purposes for MY 2016/17, the last production year under
the EU sugar quota system, is 16.5 million MT in raw sugar equivalent (RSE). Another 0.9 million MT
is forecast to be produced for industrial purposes, including for bioethanol. The estimate for the MY
2015/16 production of sugar for food under the EU sugar regime is decreased to 14.0 million MT RSE,
a decrease of 2.1 million MT compared to the 2015 semi-annual report, because unfavorable market
conditions during MY 2014/15 for selling sugar for non-food uses. As a result EU sugar processors
carried over 2.89 million MT RSE of unsold out-of-quota sugar towards the 2015/16 quota production
year. Following the recommendation of sugar processors, which were burdened with the large unsold
sugar surpluses form the previous year, beet farmers reduced planting area in 2015 by over 2.1 million
hectares. Because of the EU production restrictions, there was a 2.2 million MT surplus for industrial
uses for MY 2015/16, despite lower sugar beet yields resulting from draught in Eastern Europe. EU-28
production of sugar for MY 2014/15 under the EU’s sugar quota system is increased from the previous
USDA forecast by 1.7 million MT to 18.45 million MT in RSE, including the 2.89 million MT carry-
over. Another 2.7 million MT was produced for industrial purposes.
EU sugar consumption for food is expected to continue its steady increase through MY 2015/16
reaching 18.8 million MT RSE. This is fueled by increased immigration which is boosting the EU’s
population. However, forecasts for MY 2016/17 see EU sugar consumption stabilize in reaction to anti-
sugar health marketing campaigns and the imposition of consumption taxes on high sugar containing
products like soft drinks in several MS, including Belgium and the United Kingdom.
EU sugar imports have been slowing in recent years. Especially refiners were reluctant to pay the
€98/MT within-quota import duty for cane sugar coming from Brazil and other destinations into the
EU’s CXL [1] quota. Despite new imports from FTA partners including Peru, Colombia, Panama and
Central America, imports for MY 2014/15 ended at 2.9 million MT, some 350,000 MT below the
previous year’s import number as Brazil’s 334,000 MT CXL quota went unused. Sugar import
estimates for MY 2015/2016 are increased to 3.5 million MT because Brazil has started to ship again
and is likely to fully use its CXL quota this year. Preliminary forecasts for MY 2016/17 sugar imports
are maintained at 3.5 million MT.
Sugar exports remain stable as they are limited to 1.5 million MT by the EU’s WTO sugar export
ceiling.
EU end-of-year sugar stocks for MY 2014/15 jumped to 4.1 million MT as a result of the record 2014
sugar beet crop, but are expected to decrease again to 1.3 million MT following the drop in production.
Stocks are forecast to decrease further to 1.0 million MT as EU sugar processors are wary of
unnecessary stock levels.
It is expected that the end of the 50-year old sugar regime will result in a further consolidation in EU
sugar production favoring most efficient and competitive sugar beet production areas in France,
Belgium, the Netherlands and Luxemburg (Benelux) and Germany. This consolidation could be spread
over two waves starting at the end of the quota system in October 2017 and further intensified in 2020
when coupled support for sugar beet production expires. Sugar beet processors in France, Germany and

the Benelux have expressed their intentions to expand production without significant investments by
optimizing their production capacity. Post sources indicate that total EU production could expand by 5
percent, while processors in France have expressed intentions to increase production by up to 20 percent
or more. [1]
The CXL quota result from compensation agreements for the 1995 EU enlargement.
Commodities:
Production:
Explanatory Notes to the reader:
• This report covers EU-28 sugar markets.
• All sugar is in raw sugar equivalent (RSE) unless otherwise noted.
• The Production, Supply & Demand tables (PS&D) in this report only pertain to sugar as defined by
Harmonize System (HS) code 1701, therefore, it excludes raw beet sugar production destined for
fermentation or other industrial purposes. Because EU sugar produced under the quota system is
preserved for food use only, so-called out-of-quota sugar is used only for industrial (non-food) use.
• The conversion factors and marketing years used in this report:
MY = marketing year; for sugar October/September.
Raw cane sugar = 1.07 X Refined cane sugar
Raw beet sugar = 1.087 X White (refined) beet sugar
• Sugar imports for EU inward processing purposes are excluded from this report PS&D tables as these
sugar imports are entirely re-exported as processed products. Inward processing is the EU customs
program under which the import duties for dairy, sugar, and starch containing commodities for
processing and subsequent re-export are waived.
• EUR/USD exchange rate
Source: Exchangerates. org.uk
Acknowledgement.
Sugar, Centrifugal

The data in this report is based on EU sugar production information collected by FAS Agricultural
Specialists in the MS. These include:
Xavier Audran from FAS/Paris covering France,
Ornella Bettini from FAS/Rome covering Italy,
Monica Dobrescu from FAS/Bucharest covering Romania,
Dimosthenis Faniadis from FAS/Rome covering Greece,
Bob Flach from FAS/The Hague covering The Netherlands, Denmark, Finland and Sweden,
Golya Gellert from FAS/Budapest covering Hungary,
Marta Guerrero from FAS/Madrid covering Spain,
Steve Knight from FAS/London covering the United Kingdom,
Mira Kobuszynska from FAS/Warsaw covering Poland and Lithuania,
Roswitha Krautgartner from FAS/Vienna covering Austria,
Jana Mikulasova from FAS/Prague covering the Czech and Slovak Republics,
Andreja Misir from FAS/Zagreb covering Croatia,
Yvan Polet from FAS/Brussels covering Belgium and EU issues,
Leif Rehder and Sabine Lieberz from FAS/Berlin covering Germany.
Additional Upfront Notes
Note 1: The EU Sugar Production Quota Regime
The EU sugar market is heavily regulated. The 2007 Sugar Reform [1] limited total EU production
quotas for food purposes to 13.5 million MT of white sugar equivalent which amounts to 14.7 million
MT in raw sugar equivalent (RSE). This EU sugar production quota regime is set to expire at the end of
marketing year (MY) 2016/17. Sugar production quotas are set by Member States (MS) and include a
small quota for cane sugar production in overseas territories (DOM) for France and Portugal.
Additional production is considered “out-of-quota.” As a result, EU sugar processors in MS have four
options to market sugar produced out-of-quota:
Exports: pending availability of EU export licenses limited to the EU’s World Trade Organization
(WTO) sugar export ceiling of 1.35 million MT (of refined sugar).
Disposal on the EU market for industrial purposes: for example, for fermentation by the biochemical
industry or for bio-ethanol production.
Release on the EU domestic market: This option carries a levy of €500 per MT unless the EU decides to
waive all or part of the levy through exceptional sugar market management measures. Under the new
Common Agricultural Policy (CAP) post 2013, this system largely remains the same under the system
of “temporary market management mechanism.”
Carry-over into the following production year: counts towards the quota production for that year.
Considering that this report’s out year is the last year of the EU quota system, this carry-over system
will cease to apply.
Isoglucose is not a competitor for sugar for food use. Isoglucose such as High Fructose Corn Syrup
(HFCS) is governed by its own production quotas, which are tied to sugar quotas at 5 percent.

EU farmers are also protected against competition from non-preferential raw cane sugar by high tariffs
and import quotas. A rigid import license system governs preferential duty-free imports from Least
Developed Countries (LDCs) under the Everything-But-Arms (EBA) Agreement limiting imports to 3.5
million MT white sugar equivalent. In recent years, additional country- specific quotas have been
agreed as part of EU free trade agreements (FTAs) with Peru, Colombia, Panama and Central America
totaling some 260,000 MT. Ukraine has also been allocated a 20,000 MT quota.
Note 2: Common Agricultural Policy Reform Post 2013
The new CAP started on January 1, 2014, with a one-year extension under the old budgetary rules and
became fully implemented as of 2015. As part of the CAP package, 10 MS out of the 19 sugar
producing MS decided to retain some level of coupled payments for the production of sugar. These
include Finland, Greece, Italy, Spain, Croatia, Czech Republic, Slovak Republic, Hungary, Poland and
Romania. The latter six belong to the so-called new MS, which acceded to the EU in 2004 or later and
did not have the farmer’s compensation for the 2007 Sugar reform included in their Single Area
Payment Schemes (SAPS). An overview of the new CAP [2] is available online.
For the EU sugar market, the CAP includes the expiration of the EU sugar production quota system
after a two-year extension period through MY 2016/17 to allow farmers and processors to adapt to the
free market. The new Common Market Organization (CMO) for sugar includes the following measures:
• Sugar quotas disappear after a two-year extension through MY2016/17. No changes are made
to existing quota levels; no new quotas are given to MS.
• Delivery contracts between beet producers and processors become mandatory, but are already
general common practice. Beet producers may organize themselves in Producer Organizations (PO) and
bargain collectively.
• A system of Private Storage Aid will be set up for sugar after sugar quotas end.
• The system of “exceptional measures” from the expiring Single CMO is being replaced by a
system of “Temporary measures” for the remaining three quota years beginning January 1, 2014.
Note 3: Croatia Accession to the EU
Upon Croatia’s accession to the EU on July 1, 2013, the European Commission (EC) allocated 192,877
MT of refined sugar production quota to Croatia, thus bringing the total EU-28 sugar production quota
for refined sugar to 13.5 million MT. Furthermore, in compensation for the loss of its 180,000 MT
duty-free EU sugar import quota the EC agreed to issue a new sugar quota of 40,000 MT to Croatia for
three years which expired in MY 2014/15. [1]
http://ec.europa.eu/agriculture/sugar/legislation/index_en.htm [2]
http://ec.europa.eu/agriculture/policy-perspectives/policy-briefs/05_en.pdf
EU Food Sugar Production
PSD - Sugar, Centrifugal MY2014/15 MY2015/16 MY2016/17
Market Begin Year October 2014 October 2015 October 2016
European Union USDA New USDA New USDA New
Official post Official post Official post
Beginning Stocks (1000
MT) 3,066 3,066 2,106 4,068 0 1,268
Beet Sugar Production
(1000 MT) 16,461 18,179 15,820 13,720 0 16,220
Cane Sugar Production
(1000 MT) 289 270 280 280 0 280
Total Sugar Production
(1000 MT) 16,750 18,449 16,100 14,000 0 16,500
Raw Imports (1000 MT) 1,900 2,152 2,100 2,750 0 2,750
Refined Imp.(Raw Val)
(1000 MT) 700 764 700 750 0 750
Total Imports (1000 MT) 2,600 2,916 2,800 3,500 0 3,500
Total Supply (1000 MT) 22,416 24,431 21,006 21,568 0 21,268
Raw Exports (1000 MT) 10 4 5 5 0 5
Refined Exp.(Raw Val)
(1000 MT) 1,600 1,659 1,495 1,495 0 1,495
Total Exports (1000 MT) 1,610 1,663 1,500 1,500 0 1,500
Human Dom.
Consumption (1000 MT) 18,700 18,700 18,800 18,800 0 18,800
Total Use (1000 MT) 18,700 18,700 18,800 18,800 0 18,800
Ending Stocks (1000
MT) 2,106 4,068 706 1,268 0 968
Total Distribution (1000
MT) 22,416 24,431 21,006 21,568 0 21,268
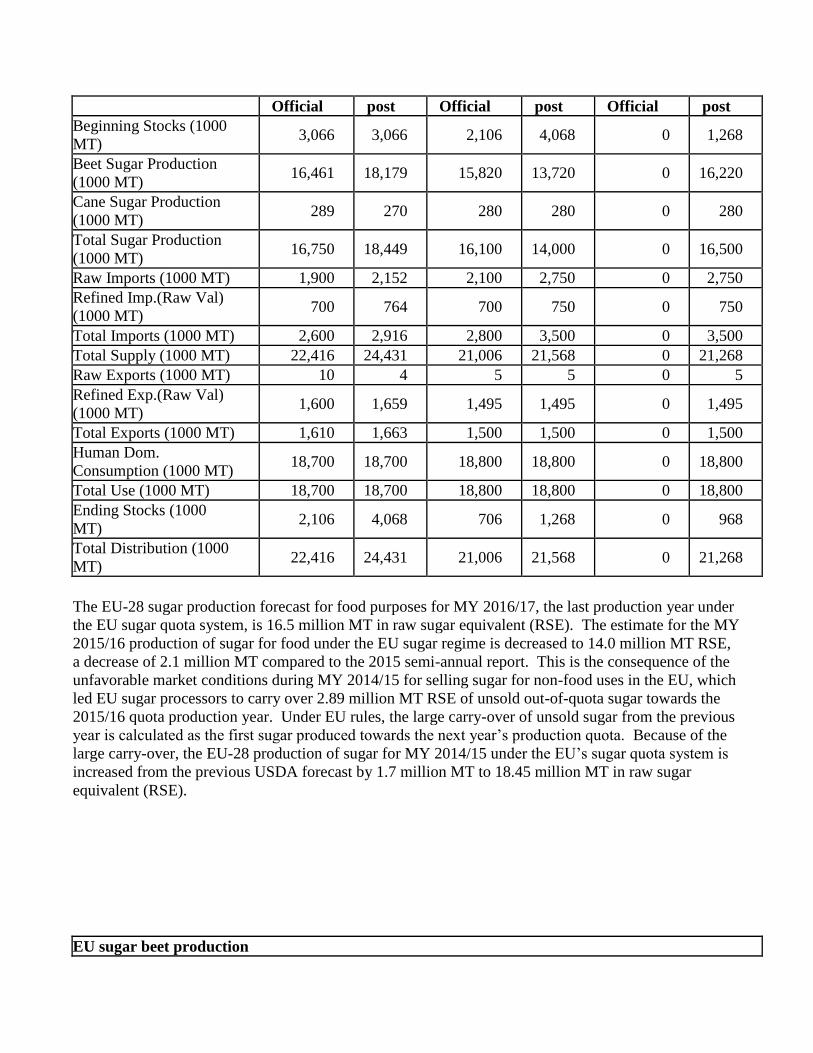
The EU-28 sugar production forecast for food purposes for MY 2016/17, the last production year under
the EU sugar quota system, is 16.5 million MT in raw sugar equivalent (RSE). The estimate for the MY
2015/16 production of sugar for food under the EU sugar regime is decreased to 14.0 million MT RSE,
a decrease of 2.1 million MT compared to the 2015 semi-annual report. This is the consequence of the
unfavorable market conditions during MY 2014/15 for selling sugar for non-food uses in the EU, which
led EU sugar processors to carry over 2.89 million MT RSE of unsold out-of-quota sugar towards the
2015/16 quota production year. Under EU rules, the large carry-over of unsold sugar from the previous
year is calculated as the first sugar produced towards the next year’s production quota. Because of the
large carry-over, the EU-28 production of sugar for MY 2014/15 under the EU’s sugar quota system is
increased from the previous USDA forecast by 1.7 million MT to 18.45 million MT in raw sugar
equivalent (RSE).
EU sugar beet production
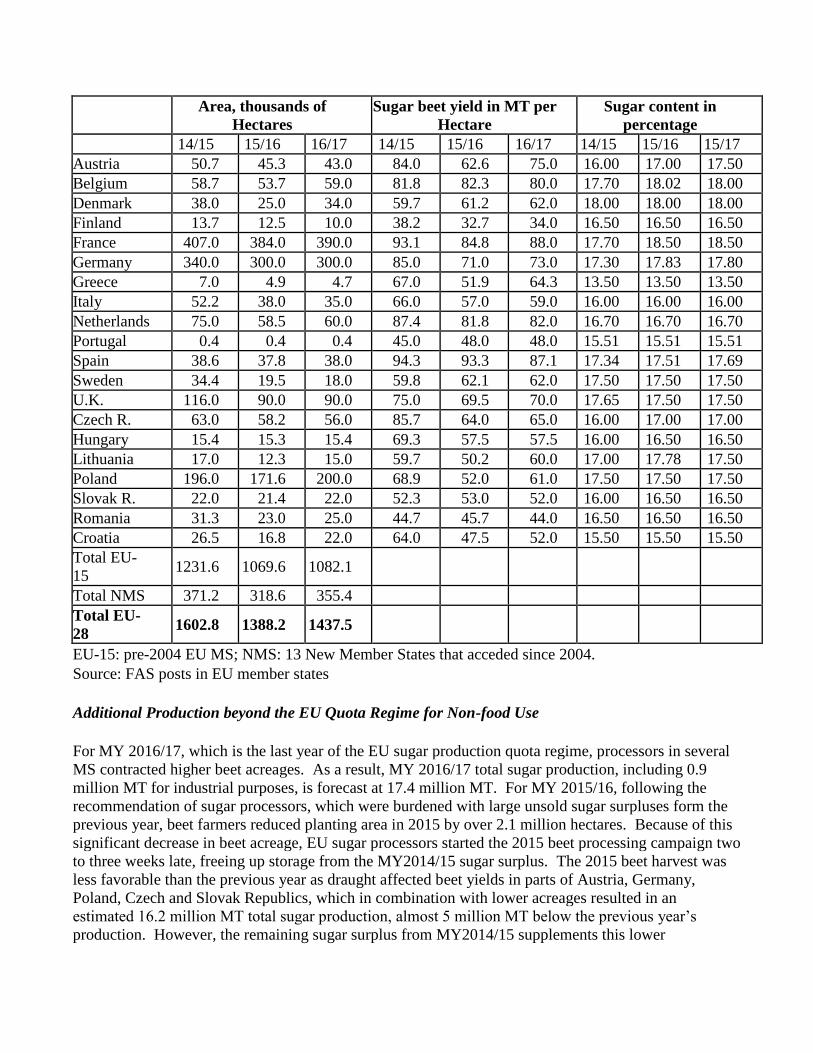
Area, thousands of
Hectares
Sugar beet yield in MT per
Hectare
Sugar content in
percentage
14/15 15/16 16/17 14/15 15/16 16/17 14/15 15/16 15/17
Austria 50.7 45.3 43.0 84.0 62.6 75.0 16.00 17.00 17.50
Belgium 58.7 53.7 59.0 81.8 82.3 80.0 17.70 18.02 18.00
Denmark 38.0 25.0 34.0 59.7 61.2 62.0 18.00 18.00 18.00
Finland 13.7 12.5 10.0 38.2 32.7 34.0 16.50 16.50 16.50
France 407.0 384.0 390.0 93.1 84.8 88.0 17.70 18.50 18.50
Germany 340.0 300.0 300.0 85.0 71.0 73.0 17.30 17.83 17.80
Greece 7.0 4.9 4.7 67.0 51.9 64.3 13.50 13.50 13.50
Italy 52.2 38.0 35.0 66.0 57.0 59.0 16.00 16.00 16.00
Netherlands 75.0 58.5 60.0 87.4 81.8 82.0 16.70 16.70 16.70
Portugal 0.4 0.4 0.4 45.0 48.0 48.0 15.51 15.51 15.51
Spain 38.6 37.8 38.0 94.3 93.3 87.1 17.34 17.51 17.69
Sweden 34.4 19.5 18.0 59.8 62.1 62.0 17.50 17.50 17.50
U.K. 116.0 90.0 90.0 75.0 69.5 70.0 17.65 17.50 17.50
Czech R. 63.0 58.2 56.0 85.7 64.0 65.0 16.00 17.00 17.00
Hungary 15.4 15.3 15.4 69.3 57.5 57.5 16.00 16.50 16.50
Lithuania 17.0 12.3 15.0 59.7 50.2 60.0 17.00 17.78 17.50
Poland 196.0 171.6 200.0 68.9 52.0 61.0 17.50 17.50 17.50
Slovak R. 22.0 21.4 22.0 52.3 53.0 52.0 16.00 16.50 16.50
Romania 31.3 23.0 25.0 44.7 45.7 44.0 16.50 16.50 16.50
Croatia 26.5 16.8 22.0 64.0 47.5 52.0 15.50 15.50 15.50
Total EU-
15 1231.6 1069.6 1082.1
Total NMS 371.2 318.6 355.4
Total EU-
28 1602.8 1388.2 1437.5
EU-15: pre-2004 EU MS; NMS: 13 New Member States that acceded since 2004.
Source: FAS posts in EU member states
Additional Production beyond the EU Quota Regime for Non-food Use
For MY 2016/17, which is the last year of the EU sugar production quota regime, processors in several
MS contracted higher beet acreages. As a result, MY 2016/17 total sugar production, including 0.9
million MT for industrial purposes, is forecast at 17.4 million MT. For MY 2015/16, following the
recommendation of sugar processors, which were burdened with large unsold sugar surpluses form the
previous year, beet farmers reduced planting area in 2015 by over 2.1 million hectares. Because of this
significant decrease in beet acreage, EU sugar processors started the 2015 beet processing campaign two
to three weeks late, freeing up storage from the MY2014/15 sugar surplus. The 2015 beet harvest was
less favorable than the previous year as draught affected beet yields in parts of Austria, Germany,
Poland, Czech and Slovak Republics, which in combination with lower acreages resulted in an
estimated 16.2 million MT total sugar production, almost 5 million MT below the previous year’s
production. However, the remaining sugar surplus from MY2014/15 supplements this lower
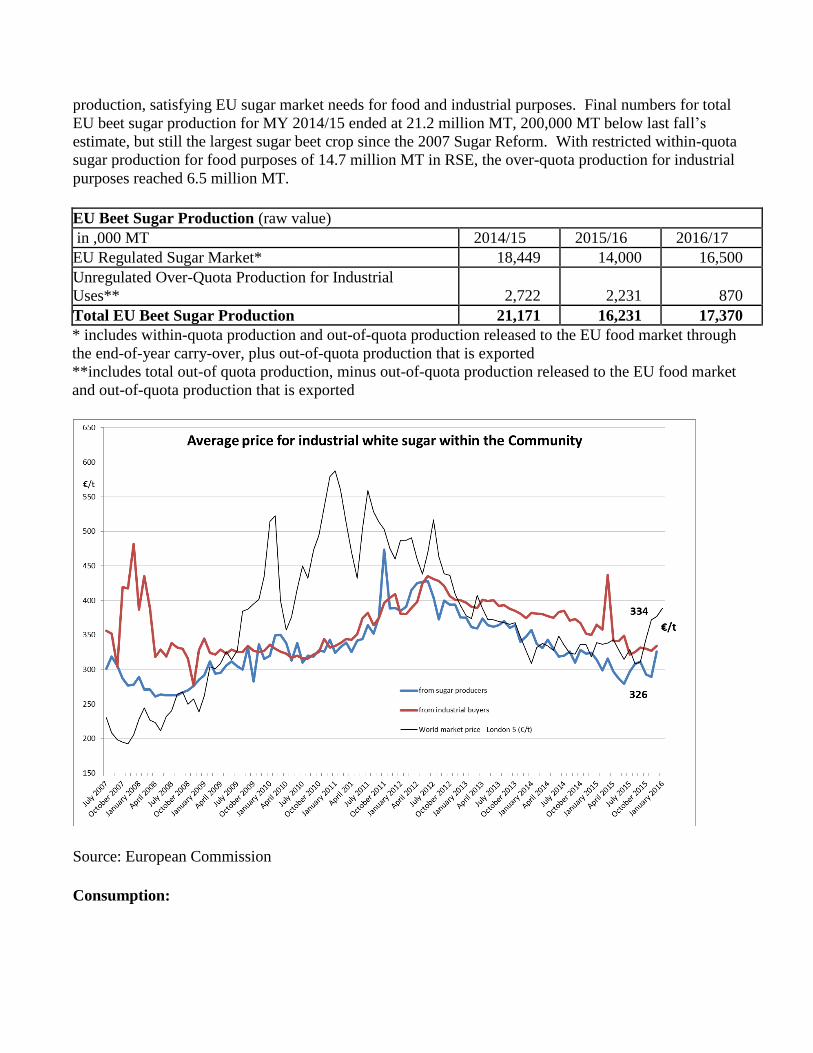
production, satisfying EU sugar market needs for food and industrial purposes. Final numbers for total
EU beet sugar production for MY 2014/15 ended at 21.2 million MT, 200,000 MT below last fall’s
estimate, but still the largest sugar beet crop since the 2007 Sugar Reform. With restricted within-quota
sugar production for food purposes of 14.7 million MT in RSE, the over-quota production for industrial
purposes reached 6.5 million MT.
EU Beet Sugar Production (raw value)
in ,000 MT 2014/15 2015/16 2016/17
EU Regulated Sugar Market* 18,449 14,000 16,500
Unregulated Over-Quota Production for Industrial
Uses** 2,722 2,231 870
Total EU Beet Sugar Production 21,171 16,231 17,370
* includes within-quota production and out-of-quota production released to the EU food market through
the end-of-year carry-over, plus out-of-quota production that is exported
**includes total out-of quota production, minus out-of-quota production released to the EU food market
and out-of-quota production that is exported
Source: European Commission
Consumption:
EU-28 domestic consumption of sugar continues to increase, driven by increased demand in the new
MS and for the growing immigration population. During 2013 and 2014, the EU population grew by a
total three million inhabitants to 508.2 million, with immigrants being some 85 percent of the
newcomers [1] . The record MY 2014/15 sugar production provided ample supplies, while EU food
processors used less imported sugar due to lower EU sugar prices in MY 2014/15. This was particularly
true for food exports, which often use imported sugar under the EU inward processing program, which
waives import duties. EU sugar consumption for food is expected to continue its steady increase
through MY 2015/16. However, market experts’ forecasts for MY 2016/17 see EU sugar consumption
stabilize in reaction to EU-wide anti-sugar health claims and the imposition of taxes on high sugar
containing products such as soft drinks in several MS like Belgium and the United Kingdom.
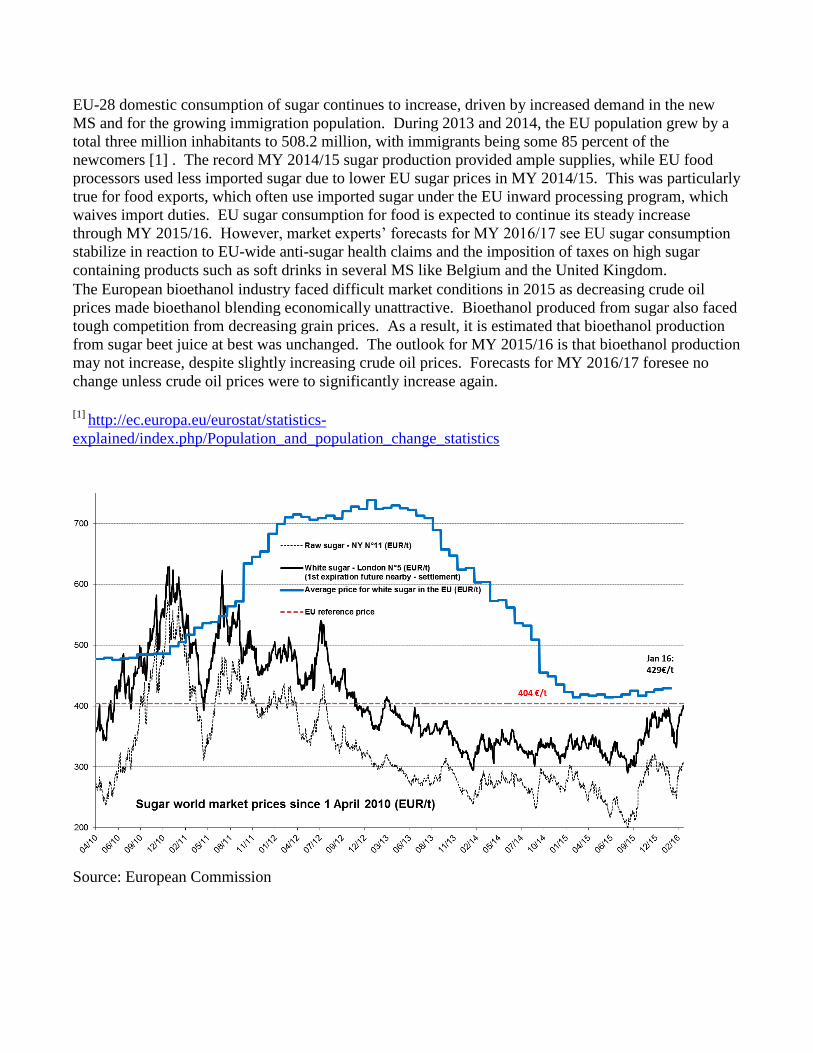
The European bioethanol industry faced difficult market conditions in 2015 as decreasing crude oil
prices made bioethanol blending economically unattractive. Bioethanol produced from sugar also faced
tough competition from decreasing grain prices. As a result, it is estimated that bioethanol production
from sugar beet juice at best was unchanged. The outlook for MY 2015/16 is that bioethanol production
may not increase, despite slightly increasing crude oil prices. Forecasts for MY 2016/17 foresee no
change unless crude oil prices were to significantly increase again.
[1]
http://ec.europa.eu/eurostat/statistics-
explained/index.php/Population_and_population_change_statistics
Source: European Commission

Trade:
Imports
EU sugar imports have been slowing in recent years. Especially refiners were reluctant to pay the
€98/MT within-quota import duty for cane sugar coming from Brazil and other destinations into the
EU’s CXL [1] quota. Despite new imports from FTA countries including Peru, Colombia [2] , Panama
and Central America [3] , imports for MY 2014/15 ended at 2.9 million MT, some 350,000 MT below
the previous year’s import number as Brazil’s 334,000 MT CXL quota went unused. Imports
accelerated during the summer months of 2015 in anticipation of the new beet processing campaign.
Sugar import estimates for MY 2015/2016 are increased to 3.5 million MT because Brazil has started to
ship again and is likely to fully use its CXL quota this year. Preliminary forecasts for MY 2016/17
sugar imports are maintained at 3.5 million MT. [1]
The CXL quota result from compensation agreements for the 1995 EU enlargement. [2]
http://ec.europa.eu/trade/policy/countries-and-regions/regions/andean-community/ [3]
http://ec.europa.eu/trade/policy/countries-and-regions/regions/central-america/


Source: European Commission
Exports
For MY 2015/16 and MY 2016/17, exports are estimated to decrease to 1.5 million MT, in line with the
EU’s WTO export ceiling for sugar, mostly to traditional destinations in the Middle-East and Northern
Africa.
Stocks:
EU sugar ending stock numbers for MY 2014/15 are doubled to 4.0 million MT as a result of the large
carry-over of unsold out-of-quota sugar. Ending stocks for MY 2015/16 are also revised up and MY
2016/17 ending stocks at the end of the EU sugar quota regime are forecast at about 1.0 million MT. No
further carry-over of unsold stocks is foreseen with the end of the EU sugar quota system.
Policy:
The Common Agricultural Policy after 2013 and the End of the EU Sugar Quota Regime
The EU sugar production regime was extended for two years through MY 2016/17 to allow producers
and processors to prepare for the liberalization of the EU sugar market.

As part of regional policies under the CAP’s Pillar 1 and Pillar 2, MS can decide on maintaining some
level of direct payments [1] coupled to specific production, as well as shift some funding between the
two pillars. Through these MS specific programs, 10 MS out of the 19 sugar producing MS decided to
maintain coupled payments for sugar production (See slide 20 of the presentation [2] on MS
implementation of the new CAP). From the old EU-15 MS, Finland, Greece, Italy and Spain
maintained coupled payments for sugar production in order to secure national sugar production after the
end of the quota system. These MS feared that they could not compete with sugar processors in
Northwestern Europe. Six of the new MS that acceded the EU after 2004, Poland, Czech Republic,
Slovak Republic, Hungary, Romania and Croatia, decided to maintain coupled payments, albeit at a
lower level. This compensation was added to their Single Area Payment Scheme (SAPS) for decreasing
sugar production as a result of the 2007 Sugar Reform. The level of coupled payments for sugar
production varies widely between the 10 MS with payments amounting from around €50/ ha in Italy to
over €500/ha in Spain.
EU Sugar Industry Preparing for End of Production Quotas in 2017
In some MS, sugar production is already declining, which seems the case in Finland, Sweden, Greece
and Italy, where sugar production stayed below their production quota in MY 2015/2016. Post sources
in Italy and Greece reported that processors in Greece and Italy are virtually bankrupt and it can be
doubted if these processors can be viable in the post-quota era. For other MS, like Croatia, Hungary,
Romania, Slovak Republic and Spain, the viability of sugar production is being called into question if
the coupled support expires at the end of the current CAP in 2019/2020.
The most competitive processors want to expand production for exports as EU sugar exports
presumably will not be limited by its 1.35 million MT WTO ceiling. French sugar processors intend to
expand production by 20 percent or more from 2017 onwards. Other processors in Western European
MS also declared their intentions to produce more sugar at marginal cost without significant
investments by optimizing production capacity.
There are several reasons to believe that the EU sugar processing industry is set for another
consolidation. Uncompetitive processing plants could be closed at the benefit of plants in the most
productive areas. That would lower the overall cost of sugar production in the EU. The sugar quota
system also included production limitations on isoglucose. Beet sugar processors have been open about
their goal of fending off isoglucose competition in the EU sweetener market by keeping sugar prices
low enough to prevent investments in new isoglucose production capacity. Indeed, European
Commission projections that isoglucose could eventually gain a market share of 2 million MT, or about
10 percent of the EU sweetener market, would need to triple the current (and outdated) production
capacity producing the current 720,000 MT isoglucose allowed under the current quota system. See
Prospects for EU agricultural markets and income 2015-2025 [3] .
The European sugar refining industry could also benefit from a consolidation in the beet processing
industry. Sugar refineries are already the main source for sugar supplies in several MS in the South and
the East of the EU. As the gap between EU domestic sugar prices and world prices shrank under the
new CAP, sugar refiners have found it increasingly difficult to secure low price sugar imports. Duty-
free imports from ACP and EBA countries have decreased after the 2007 EU Sugar Reform resulted in
lower EU sugar prices. Some current ACP country suppliers could again become uncompetitive after

the end of the quota system and production could be drastically reduced. Without ACP sugar, there will
be a shortage and duty-free imports from EU FTA’s will not be able to compensate for the lost ACP
supply. EU refiners in recent years have mounted important lobbying campaigns to abolish the €98
duty. Lately, refiners argue that the end of the EU sugar production quotas will liberalize all elements
of the EU sugar market except for them as the EU will continue to be shielded by high tariff walls and
relatively small import quota, most of which still carry a prohibitive within-quota tariff. This issue can
be expected to become even more important as imports are likely to decline even further with lower
prices for EU domestic sugar.
[1]
http://eur-lex.europa.eu/legal-content/en/TXT/?uri=CELEX:32013R1307 [2]
http://ec.europa.eu/agriculture/direct-support/direct-payments/docs/implementation-ms-notifications-
slides_en.pdf [3]
http://ec.europa.eu/agriculture/markets-and-prices/medium-term-outlook/2015/tables_en.pdf
Related reports from FAS Post in the European Union:
Country Title Date
BrusselsUSEU Sugar Semi-Annual, Centrifugal 10/5/2015
The GAIN Reports can be downloaded from the following FAS website:
http://gain.fas.usda.gov/Pages/Default.aspx

Production, Supply and Demand Data Statistics:
Sugar, Centrifugal 2014/2015 2015/2016 2016/2017
Market Begin Year Oct 2014 Oct 2015 Oct 2016
European Union USDA
Official
New
Post
USDA
Official
New
Post
USDA
Official
New
Post
Beginning Stocks 3066 3066 2106 4068 0 1268
Beet Sugar
Production 16461 18179 15820 13720 0 16220
Cane Sugar
Production 289 270 280 280 0 280
Total Sugar
Production 16750 18449 16100 14000 0 16500
Raw Imports 1900 2152 2100 2750 0 2750
Refined Imp.(Raw
Val) 700 764 700 750 0 750
Total Imports 2600 2916 2800 3500 0 3500
Total Supply 22416 24431 21006 21568 0 21268
Raw Exports 10 4 5 5 0 5
Refined Exp.(Raw
Val) 1600 1659 1495 1495 0 1495
Total Exports 1610 1663 1500 1500 0 1500
Human Dom.
Consumption 18700 18700 18800 18800 0 18800
Other Disappearance 0 0 0 0 0 0
Total Use 18700 18700 18800 18800 0 18800
Ending Stocks 2106 4068 706 1268 0 968
Total Distribution 22416 24431 21006 21568 0 21268
(1000 MT)