Ethnic Discrimination on an Online Marketplace of...
58
Ethnic Discrimination on an Online Marketplace of Vacation Rentals Morgane Laou´ enan and Roland Rathelot * April 23, 2017 Abstract We use data from an online marketplace of vacation rentals (Airbnb) to measure dis- crimination against ethnic-minority hosts. Within the same neighborhood, hosts from minority groups charge 3.2% less for comparable listings. Since ratings provide guests with information about listings quality, we can measure the contribution of statistical discrimination, building upon Altonji and Pierret (2001). We find that an additional review increases the price for minority hosts more than for majority hosts. Statistical discrimination accounts for 2.5 percentage points of the ethnic price gap, half of which could be attributed to erroneous beliefs of hosts about average group quality. Keywords: ethnic discrimination, statistical discrimination, rental market. JEL: J15, L85. * Laou´ enan : CNRS, Centre d’Economie de la Sorbonne, ScPo LIEPP, [email protected]. Rathelot : University of Warwick, CEPR, CAGE, [email protected]. We would like to thank David Autor, Manuel Bagues, Leah Boustan, Cl´ ement de Chaisemartin, Raj Chetty, Bruno Decreuse, Christian Dust- mann, Andrey Fradkin, Nathan Hendren, Simon J¨ ager, Larry Katz, Kevin Lang, Victor Lavy, Thomas Le Barbanchon, Attila Lindner, Andrea Moro, David Neumark, Barbara Petrongolo, Imran Rasul, Yona Rubin- stein, Dan Svirsky, Fabian Waldinger, Etienne Wasmer, Natalia Zinovyeva and participants in seminars at UC Irvine, UCSB, UCLA (CCPR), IEB Barcelona, Ume˚ a, Sorbonne, PSE, Warwick, DIW, Sciences Po, Louvain, IZA, TSE, LSE, Tinbergen, Howard and at several workshops and conferences (Aix-Marseille 2014, Nizza Monferrato 2015, SOLE 2016, IZA-SOLE Transatlantic Meeting 2016, CEPR Labour Symposium 2016) for fruitful discussions and comments. We gratefully acknowledge financial support from CAGE (Warwick) and from Sciences-Po LIEPP. All errors are our own. 1
-
Upload
vuongthuan -
Category
Documents
-
view
216 -
download
0
Transcript of Ethnic Discrimination on an Online Marketplace of...
Ethnic Discrimination on an Online Marketplace of
Vacation Rentals
Morgane Laouenan and Roland Rathelot∗
April 23, 2017
Abstract
We use data from an online marketplace of vacation rentals (Airbnb) to measure dis-
crimination against ethnic-minority hosts. Within the same neighborhood, hosts from
minority groups charge 3.2% less for comparable listings. Since ratings provide guests
with information about listings quality, we can measure the contribution of statistical
discrimination, building upon Altonji and Pierret (2001). We find that an additional
review increases the price for minority hosts more than for majority hosts. Statistical
discrimination accounts for 2.5 percentage points of the ethnic price gap, half of which
could be attributed to erroneous beliefs of hosts about average group quality.
Keywords: ethnic discrimination, statistical discrimination, rental market.
JEL: J15, L85.
∗Laouenan : CNRS, Centre d’Economie de la Sorbonne, ScPo LIEPP, [email protected].
Rathelot : University of Warwick, CEPR, CAGE, [email protected]. We would like to thank David
Autor, Manuel Bagues, Leah Boustan, Clement de Chaisemartin, Raj Chetty, Bruno Decreuse, Christian Dust-
mann, Andrey Fradkin, Nathan Hendren, Simon Jager, Larry Katz, Kevin Lang, Victor Lavy, Thomas Le
Barbanchon, Attila Lindner, Andrea Moro, David Neumark, Barbara Petrongolo, Imran Rasul, Yona Rubin-
stein, Dan Svirsky, Fabian Waldinger, Etienne Wasmer, Natalia Zinovyeva and participants in seminars at UC
Irvine, UCSB, UCLA (CCPR), IEB Barcelona, Umea, Sorbonne, PSE, Warwick, DIW, Sciences Po, Louvain,
IZA, TSE, LSE, Tinbergen, Howard and at several workshops and conferences (Aix-Marseille 2014, Nizza
Monferrato 2015, SOLE 2016, IZA-SOLE Transatlantic Meeting 2016, CEPR Labour Symposium 2016) for
fruitful discussions and comments. We gratefully acknowledge financial support from CAGE (Warwick) and
from Sciences-Po LIEPP. All errors are our own.
1
Ethnic discrimination is a pervasive phenomenon and understanding which
mechanisms are at work is necessary to design efficient policies. In their
recent reviews, Charles and Guryan (2011) and Lang and Lehmann (2012)
stress that uncovering discrimination mechanisms is crucial and that em-
pirical attempts are rare and inconclusive. This paper takes advantage of
the features of Airbnb, a major online marketplace for short-term rentals
to measure how much of the ethnic price gap is accounted for by statistical
discrimination on this market.
On Airbnb, hosts list their properties, set the daily price and provide infor-
mation about themselves (at least first name and picture) and their prop-
erties (precise location, equipment, local amenities, pictures...). Potential
guests book properties at given dates at the price set by hosts. In this pa-
per, we study the differential between the prices set by hosts who belong
to an ethnic minority and those set by majority hosts. Controlling for a
large set of observable characteristics accounts for more than 80% of the
raw gap but the “unexplained” gap remains significant1. In this paper, we
ask whether this unexplained gap is driven by statistical discrimination or
other factors.
While taste-based discrimination stems from the existence of racial prefer-
ences or an aversion towards cross-racial interaction (Becker, 1957), statis-
tical discrimination is the result of imperfect information and ethnic differ-
ences in the mean or the variance of unobservable characteristics (Phelps,
1972; Arrow, 1973; Aigner and Cain, 1977). The most direct approach to
distinguish statistical discrimination from other mechanisms is to measure
how the ethnic gaps vary with the amount of information on the market
(Farber and Gibbons, 1996; Altonji and Pierret, 2001). The empirical ap-
plication of such methods present several challenges. First, employment
spells are typically long and worker’s productivity evolves over time in a
1Edelman and Luca (2014) is the first paper to document a Black-White price gap in
New York City on this market.
1
way that may depend on the quality of the match. Second, there is typi-
cally no good measure of the amount of information available to employ-
ers. Experience (or age) is usually used to proxy this quantity, which is
problematic as human capital also varies with age in a potentially complex
and heterogeneous manner.
We adapt the Altonji and Pierret (2001) approach to our setting, where
we observe a measure of the quantity and quality of information about a
property available to potential guests. In contrast with the labor market,
the short-term rental market is well suited for testing statistical discrimina-
tion because (i) transactions happen frequently, compared to changes in the
intrinsic quality of the property, (ii) the evolution of the number of reviews
and ratings can be observed, (iii) large-sample and longitudinal data are
available. The profiles of new properties contain only self-reported infor-
mation. Eventual guests are then allowed to let a quantitative rating and a
qualitative assessment of both the accommodation and the host. As more
reviews are added, an increasing amount of information becomes available
to potential guests.
We rely on a simple conceptual framework where properties’ quality is
partly unobservable. When a property has no reviews, potential guests
can only infer unobservable quality using hosts’ ethnicity. When a property
has reviews, potential guests aggregate the content of reviews and host’s
ethnicity to form the best possible guess about the property’s observable
quality. In case of statistical discrimination, the price gap should decrease
with the number of reviews and tend to zero, conditional on observables
and on the measure of quality provided by reviews. If the price gap is due
to taste-based discrimination or to ethnic differentials in variables that are
not observable to the econometrician but observable to potential guests,
the price gap should remain stable with the number of reviews.
Our dataset includes daily prices, characteristics of hosts and properties, as
well as associated reviews. We collected the data relating to 400,000 proper-
2

ties, corresponding to apartments to rent in 19 cities in North America and
Europe. In total, 20 waves of data collected between June 2014 and June
2015 form an unbalanced panel of 3,500,000 observations. The ethnic mi-
nority groups we consider are hosts with Arabic or Muslim first names and
hosts with pictures coded as African-American (in North America only).
We find that the within-city raw ethnic price gap is around 16%. The set
of observable characteristics about the property (including its precise lo-
cation) is rich and explains more than 67% of the variance of the price.
Controlling for ethnic differences in these characteristics reduces the eth-
nic price gap to 3.2%. In pooled cross sections, we document that this
unexplained ethnic price gap decreases with the number of reviews and
is insignificant in the subsample of properties with more than 20 reviews.
We then use the longitudinal dimension of our data and show that prices
increase faster with the number of reviews when the host belongs to an
ethnic minority, as predicted by the theoretical framework. We estimate
the parameters of the price equation of the model using longitudinal vari-
ations in prices and the number of reviews. Three quarters (2.5 percentage
points) of the ethnic price gap can be accounted for by statistical discrimi-
nation.
When ratings are not controlled for, the ethnic differential in the slope
is smaller but persists. This finding is inconsistent with a model where
potential guests formulate correct beliefs about the distribution of quality
in the minority group. We expand our theoretical model in order to allow
for erroneous beliefs and show that this additional result permits us to
empirically separate the part of the gap that corresponds to differences in
true expectations from the part that corresponds to erroneous beliefs. We
find that roughly half of the 2.5% differential is accounted for by actual
differences in the distributions, while half can be attributed to erroneous
beliefs.
Our paper contributes to the growing but largely inconclusive literature on
3
the sources of discrimination. On the U.S. labor market, Altonji and Pier-
ret (2001) pioneered the methodology but find little evidence for statistical
discrimination in wages on the basis of ethnicity. A related strand of liter-
ature uses the fact that the relevant outcome is perfectly observed ex post.
Knowles et al. (2001) show that vehicles of African-Americans are more of-
ten searched by the police and that statistical discrimination explains more
than the observed gap.2
The amount and nature of information available to discriminatory agents
can also be manipulated experimentally. In their correspondence studies
on the U.S. and Canadian labor markets, Bertrand and Mullainathan (2004)
and Oreopoulos (2011) find that adding information or enhancing resumes
do not benefit minority applicants. Conversely, on the online rental apart-
ment market, Ewens et al. (2014) find the response to differential quality
varies in a way which is consistent with statistical discrimination. A poten-
tial limitation of this approach is related to the critique by Heckman (1998):
why would someone conceal a favorable piece of information? Even if the
amount of information in the resume is randomized, its absence should be
interpreted by employers (or customers) as information.
The heterogeneity in agents’ prejudice, whether revealed or assumed, is
sometimes used to infer which source of discrimination is more prevalent.
Bayer et al. (2012) show that the minority home-buyers pay higher prices
on the U.S. housing market regardless of the sellers’ ethnicity, suggesting
statistical discrimination. Zussman (2013) finds that the discrimination to-
wards Arabs on an online market for used cars in Israel is not related to
sellers’ revealed attitudes towards Arabs.2 Using data from a peer-to-peer lending website, Pope and Sydnor (2011) find that
African-Americans are likely to be subject to statistical discrimination. Using data from
television game shows, Anwar (2012) finds that white contestants erroneously believe that
Afro-Americans have lower skill levels while Levitt (2004) and Antonovics et al. (2005) find
no evidence of discrimination.
4
Other approaches have been used to separate sources of discrimination.
Charles and Guryan (2008) introduce an indirect test of the Becker preju-
dice model based on associations between prejudice and wages and find
that around one quarter of the unconditional racial wage gap is due to
prejudice, while the three other quarters can be due to differences in un-
observables or other forms of discrimination. Wozniak (2015) shows how
a policy (drug-testing legislation) that affects a relevant dimension of the
unobservables (drug use) can provide evidence of statistical discrimination
against low-skilled African-American men. Experimental evidence can be
complemented by lab games to separate discrimination mechanisms. In
the case of the sportscard market, List (2004) finds that the lower offers
received by minorities were rather explained by statistical discrimination.3
We also contribute to the growing literature on the role of information pro-
vided by online market intermediaries on markets’ outcomes.4 Our paper
is related to Autor and Scarborough (2008), who show that, while minori-
ties perform poorly on job tests, introducing job-testing in a large retail
firm has no impact on minority hiring. Our results are also consistent, in
negative, with those obtained by Behaghel et al. (2015), who show that set-
ting up an experimental anonymized-resume policy for some vacancies has
counter-productive consequences on the hiring rate of ethnic minorities.
The main contribution of this paper is to provide a quantitative measure
of statistical discrimination using a direct method, taking advantage of
a context and data that make identification more credible. Our paper is
also the first one to isolate the component due to erroneous beliefs in the
ethnic price gap. We contribute to the study of ethnic discrimination on
the rental market by the unprecedented scale of our data, covering 19 cities
in 8 countries both in Europe and North America. This online marketplace3See also Fershtman and Gneezy (2001) and Castillo and Petrie (2010) for papers using
lab experiments for this purpose.4See e.g. Autor (2001, 2009); Bagues and Labini (2009); Pallais (2014); Horton (2016);
Pallais and Sands (2015); Stanton and Thomas (2015); Brown et al. (2016).
5

is relevant in itself from an economic point of view: launched in 2008, the
website offers more than 3,000,000 listings in 191 different countries and
claims to have served over 150 million guests.5
The next section presents the context, the data and the first empirical ev-
idence about ethnic price gaps. In the third section, we present our con-
ceptual framework and its predictions. In the fourth section, we provide
the empirical results about statistical discrimination. A fifth section pro-
vides additional results and discusses alternative explanations. Section 6
concludes.
1 Context and Data
1.1 Description of the platform
Airbnb connects hosts looking for opportunities to let their properties and
potential guests looking for a place to stay. Both types of users have to
register and provide a large set of information about themselves. Hosts
also have to provide information about their properties. The information
about properties and hosts are displayed to potential guests in a standard-
ized way, in order to ease comparison. In practical terms, potential guests
usually start by typing the city where and when they want to stay on the
search engine. They can filter the results of the search according to the
price, or other characteristics (e.g. the number of accommodates, the type
of room, the property type, the number of bedrooms). At that stage, poten-
tial guests obtain a list of results with basic information, among which the
daily price, a picture of the property, a thumbnail photo of the host and the
overall rating (presented in stars and defined as the average rating over the
reviews of the listing). When they click on one of the listings, they have
access to more detailed information, notably the first name of the host,
5https://www.airbnb.co.uk/about/about-us
6
a detailed description of the property, a standardized list of the offered
amenities, more pictures and detailed reviews from previous guests.6
Hosts can revise the price of their properties at any moment. The potential
guest decides which place she prefers among those available during the
period selected and commits by clicking on the ”Book It” button. The
decision is then in the hands of the host. She can accept or reject the
guest, without any justification.7 A host who gets rejected receives an email
encouraging her to look for another place. The rejection is not reported on
her profile. If the host accepts the guest, the deal is done and there is no
way to modify its terms.8 The potential guest may decide to cancel her
booking. In this case, the terms of the cancellation policy (specified on
the listing) apply: depending on the flexibility of the policy, penalties of
diverse amounts are charged. The host may also decide to cancel the deal.
In this case, there is no financial penalty, but there is a reputation cost: the
website records on the host’s profile that she has cancelled a deal.
We consider hereafter that potential guests are price-takers. Using a simple
model of supply and demand, we consider that the existence of discrim-
ination towards hosts, which triggers a shift in demand, should translate
into lower prices. We formalize this idea below, in the section dedicated to
the conceptual framework.
1.2 Data
We collected the information from the publicly available webpages of the
marketplace. Specifically, we store all information visible on the first page
of the listing: the price that the host asks, the characteristics of the listing,
6See Appendix A for a screenshot of a listing.7Rejections are frequent; see Fradkin (2017).8While the acceptance/rejection decision would in itself be of interest as regards dis-
crimination, we do not have the necessary data to study that side of the market. See Edel-
man et al. (Forthcoming) for a field study about discrimination against potential guests.
7
the characteristics of the host and all available reviews and ratings.
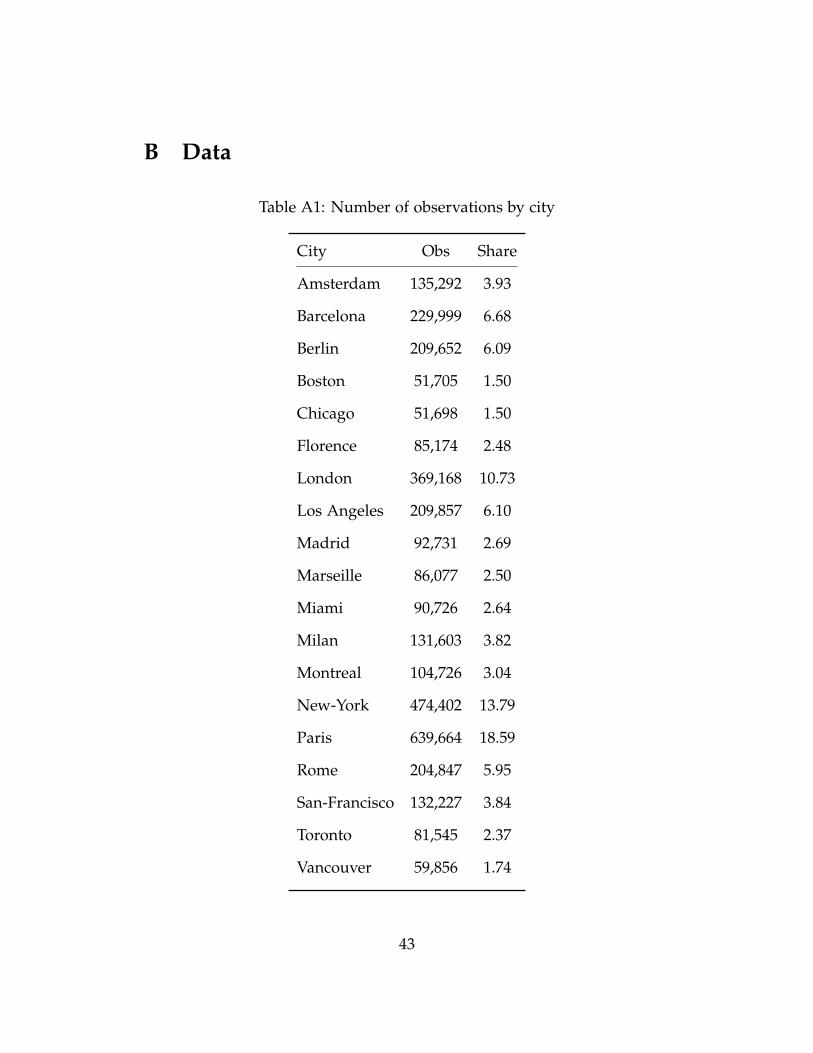
We focus on the 19 cities in North America and Europe with the highest
number of listings: London, Paris, Madrid, Barcelona, Rome, Milan, Flo-
rence, Amsterdam, Berlin, Marseille, Vancouver, Toronto, Montreal, Boston,
New York City, Miami, Chicago, San Francisco and Los Angeles.9 We re-
peated the collection process every 2-3 weeks between June 2014 and June
2015, obtaining 20 waves in total.10 Our sample includes 400,000 distinct
properties. The panel is unbalanced: some properties enter the system
while others exit.
Table 1 presents the characteristics of the properties and the hosts. The left
column displays the mean of each characteristics in the full sample, while
the right column focuses on the subsample of listings that have gained at
least one review over the observation period. There are no sizeable differ-
ences between the two columns. Most properties are apartments and the
entire place is let in 70% of cases. Properties are rather small, with 1.2 bed-
rooms on average, and they can host on average three guests. Most places
include wireless connection, heating and a washer while some amenities
(e.g. cable TV, dryer, or parking space) are less frequent. The presence of a
doorman, a gym, a hot tub, or a pool is rare. Most hosts do not allow pets
or smoking. Some properties add a cleaning fee and charge for additional
people. We count the cleaning fee directly into the price in order to obtain
the final price paid by the guest.11
Information about hosts is available on their profile pages. Aside from the
first name, a picture and a free-text description, guests know whether they
have other properties and when they joined the platform. Most hosts have
only one property and have joined the platform recently.
9See Table A1 in Appendix B for the number of observations by city.10See the collection dates of each wave in Table A2 in Appendix B.11In the absence of reliable public data on the duration of stays, we consider they last 6
days, and add a sixth of the fee to the price.
8
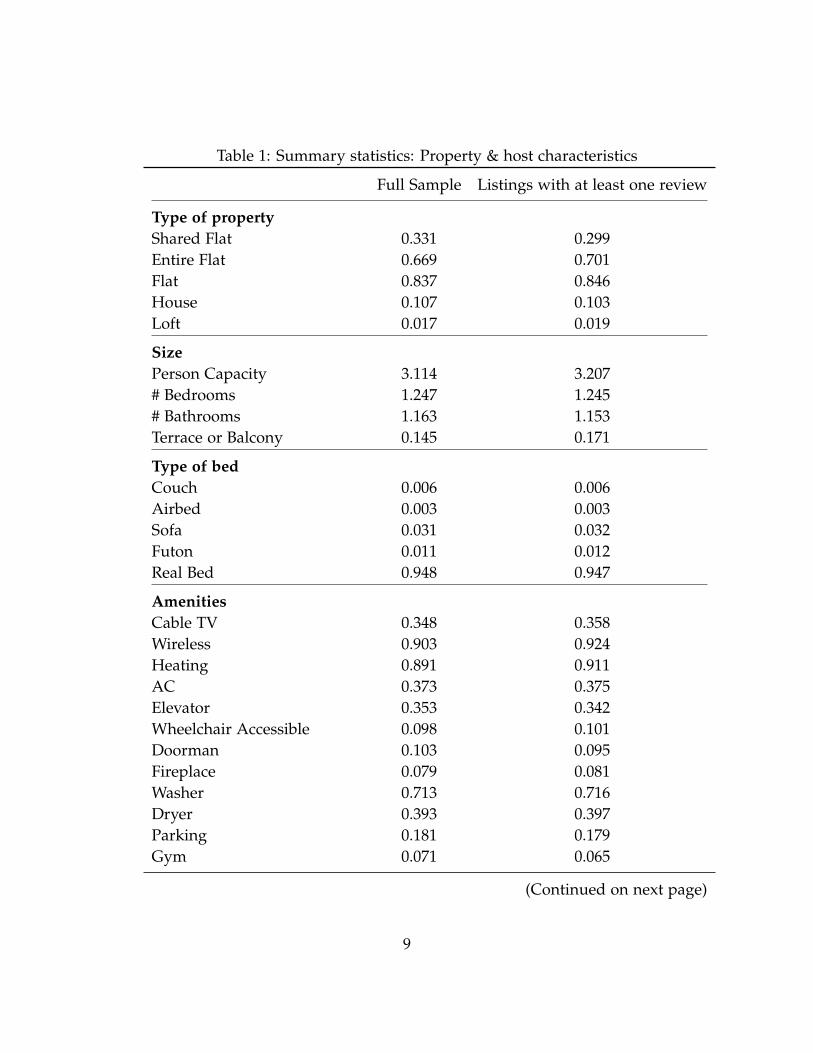
Table 1: Summary statistics: Property & host characteristics
Full Sample Listings with at least one review
Type of propertyShared Flat 0.331 0.299Entire Flat 0.669 0.701Flat 0.837 0.846House 0.107 0.103Loft 0.017 0.019
SizePerson Capacity 3.114 3.207# Bedrooms 1.247 1.245# Bathrooms 1.163 1.153Terrace or Balcony 0.145 0.171
Type of bedCouch 0.006 0.006Airbed 0.003 0.003Sofa 0.031 0.032Futon 0.011 0.012Real Bed 0.948 0.947
AmenitiesCable TV 0.348 0.358Wireless 0.903 0.924Heating 0.891 0.911AC 0.373 0.375Elevator 0.353 0.342Wheelchair Accessible 0.098 0.101Doorman 0.103 0.095Fireplace 0.079 0.081Washer 0.713 0.716Dryer 0.393 0.397Parking 0.181 0.179Gym 0.071 0.065
(Continued on next page)
9
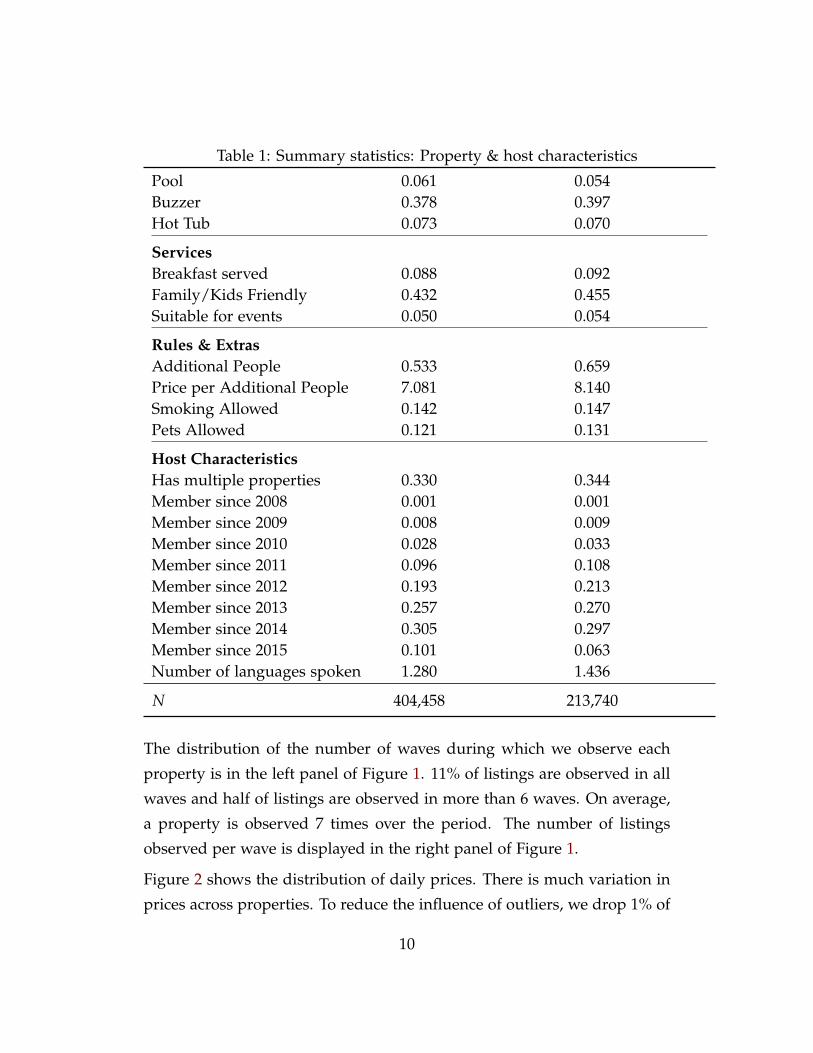
Table 1: Summary statistics: Property & host characteristics
Pool 0.061 0.054Buzzer 0.378 0.397Hot Tub 0.073 0.070
ServicesBreakfast served 0.088 0.092Family/Kids Friendly 0.432 0.455Suitable for events 0.050 0.054
Rules & ExtrasAdditional People 0.533 0.659Price per Additional People 7.081 8.140Smoking Allowed 0.142 0.147Pets Allowed 0.121 0.131
Host CharacteristicsHas multiple properties 0.330 0.344Member since 2008 0.001 0.001Member since 2009 0.008 0.009Member since 2010 0.028 0.033Member since 2011 0.096 0.108Member since 2012 0.193 0.213Member since 2013 0.257 0.270Member since 2014 0.305 0.297Member since 2015 0.101 0.063Number of languages spoken 1.280 1.436
N 404,458 213,740
The distribution of the number of waves during which we observe each
property is in the left panel of Figure 1. 11% of listings are observed in all
waves and half of listings are observed in more than 6 waves. On average,
a property is observed 7 times over the period. The number of listings
observed per wave is displayed in the right panel of Figure 1.
Figure 2 shows the distribution of daily prices. There is much variation in
prices across properties. To reduce the influence of outliers, we drop 1% of
10
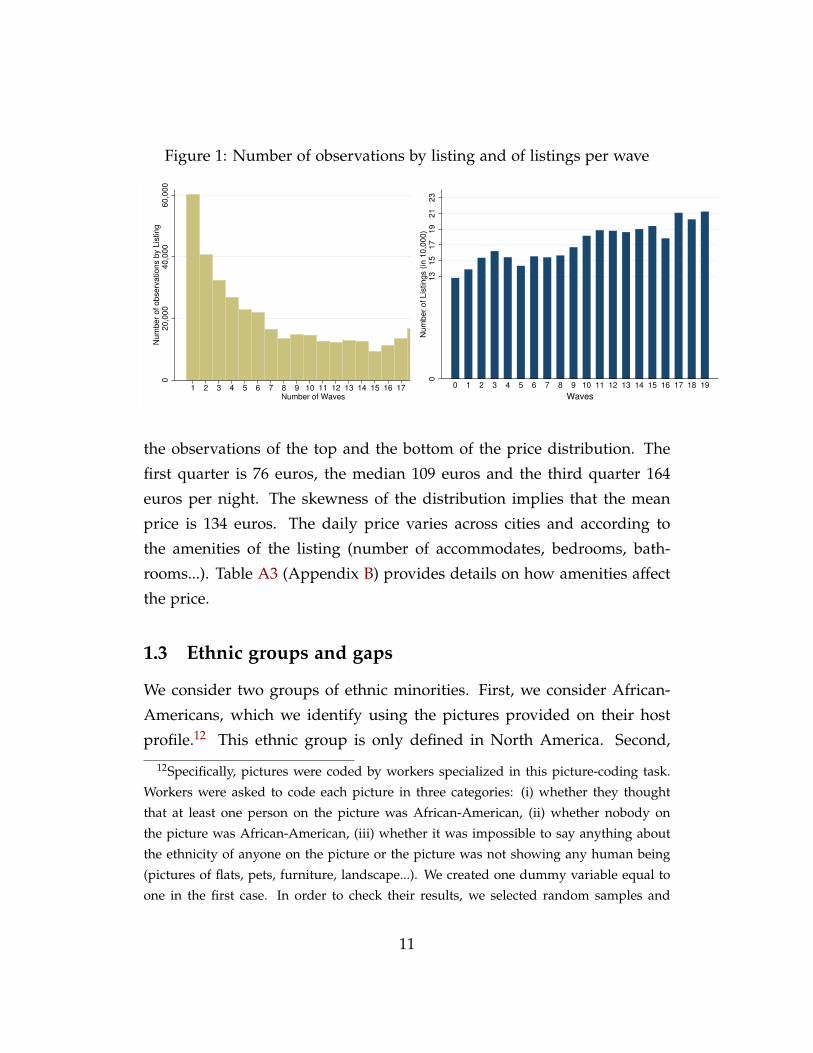
Figure 1: Number of observations by listing and of listings per wave0
20,0
00
40,0
00
60,0
00
Num
ber
of observ
ations b
y L
isting
1 2 3 4 5 6 7 8 9 10 11 12 13 14 15 16 17 18 19 20Number of Waves
013
15
17
19
21
23
Num
ber
of Lis
tings (
in 1
0,0
00)
0 1 2 3 4 5 6 7 8 9 10 11 12 13 14 15 16 17 18 19
Waves
the observations of the top and the bottom of the price distribution. The
first quarter is 76 euros, the median 109 euros and the third quarter 164
euros per night. The skewness of the distribution implies that the mean
price is 134 euros. The daily price varies across cities and according to
the amenities of the listing (number of accommodates, bedrooms, bath-
rooms...). Table A3 (Appendix B) provides details on how amenities affect
the price.
1.3 Ethnic groups and gaps
We consider two groups of ethnic minorities. First, we consider African-
Americans, which we identify using the pictures provided on their host
profile.12 This ethnic group is only defined in North America. Second,
12Specifically, pictures were coded by workers specialized in this picture-coding task.
Workers were asked to code each picture in three categories: (i) whether they thought
that at least one person on the picture was African-American, (ii) whether nobody on
the picture was African-American, (iii) whether it was impossible to say anything about
the ethnicity of anyone on the picture or the picture was not showing any human being
(pictures of flats, pets, furniture, landscape...). We created one dummy variable equal to
one in the first case. In order to check their results, we selected random samples and
11
Figure 2: Distribution of daily price
0.0
02
.004
.006
.008
Density
0 100 200 300 400 500 600Price
we consider hosts that have a first name associated with Arabic, Muslim
or Sub-Saharan African ethnicity (labeled Arabic/Muslim hereafter).13 We
use two different sources to obtain a complete list of names: Jouniaux
(2001) and Hawramani (2015).14 This ethnic group is defined both in North
America and Europe.15
Table 2 displays the share of ethnic groups in the sample and the within-
CityWave raw price gap. African-Americans represent roughly 2% of the
observations in the sample, i.e. 5.3% of the North American observa-
tions. Compared to their share in total population, it seems that African-
found mistakes at a rate below 5% for this dummy variable.13See Rubinstein and Brenner (2014) for an example of discrimination based on names.14The list of Arabic/Muslim names we used is available upon request.15One could think of other ethnic minorities than those considered in this analysis.
Hispanics are difficult to identify in these data, given that first names used among the
group are not necessarily distinguishable and picture characterization is difficult. We
replicate our results including individuals coded as Hispanics using first names – for the
United States – and present the output in Appendix C. Our findings are qualitatively
unchanged.
12
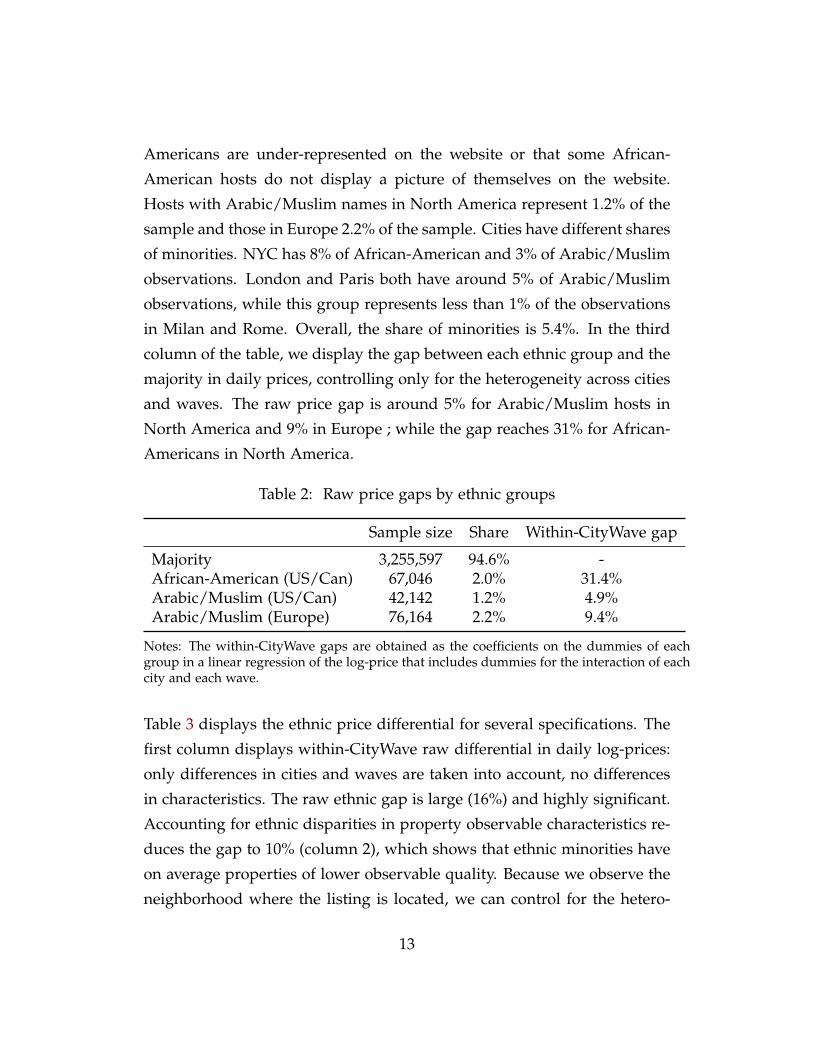
Americans are under-represented on the website or that some African-
American hosts do not display a picture of themselves on the website.
Hosts with Arabic/Muslim names in North America represent 1.2% of the
sample and those in Europe 2.2% of the sample. Cities have different shares
of minorities. NYC has 8% of African-American and 3% of Arabic/Muslim
observations. London and Paris both have around 5% of Arabic/Muslim
observations, while this group represents less than 1% of the observations
in Milan and Rome. Overall, the share of minorities is 5.4%. In the third
column of the table, we display the gap between each ethnic group and the
majority in daily prices, controlling only for the heterogeneity across cities
and waves. The raw price gap is around 5% for Arabic/Muslim hosts in
North America and 9% in Europe ; while the gap reaches 31% for African-
Americans in North America.
Table 2: Raw price gaps by ethnic groups
Sample size Share Within-CityWave gap
Majority 3,255,597 94.6% -African-American (US/Can) 67,046 2.0% 31.4%Arabic/Muslim (US/Can) 42,142 1.2% 4.9%Arabic/Muslim (Europe) 76,164 2.2% 9.4%
Notes: The within-CityWave gaps are obtained as the coefficients on the dummies of eachgroup in a linear regression of the log-price that includes dummies for the interaction of eachcity and each wave.
Table 3 displays the ethnic price differential for several specifications. The
first column displays within-CityWave raw differential in daily log-prices:
only differences in cities and waves are taken into account, no differences
in characteristics. The raw ethnic gap is large (16%) and highly significant.
Accounting for ethnic disparities in property observable characteristics re-
duces the gap to 10% (column 2), which shows that ethnic minorities have
on average properties of lower observable quality. Because we observe the
neighborhood where the listing is located, we can control for the hetero-
13
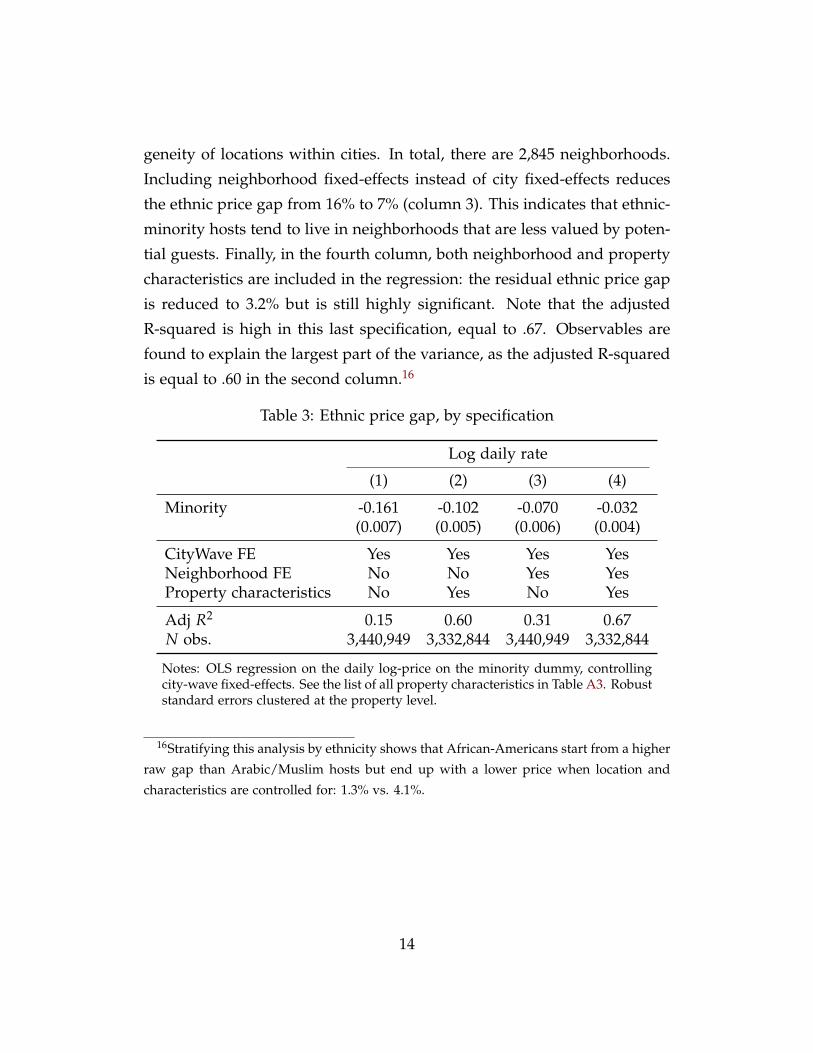
geneity of locations within cities. In total, there are 2,845 neighborhoods.
Including neighborhood fixed-effects instead of city fixed-effects reduces
the ethnic price gap from 16% to 7% (column 3). This indicates that ethnic-
minority hosts tend to live in neighborhoods that are less valued by poten-
tial guests. Finally, in the fourth column, both neighborhood and property
characteristics are included in the regression: the residual ethnic price gap
is reduced to 3.2% but is still highly significant. Note that the adjusted
R-squared is high in this last specification, equal to .67. Observables are
found to explain the largest part of the variance, as the adjusted R-squared
is equal to .60 in the second column.16
Table 3: Ethnic price gap, by specification
Log daily rate
(1) (2) (3) (4)
Minority -0.161 -0.102 -0.070 -0.032(0.007) (0.005) (0.006) (0.004)
CityWave FE Yes Yes Yes YesNeighborhood FE No No Yes YesProperty characteristics No Yes No Yes
Adj R2 0.15 0.60 0.31 0.67N obs. 3,440,949 3,332,844 3,440,949 3,332,844
Notes: OLS regression on the daily log-price on the minority dummy, controllingcity-wave fixed-effects. See the list of all property characteristics in Table A3. Robuststandard errors clustered at the property level.
16Stratifying this analysis by ethnicity shows that African-Americans start from a higher
raw gap than Arabic/Muslim hosts but end up with a lower price when location and
characteristics are controlled for: 1.3% vs. 4.1%.
14

2 Conceptual framework
In this section, we introduce a simple conceptual framework to explain
how we expect to separate the different mechanisms behind the ethnic
price gap. We show that, under some assumptions, we can separate sta-
tistical discrimination from the other mechanisms. Conversely, taste-based
discrimination and differentials in characteristics that are observed by po-
tential guests but not by the econometrician are found to be observationally
equivalent, given our data. Our framework also allows us to test whether
ethnic minorities set lower prices because they have lower outside options.
2.1 Prices and demand as a function of quality
At each period (say, a week), a host shares his working time between two
activities: renting his property (looking for guests, communicating with
guests, cleaning up) or working on a regular job. L is the amount of labor
put in renting and 1 − L into the regular job. Renting the property is
assumed to have decreasing returns to scale: the number of nights supplied
is equal to N = Lα, with α ∈ (0, 1). The regular job has constant returns to
scale. Given the price of a night P and the wage of the regular job W, the
revenue of the host over the period is: PLα + W(1− L).
From the point of view of potential guests in a particular market, properties
differ in three dimensions: quality Q, price P and the ethnicity of the host m
(equal to 1 if the host belongs to an ethnic minority, 0 otherwise). Demand
D for a particular property is assumed to increase with Q, decrease with
P. Taste-based discrimination is embedded in this framework: demand
is assumed to be divided by Γ > 1 when m = 1, relatively to m = 0.
Assuming β and κ are strictly positive, we write demand as:
D =Qβ
PκΓm
Taking Q and m as given, hosts can set the price P and the effort L they
15
dedicate to renting to maximize their profit, under the demand constraint:
maxP
PD(P) + (1− D1/α(P))W with D(P) =Qβ
PκΓm
Solving the program, hosts will set the log-price such that:
p = p0 + λαw + λβq− λγm
where p = log P, w = log W, q = log Q, γ = log Γ, α = α1−α , λ = (κ + α)−1,
p0 = λα log( α(κ−1)κ ).
2.2 Unobserved quality
Quality q is not perfectly observable by potential guests or the econometri-
cian. Everyone observes x. ζ is the part of the information that is available
to the guests but not to the econometrician and is orthogonal to x. ν is the
part of the information that is revealed by the reviews and is orthogonal
to x and ζ. u is the part of the information that not available to anyone
and is orthogonal to x, ν and ζ. We assume that the distribution of ν|m is
a N (νm, σ2ν ).17 We also presume that each review transmits a signal which
is a random draw around ν in a normal distribution, the error on a single
review being of variance σ2.18 The average rating over K reviews transmits
the signal r distributed as a N (ν, σ2/K). Denoting ρ = σ2/σ2ν ,
E(ν|r, K, m) =Kr + ρνm
K + ρ
Guests observe x, ζ, m, K, and r. Hosts with an outside option w will set a
price:
p = p0 − λγm + λαw + λβ(x + ζ) + λβKr + ρνm
K + ρ
17In Appendix D, we show that we can obtain a similar expression for the expecta-
tion of the price when we assume, more realistically, that ν follows a non-normal prior
distribution (beta distribution).18This assumption is not totally obvious. Reviews may depend not only on the quality
but also on prices. We abstract from this aspect to simplify.
16

We normalize ζ, ν and u so that they have zero mean in the majority group
and denote δζ , δν and δu the difference in the expectations of these variables
between the majority and the minority groups. In the absence of reviews,
the best guess about ν is its expectation conditional on the host’s group.
Statistical discrimination arises when δν > 0.
The econometrician observes p, K, m, a proxy for r as well as a vector of
characteristics X from which x has to be inferred. Denote δw the difference
between the mean of log w in the majority and the minority groups. The
best possible prediction of the log-price based on what is observed by the
econometrician is:
p = p0 + λβx− λ(γ + βδζ + βδu + αδw
)m + λβ
KrK + ρ
− λβρδν
K + ρm (1)
From equation (1), we see that the sign of δν, the parameter relating to
statistical discrimination, can be identified by comparing observations of
the same listing with different number of reviews. On the other hand,
the parameters γ, δζ , δu and δw, relating to taste-based discrimination, un-
observables and outside options cannot be distinguished from each other
using equation (1).
2.3 Prices and reviews: Empirical evidence
In order to be able to identify statistical discrimination, we need to have
enough variability in the number of reviews and we need reviews to be
informative about listings’ quality.19
First, we assess how the number of reviews varies in our sample. Figure
3 shows the distribution of reviews across the observations of our sample
(left panel) and the variation of the number of reviews between the last and
the first observations (right panel). The sample offers a decent amount of
19See Fradkin et al. (2017) for details about the reviewing system of Airbnb.
17
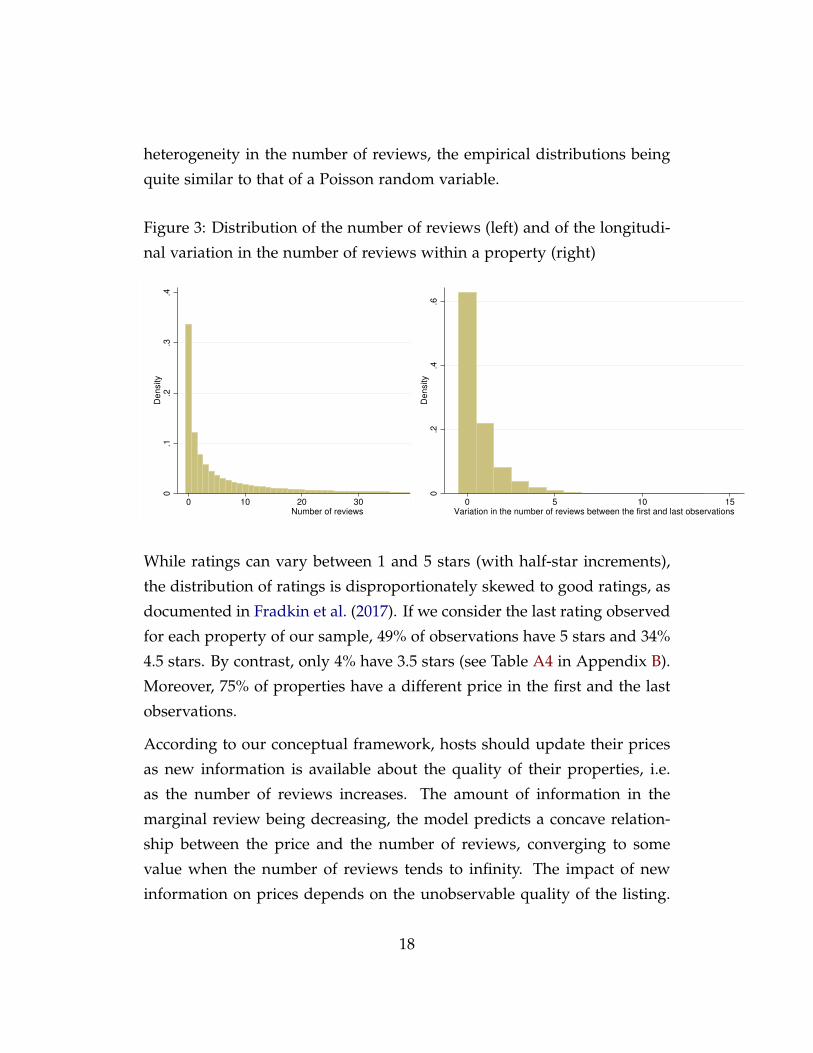
heterogeneity in the number of reviews, the empirical distributions being
quite similar to that of a Poisson random variable.
Figure 3: Distribution of the number of reviews (left) and of the longitudi-
nal variation in the number of reviews within a property (right)
0.1
.2.3
.4D
ensity
0 10 20 30 40 50Number of reviews
0.2
.4.6
Density
0 5 10 15Variation in the number of reviews between the first and last observations
While ratings can vary between 1 and 5 stars (with half-star increments),
the distribution of ratings is disproportionately skewed to good ratings, as
documented in Fradkin et al. (2017). If we consider the last rating observed
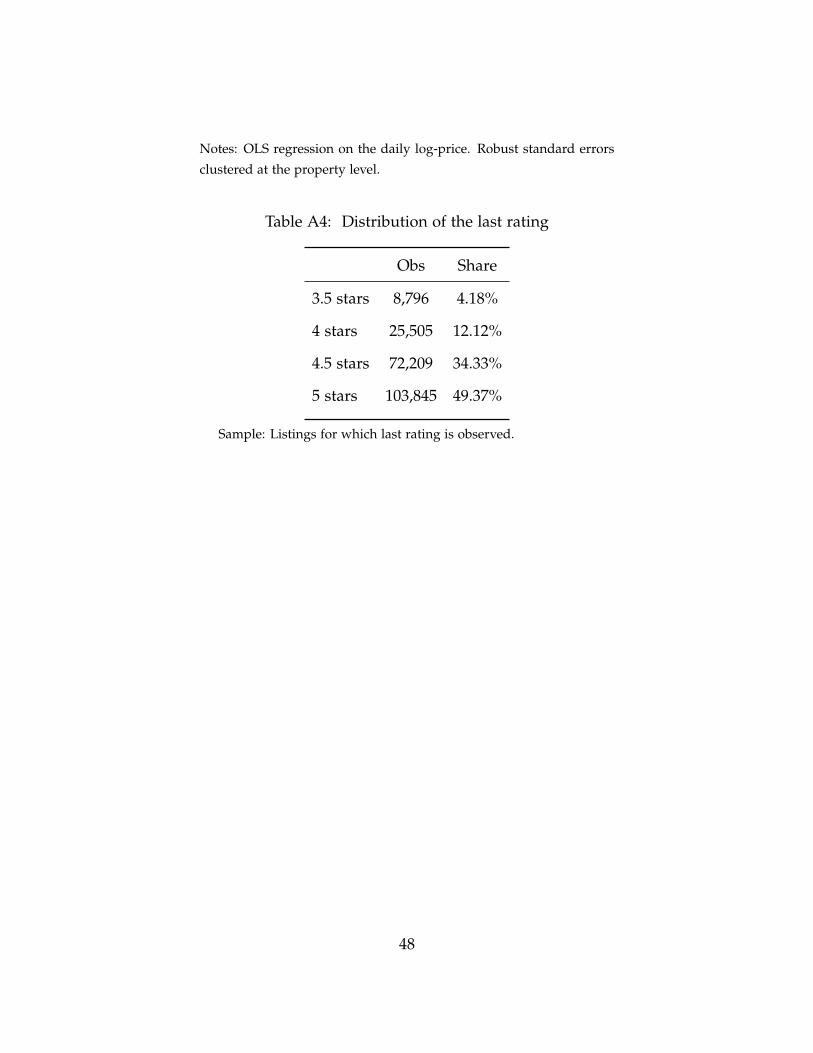
for each property of our sample, 49% of observations have 5 stars and 34%
4.5 stars. By contrast, only 4% have 3.5 stars (see Table A4 in Appendix B).
Moreover, 75% of properties have a different price in the first and the last
observations.
According to our conceptual framework, hosts should update their prices
as new information is available about the quality of their properties, i.e.
as the number of reviews increases. The amount of information in the
marginal review being decreasing, the model predicts a concave relation-
ship between the price and the number of reviews, converging to some
value when the number of reviews tends to infinity. The impact of new
information on prices depends on the unobservable quality of the listing.
18
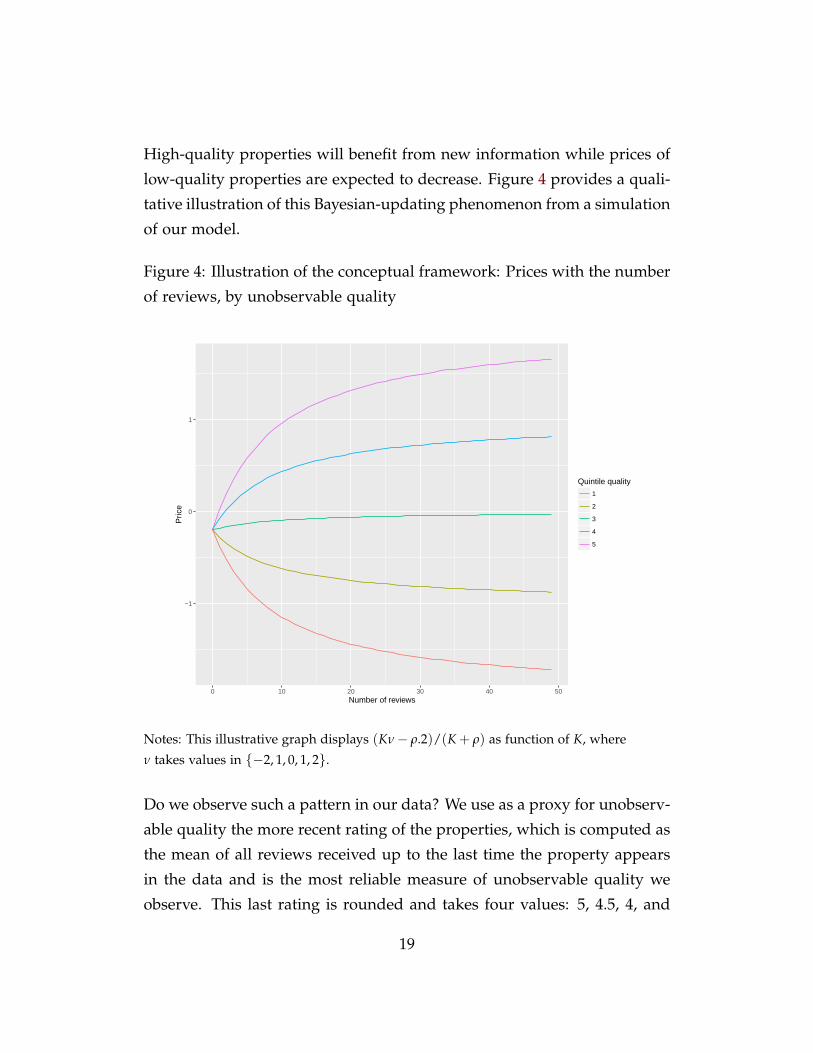
High-quality properties will benefit from new information while prices of
low-quality properties are expected to decrease. Figure 4 provides a quali-
tative illustration of this Bayesian-updating phenomenon from a simulation
of our model.
Figure 4: Illustration of the conceptual framework: Prices with the number
of reviews, by unobservable quality
−1
0
1
0 10 20 30 40 50Number of reviews
Pric
e
Quintile quality
1
2
3
4
5
Notes: This illustrative graph displays (Kν− ρ.2)/(K + ρ) as function of K, where
ν takes values in {−2, 1, 0, 1, 2}.
Do we observe such a pattern in our data? We use as a proxy for unobserv-
able quality the more recent rating of the properties, which is computed as
the mean of all reviews received up to the last time the property appears
in the data and is the most reliable measure of unobservable quality we
observe. This last rating is rounded and takes four values: 5, 4.5, 4, and
19

3.5 stars and less. We regress the log-price on splines of the number of
reviews interacted with the last rating and the full set of characteristics of
the properties. The spline specification allows us to flexibly accommodate
a hypothetical concavity in the relationship between prices and number of
reviews without forcing it.
pit =5
∑r=3.5
1{ri = r}sr(Kit) + Xitβx + ηi + εit (2)
where pit is the log-price of property i at wave t, K is the number of reviews,
X are observable characteristics of the property and the host, sr(.) are linear
splines for each level of the last rating r and η are property fixed-effects.
The results of the estimation are displayed in Figure 5. The figure shows
that, depending on the last rating, the prices diverge in a way that is close to
the way predicted by our conceptual framework. This result shows that (i)
reviews provide information to potential guests, (ii) hosts use reviews and
information to update their prices, and (iii) the last rating is a satisfactory
proxy for the unobservable quality of the listing.
3 Ethnic price gaps and statistical discrimination
We first document how the unexplained ethnic price gap changes with the
number of reviews. Table 4 shows the coefficient associated to the ethnic
minority dummy in a regression of the log-price on property characteris-
tics, neighborhood dummies and ratings, on several subsamples defined
by the number of reviews. We find that the ethnic gap changes across sub-
samples: from 3.3% for listings with no reviews to an insignificant 1% for
listings with more than 20 reviews.20
20We check that our results are not sensitive to the way we control for geographic
unobserved heterogeneity. Instead of neighborhood dummies, we build 5000 squared
blocks using longitude and latitude of listings. Controlling for block fixed-effects instead
of neighborhood fixed-effects does not affect the results at all. See Appendix E.
20
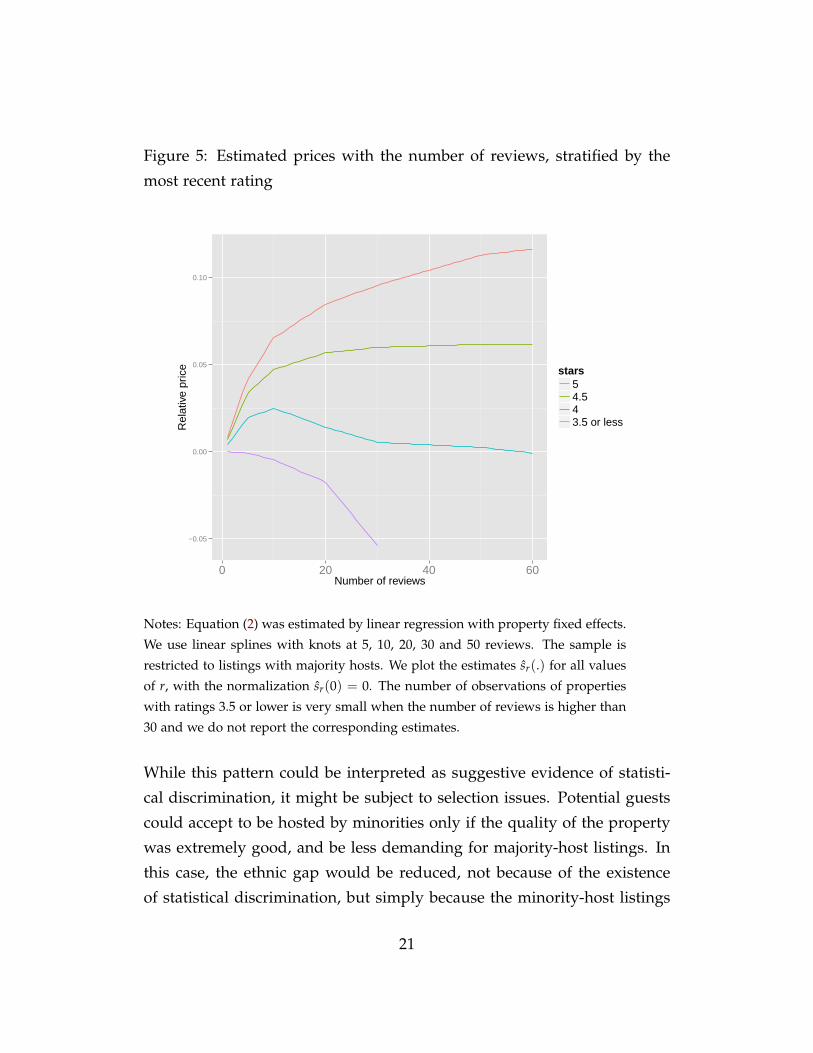
Figure 5: Estimated prices with the number of reviews, stratified by the
most recent rating
−0.05
0.00
0.05
0.10
0 20 40 60Number of reviews
Rel
ativ
e pr
ice stars
54.543.5 or less
Notes: Equation (2) was estimated by linear regression with property fixed effects.
We use linear splines with knots at 5, 10, 20, 30 and 50 reviews. The sample is
restricted to listings with majority hosts. We plot the estimates sr(.) for all values
of r, with the normalization sr(0) = 0. The number of observations of properties
with ratings 3.5 or lower is very small when the number of reviews is higher than
30 and we do not report the corresponding estimates.
While this pattern could be interpreted as suggestive evidence of statisti-
cal discrimination, it might be subject to selection issues. Potential guests
could accept to be hosted by minorities only if the quality of the property
was extremely good, and be less demanding for majority-host listings. In
this case, the ethnic gap would be reduced, not because of the existence
of statistical discrimination, but simply because the minority-host listings
21
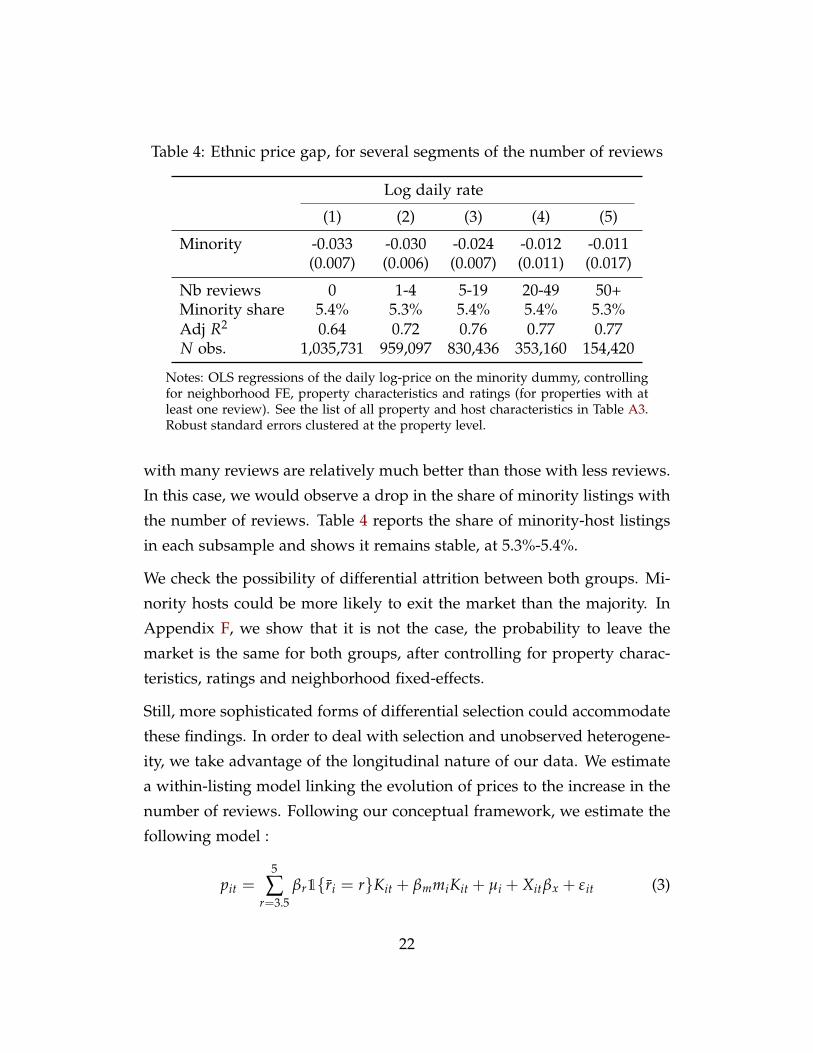
Table 4: Ethnic price gap, for several segments of the number of reviews
Log daily rate
(1) (2) (3) (4) (5)
Minority -0.033 -0.030 -0.024 -0.012 -0.011(0.007) (0.006) (0.007) (0.011) (0.017)
Nb reviews 0 1-4 5-19 20-49 50+Minority share 5.4% 5.3% 5.4% 5.4% 5.3%Adj R2 0.64 0.72 0.76 0.77 0.77N obs. 1,035,731 959,097 830,436 353,160 154,420
Notes: OLS regressions of the daily log-price on the minority dummy, controllingfor neighborhood FE, property characteristics and ratings (for properties with atleast one review). See the list of all property and host characteristics in Table A3.Robust standard errors clustered at the property level.
with many reviews are relatively much better than those with less reviews.
In this case, we would observe a drop in the share of minority listings with
the number of reviews. Table 4 reports the share of minority-host listings
in each subsample and shows it remains stable, at 5.3%-5.4%.
We check the possibility of differential attrition between both groups. Mi-
nority hosts could be more likely to exit the market than the majority. In
Appendix F, we show that it is not the case, the probability to leave the
market is the same for both groups, after controlling for property charac-
teristics, ratings and neighborhood fixed-effects.
Still, more sophisticated forms of differential selection could accommodate
these findings. In order to deal with selection and unobserved heterogene-
ity, we take advantage of the longitudinal nature of our data. We estimate
a within-listing model linking the evolution of prices to the increase in the
number of reviews. Following our conceptual framework, we estimate the
following model :
pit =5
∑r=3.5
βr1{ri = r}Kit + βmmiKit + µi + Xitβx + εit (3)
22
in which r is the overall rating at the last observation and µi is a listing-
specific fixed effect. For the sake of parsimony, we restrict the relationship
to be linear in equation (3) but relax this assumption in some specifications.
If reviews matter and ratings provide some information about unobserved
quality, we should have βr > βr′ if r > r′, what we have checked above with
a more flexible specification. In the presence of statistical discrimination,
we should have βm > 0.
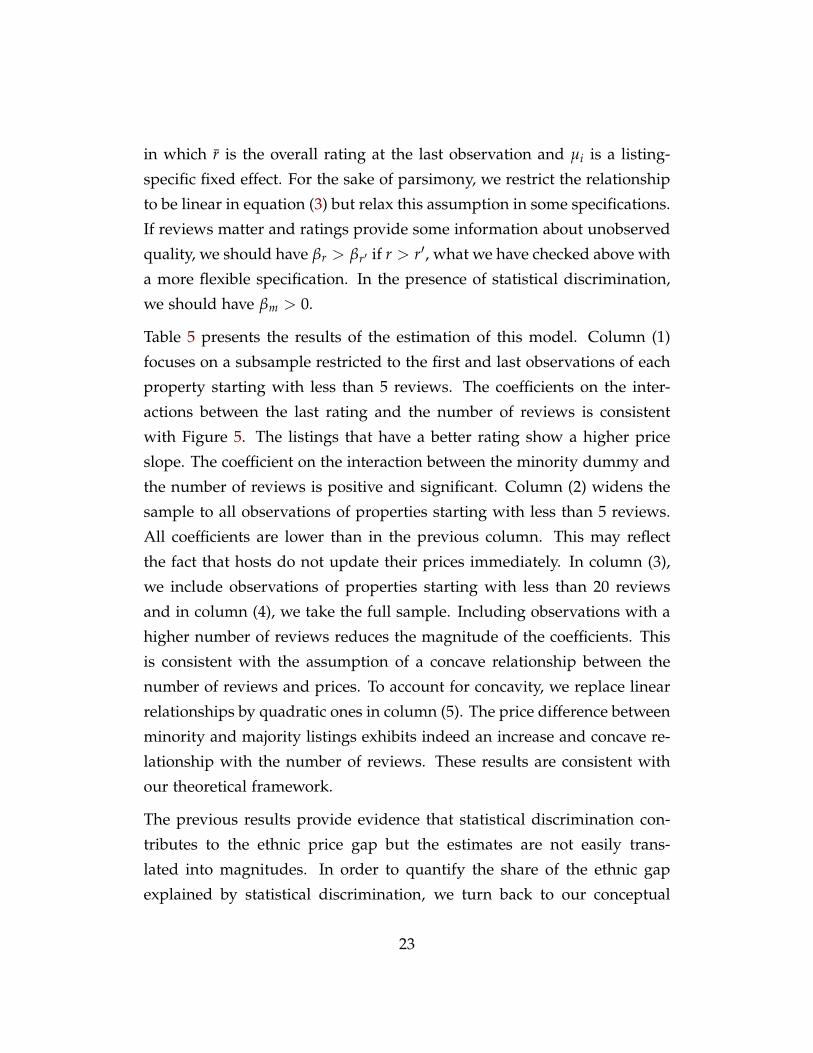
Table 5 presents the results of the estimation of this model. Column (1)
focuses on a subsample restricted to the first and last observations of each
property starting with less than 5 reviews. The coefficients on the inter-
actions between the last rating and the number of reviews is consistent
with Figure 5. The listings that have a better rating show a higher price
slope. The coefficient on the interaction between the minority dummy and
the number of reviews is positive and significant. Column (2) widens the
sample to all observations of properties starting with less than 5 reviews.
All coefficients are lower than in the previous column. This may reflect
the fact that hosts do not update their prices immediately. In column (3),
we include observations of properties starting with less than 20 reviews
and in column (4), we take the full sample. Including observations with a
higher number of reviews reduces the magnitude of the coefficients. This
is consistent with the assumption of a concave relationship between the
number of reviews and prices. To account for concavity, we replace linear
relationships by quadratic ones in column (5). The price difference between
minority and majority listings exhibits indeed an increase and concave re-
lationship with the number of reviews. These results are consistent with
our theoretical framework.
The previous results provide evidence that statistical discrimination con-
tributes to the ethnic price gap but the estimates are not easily trans-
lated into magnitudes. In order to quantify the share of the ethnic gap
explained by statistical discrimination, we turn back to our conceptual
23
Table 5: Fixed-Effects Estimation
log-price
(1) (2) (3) (4) (5)
3.5 stars ×K/100 0.042 -0.055 -0.113 -0.122 -0.175(0.072) (0.072) (0.060) (0.052) (0.072)
4 stars ×K/100 0.115 0.045 -0.030 -0.055 -0.013(0.029) (0.028) (0.022) (0.019) (0.026)
4.5 stars ×K/100 0.269 0.192 0.094 0.032 0.101(0.013) (0.012) (0.009) (0.007) (0.011)
5 stars ×K/100 0.401 0.317 0.215 0.124 0.218(0.014) (0.012) (0.009) (0.007) (0.014)
Minority ×K/100 0.160 0.102 0.064 0.031 0.099(0.043) (0.038) (0.038) (0.026) (0.036)
3.5 stars×(K/100)2 0.137(0.069)
4 stars×(K/100)2 -0.044(0.022)
4.5 stars×(K/100)2 -0.060(0.007)
5 stars×(K/100)2 -0.079(0.011)
Minority ×(K/100)2 -0.063(0.023)
Samples Min(K)<5 Min(K)<5 Min(K)<20 - -First Last Full Full Full Full
N obs. 597,455 2,514,783 3,042,103 3,332,844 3,332,844
Notes: OLS regressions with listing fixed effects. Aside from those mentioned in the Table, controlsinclude CityWave FE and property characteristics (see Table A3). Robust standard errors clusteredat the property level.
framework and estimate the parameters relating to statistical discrimina-
tion βm = λβδν. We use the last observed review s (taking values 3.5, 4,
4.5, or 5) of each listing as a proxy for r. We do not observe x and use
the vector X of observable characteristics, as well as dummies for the city
24

interacted with the wave in which the listing appeared. We estimate the
parameters of the following equation by non-linear least-squares, βm and
ρ being the main parameters of interest. For inference, we bootstrap at the
property level.
pit =5
∑r=3.5
βr1{ri = r} Kit
Kit + ρ− βmmi
ρ
Kit + ρ+ µi + Xitβx + εit (4)
We obtain an estimated value of 9 (with a standard error of 0.3) for ρ. ρ
can be interpreted as the number of reviews necessary to reveal half of
the relevant information about the unobservables of a listing. If p is the
price of a property in the absence of reviews and p the price when all the
information is revealed, the price (p + p)/2 is reached in expectation after
ρ reviews.
βm is estimated to be equal to .025 (with a standard error of .005), which
means that going from 0 to an infinite number of reviews would increase
the prices of minority by 2.5%. This figure is of the same order of mag-
nitude as the ethnic price gap observed in the subset of listings with no
reviews (3.3%, see Table 4, column 1). This point estimate suggests that
around three quarters of the initial price gap can be accounted for by sta-
tistical discrimination.
We perform the whole empirical analysis on several subsamples, according
to the continent (North-America vs. Europe), the ethnic minority group
(African-American vs. Arabic/Muslim) and the nature of the listing (entire
property vs. shared property). Results are in Appendix G. They display
some extent of heterogeneity but nothing we can read in a systematic and
significant way.
25

4 Additional results
4.1 Erroneous beliefs
In the conceptual framework introduced in Section 2, the existence of statis-
tical discrimination relies on actual differences in the distribution of qual-
ity across groups. On average, minority listings have worse unobservables
than majority and the gap is δν. In this section, we add an additional chan-
nel for statistical discrimination: hosts may have erroneous priors about the
average unobservable quality of each group. Because they revise their pri-
ors when new information about a listing is available, we categorise this as
statistical discrimination. We also show that we can decompose statistical
discrimination into two components: the first one due to actual differences
in the unobservable quality across groups, and the second one because po-
tential guests believe erroneously that the average (unobservable) quality
of minority listings is lower than that of the majority.
We assume that the true expectation of ν in the minority group is ν1 while
guests wrongly believe that it is ν1. We denote as δe the difference ν1 − ν1
between the true expectation and the erroneous prior about the expec-
tation. Conditional on x, r, K and m, the price takes a form similar to
equation (1).
p = p0 + λβx− λ(γ + βδζ + βδu + αδw
)m + λβ
KrK + ρ
− λβρ(δν + δe)
K + ρm
(5)
In equation (5), the price penalty suffered by minority listings with no
ratings is proportional to δν + δe, not just to δν. When beliefs are erroneous,
the new information provided by the reviews corrects for the gap between
the actual quality of the property and the average quality in the group as
well as for the erroneous belief.
When ratings are not included amongst regressors in the price equation,
26
we obtain:
p = p0 + λβx− λ(γ + βδζ + βδu + αδw + βδν
)m− λβ
ρδe
K + ρm (6)
Whenever beliefs are correct (δe = 0), the price gap should remain constant
with the number of reviews when ratings are not controlled for. The intu-
ition is that, while reviews reveal information about which listings among
the ones owned by minorities (and the majority) are the best ones, the av-
erage quality in each group remains similar. The situation changes when
δe > 0, because new information improves the average posterior belief
about the unobservable quality in the minority group. In this case, the eth-
nic price gap should decrease in the number of reviews, even when ratings
are not controlled for. If δν > 0, the slope of the price gap with the number
of reviews, should still be larger when ratings are controlled for than when
they are not.
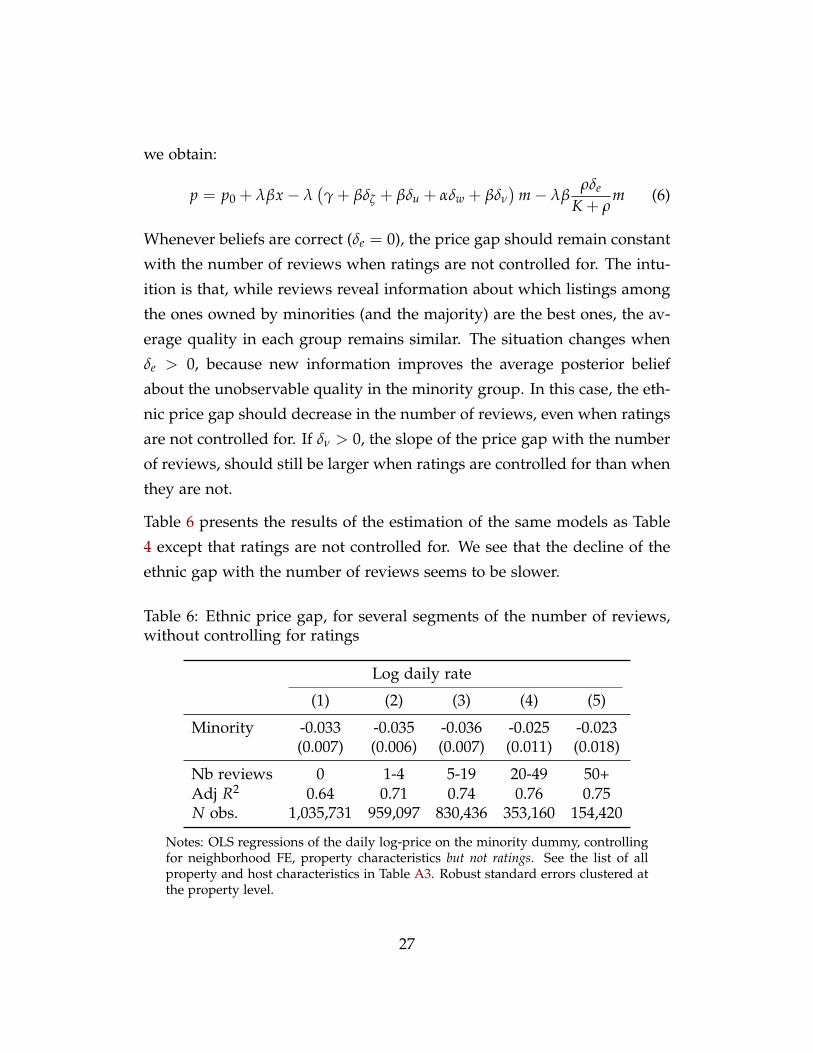
Table 6 presents the results of the estimation of the same models as Table
4 except that ratings are not controlled for. We see that the decline of the
ethnic gap with the number of reviews seems to be slower.
Table 6: Ethnic price gap, for several segments of the number of reviews,without controlling for ratings
Log daily rate
(1) (2) (3) (4) (5)
Minority -0.033 -0.035 -0.036 -0.025 -0.023(0.007) (0.006) (0.007) (0.011) (0.018)
Nb reviews 0 1-4 5-19 20-49 50+Adj R2 0.64 0.71 0.74 0.76 0.75N obs. 1,035,731 959,097 830,436 353,160 154,420
Notes: OLS regressions of the daily log-price on the minority dummy, controllingfor neighborhood FE, property characteristics but not ratings. See the list of allproperty and host characteristics in Table A3. Robust standard errors clustered atthe property level.
27
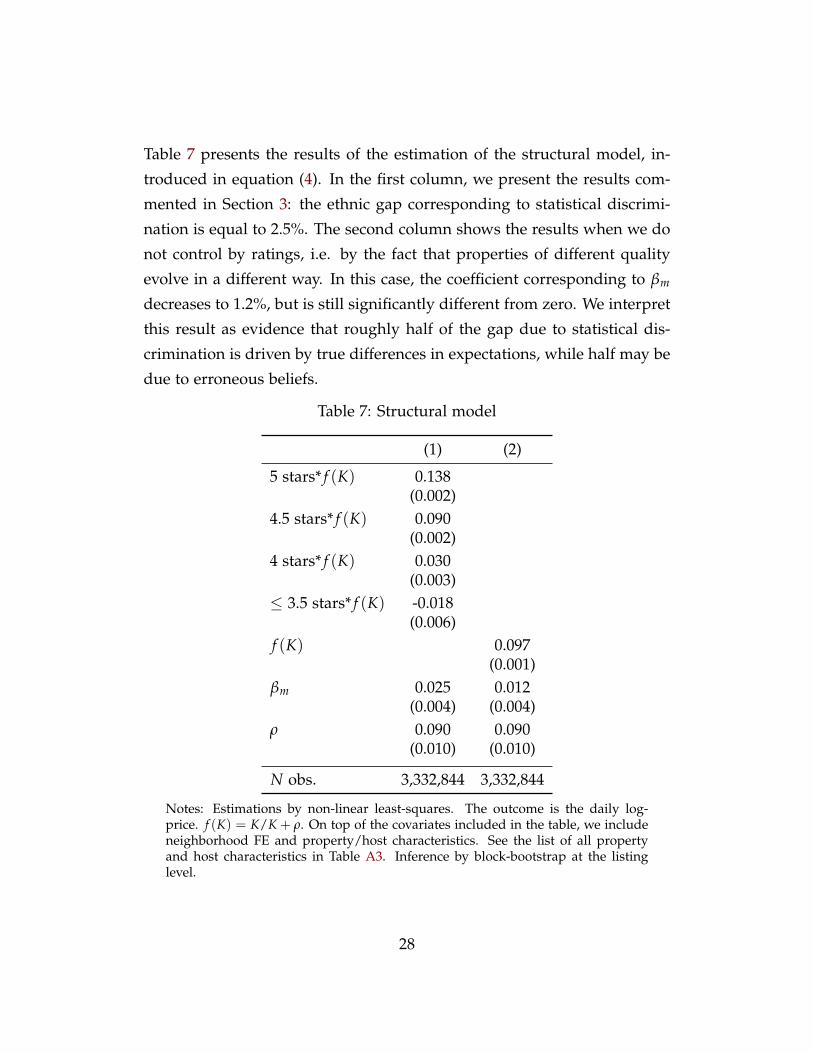
Table 7 presents the results of the estimation of the structural model, in-
troduced in equation (4). In the first column, we present the results com-
mented in Section 3: the ethnic gap corresponding to statistical discrimi-
nation is equal to 2.5%. The second column shows the results when we do
not control by ratings, i.e. by the fact that properties of different quality
evolve in a different way. In this case, the coefficient corresponding to βm
decreases to 1.2%, but is still significantly different from zero. We interpret
this result as evidence that roughly half of the gap due to statistical dis-
crimination is driven by true differences in expectations, while half may be
due to erroneous beliefs.
Table 7: Structural model
(1) (2)
5 stars* f (K) 0.138(0.002)
4.5 stars* f (K) 0.090(0.002)
4 stars* f (K) 0.030(0.003)
≤ 3.5 stars* f (K) -0.018(0.006)
f (K) 0.097(0.001)
βm 0.025 0.012(0.004) (0.004)
ρ 0.090 0.090(0.010) (0.010)
N obs. 3,332,844 3,332,844
Notes: Estimations by non-linear least-squares. The outcome is the daily log-price. f (K) = K/K + ρ. On top of the covariates included in the table, we includeneighborhood FE and property/host characteristics. See the list of all propertyand host characteristics in Table A3. Inference by block-bootstrap at the listinglevel.
28
4.2 Ethnic differences in pricing behavior
A potential explanation for the lower prices of minority-host listings is that
minority hosts have on average lower outside options than majority hosts.
Going back to our conceptual framework, lower outside options translate
into a lower w. Combining the log-demand and the log-price equations and
eliminating quality, we obtain a relationship involving only the log-volume
of transactions d, the log-price and the outside log-wage:
d = αp− αw− (κ + α)p0 (7)
A lower outside wage entails a lower price but it should also lead to a
higher demand and realized transactions, conditional on price. Unfortu-
nately, we do not have access to the number of days a given listing was
occupied. We use the number of new reviews between two waves as a
proxy for the volume of transactions. This proxy relies on the assumption
that the number of new reviews is proportional to the number of nights the
property was occupied. More precisely, we build two outcomes: a dummy
for having at least one new review between t and t + 1, and the log of the
number of reviews.
Table 8 presents the results of the regression of these two outcomes on
the log-price (at t), controlling for location and observable characteristics:
columns (1)-(2) for the dummy and (3)-(4) for the log new reviews. In
columns (2) and (4), lagged prices are included in a more flexible manner
(using splines). In all columns, we find that the coefficient of the minority
is close to zero and insignificant. These results suggest minority hosts do
not get more demand than majority hosts, despite the lower prices. The
ethnic price gap does not seem to reflect differences in pricing behavior
induced by differences in outside wages.
29
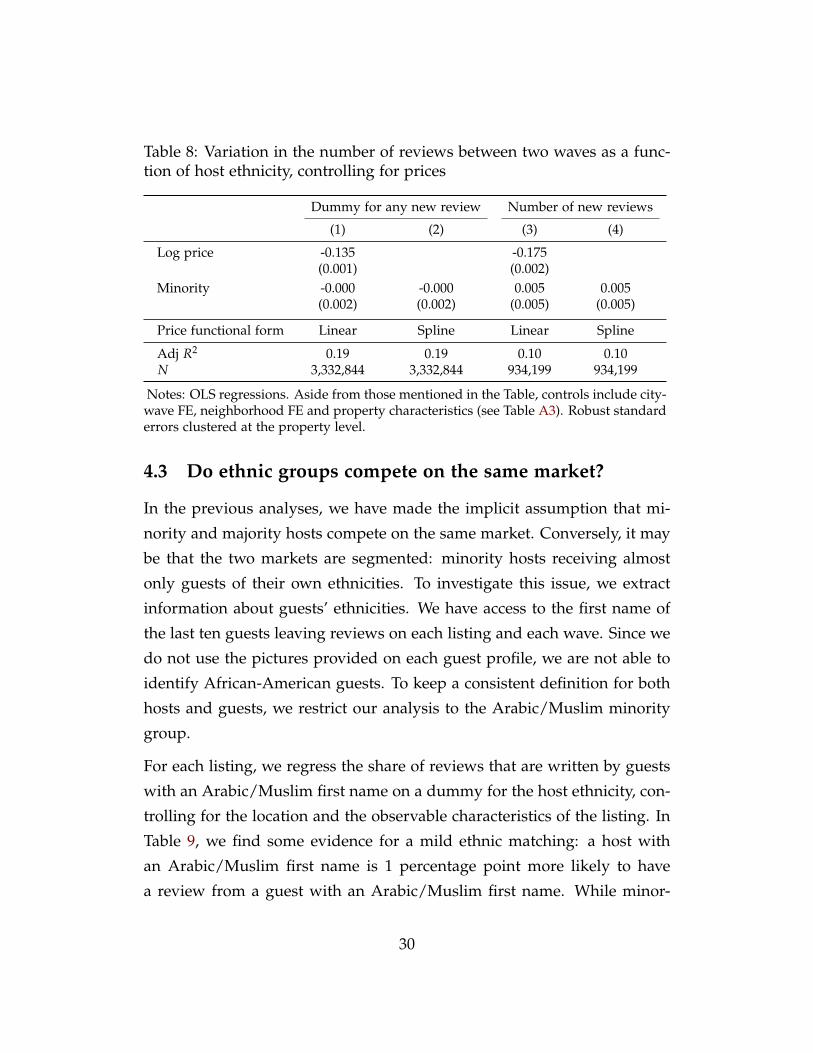
Table 8: Variation in the number of reviews between two waves as a func-tion of host ethnicity, controlling for prices
Dummy for any new review Number of new reviews
(1) (2) (3) (4)
Log price -0.135 -0.175(0.001) (0.002)
Minority -0.000 -0.000 0.005 0.005(0.002) (0.002) (0.005) (0.005)
Price functional form Linear Spline Linear Spline
Adj R2 0.19 0.19 0.10 0.10N 3,332,844 3,332,844 934,199 934,199
Notes: OLS regressions. Aside from those mentioned in the Table, controls include city-wave FE, neighborhood FE and property characteristics (see Table A3). Robust standarderrors clustered at the property level.
4.3 Do ethnic groups compete on the same market?
In the previous analyses, we have made the implicit assumption that mi-
nority and majority hosts compete on the same market. Conversely, it may
be that the two markets are segmented: minority hosts receiving almost
only guests of their own ethnicities. To investigate this issue, we extract
information about guests’ ethnicities. We have access to the first name of
the last ten guests leaving reviews on each listing and each wave. Since we
do not use the pictures provided on each guest profile, we are not able to
identify African-American guests. To keep a consistent definition for both
hosts and guests, we restrict our analysis to the Arabic/Muslim minority
group.
For each listing, we regress the share of reviews that are written by guests
with an Arabic/Muslim first name on a dummy for the host ethnicity, con-
trolling for the location and the observable characteristics of the listing. In
Table 9, we find some evidence for a mild ethnic matching: a host with
an Arabic/Muslim first name is 1 percentage point more likely to have
a review from a guest with an Arabic/Muslim first name. While minor-
30
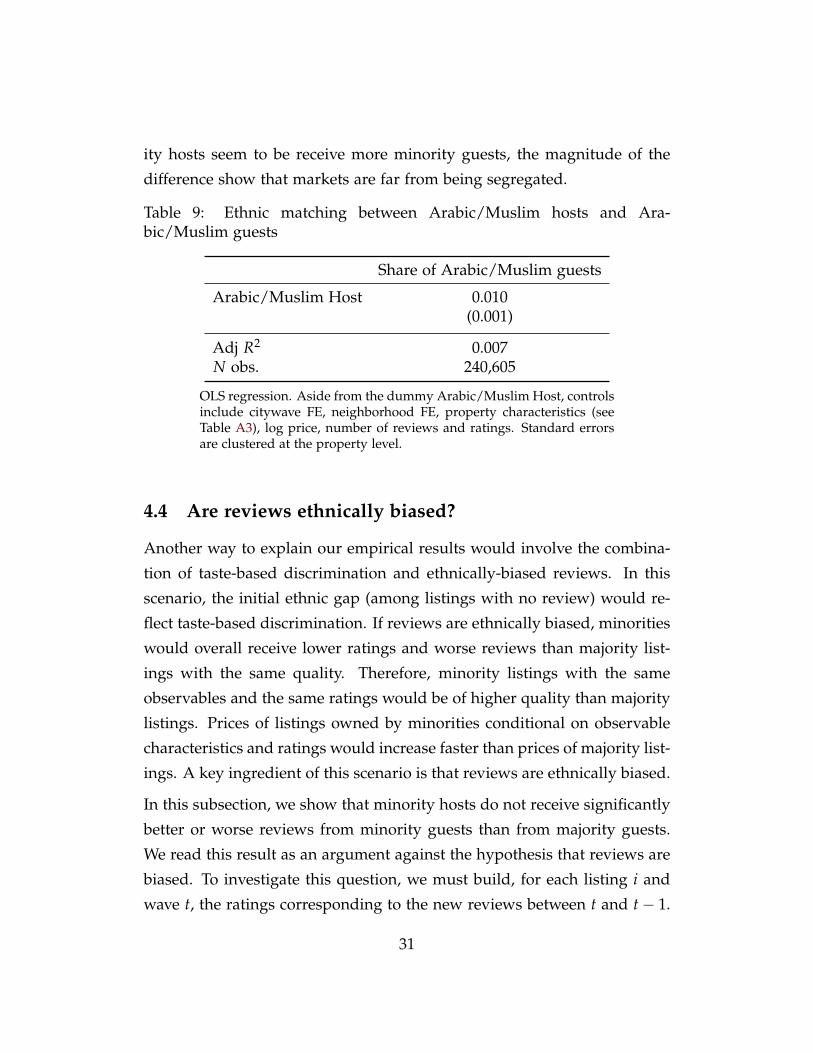
ity hosts seem to be receive more minority guests, the magnitude of the
difference show that markets are far from being segregated.
Table 9: Ethnic matching between Arabic/Muslim hosts and Ara-bic/Muslim guests
Share of Arabic/Muslim guests
Arabic/Muslim Host 0.010(0.001)
Adj R2 0.007N obs. 240,605
OLS regression. Aside from the dummy Arabic/Muslim Host, controlsinclude citywave FE, neighborhood FE, property characteristics (seeTable A3), log price, number of reviews and ratings. Standard errorsare clustered at the property level.
4.4 Are reviews ethnically biased?
Another way to explain our empirical results would involve the combina-
tion of taste-based discrimination and ethnically-biased reviews. In this
scenario, the initial ethnic gap (among listings with no review) would re-
flect taste-based discrimination. If reviews are ethnically biased, minorities
would overall receive lower ratings and worse reviews than majority list-
ings with the same quality. Therefore, minority listings with the same
observables and the same ratings would be of higher quality than majority
listings. Prices of listings owned by minorities conditional on observable
characteristics and ratings would increase faster than prices of majority list-
ings. A key ingredient of this scenario is that reviews are ethnically biased.
In this subsection, we show that minority hosts do not receive significantly
better or worse reviews from minority guests than from majority guests.
We read this result as an argument against the hypothesis that reviews are
biased. To investigate this question, we must build, for each listing i and
wave t, the ratings corresponding to the new reviews between t and t− 1.
31
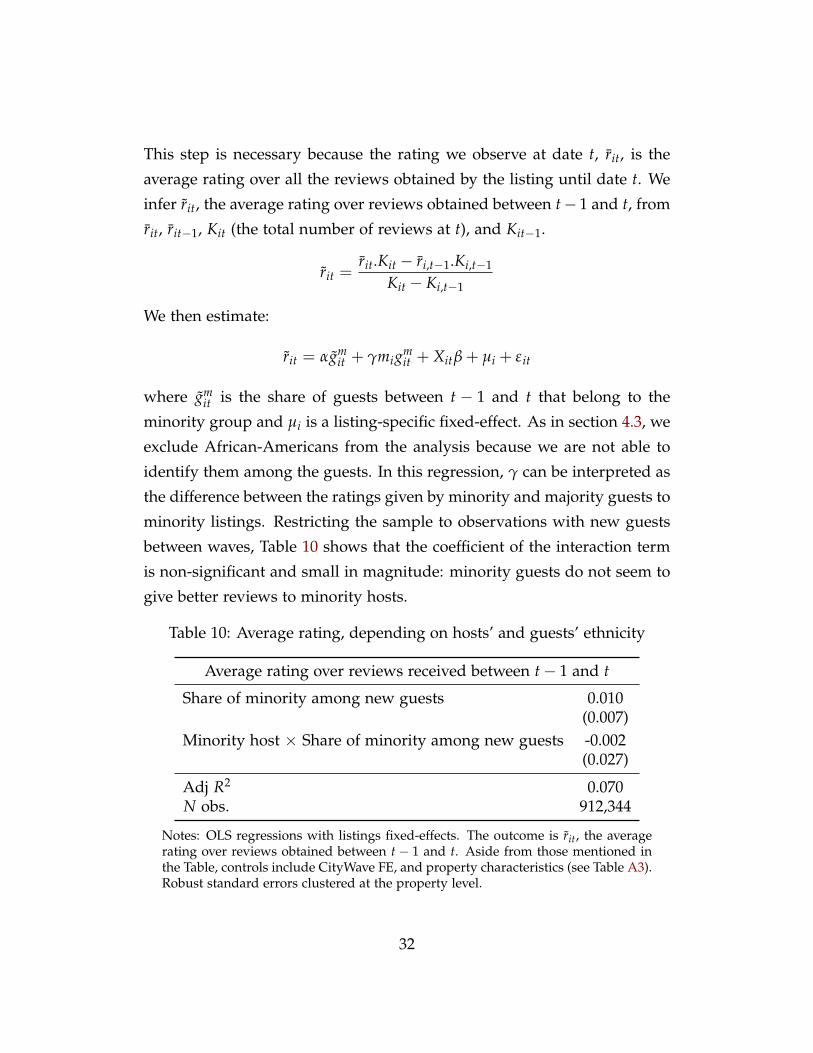
This step is necessary because the rating we observe at date t, rit, is the
average rating over all the reviews obtained by the listing until date t. We
infer rit, the average rating over reviews obtained between t− 1 and t, from
rit, rit−1, Kit (the total number of reviews at t), and Kit−1.
rit =rit.Kit − ri,t−1.Ki,t−1
Kit − Ki,t−1
We then estimate:
rit = αgmit + γmigm
it + Xitβ + µi + εit
where gmit is the share of guests between t − 1 and t that belong to the
minority group and µi is a listing-specific fixed-effect. As in section 4.3, we
exclude African-Americans from the analysis because we are not able to
identify them among the guests. In this regression, γ can be interpreted as
the difference between the ratings given by minority and majority guests to
minority listings. Restricting the sample to observations with new guests
between waves, Table 10 shows that the coefficient of the interaction term
is non-significant and small in magnitude: minority guests do not seem to
give better reviews to minority hosts.
Table 10: Average rating, depending on hosts’ and guests’ ethnicity
Average rating over reviews received between t− 1 and t
Share of minority among new guests 0.010(0.007)
Minority host × Share of minority among new guests -0.002(0.027)
Adj R2 0.070N obs. 912,344
Notes: OLS regressions with listings fixed-effects. The outcome is rit, the averagerating over reviews obtained between t− 1 and t. Aside from those mentioned inthe Table, controls include CityWave FE, and property characteristics (see Table A3).Robust standard errors clustered at the property level.
32
4.5 Ethnic differences in property upgrading
If minority hosts reacted to the lower demand by improving the quality of
their listing, we would also observe that minority prices increase faster than
majority ones. We use the information about the observable characteristics
of listings and test whether minority hosts tend to change these observables
in a way that improves the perceived quality of their listing. First, we
estimate a hedonic price regression: we regress the log-price on property
characteristics, controlling for neighborhood and city-wave fixed effects.
We use the estimated coefficients of this regression to predict the log-price
corresponding to all properties for each period, pit. Then, we regress the
difference pi,t+1 − pi,t of the prediction between two waves on a minority
dummy, controlling for property characteristics, neighborhood and city-
wave fixed effects. The estimated coefficient on the minority dummy is
smaller than .0001, with a T-statistic around 1. This result suggests than
minority hosts are not significantly more likely to upgrade their properties,
everything else equal.
5 Conclusion
This paper documents that, in a popular online platform of short-term
rentals, hosts belonging to an ethnic minority experience a 3.2% price
penalty when differences in locations and observable characteristics are
accounted for. Taking advantage of the longitudinal nature of our data, we
show that statistical discrimination can be considered as the main driver of
the ethnic price gap. At least three quarters (2.5 percentage points) of the
initial gap can be explained by statistical discrimination. Half of these 2.5
percentage points can be accounted for by differences in the expectations
between the unobservable quality in the two groups, while half may be
due to erroneous beliefs about the distribution of the unobservables of the
minority group.
33
We can draw several conclusions from this findings. First, aside from the
issues inherent to any online feedback system, the one featured by this
online platform is effective in supplying useful information to potential
guests. In the absence of such a feedback system, the ethnic price gap
would be higher than its current value. Second, beside the gains in ef-
ficiency, improving the feedback system would also contribute to reduce
ethnic price gaps.
We believe that the evidence provided in this paper is relevant to the cur-
rent debate about discrimination on online platforms. While there is no
reason to make ethnicity particularly salient on these platforms, the avenue
consisting in concealing more information about actors’ identity is likely
to backfire if ethnic gaps are due to statistical discrimination. We see our
results as advocating another way to reduce ethnic gaps: disclosing more
abundant and more reliable information about candidates, sellers or hosts.
As discussed by Shaw et al. (2011), it remains to understand how platforms
can adequately incentivize reviewers to provide informative, unbiased and
relevant reviews. Further research is required to understand how interven-
tions on information disclosure affects ethnic gaps.
There is no reason to believe that the results of the paper can be directly
extended to other platforms or markets. However, we see our results as
consistent with those obtained by Pallais (2014) and Agrawal et al. (2016)
on the online platform ODesk (now Upwork). Pallais (2014) finds that
providing public information about workers’ abilities has, on average, a
positive effect on workers’ probability to be hired. Agrawal et al. (2016)
find that standardized information about work performed on the platform
disproportionately benefits less-developed-country contractors, relative to
developed-country ones. The approach we follow in this paper may be
adapted to study ethnic discrimination on several other widely-used online
platforms, including labor markets.
34
References
Agrawal, Ajay, Nicola Lacetera, and Elizabeth Lyons, “Does standardized
information in online markets disproportionately benefit job applicants
from less developed countries?,” Journal of International Economics, 2016,
103, 1–12.
Aigner, Dennis J. and Glen G. Cain, “Statistical Theories of Discrimination
in Labor Markets,” Industrial and Labor Relations Review, January 1977, 30
(2), 175–187.
Altonji, Joseph G. and Charles R. Pierret, “Employer Learning And Statis-
tical Discrimination,” The Quarterly Journal of Economics, February 2001,
116 (1), 313–350.
Antonovics, Kate, Peter Arcidiacono, and Randall Walsh, “Games and
Discrimination: Lessons from The Weakest Link’,” Journal of Human Re-
sources, Fall 2005, 40 (4), 918–947.
Anwar, Shamena, “Testing for discrimination: Evidence from the game
show Street Smarts,” Journal of Economic Behavior & Organization, 2012, 81
(1), 268–285.
Arrow, Kenneth J., “The Theory of Discrimination,” in O. Ashenfelter and
A. Rees, eds., Discrimination in Labor Markets, Princeton University Press,
1973, pp. 3–33.
Autor, David H., “Wiring the Labor Market,” Journal of Economic Perspec-
tives, Winter 2001, 15 (1), 25–40.
, The Economics of Labor Market Intermediation: An Analytic Framework,
University of Chicago Press, 2009.
and David Scarborough, “Does Job Testing Harm Minority Workers?
Evidence from Retail Establishments,” The Quarterly Journal of Economics,
02 2008, 123 (1), 219–277.
Bagues, Manuel F. and Mauro Sylos Labini, “Do Online Labor Market
Intermediaries Matter? The Impact of AlmaLaurea on the University-to-
Work Transition,” in “Studies of Labor Market Intermediation” NBER
35
Chapters, National Bureau of Economic Research, Inc, June 2009,
pp. 127–154.
Bayer, Patrick, Marcus D. Casey, Fernando Ferreira, and Robert McMil-
lan, “Estimating Racial Price Differentials in the Housing Market,”
NBER Working Papers 18069, National Bureau of Economic Research,
Inc May 2012.
Becker, Gary, The Economics of discrimination, Chicago University Press,
Chicago, Reprint 1971, 1957.
Behaghel, Luc, Bruno Crepon, and Thomas Le Barbanchon, “Unintended
Effects of Anonymous Resumes,” American Economic Journal: Applied Eco-
nomics, July 2015, 7 (3), 1–27.
Bertrand, Marianne and Sendhil Mullainathan, “Are Emily and Greg
More Employable Than Lakisha and Jamal? A Field Experiment on La-
bor Market Discrimination,” American Economic Review, September 2004,
94 (4), 991–1013.
Brown, Meta, Elizabeth Setren, and Giorgio Topa, “Do Informal Refer-
rals Lead to Better Matches? Evidence from a Firms Employee Referral
System,” Journal of Labor Economics, 2016, 34 (1), 161–209.
Castillo, Marco and Ragan Petrie, “Discrimination in the lab: Does infor-
mation trump appearance?,” Games and Economic Behavior, January 2010,
68 (1), 5059.
Charles, Kerwin Kofi and Jonathan Guryan, “Prejudice and Wages: An
Empirical Assessment of Becker’s The Economics of Discrimination,”
Journal of Political Economy, October 2008, 116 (5), 773–809.
and , “Studying Discrimination: Fundamental Challenges and Recent
Progress,” Annual Review of Economics, 09 2011, 3 (1), 479–511.
Edelman, Benjamin and Michael Luca, “Digital Discrimination: The Case
of Airbnb.com,” Harvard Business School Working Papers 14-054, Har-
vard Business School 2014.
36
Edelman, Benjamin G., Michael Luca, and Dan Svirsky, “Racial Discrim-
ination in the Sharing Economy: Evidence from a Field Experiment,”
American Economic Journal: Applied Economics, Forthcoming.
Ewens, Michael, Bryan Tomlin, and Liang Choon Wang, “Statistical Dis-
crimination or Prejudice? A Large Sample Field Experiment,” The Review
of Economics and Statistics, March 2014, 96 (1), 119–134.
Farber, Henry S and Robert Gibbons, “Learning and Wage Dynamics,”
The Quarterly Journal of Economics, November 1996, 111 (4), 1007–47.
Fershtman, Chaim and Uri Gneezy, “Discrimination In A Segmented So-
ciety: An Experimental Approach,” The Quarterly Journal of Economics,
February 2001, 116 (1), 351–377.
Fradkin, Andrey, “Search, Matching, and the Role of Digital Marketplace
Design in Enabling Trade: Evidence from Airbnb,” 2017. mimeo.
, Elena Grewal, and David Holtz, “The Determinants of Online Review
Informativeness: Evidence from Field Experiments on Airbnb,” 2017.
mimeo.
Hawramani, Ikram, The Arabic Baby Name Book: More Than 5000 Names for
Boys and Girls, Kindle, 2015.
Heckman, James J., “Detecting Discrimination,” Journal of Economic Per-
spectives, 1998, 12 (2), 101–116.
Horton, John J., “The Effects of Algorithmic Labor Market Recommen-
dations: Evidence from a Field Experiment,” 2016. forthcoming in the
Journal of Labor Economics.
Jouniaux, Leo, Les 20,000 plus beaux prenoms du monde, Hachette eds., 2001.
Knowles, John, Nicola Persico, and Petra Todd, “Racial Bias in Motor Ve-
hicle Searches: Theory and Evidence,” Journal of Political Economy, Febru-
ary 2001, 109 (1), 203–232.
Lang, Kevin and Jee-Yeon K. Lehmann, “Racial Discrimination in the La-
bor Market: Theory and Empirics,” Journal of Economic Literature, 2012,
50 (4), 959–1006.
37
Levitt, Steven D., “Testing Theories of Discrimination: Evidence From
Weakest Link,” Journal of Law and Economics, October 2004, 47, 431–452.
List, John A., “The Nature and Extent of Discrimination in the Mar-
ketplace: Evidence from the Field,” The Quarterly Journal of Economics,
February 2004, 119 (1), 49–89.
Oreopoulos, Philip, “Why Do Skilled Immigrants Struggle in the Labor
Market? A Field Experiment with Thirteen Thousand Resumes,” Ameri-
can Economic Journal: Economic Policy, November 2011, 3 (4), 148–71.
Pallais, Amanda, “Inefficient Hiring in Entry-Level Labor Markets,” Amer-
ican Economic Review, November 2014, 104 (11), 3565–99.
and Emily Glassberg Sands, “Why the Referential Treatment? Evidence
from Field Experiments on Referals,” 2015. forthcoming in the Journal
of Political Economy.
Phelps, Edmund S., “The Statistical Theory of Racism and Sexism,” Amer-
ican Economic Review, 1972, 62 (4), 659–661.
Pope, Devin G. and Justin R. Sydnor, “Whats in a Picture?: Evidence of
Discrimination from Prosper.com,” Journal of Human Resources, 2011, 46
(1), 53–92.
Rubinstein, Yona and Dror Brenner, “Pride and Prejudice: Using Ethnic-
Sounding Names and Inter-Ethnic Marriages to Identify Labour Market
Discrimination,” Review of Economic Studies, 2014, 81 (1), 389–425.
Shaw, Aaron D., John J. Horton, and Daniel D. Chen, “Designing Incen-
tives for Inexpert Human Raters,” in Jakob Bardham and Nicolas Duch-
eneaut, eds., Proceedings of the ACM Conference of Computer Supported Co-
operative Work (ACM-CSCW), ACM March 2011, pp. 275–284.
Stanton, Christopher T. and Catherine Thomas, “Information Frictions
and Observable Experience: The New Employer Price Premium in an
Online Market,” 2015. mimeo.
38

Wozniak, Abigail K., “Discrimination and the Effects of Drug Testing on
Black Employment,” Review of Economics and Statistics, 2015, 97 (3), 548–
566.
Zussman, Asaf, “Ethnic Discrimination: Lessons from the Israeli Online
Market for Used Cars,” Economic Journal, November 2013, 123 (11), F433–
F468.
39

For Online Publication
A Online Platform
A.1 Example of listing
40

41

A.2 Peer-reviewing System
42
B Data
Table A1: Number of observations by city
City Obs Share
Amsterdam 135,292 3.93
Barcelona 229,999 6.68
Berlin 209,652 6.09
Boston 51,705 1.50
Chicago 51,698 1.50
Florence 85,174 2.48
London 369,168 10.73
Los Angeles 209,857 6.10
Madrid 92,731 2.69
Marseille 86,077 2.50
Miami 90,726 2.64
Milan 131,603 3.82
Montreal 104,726 3.04
New-York 474,402 13.79
Paris 639,664 18.59
Rome 204,847 5.95
San-Francisco 132,227 3.84
Toronto 81,545 2.37
Vancouver 59,856 1.74
43

Table A2: Collection dates of waves
Wave Collection date
0 15 June 2014
1 8 July 2014
2 28 July 2014
3 11 August 2014
4 25 August 2014
5 8 September 2014
6 25 September 2014
7 15 October 2014
8 5 November 2014
9 25 November 2014
10 15 December 2014
11 7 January 2015
12 13 January 2015
13 3 February 2015
14 4 March 2015
15 25 March 2015
16 13 April 2015
17 4 May 2015
18 26 May 2015
19 15 June 2015
44
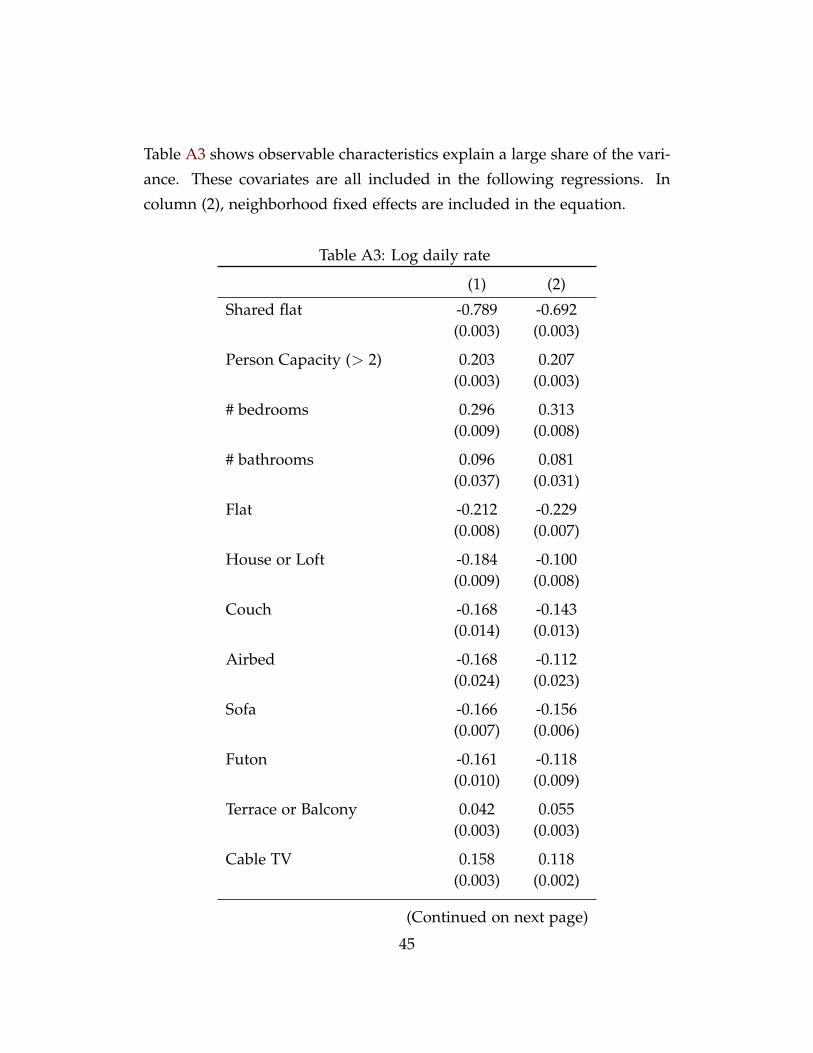
Table A3 shows observable characteristics explain a large share of the vari-
ance. These covariates are all included in the following regressions. In
column (2), neighborhood fixed effects are included in the equation.
Table A3: Log daily rate
(1) (2)
Shared flat -0.789 -0.692(0.003) (0.003)
Person Capacity (> 2) 0.203 0.207(0.003) (0.003)
# bedrooms 0.296 0.313(0.009) (0.008)
# bathrooms 0.096 0.081(0.037) (0.031)
Flat -0.212 -0.229(0.008) (0.007)
House or Loft -0.184 -0.100(0.009) (0.008)
Couch -0.168 -0.143(0.014) (0.013)
Airbed -0.168 -0.112(0.024) (0.023)
Sofa -0.166 -0.156(0.007) (0.006)
Futon -0.161 -0.118(0.010) (0.009)
Terrace or Balcony 0.042 0.055(0.003) (0.003)
Cable TV 0.158 0.118(0.003) (0.002)
(Continued on next page)
45
Table A3: Log daily rate
Wireless -0.029 -0.044(0.005) (0.004)
Heating -0.056 -0.044(0.005) (0.004)
AC 0.163 0.139(0.004) (0.003)
Elevator 0.099 0.088(0.003) (0.003)
Wheelchair Accessible -0.039 -0.012(0.004) (0.004)
Doorman 0.118 0.056(0.005) (0.004)
Fireplace 0.173 0.134(0.005) (0.005)
Washer -0.045 -0.012(0.003) (0.003)
Dryer 0.162 0.116(0.003) (0.003)
Parking -0.126 0.010(0.003) (0.003)
Gym 0.068 0.064(0.006) (0.006)
Pool 0.121 0.132(0.007) (0.006)
Buzzer 0.032 -0.001(0.002) (0.002)
Hot Tub 0.021 0.016(0.005) (0.005)
(Continued on next page)
46
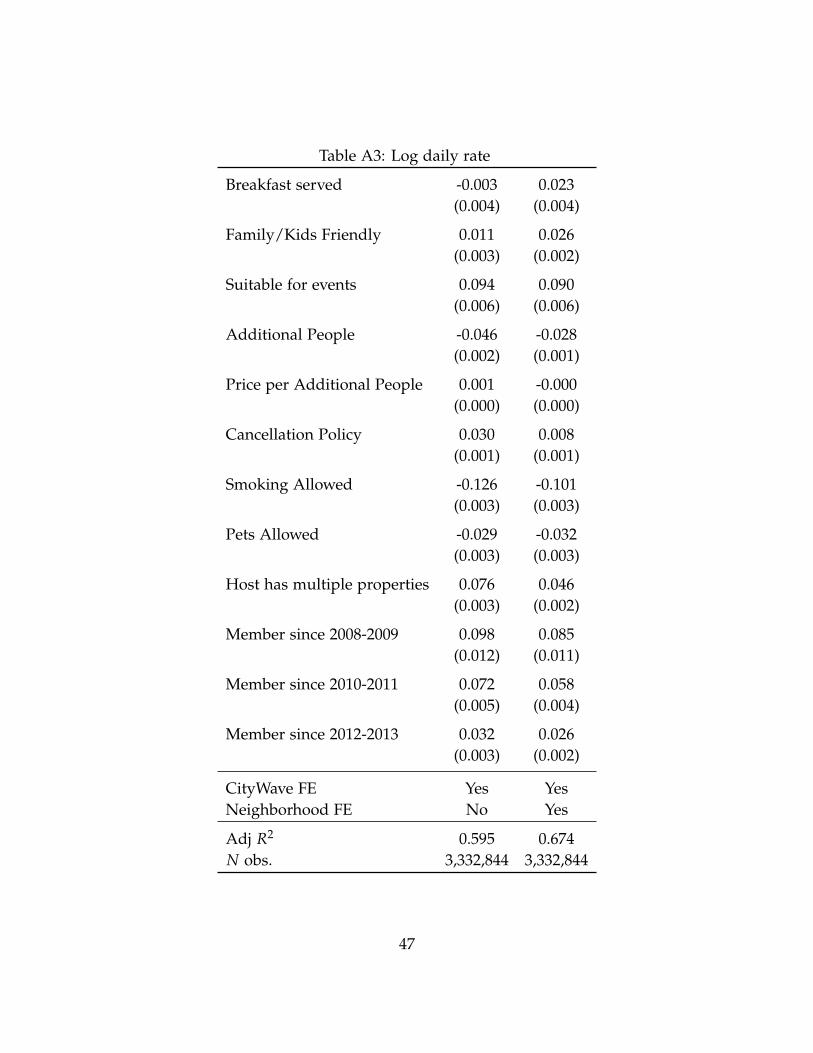
Table A3: Log daily rate
Breakfast served -0.003 0.023(0.004) (0.004)
Family/Kids Friendly 0.011 0.026(0.003) (0.002)
Suitable for events 0.094 0.090(0.006) (0.006)
Additional People -0.046 -0.028(0.002) (0.001)
Price per Additional People 0.001 -0.000(0.000) (0.000)
Cancellation Policy 0.030 0.008(0.001) (0.001)
Smoking Allowed -0.126 -0.101(0.003) (0.003)
Pets Allowed -0.029 -0.032(0.003) (0.003)
Host has multiple properties 0.076 0.046(0.003) (0.002)
Member since 2008-2009 0.098 0.085(0.012) (0.011)
Member since 2010-2011 0.072 0.058(0.005) (0.004)
Member since 2012-2013 0.032 0.026(0.003) (0.002)
CityWave FE Yes YesNeighborhood FE No Yes
Adj R2 0.595 0.674N obs. 3,332,844 3,332,844
47
Notes: OLS regression on the daily log-price. Robust standard errors
clustered at the property level.
Table A4: Distribution of the last rating
Obs Share
3.5 stars 8,796 4.18%
4 stars 25,505 12.12%
4.5 stars 72,209 34.33%
5 stars 103,845 49.37%
Sample: Listings for which last rating is observed.
48
C Results including Hispanics
In this section, we show the main results including Hispanics in the minor-
ity group.
Table A5: Share of Hispanics
Sample size Share
Majority 3,157,357 91.76%
Hispanics (US/Can) 103,351 3.00%.
Table A6: Ethnic price gap, for several segments of the number of reviews
Log daily rate
(1) (2) (3) (4) (5)
Minority -0.035 -0.028 -0.019 -0.013 -0.011
(0.006) (0.005) (0.006) (0.009) (0.014)
Nb reviews 0 1-4 5-19 20-49 50+
Minority share 8.0% 8.2% 8.4% 8.5% 8.6%
Adj R2 0.64 0.72 0.76 0.77 0.77
N obs. 1,035,731 959,097 830,436 353,160 154,420
Notes: OLS regressions of the daily log-price on the minority dummy, controlling
for property characteristics and ratings (for properties with at least one review).
See the list of all property and host characteristics in Table A3. Robust standard
errors clustered at the property level.
Estimates (Bootstrap Std. Err.) :
bm = -0.013 (0.004)
ρ = 9 (0.3)
49
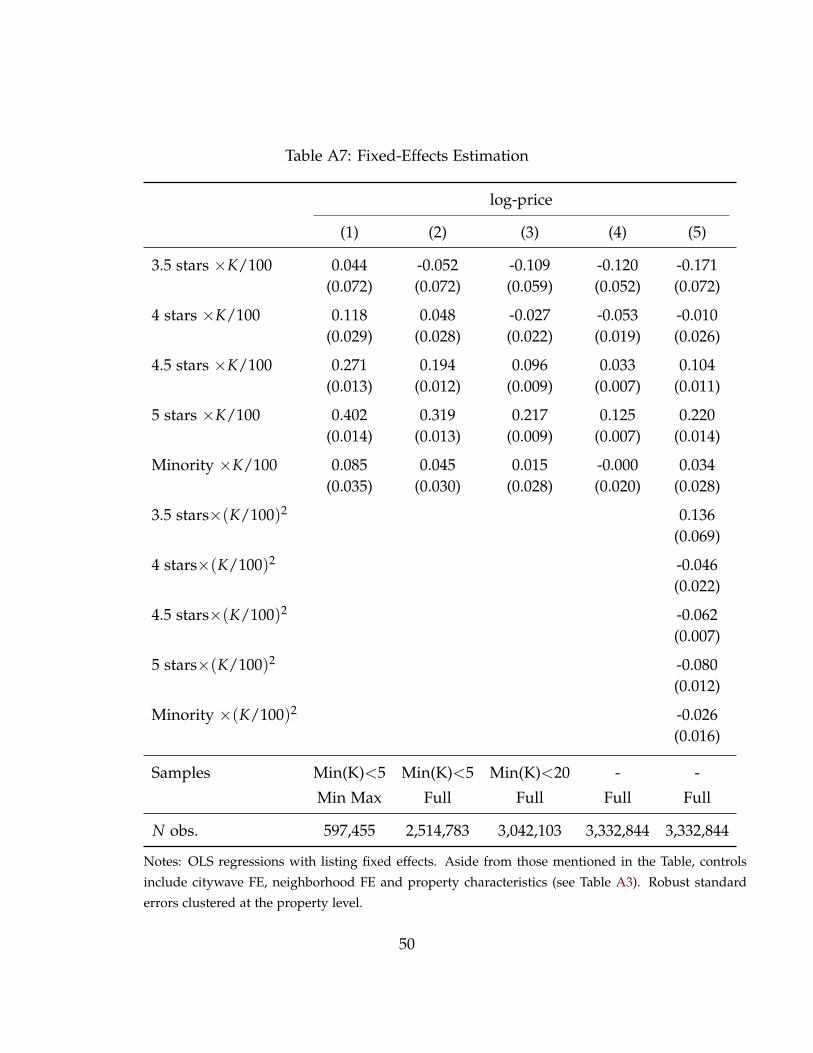
Table A7: Fixed-Effects Estimation
log-price
(1) (2) (3) (4) (5)
3.5 stars ×K/100 0.044 -0.052 -0.109 -0.120 -0.171(0.072) (0.072) (0.059) (0.052) (0.072)
4 stars ×K/100 0.118 0.048 -0.027 -0.053 -0.010(0.029) (0.028) (0.022) (0.019) (0.026)
4.5 stars ×K/100 0.271 0.194 0.096 0.033 0.104(0.013) (0.012) (0.009) (0.007) (0.011)
5 stars ×K/100 0.402 0.319 0.217 0.125 0.220(0.014) (0.013) (0.009) (0.007) (0.014)
Minority ×K/100 0.085 0.045 0.015 -0.000 0.034(0.035) (0.030) (0.028) (0.020) (0.028)
3.5 stars×(K/100)2 0.136(0.069)
4 stars×(K/100)2 -0.046(0.022)
4.5 stars×(K/100)2 -0.062(0.007)
5 stars×(K/100)2 -0.080(0.012)
Minority ×(K/100)2 -0.026(0.016)
Samples Min(K)<5 Min(K)<5 Min(K)<20 - -
Min Max Full Full Full Full
N obs. 597,455 2,514,783 3,042,103 3,332,844 3,332,844
Notes: OLS regressions with listing fixed effects. Aside from those mentioned in the Table, controls
include citywave FE, neighborhood FE and property characteristics (see Table A3). Robust standard
errors clustered at the property level.
50

D Using a non-normal prior distribution of qual-
ity with a discrete signal
Assume that ν ∼ B(αν, βν) (a Beta distribution). A Beta distribution looks
more similar to the measures of quality that we have empirically: it is
bounded and can be really skewed.
A single rating being a discrete signal, let’s assume that we can model it as
a draw in a Binomial(n, ν), where n depends on how much information a
single rating contains (to what extent it is discrete). A rating takes values
in 0 . . . n.
The pdf of the posterior distribution, given the observation of a rating r
can be written as:
f (ν|r) = P(r|ν) f (ν)∫P(r|ν) f (ν)dν
Working on the numerator, we have:
P(r|ν) f (ν) =(
nr
)νr(1− ν)n−rναν−1(1− ν)βν−1
B(αν, βν)
where B(., .) is the beta function. This simplifies to:
P(r|ν) f (ν) =(
nr
)ναν−1+r(1− ν)βν−1+n−r
B(αν, βν)
Because f (ν|r) is a density, we know it is of integral one and thus should
be equal to the density of a B(αν + r, βν + n− r). We can also prove it by
computing the integral of P(r|ν) f (ν) wrt ν and computing f (ν|r) explicitly.
The expectation of ν conditional on r is therefore equal to:
E(ν|r) = αν + rαν + βν + n
Now, suppose that we have K signals instead of just one. I also rescale the
signal between 0 and 1 (which is the range of ν) and define r = ∑k rk/(nK),
51

αν = αν/n and βν = βν/n. We can show that the expectation depends only
on r:
E(ν|r, K) =αν + Kr
αν + βν + K
Dividing everything by n rescales the signal between 0 and 1 (which is the
range of ν) and we obtain an expression which is exactly identical, up to
a change in notations, to the one with normal distributions, which looked
like this:
E(ν|r, K, m) =ρν + Krρ + K
52
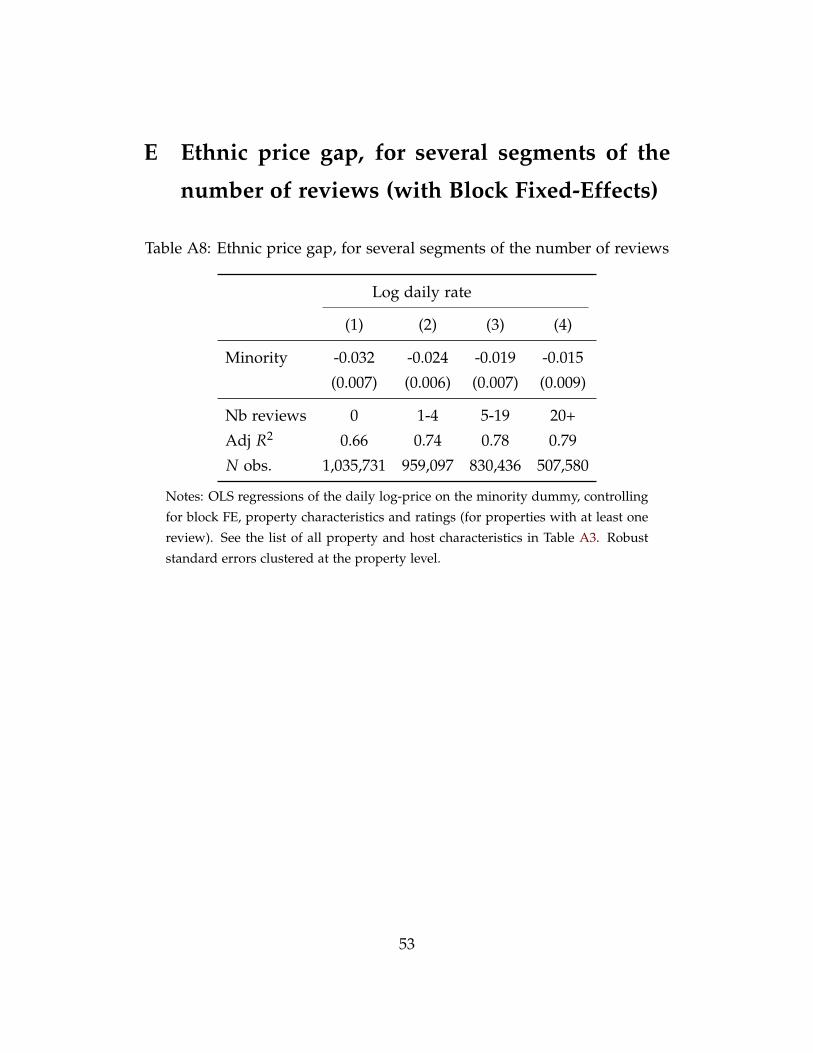
E Ethnic price gap, for several segments of the
number of reviews (with Block Fixed-Effects)
Table A8: Ethnic price gap, for several segments of the number of reviews
Log daily rate
(1) (2) (3) (4)
Minority -0.032 -0.024 -0.019 -0.015
(0.007) (0.006) (0.007) (0.009)
Nb reviews 0 1-4 5-19 20+
Adj R2 0.66 0.74 0.78 0.79
N obs. 1,035,731 959,097 830,436 507,580
Notes: OLS regressions of the daily log-price on the minority dummy, controlling
for block FE, property characteristics and ratings (for properties with at least one
review). See the list of all property and host characteristics in Table A3. Robust
standard errors clustered at the property level.
53
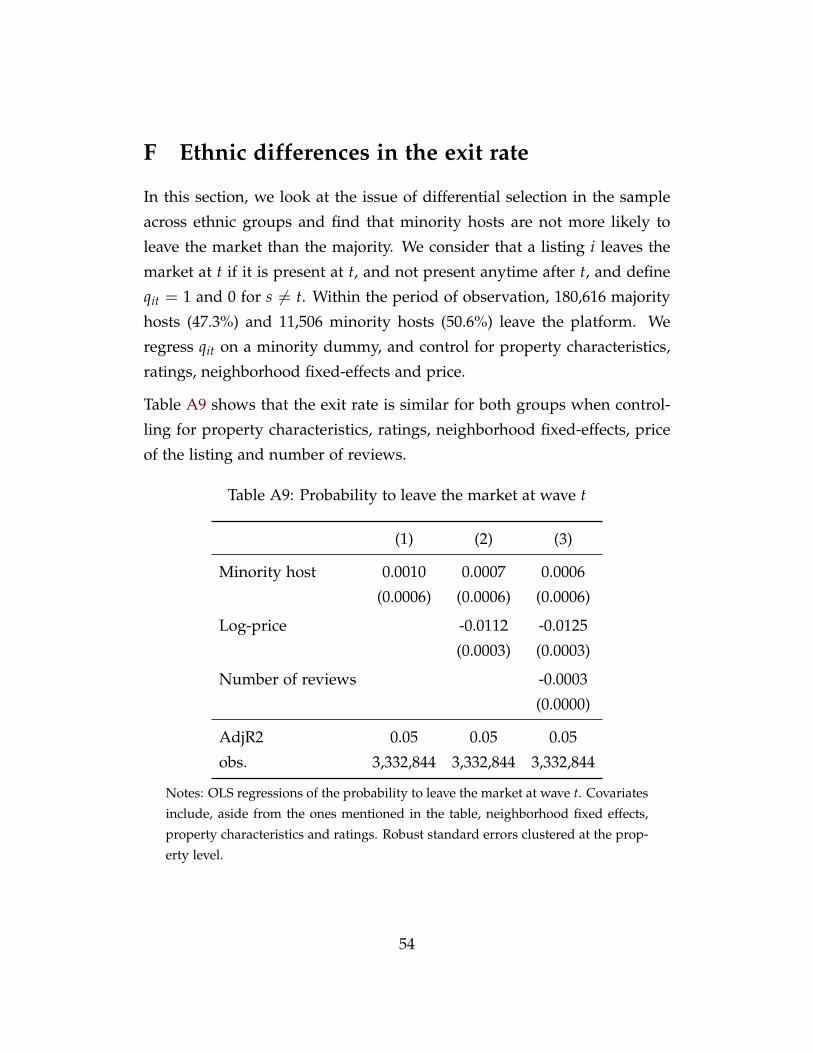
F Ethnic differences in the exit rate
In this section, we look at the issue of differential selection in the sample
across ethnic groups and find that minority hosts are not more likely to
leave the market than the majority. We consider that a listing i leaves the
market at t if it is present at t, and not present anytime after t, and define
qit = 1 and 0 for s 6= t. Within the period of observation, 180,616 majority
hosts (47.3%) and 11,506 minority hosts (50.6%) leave the platform. We
regress qit on a minority dummy, and control for property characteristics,
ratings, neighborhood fixed-effects and price.
Table A9 shows that the exit rate is similar for both groups when control-
ling for property characteristics, ratings, neighborhood fixed-effects, price
of the listing and number of reviews.
Table A9: Probability to leave the market at wave t
(1) (2) (3)
Minority host 0.0010 0.0007 0.0006
(0.0006) (0.0006) (0.0006)
Log-price -0.0112 -0.0125
(0.0003) (0.0003)
Number of reviews -0.0003
(0.0000)
AdjR2 0.05 0.05 0.05
obs. 3,332,844 3,332,844 3,332,844
Notes: OLS regressions of the probability to leave the market at wave t. Covariates
include, aside from the ones mentioned in the table, neighborhood fixed effects,
property characteristics and ratings. Robust standard errors clustered at the prop-
erty level.
54
G Results on sub-samples
We check the robustness of our results by running some of the analy-
ses on several sub-samples. First, we can split the analysis by minority
groups (Arabic/Muslims and African-Americans), by continent (Europe
and US/Canada) and by type of flats (entire and shared).
Tables A10 and A11 report the results of these robustness checks. For each
sample or specification, Panel A shows the unexplained price gap on the
sample of properties with no review. According to our model, the ethnic
price gap is maximum at zero review and decreases once information is
revealed. Panel B shows the result of the estimation of the constrained
model. In most cases, the point estimate of bm is of the same magnitude as
the ethnic price gap for non-reviewed listings.
55
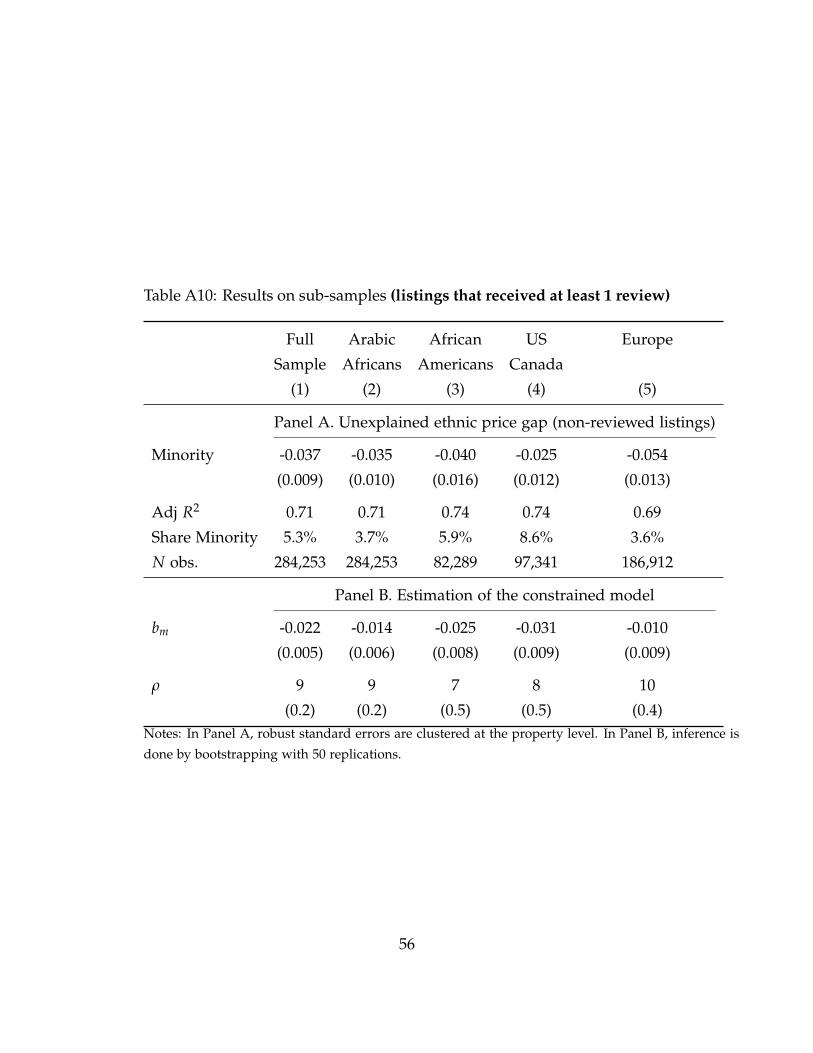
Table A10: Results on sub-samples (listings that received at least 1 review)
Full Arabic African US Europe
Sample Africans Americans Canada
(1) (2) (3) (4) (5)
Panel A. Unexplained ethnic price gap (non-reviewed listings)
Minority -0.037 -0.035 -0.040 -0.025 -0.054
(0.009) (0.010) (0.016) (0.012) (0.013)
Adj R2 0.71 0.71 0.74 0.74 0.69
Share Minority 5.3% 3.7% 5.9% 8.6% 3.6%
N obs. 284,253 284,253 82,289 97,341 186,912
Panel B. Estimation of the constrained model
bm -0.022 -0.014 -0.025 -0.031 -0.010
(0.005) (0.006) (0.008) (0.009) (0.009)
ρ 9 9 7 8 10
(0.2) (0.2) (0.5) (0.5) (0.4)Notes: In Panel A, robust standard errors are clustered at the property level. In Panel B, inference is
done by bootstrapping with 50 replications.
56
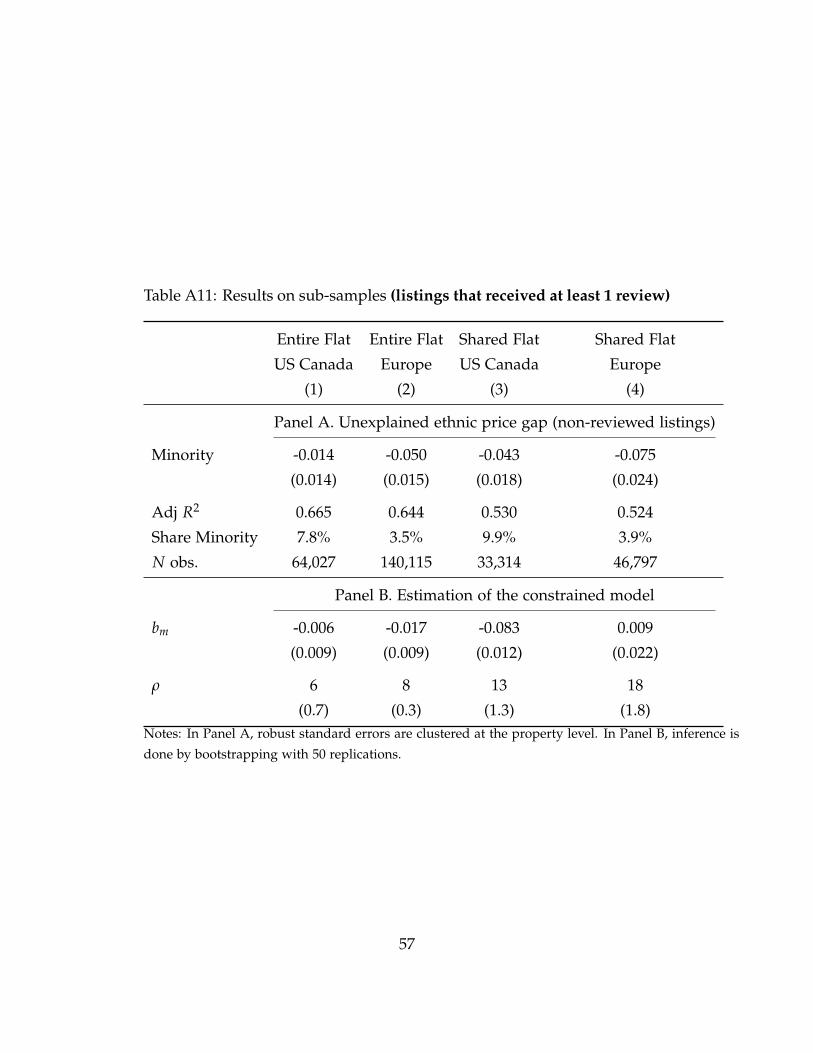
Table A11: Results on sub-samples (listings that received at least 1 review)
Entire Flat Entire Flat Shared Flat Shared Flat
US Canada Europe US Canada Europe
(1) (2) (3) (4)
Panel A. Unexplained ethnic price gap (non-reviewed listings)
Minority -0.014 -0.050 -0.043 -0.075
(0.014) (0.015) (0.018) (0.024)
Adj R2 0.665 0.644 0.530 0.524
Share Minority 7.8% 3.5% 9.9% 3.9%
N obs. 64,027 140,115 33,314 46,797
Panel B. Estimation of the constrained model
bm -0.006 -0.017 -0.083 0.009
(0.009) (0.009) (0.012) (0.022)
ρ 6 8 13 18
(0.7) (0.3) (1.3) (1.8)Notes: In Panel A, robust standard errors are clustered at the property level. In Panel B, inference is
done by bootstrapping with 50 replications.
57