Co-fermentation using Recombinant Saccharomyces cerevisiae ...

APPLIED AND ENVIRONMENTAL MICROBIOLOGY, June 1987, p. 1286-1291 Vol. 53, No. 60099-2240/87/061286-06$02.00/0Copyright ©3 1987, American Society for Microbiology
Ethanol Production during Batch Fermentation with Saccharomycescerevisiae: Changes in Glycolytic Enzymes and Internal pH
K. M. DOMBEK AND L. 0. INGRAM*Department of Microbiology and Cell Science, University of Florida, Gainesville, Florida 32611
Received 12 January 1987/Accepted 26 March 1987
During batch fermentation, the rate of ethanol production per milligram of cell protein is maximal for a briefperiod early in this process and declines progressively as ethanol accumulates in the surrounding broth. Ourstudies demonstrate that the removal of this accumulated ethanol does not immediately restore fermentativeactivity, and they provide evidence that the decline in metabolic rate is due to physiological changes (includingpossible ethanol damage) rather than to the presence of ethanol. Several potential causes for the decline infermentative activity have been investigated. Viability remained at or above 90%, internal pH remained nearneutrality, and the specific activities of the glycolytic and alcohologenic enzymes (measured in vitro) remainedhigh throughout batch fermentation. None of these factors appears to be causally related to the fall infermentative activity during batch fermentation.
Saccharomyces cerevisiae is used extensively in batchfermentations to convert sugars to ethanol for the productionof beverages and biofuels. Despite the obvious importanceof this process, the physiological constraints which limit therate of glycolysis and ethanol production are not fullyunderstood (7, 15, 23). Identification of these constraintsrepresents an important step toward the development ofimproved organisms and process conditions for more rapidethanol production. Such improvements could result in anincrease in the ethanol production capacity of existingfermentation plants and a reduction in the cost of futurefacilities.
S. cerevisiae is capable of very rapid rates of glycolysisand ethanol production under optimal conditions, producingover 50 mmol of ethanol per h per g of cell protein (11, 12).However, this high rate is maintained for only a brief periodduring batch fermentation and declines progressively asethanol accumulates in the surrounding broth (7, 15, 23).Earlier studies have identified a requirement for lipids (2, 8,26) or molecular oxygen for lipid biosynthesis (1, 4, 5) inmany fermentation broths as being essential for the mainte-nance of high fermentative activity. Magnesium is an essen-tial cofactor for many of the glycolytic enzymes and has alsobeen identified as a limiting nutrient in fermentation brothcontaining peptone and yeast extract (11, 12). Supplyingthese nutritional needs reduces but does not eliminate thedecline in fermentative activity during batch fermentation.The basis for the decline in fermentation rate is not fully
understood. Since the addition of ethanol to cells in batchcultures and in chemostats causes a dose-dependent inhibi-tion of ethanol production (7, 11, 12), most investigationshave focused on ethanol as an inhibitor (7, 15, 22). Ethanolis known to alter membrane permeability and disrupt mem-brane function in a variety of biological systems (7, 15). Inyeasts, ethanol causes an increase in hydrogen ion fluxacross the plasma membrane of cells suspended in water (6).This increased hydrogen ion flux has been proposed as beingresponsible for the ethanol-induced decline in transport ratesobserved under similar conditions (2, 17-19).
* Corresponding author.
Evidence has been accumulating which indicates that thepresence of ethanol may not be the only factor responsiblefor the decline in fermentative activity. The replacement offermentative broth containing ethanol with fresh mediumlacking ethanol did not immediately restore fermentativeactivity (11). In a comprehensive study, Millar et al. (22)demonstrated that concentrations of ethanol below 12%(vol/vol) do not denature glycolytic enzymes or cause appre-ciable inhibition of activity in vitro under substrate-saturating conditions. Since ethanol does not accumulatewithin yeast cells but rapidly diffuses across the cell mem-brane (10, 13), direct inhibition of glycolytic enzymes byintracellular ethanol is unlikely during fermentations whichproduce 12% (vol/vol) ethanol or less.
In this paper, we have examined three physiologicalfactors (glycolytic and alcohologenic enzymes, internal pH,and viability) as possible causes for the decline in fermenta-tive activity during batch fermentation.
MATERIALS AND METHODSOrganism and growth condition. S. cerevisiae KD2 (petite
strain) was used in this study and was grown in complexmedium supplemented with 0.5 mM magnesium sulfate aspreviously described (10, 12). Batch fermentations (initialoptical density at 550 nm of 0.035; 0.01 mg of cell protein perml) with 20% glucose were carried out in 300-ml Spinnerbottles at 30°C with a 1% inoculum from a 12-h culture.
Analyses of fermentation broth. Cell protein was deter-mined by the method of Lowry et al. (20). Glucose, ethanol,and cell mass were measured as described (12).
Respirometry measurements. The rate of glycolysis andethanol production was estimated by measuring carbondioxide evolution with a Gilson differential respirometer(Gilson, Middleton, Wis.). This rate is taken as equivalent toglycolytic flux, assuming the production of 2 mol of ethanoland carbon dioxide per mol of glucose consumed. Resultsare expressed as micromoles of carbon dioxide evolved perhour per milligram of cell protein (12).Enzyme analyses. Activities of glycolytic and alcoholo-
genic enzymes were determined in 2-ml samples removed atvarious times during batch fermentation. Cells were har-
1286
on May 2, 2018 by guest
http://aem.asm
.org/D
ownloaded from

ETHANOL PRODUCTION BY S. CEREVISIAE 1287
L-10.0
o ^-_ 2 5.0> ae
.0 1.0z
z 0 0.50 0
OWoC1)0 U
z c 0.1I -I 0.05
CDWI
I 4
0.01
n
a
a
m
a
0
0
1 a t a I
10.0
5.0.
1.0 m
0.5 r-la
0-Ii
0.1
0.05 -
az
0.01 %
0 10 20 30 40 50
TIME (h)
FIG. 1. Alcohol production by strain KD2 during batch fermen-tation with 20% glucose and 0.5 mM magnesium sulfate.
vested by centrifugation at 10,000 x g for 30 s at 4°C andwashed in an equal volume of 50 mM potassium phosphatebuffer (pH 7.4). All subsequent steps were carried out at 4°C.The pellet was suspended in the same buffer containing 2mM mercaptoethanol and 2 mM EDTA and disrupted with0.1-mm glass beads using a Mini-Bead Beater (BiospecProducts, Bartlesville, Okla.; five periods of disruption, 1min each, with cooling on ice between treatments). Celldebris was removed by centrifugation at 10,000 x g for 5min, and the supernatant was assayed immediately forenzymatic activities. Only two enzymes at a time were
assayed in each batch fermentation experiment to avoidpotential problems which could result from storage of cellsor extracts.
Pyruvate decarboxylase and all glycolytic enzymes were
assayed spectrophotometrically by the methods of Maitraand Lobo (21) as modified by Clifton et al. (9). All enzymeswere assayed under substrate-saturating conditions excepttriose phosphate isomerase, which was assayed with 1 mMsubstrate. The amounts of coupling enzymes were adjustedas needed to ensure a linear reaction rate. Alcohol dehydro-genase was assayed by measuring the oxidation of ethanol as
described by Maitra and Lobo (21) but using a buffer at pH8.7 containing 75 mM sodium pyrophosphate, 75 mMsemicarbazide hydrochloride, and 21 mM glycine (3).
Determination of internal pH and membrane energization.The measurements of internal pH and At were performedusing 7-['4C]benzoic acid and [3H-phenyl]tetraphenylphosphonium bromide, respectively. Protocols were similarto those described by Cartwright et al. (6) except that cellswere incubated in their native growth medium rather thandistilled water and 0.4-,um-pore-size polycarbonate filterswere used instead of mixed cellulose ester filters. Cellvolumes were determined as previously described (10).These ranged from 2.23 ,il/mg of cell protein for cellsremoved from the 12-h stage of batch fermentation to 0.86[lI/mg of cell protein for cells removed from the 48-h stage.As a control for adventitious binding of radioactive com-
pounds, cells were permeabilized with a combination ofethanol, toluene, and Triton X-100 as described by Salmon(25), washed with 50 mM phosphate buffer, resuspended innative broth, and processed. This treatment resulted in a
complete collapse of ApH and loss of membrane potential.Calculations were performed as described by Rottenberg(24).
Materials. Yeast extract, peptone, and agar were obtainedfrom Difco Laboratories, Detroit, Mich. Glucose, couplingenzymes, coenzymes, and substrates were purchased fromSigma Chemical Co., St. Louis, Mo. Inorganic salts wereobtained from Fisher Scientific Co., Orlando, Fla. Absoluteethanol was supplied by AAPER Alcohol and Chemical Co.,Shelbyville, Ky. Radioactive compounds were purchasedfrom New England Nuclear Corp., Boston, Mass.
RESULTS
Reversibility of the decline in fermentative activity. Figure 1shows a representative batch fermentation with 20% glucosebeginning with a low inoculum. Growth as measured by cellprotein was exponential for the first 12 h and becamestationary between 18 and 24 h. During these growth peri-ods, relatively low concentrations of ethanol had accumu-lated (<5% [vol/vol]), well below the minimum inhibitoryconcentration of added ethanol for growth (8% [vol/vol]).Ethanol production proceeded exponentially for the initial 12h (1% [vol/vol] accumulated ethanol).
Cells were removed at various times during batch fermen-tation, and the rate of ethanol production per milligram ofcell protein was determined (Fig. 2). Cells were most activeat the earliest times measured, 12 h, and declined by 50%after 24 h (6.5% [vol/vol] accumulated ethanol). Approxi-mately 40% of the fermentative activity remained after theaccumulation of 10% (vol/vol) ethanol (30 g of remainingglucose per liter). The abrupt, final decline in activity reflectsthe near-complete exhaustion of glucose, the substrate.Removal of ethanol from cells by washing and suspending infresh mcdium resulted in only a modest increase in fermen-tative activity in all but the highest level of accumulatedethanol. The apparent increase in activity in the cells whichhad accumulated 12.1% (vol/vol) ethanol was primarily dueto the restoration of fermentable substrate glucose.Loss of viability was examined as a possible cause for the
failure of washing to restore full fermentative activity (datanot shown). Cell number paralleled the increase in cellprotein (Fig. 1) and increased exponentially for the initial 12h, reaching a maximum of 3 x 10⁸ cells per ml after 18 h. Cellnumber remained constant for the remaining period of fer-
60
Io .
m 40
0~>
W2 0
0A2 6 10 14
ETHANOL (%V/V)FIG. 2. Changes in fermentative activity of cells during batch
fermentation. Fermentative activity is expressed as micromoles ofcarbon dioxide evolved per hour per milligram of cell protein.Symbols: 0, activity measured in native broth; 0, activity measuredafter cells were suspended in fresh medium containing 20% glucose.
A
I
I
VOL. 53, 1987
I
on May 2, 2018 by guest
http://aem.asm
.org/D
ownloaded from
1288 DOMBEK AND INGRAM
Sc80-c
0h..
I.-
CP20a
110E
0
W0
c
z
0
Ul rL
B
I
s a T
0 5 10 15 0 5 10 15ETHANOL (%V/V) ETHANOL (%V/V)
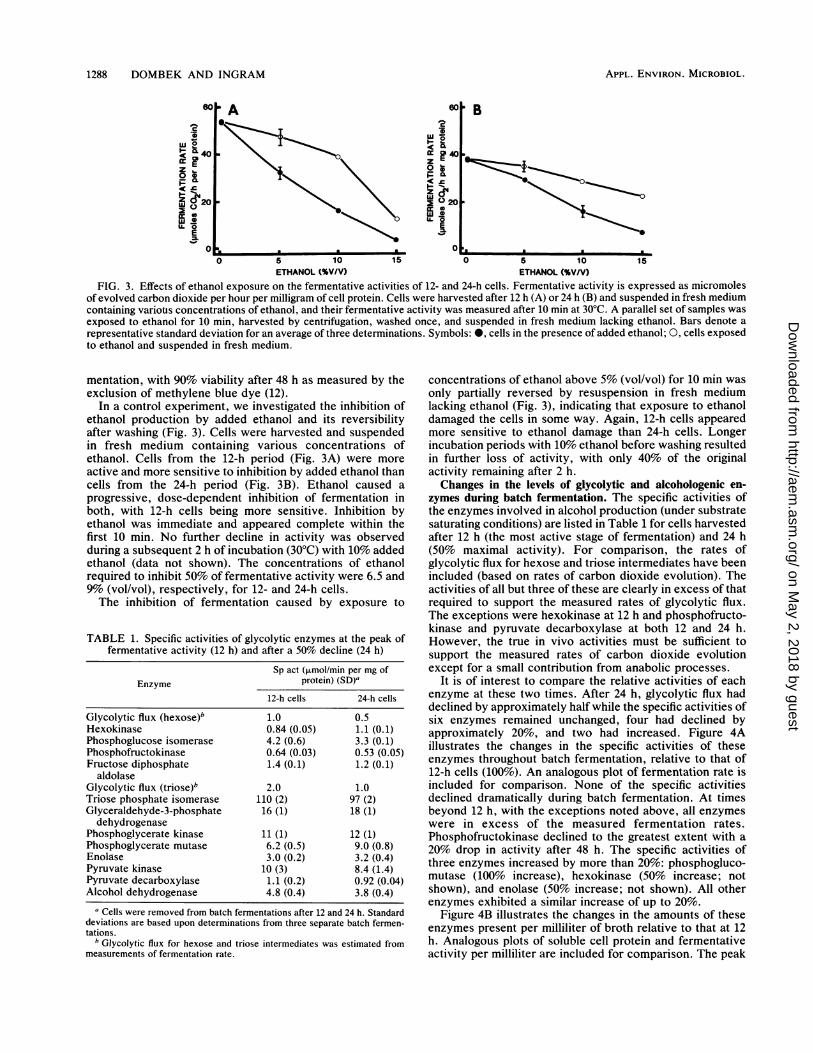
FIG. 3. Effects of ethanol exposure on the fermentative activities of 12- and 24-h cells. Fermentative activity is expressed as micromolesof evolved carbon dioxide per hour per milligram of cell protein. Cells were harvested after 12 h (A) or 24 h (B) and suspended in fresh mediumcontaining variotis concentrations of ethanol, and their fermentative activity was measured after 10 min at 300C. A parallel set of samples wasexposed to ethanol for 10 min, harvested by centrifugation, washed once, and suspended in fresh medium lacking ethanol. Bars denote arepresentative standard deviation for an average of three determinations. Symbols: 0, cells in the presence of added ethanol; 0, cells exposedto ethanol and suspended in fresh medium.
mentation, with 90% viability after 48 h as measured by theexclusion of methylene blue dye (12).
In a control experiment, we investigated the inhibition ofethanol production by added ethanol and its reversibilityafter washing (Fig. 3). Cells were harvested and suspendedin fresh medium containing various concentrations ofethanol. Cells from the 12-h period (Fig. 3A) were moreactive and more sensitive to inhibition by added ethanol thancells from the 24-h period (Fig. 3B). Ethanol caused aprogressive, dose-dependent inhibition of fermentation inboth, with 12-h cells being more sensitive. Inhibition byethanol was immediate and appeared complete within thefirst 10 min. No further decline in activity was observedduring a subsequent 2 h of incubation (30°C) with 10% addedethanol (data not shown). The concentrations of ethanolrequired to inhibit 50% of fermentative activity were 6.5 and9% (vol/vol), respectively, for 12- and 24-h cells.The inhibition of fermentation caused by exposure to
TABLE 1. Specific activities of glycolytic enzymes at the peak offermentative activity (12 h) and after a 50% decline (24 h)
Sp act (pLmol/min per mg ofEnzyme protein) (SD)"
12-h cells 24-h cells
Glycolytic flux (hexose)b 1.0 0.5Hexokinase 0.84 (0.05) 1.1 (0.1)Phosphoglucose isomerase 4.2 (0.6) 3.3 (0.1)Phosphofructokinase 0.64 (0.03) 0.53 (0.05)Fructose diphosphate 1.4 (0.1) 1.2 (0.1)
aldolaseGlycolytic flux (triose)b 2.0 1.0Triose phosphate isomerase 110 (2) 97 (2)Glyceraldehyde-3-phosphate 16 (1) 18 (1)dehydrogenase
Phosphoglycerate kinase 11 (1) 12 (1)Phosphoglycerate mutase 6.2 (0.5) 9.0 (0.8)Enolase 3.0 (0.2) 3.2 (0.4)Pyruvate kinase 10 (3) 8.4 (1.4)Pyruvate decarboxylase 1.1 (0.2) 0.92 (0.04)Alcohol dehydrogenase 4.8 (0.4) 3.8 (0.4)
a Cells were removed from batch fermentations after 12 and 24 h. Standarddeviations are based upon determinations from three separate batch fermen-tations.
b Glycolytic flux for hexose and triose intermediates was estimated frommeasurements of fermentation rate.
concentrations of ethanol above 5% (vol/vol) for 10 min wasonly partially reversed by resuspension in fresh mediumlacking ethanol (Fig. 3), indicating that exposure to ethanoldamaged the cells in some way. Again, 12-h cells appearedmore sensitive to ethanol damage than 24-h cells. Longerincubation periods with 10% ethanol before washing resultedin further loss of activity, with only 40% of the originalactivity remaining after 2 h.Changes in the levels of glycolytic and alcohologenic en-
zymes during batch fermentation. The specific activities ofthe enzymes involved in alcohol production (under substratesaturating conditions) are listed in Table 1 for cells harvestedafter 12 h (the most active stage of fermentation) and 24 h(50% maximal activity). For comparison, the rates ofglycolytic flux for hexose and triose intermediates have beenincluded (based on rates of carbon dioxide evolution). Theactivities of all but three of these are clearly in excess of thatrequired to support the measured rates of glycolytic flux.The exceptions were hexokinase at 12 h and phosphofructo-kinase and pyruvate decarboxylase at both 12 and 24 h.However, the true in vivo activities must be sufficient tosupport the measured rates of carbon dioxide evolutionexcept for a small contribution from anabolic processes.
It is of interest to compare the relative activities of eachenzyme at these two times. After 24 h, glycolytic flux haddeclined by approximately half while the specific activities ofsix enzymes remained unchanged, four had declined byapproximately 20%, and two had increased. Figure 4Aillustrates the changes in the specific activities of theseenzymes throughout batch fermentation, relative to that of12-h cells (100%). An analogous plot of fermentation rate isincluded for comparison. None of the specific activitiesdeclined dramatically during batch fermentation. At timesbeyond 12 h, with the exceptions noted above, all enzymeswere in excess of the measured fermentation rates.Phosphofructokinase declined to the greatest extent with a20% drop in activity after 48 h. The specific activities ofthree enzymes increased by more than 20%: phosphogluco-mutase (100% increase), hexokinase (50% increase; notshown), and enolase (50% increase; not shown). All otherenzymes exhibited a similar increase of up to 20%.
Figure 4B illustrates the changes in the amounts of theseenzymes present per milliliter of broth relative to that at 12h. Analogous plots of soluble cell protein and fermentativeactivity per milliliter are included for comparison. The peak
* * ~~~~~sa
APPL. ENVIRON. MICROBIOL.
on May 2, 2018 by guest
http://aem.asm
.org/D
ownloaded from
ETHANOL PRODUCTION BY S. CEREVISIAE 1289
A A
U iu 2U 3U 40 ou
TIME (h)
800
am.
t 1~s00u.i2400
i 200
< 0
10 20 30 40 50TIME (h)
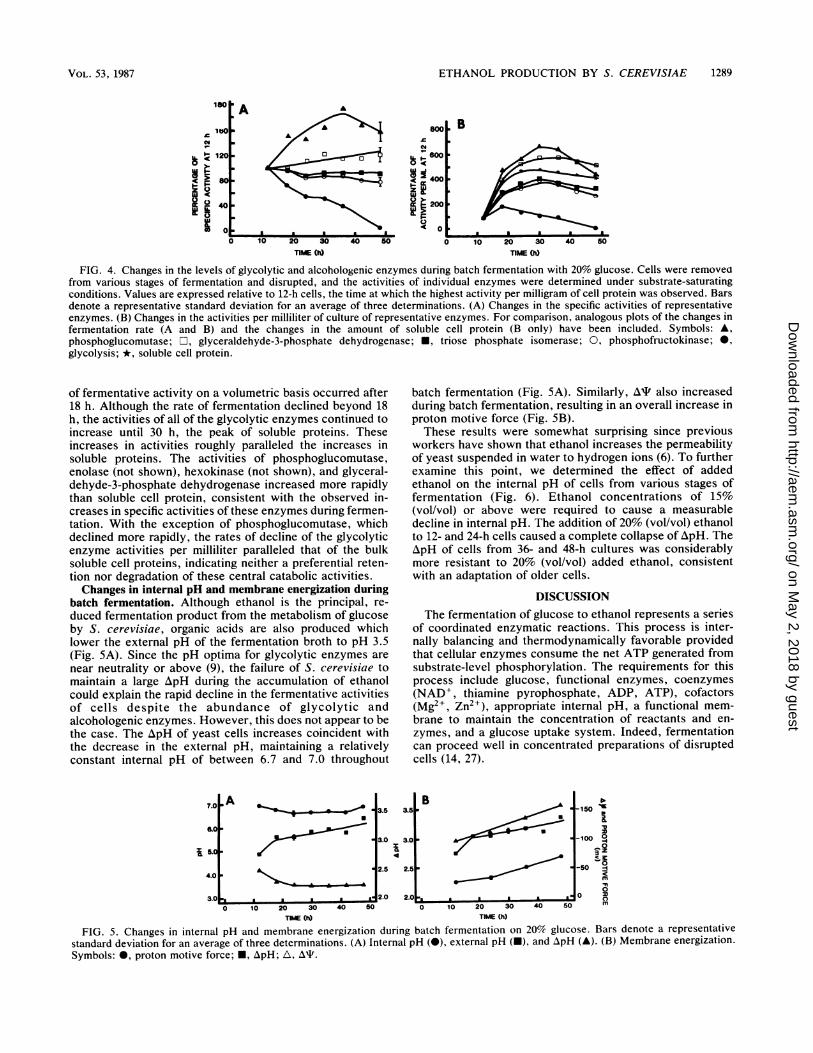
FIG. 4. Changes in the levels of glycolytic and alcohologenic enzymes during batch fermentation with 20% glucose. Cells were removeofrom various stages of fermentation and disrupted, and the activities of individual enzymes were determined under substrate-saturatingconditions. Values are expressed relative to 12-h cells, the time at which the highest activity per milligram of cell protein was observed. Barsdenote a representative standard deviation for an average of three determinations. (A) Changes in the specific activities of representativeenzymes. (B) Changes in the activities per milliliter of culture of representative enzymes. For comparison, analogous plots of the changes infermentation rate (A and B) and the changes in the amount of soluble cell protein (B only) have been included. Symbols: A,phosphoglucomutase; r, glyceraldehyde-3-phosphate dehydrogenase; *, triose phosphate isomerase; 0, phosphofructokinase; *,glycolysis; *, soluble cell protein.
of fermentative activity on a volumetric basis occurred after18 h. Although the rate of fermentation declined beyond 18h, the activities of all of the glycolytic enzymes continued toincrease until 30 h, the peak of soluble proteins. Theseincreases in activities roughly paralleled the increases insoluble proteins. The activities of phosphoglucomutase,enolase (not shown), hexokinase (not shown), and glyceral-dehyde-3-phosphate dehydrogenase increased more rapidlythan soluble cell protein, consistent with the observed in-creases in specific activities of these enzymes during fermen-tation. With the exception of phosphoglucomutase, whichdeclined more rapidly, the rates of decline of the glycolyticenzyme activities per milliliter paralleled that of the bulksoluble cell proteins, indicating neither a preferential reten-tion nor degradation of these central catabolic activities.Changes in internal pH and membrane energization during
batch fermentation. Although ethanol is the principal, re-duced fermentation product from the metabolism of glucoseby S. cerevisiae, organic acids are also produced whichlower the external pH of the fermentation broth to pH 3.5(Fig. SA). Since the pH optima for glycolytic enzymes arenear neutrality or above (9), the failure of S. cerevisiae tomaintain a large ApH during the accumulation of ethanolcould explain the rapid decline in the fermentative activitiesof cells despite the abundance of glycolytic andalcohologenic enzymes. However, this does not appear to bethe case. The ApH of yeast cells increases coincident withthe decrease in the external pH, maintaining a relativelyconstant internal pH of between 6.7 and 7.0 throughout
batch fermentation (Fig. SA). Similarly, At also increasedduring batch fermentation, resulting in an overall increase inproton motive force (Fig. SB).These results were somewhat surprising since previous
workers have shown that ethanol increases the permeabilityof yeast suspended in water to hydrogen ions (6). To furtherexamine this point, we determined the effect of addedethanol on the internal pH of cells from various stages offermentation (Fig. 6). Ethanol concentrations of 15%(vol/vol) or above were required to cause a measurabledecline in internal pH. The addition of 20% (vol/vol) ethanolto 12- and 24-h cells caused a complete collapse of ApH. TheApH of cells from 36- and 48-h cultures was considerablymore resistant to 20% (vol/vol) added ethanol, consistentwith an adaptation of older cells.
DISCUSSIONThe fermentation of glucose to ethanol represents a series
of coordinated enzymatic reactions. This process is inter-nally balancing and thermodynamically favorable providedthat cellular enzymes consume the net ATP generated fromsubstrate-level phosphorylation. The requirements for thisprocess include glucose, functional enzymes, coenzymes(NAD+, thiamine pyrophosphate, ADP, ATP), cofactors(Mg2+, Zn2+), appropriate internal pH, a functional mem-brane to maintain the concentration of reactants and en-zymes, and a glucose uptake system. Indeed, fermentationcan proceed well in concentrated preparations of disruptedcells (14, 27).
I A
"~~~~~P%~~~~~~~
0 10 20 30
TME (h)
3.5 351
3.0 3.0
4
2.5
2.0
B0
Al~~~~~~~~m
a
2.5k
2.C
40 50 0 10 20 30 40 50
TIME (h)
-150 :K
-100 °O3<
0
0 Dm
FIG. 5. Changes in internal pH and membrane energization during batch fermentation on 20% glucose. Bars denote a representativestandard deviation for an average of three determinations. (A) Internal pH (0), external pH (-), and ApH (A). (B) Membrane energization.Symbols: 0, proton motive force; *, ApH; A, APV.
18O
CM
0
laO
as
120
7.01
&C
i 5.44.0
3.0 .0 s a m s
VOL. 53, 1987
on May 2, 2018 by guest
http://aem.asm
.org/D
ownloaded from

1290 DOMBEK AND INGRAM
_J 1000
z 800
604 WO 40I--
Z 20
0-
36 h
48 h
24 h
12 h
0 5 10 15ETHANOL (%V/V)
20
FIG. 6. Effects of added ethanol on ApH. Cells were removedfrom various stages of batch fermentation (indicated on graph),harvested, and suspended in fresh medium containing variousconcentrations of ethanol at 30°C for 10 min, and ApH was
determined.
Why then does the rate of glycolysis in viable yeast cellsdecline during batch fermentation? Two nutritional factorshave been identified previously which reduced but did noteliminate the ethanol-associated decline in activity (7, 11,12). Our results with added and accumulated ethanol indi-cate that physiological changes such as ethanol damage,rather than an immediately reversible effect of ethanol,appear responsible. Added ethanol inhibited fermentation,but washing did not restore full activity. Similarly, thereplacement of ethanol-containing broth from the middle tolater stages of fermentation with fresh medium did notimmediately restore fermentative activity. The exposure ofcells to ethanol in some way damaged their ability to produceethanol. The extent of this damage appears related to bothethanol concentration and the duration of exposure.
We have examined cell viability, internal pH, and individ-ual enzymes involved in glycolysis and alcohologenesis as
sites for changes (including ethanol damage) which could beresponsible for the loss of ethanol productivity during batchfermentation. No appreciable loss of cell viability was ob-served during 48-h batch fermentations. The activities ofglycolytic and alcohologenic enzymes measured in vitroremained high and did not appear limiting, consistent withearlier reports of the persistence of hexokinase and alcoholdehydrogenase activity (16). The specific activities of manyof these continued to increase even after increases in totalcell protein had ended, suggesting that they may be prefer-entially synthesized. Only a modest loss of total activity (permilliliter) was observed during the latter stages of fermenta-tion, consistent with a low rate of turnover of these en-
zymes.The internal pH of the cell was maintained near neutrality
despite acidification of the broth and the accumulation ofover 12% ethanol. This latter observation was contrary to
expectation based upon earlier studies with cells suspendedin water (6). These earlier studies had demonstrated thatethanol enhanced the leakage of protons (6), with an acidi-fication of the cytoplasm below the optimal pH for glycolyticand alcohologenic enzymes. Although such enhanced leak-
age may also occur in fermentation broth, the maintenanceof a high internal pH in broth containing ethanol indicates
that such leakage must be offset by the action of hydrogen
ion pumps such as ATPase.Cells from the later stages of fermentation were more
resistant to inhibition by ethanol and to the disruptive effectsof ethanol on membrane integrity (as measured by proton
leakage). During batch fermentation, cells may be undergo-
ing progressive adaptations to accumulated ethanol.Changes in the lipid composition of yeast cell membraneshave been observed in response to accumulated ethanol andhave been proposed as an important factor involved in suchadaptation (2, 7, 15).The results of our investigations do not identify the cause
for the decline in fermentative activity during batch fermen-tation but rather narrow the range of remaining factors.Although the activities of glycolytic and alcohologenic en-zymes assayed in vitro under substrate-saturating conditionsremained high during batch fermentation, the in vivo activ-ities of these enzymes within the cell cannot be accuratelypredicted. The activities of some of these are subject tomodulation by allosteric effectors in addition to constraintsimposed by the availability of individual substrates, cofac-tors, and coenzymes. Further studies are now under way toexplore the levels of these low-molecular-weight intracellu-lar constituents.
ACKNOWLEDGMENTS
This research has been supported in part by the Florida Agricul-tural Experiment Station (publication no. 7838), by grants from theDepartment of Energy, Office of Basic Energy Sciences (FG05-86ER3574) and the National Science Foundation (DMB 8204928),and by the Department of Agriculture, Alcohol Fuels Program(86-CRCR-1-2134).
LITERATURE CITED1. Andreason, A. A., and T. J. B. Stier. 1954. Anaerobic nutrition
of Saccharomyces cerevisiae. II. Unsaturated fatty acid re-quirement for growth in defined medium. J. Cell. Comp. Phys-iol. 43:271-281.
2. Beavan, M. J., C. Charpentier, and A. H. Rose. 1982. Produc-tion and tolerance of ethanol in relation to phospholipid fatty-acyl composition in Saccharomyces cerevisiae NCYC 431. J.Gen. Microbiol. 128:1447-1455.
3. Bernt, E., and I. Gutman. 1971. Ethanol determination withalcohol dehydrogenase, p. 1499-1502. In H. U. Bergermeyer(ed.), Methods of enzymatic analysis, vol. 3. Academic Press,Inc., New York.
4. Buttke, T. M., S. D. Jones, and K. Bloch. 1980. Effect of sterolside chains on growth and membrane fatty acid composition ofSaccharomyces cerevisiae. J. Bacteriol. 144:124-130.
5. Buttke, T. M., and A. L. Pyle. 1982. Effects of unsaturated fattyacid deprivation on neutral lipid synthesis in Saccharomycescerevisiae. J. Bacteriol. 152:747-756.
6. Cartwright, C. P., J.-R. Juroszek, M. J. Beavan, F. M. S. Ruby,S. M. F. De Morais, and A. H. Rose. 1986. Ethanol dissipates theproton-motive force across the plasma membrane of Saccharo-myces cerevisiae. J. Gen. Microbiol. 132:369-377.
7. Casey, G. P., and W. M. Ingledew. 1986. Ethanol tolerance inyeasts. Crit. Rev. Microbiol. 13:219-290.
8. Casey, G. P., C. A. Magnus, and W. M. Ingledew. 1984.High-gravity brewing: effects of nutrition on yeast composition,fermentative ability, and alcohol production. Appi. Environ.Microbiol. 48:639-646.
9. Clifton, D., S. B. Weinstock, and D. G. Fraenkel. 1978.Glycolysis mutants in Saccharomyces cerevisiae. Genetics 88:1-11.
10. Dombek, K. M., and L. 0. Ingram. 1985. Determination ofintracellular concentration of ethanol in Saccharomyes cerevi-siae during fermentation. Appl. Environ. Microbiol. 51:197-200.
11. Dombek, K. M., and L. 0. Ingram. 1986. Nutrient limitation asa basis for the apparent toxicity of low levels of ethanol duringfermentation. J. Ind. Microbiol. 1:219-225.
12. Dombek, K. M., and L. 0. Ingram. 1986. Magnesium limitationand its role in the apparent toxicity of ethanol during yeastfermentation. Appl. Environ. Microbiol. 52:975-981.
13. Guijarro, J. M., and R. Lagunas. 1984. Saccharomyces cerevi-
1t_
0
APPL. ENVIRON. MICROBIOL.
0
on May 2, 2018 by guest
http://aem.asm
.org/D
ownloaded from

ETHANOL PRODUCTION BY S. CEREVISIAE 1291
siae does not accumulate ethanol against a concentration gradi-ent. J. Bacteriol. 160:874-878.
14. Harden, A. 1923. Alcoholic fermentation. Longmans, Green andCo., New York.
15. Ingram, L. O., and T. M. Buttke. 1984. Effects of ethanol on
micro-organisms. Adv. Microb. Physiol. 25:253-300.16. Larue, F., S. Lafon-Lafourcade, and P. Ribereau-Gayon. 1984.
Relationship between the inhibition of alcoholic fermentation bySaccharomyces cerevisiae and the activities of hexokinase andalcohol dehydrogenase. Biotechnol. Lett. 6:687-692.
17. Leao, C., and N. van Uden. 1982. Effects of ethanol and otheralkanols on the glucose transport system of Saccharomycescerevisiae. Biotechnol. Bioeng. 24:2601-2604.
18. Leao, C., and N. van Uden. 1984. Effects of ethanol and otheralkanols on the general amino acid permease of Saccharomycescerevisiae. Biotechnol. Bioeng. 26:403-405.
19. Leio, C., and N. van Uden. 1984. Effects of ethanol and otheralkanols on passive proton influx in the yeast Saccharomycescerevisiae. Biochim. Biophys. Acta 774:43-48.
20. Lowry, 0. H., N. J. Rosebrough, A. L. Farr, and R. J. Randall.1951. Protein measurement with the Folin phenol reagent. J.
Biol. Chem. 193:265-275.21. Maitra, P. K., and Z. Lobo. 1971. A kinetic study of glycolytic
enzyme synthesis in yeast. J. Biol. Chem. 246:475-488.22. Millar, D. G., K. Griffiths-Smith, E. Algar, and R. K. Scopes.
1982. Activity and stability of glycolytic enzymes in the pres-ence of ethanol. Biotechnol. Lett. 9:601-606.
23. Moulin, G., H. Boze, and P. Galzy. 1984. Inhibition of alcoholicfermentation. Biotechnol. Bioeng. 25:365-382.
24. Rottenberg, H. 1979. The measurement of membrane potentialand ApH in cells, organelles and vesicles. Methods Enzymol.55:547-569.
25. Salmon, M. 1984. Application of the technique of cellularpermeabilization to the study of the enzymatic activities ofSaccharomyces cerevisiae in continuous alcoholic fermenta-tion. Biotechnol. Lett. 6:43-48.
26. Thomas, D. S., J. A. Hossak, and A. H. Rose. 1978. Plasmamembrane composition and ethanol tolerance in Saccharomy-ces cerevisiae. Arch. Microbiol. 117:239-245.
27. Welch, P., and R. K. Scopes. 1985. Studies on cell-free metab-olism: ethanol production by a yeast glycolytic system recon-stituted from purified enzymes. J. Biotechnol. 2:257-273.
VOL. 53, 1987
on May 2, 2018 by guest
http://aem.asm
.org/D
ownloaded from