Ethanol (EtOH) & Other Renewables IAEE – Houston Chapter ... · Ethanol (EtOH) & Other Renewables...
26
Ethanol (EtOH) & Other Renewables IAEE – Houston Chapter June 14, 2007 Chuck Hoffheiser 281-352-0939
Transcript of Ethanol (EtOH) & Other Renewables IAEE – Houston Chapter ... · Ethanol (EtOH) & Other Renewables...

Ethanol (EtOH) & Other RenewablesIAEE – Houston Chapter
June 14, 2007
Chuck Hoffheiser281-352-0939

1
The following represents the observations of the presenter and not of any firm or organization. Any discussion of economics or return on investment of biofuels plants is purely notional and is not intended as anyrecommendation to invest or not to invest in these businesses. This presentation contains projections of gasoline, diesel fuel and ethanol supply and demand, all of which can change over time, sometimes significantly. While best efforts were made in these projections and economic analyses, they are estimates only, and they should not be used for purposes such as investing in futures trading contracts. Anyone considering these or other types of investments should do their own analysis. The author disclaims all warranties and guarantees, including warranties of merchantability and of fitness for a particular purpose.

2
Key Topics
US Ethanol Supply & Demand• Forces Driving Ethanol / Biofuels • Current Situation• Possible Future Scenarios• Increase in Renewable Fuels Standard Mandate?
Economics• Ethanol Relative Production Costs --- Corn, Sugar Cane, Cellulosic
• Pro Forma Economics – Corn Dry Mill
Some Abbreviations and Terminology• RFS = Renewable Fuels Standard• EtOH = Ethanol• BD = Biodiesel (B100 = 100%, B20 = 20% with refinery diesel)• RFG = Reformulated Gasoline used in 9-12 areas of US• MTBE = Oxygenate formerly used in RFG• RBOB = Reformulated Gasoline Blending Component
Before Oxygenate Blending (EtOH is the Oxygenate)

3
Supply & Demand - Forces Driving US Renewable Fuels
• RFS mandate likely increases to 11-13 BGPY in 2012, 15 BGPY in 2015
• 2007 Farm Bill Re-authorization
• Democrats to push for more “energy independence” & force key Republicans to support RFS increase
• Sen. Bingaman’s bill = 35 BGPY35 BGPY
• Some key energy committee membersdon’t support EtOH
• NPRA trying to slow down RFS and reduce subsidies
• Other industries are objecting
RFS Expansion ?
Drivers • “Renewable”• Energy Prices / “Security”• GHGs • Loss of MTBE• Blending Properties
Government Support• Mandates• Tax Incentives
•• BioethanolBioethanol•• BiobutanolBiobutanol•• BiodieselBiodiesel
• Good ROI• Rural Jobs• Fuel Diversification• “Lower Imports”

4
Corn Cost Backlash?

5
Supply & Demand – Possible Scenarios
• US capacity exceeds currentRFS demand thru 2012
• Subsidies / tariffs --- overbuilding?
• New plant proposals driven by EtOHproducers betting on RFS increase
• Increased capital costs will causesome proposals to be cancelled
• Sen. Bingaman’s bill = 35 BGPY35 BGPY
• Petrobras JV in Japan and possibleincrease of EtOH in mogas from 3% to 10% might reduce US avails
• India, China, Canada, Thailand, EtOHprograms add complexity
Western Hemisphere Ethanol S & D 2006-2012 --- Possible RFS Changes
3
5
7
9
11
13
15
17
2006 2007 2008 2009 2010 2011 2012
Bill
ion
Gal
/ Ye
ar
Current RFS US Pdn @ 110% NameplatePres Bush / Sen Bingaman Add Brazil Arb Imports
US Running / Being Built US Proposed

6
Supply & Demand - Can US Market Absorb More Ethanol?
• 17 BGPY RFS requires ~350 MBD E85
• “Planting” State of Iowa = 600 MBD
• EIA says sufficient E85 vehicles will be built --- but by when?
E85 has huge potential, but - - -• About 30% lower mpg – Consumers? • Cannot be shipped in pipelines
• Only about 3% of U.S. cars can currently use it (5% by 2015)
• Domestic auto companies will support
• Significant investment required tomake available to consumers
• EPAct 2005 incentive to gas stations
0
200
400
600
800
1000
1200
2006 2007 2008 2009 2010 2011 2012 2013 2014 2015
RFS
Man
date
MB
D
E85
E10 – “Gasohol”
Total = ~50% of Bingaman Bill
% of US Mogas in 2015RFS = 490 MBD = 5%
15 BGY = 980 MBD = 10%35 BGY = 2.3 MMBD = 23%
E85 Issues

7
Supply & Demand - Can US Market Absorb Renewables?% Gasoline Demand
0%5%
10%15%20%25%30%
2010 2011 2012 2013 2014 2015
% U
S D
eman
d
RFS 15 BGY 35 BGY
% Gasoline & Distillate Demand
0%
5%
10%
15%
20%
2010 2011 2012 2013 2014 2015
% U
S D
eman
d
RFS 15 BGY 35 BGY
• Can’t quickly turn over auto fleet to E85 “Flex-Fuel”
• Logistics limit E85 availability
• Unlikely all 35 BGY renewable is EtOH into mogas
• Resistance to EtOH is Increasing
• Biodiesel helps and has advantages
• Emerging biobutanol is another possibility & “better” than EtOH
• Likely that significant incentives Likely that significant incentives must continue must continue

8
Supply & Demand – Domestic & Import Supply Sources
• CBI imports limited to 7% of US production; never at this level
• Some CBI imports from Brazil
• Largest imports from Brazil - - -If arb is open
• Arb open with high mogas prices
• Current tariff 54 cpg + 2.5% duty
•2006 imports about 666 MM Gal or 15% of RFS demand
Domestic SupplyImports
• Current US capacity 5.8 BGPY• Forecasted in 2010 10-11 BGPY
Huge majority of demand on East, Gulf & West Coasts
Major RFG Areas

9
Cost Comparison – Various Ethanol Feedstocks
Feed Yield – Gal / Acre Technology Rating
Dry Mill Corn 400 Well Known
Well Known
? ? ?
? ? ?
Sugar Cane 725
Cellulosic –Corn Stover 800-1,200
Cellulosic –Switch Grass ~1,000
From a land use and food cost perspective . . .
• EtOH BTU / gal = 2/3 gasoline BTU / gal• 1 MM acres of corn = 17 MBD gasoline and• “One Iowa” = 600 MBD gasoline• Current RFS = 490 MBD gasoline

10
Economics - Comparison of Ethanol Processes
Factor Sugar Cane Dry Mill Corn Wet Mill Corn CellulosicFeed Cost Higher Lower Lower Lowest
Energy Can be Low High Nat Gas High Nat Gas Highest
Other Opex Low Moderate Moderate 1.5x Dry Mill
Capex High < Wet Mill High 4x Dry Mill
Technology Proven Proven Proven Unproven
Difficulty Easy Difficult Difficult “Termites”
Co-products None High Value High Value* Maybe
• Despite uncertainty, Shell, Goldman Sachs, Abengoa pursuing cellulosic• Economic analysis based on Dry Mill process that dominates in US

11
Cost Comparison – Dry Mill Ethanol Manufacturing Cost
Platts Average 2007 YTD June 5 Prices @ USGC (CPG)EtOH = 235 UL 87 = 194 RBOB = 198
“Avg” Corn Futures June 2007 ~$4.00
12
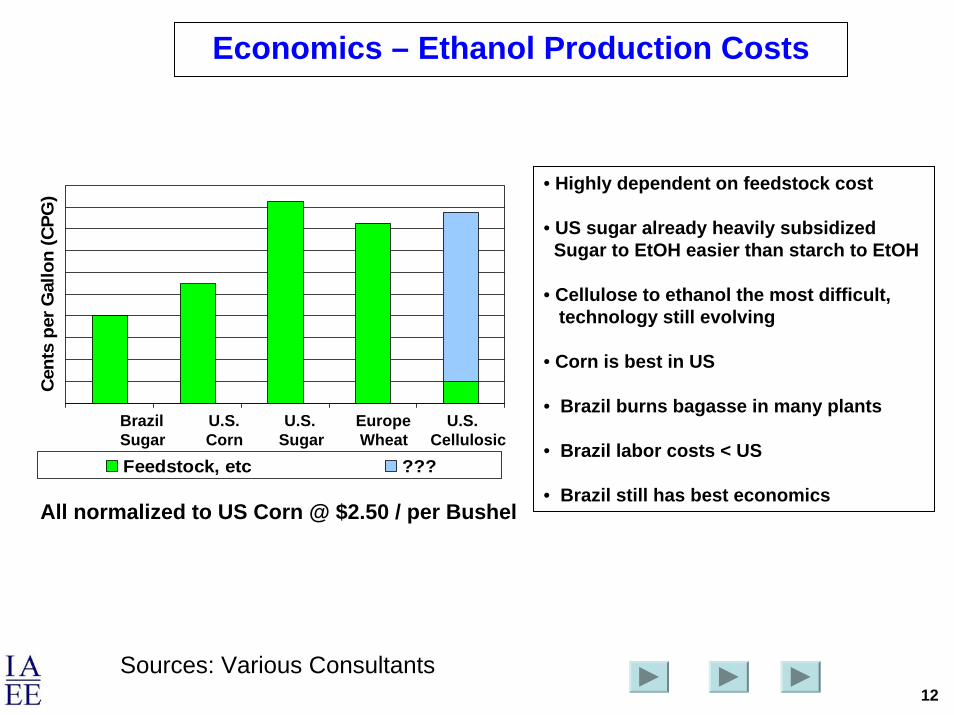
Economics – Ethanol Production Costs
• Highly dependent on feedstock cost
• US sugar already heavily subsidizedSugar to EtOH easier than starch to EtOH
• Cellulose to ethanol the most difficult, technology still evolving
• Corn is best in US
• Brazil burns bagasse in many plants
• Brazil labor costs < US
• Brazil still has best economics
Cen
ts p
er G
allo
n (C
PG)
Feedstock, etc ???
Brazil U.S. U.S. Europe U.S.Sugar Corn Sugar Wheat Cellulosic
All normalized to US Corn @ $2.50 / per Bushel
Sources: Various Consultants

13
Economics – Comments on Efficiency
• Industry is growing rapidly, but generally is operating inefficiently
• Some small plants have logistics disadvantages --- far from rail lines;small in scale --- BUT local economic impact drove the locations
• Current average plant capacity of 52 MMGPY limits use of unit trains;
• New technologies reducing energy consumption, improving efficiency, developing new co-products, using new feedstocks
• Seed research to increase corn & ethanol yields• Corn fractionation• Cold starch hydrolysis• Corn oil extraction• Lower gas usage --- biomass, fluidized bed reactors, turbines
• Plant in West Texas to use methane from adjacent cattle feed lot and sell co-products as animal feed

14
Economics - Barriers to Market Entry
• Entry barriers are low - - - “NIMBY” non-existent due to local benefit --- Rural communities want the jobs generated
• Only 4 firms design / engineer ethanol plants --- same costpressures as refining industry
• Financing readily available from banks, venture capitalists, hedge funds at favorable rates
• Easier to obtain financing for larger plants --- lenders at this level comfortable with commodity risks
• But Biodiesel is an “easier” process

15
Pro Forma Economics
• Invest then 1 year to build
• 100% Equity Financing

16
Pro Forma Economics
Dry Mill Ethanol Economics - IRR Sensitivity
0%
5%
10%
15%
20%
25%
30%
35%
$2.00 $2.50 $3.00 $3.50 $4.00 $4.50Corn, $ per Bushel
IRR
10% gas savings = IRR + 1%10 cpg delta EtOH = delta IRR ~3-8%Most important --- Corn & EtOH prices

17
Economics – IRR Sensitivity
Corn Price $2.50 $3.50
Capex 200 MM (% IRR) 24 13
EtOH @ BTU Parity in 2009 <0 <0
Base Case - 165 MM Capex (% IRR) 29 16
Capex 130 MM (% IRR) 37 21
EtOH @ BTU Parity in 2009 <0 <0
EtOH @ BTU Parity in 2009 <0 <0
Financiers already are demanding greater equity stake by plant owners --- 60-65% debt leverage had been the norm

18
The Future - How Do Biofuels Fit in US system?
• All have a place, but none totally replaces gasoline• EtOH and Biobutanol are good octane boosters• Biobutanol better than EtOH
• All appear to have GHG advantages over hydrocarbon based fuels
• Some have performance advantages• BD zero sulfur, adds lubricity• Biobutanol has BTU and shipping advantage over EtOH• BD can be made from waste fats and grease• Cellulosic EtOH “Changes the rules”
• But some key disadvantages• EtOH can’t ship via pipelines• BD (Biodiesel) can, BUT how does it impact • Until cellulosic or waste grease proven, “food vs. fuel”• BD reputation damaged by “garage shop” manufacturers

19
Back-Up Slides

20
Brazilian Ethanol (EtOH)
• Made from sugar cane since 1930s
• Low cost global producer - - - But cost varies with sugar prices
• Brazilian Gasoline• Hydrous 95% EtOH --- “Ethanol cars” and export• Anhydrous EtOH --- “Gasohol” for “flex-fuel” vehicles• Conventional refinery gasoline
• 2006 EtOH Production 4.2 BG (273 MBD); ~45 MBD Exported
• Plans to almost double production by 2009

21
Competing Ethanol Technologies
Corn Processes• Gas savings to 60% in corn based with Fluidized Bed Reactors or gas turbines • Location near feed lots reduces methane and animal feed costs• Seed research underway to improve ethanol yield per bushel of corn• Proximity of feed and CO2 markets, nat gas price drive corn / EtOH logistics • Wet mill by-products require additional processing and add costs
Cellulosic Processes• Available for 25-30 years; never economic, technology unproven on large scale• May have very long term potential to produce “diesel-like” molecules

22
Economics - Corn vs Ethanol Logistics
Build Near Feedstock or Near Fuel Market?Ship Ethanol or Ship Corn ?
Feedstock cost, 2/3 of total Opex, increases for “destination plants” such as Northeast Biofuels in upstate NY
Concept works when:
• Livestock feed demand is nearby• Local CO2 markets exist• Natural gas prices are reasonable• Nearby mogas demand is high

23
Competing Technologies – Dry Milling
Dry Milling
•Grind entire kernel into flour•Slurry with water & add enzymes•Convert starch to dextrose (NH3 for pH)•Heat to reduce bacteria levels•Cool, add yeast & ferment to EtOH & CO2 over 40 to 50 hours
•Transfer to distillation columns to separateEtOH "stillage"
•EtOH distilled 190 proof (95%)•Dehydrated to ~200 proof in a molecular
sieve system•Denatured with about 5% natural gasoline
•Stillage centrifuged to separate coarse grainfrom solubles
•Solubles concentrated to ~30% solids by evaporation --- (Condensed Distillers Solubles (CDS) or "syrup"
•Coarse grain & syrup dried to produce dried distillers grains with solubles (DDGS)
•CO2 captured and sold for soft drink carbonation & dry ice
Source: Renewable Fuels Association
24
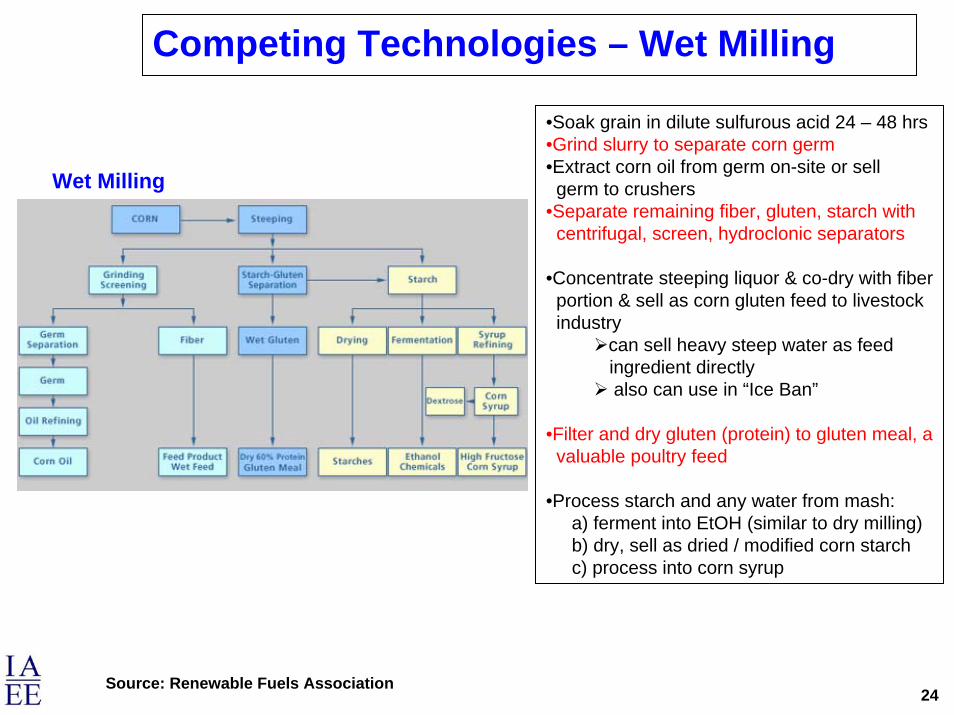
Competing Technologies – Wet Milling
Wet Milling
•Soak grain in dilute sulfurous acid 24 – 48 hrs•Grind slurry to separate corn germ•Extract corn oil from germ on-site or sell germ to crushers
•Separate remaining fiber, gluten, starch with centrifugal, screen, hydroclonic separators
•Concentrate steeping liquor & co-dry with fiber portion & sell as corn gluten feed to livestock industry
can sell heavy steep water as feed ingredient directlyalso can use in “Ice Ban”
•Filter and dry gluten (protein) to gluten meal, avaluable poultry feed
•Process starch and any water from mash:a) ferment into EtOH (similar to dry milling)b) dry, sell as dried / modified corn starchc) process into corn syrup
Source: Renewable Fuels Association

25
Competing Technologies – Cellulosic Biomass
Cellulosic Ethanol • Variety of options for pretreatment
• Variety of other steps in the process
• Several technologies combine two or all three of the hydrolysis and fermentation steps
• An evolving technology that has yet to beproven commercially
• Capex = 4 x Dry Milling• OPEX = 1.5 times Dry Milling• Highest energy cost of all processes• But Potentially zero cost feedstock