
eTail East 2015 - Ann Ruckstuhl Presentation
27
1
-
Upload
soasta -
Category
Technology
-
view
691 -
download
2
Transcript of eTail East 2015 - Ann Ruckstuhl Presentation
1

2

3
1% Sales
$6.8M $45M
0.2% Searches
@ 1 Second
2% Conversion
$244M
Gartner, Walmart

4
“eCommerce” MASLOW
Smart
Fast
Easy
Secure
FunctionalPhysiological
Safety
Love/Belonging
Esteem
Self Actualization
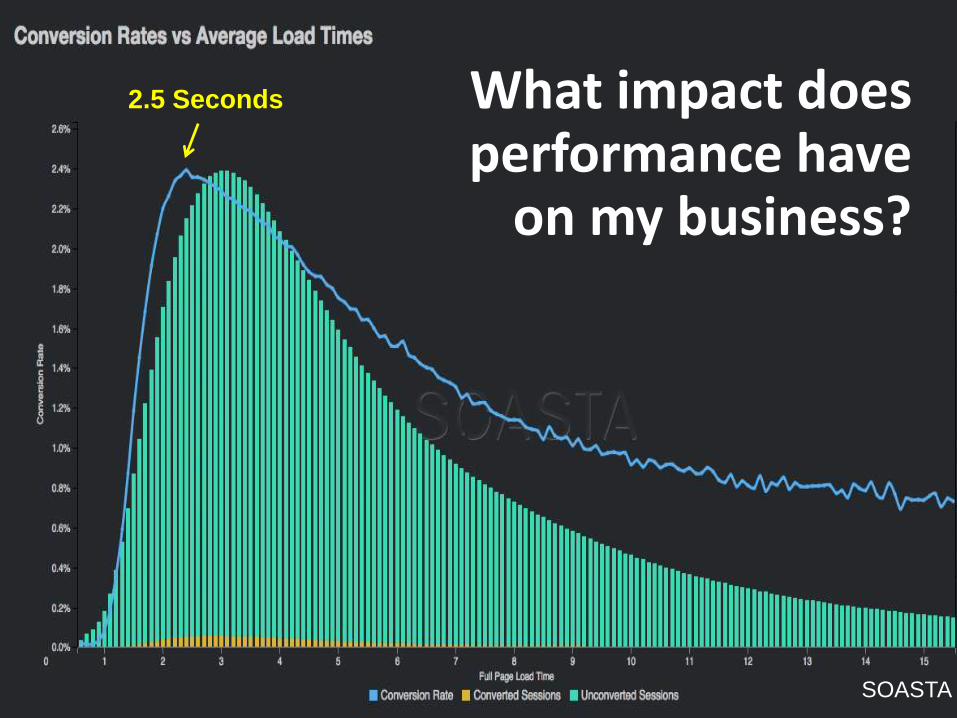
What impact does performance have
on my business?
SOASTA
2.5 Seconds
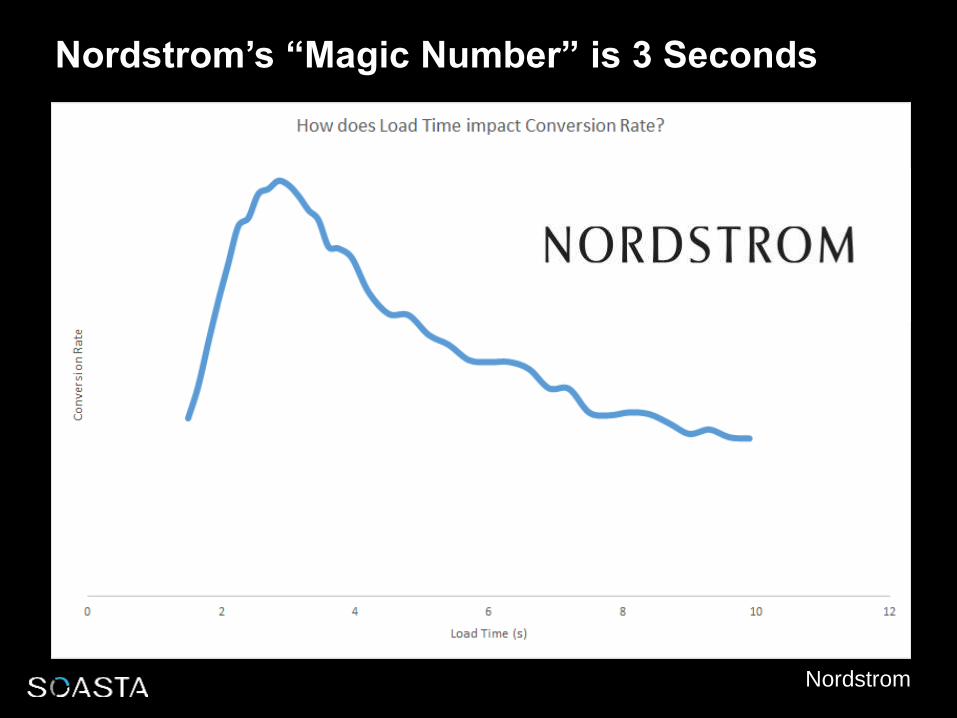
Nordstrom’s “Magic Number” is 3 Seconds
Nordstrom

What’s Your “Magic Number”?
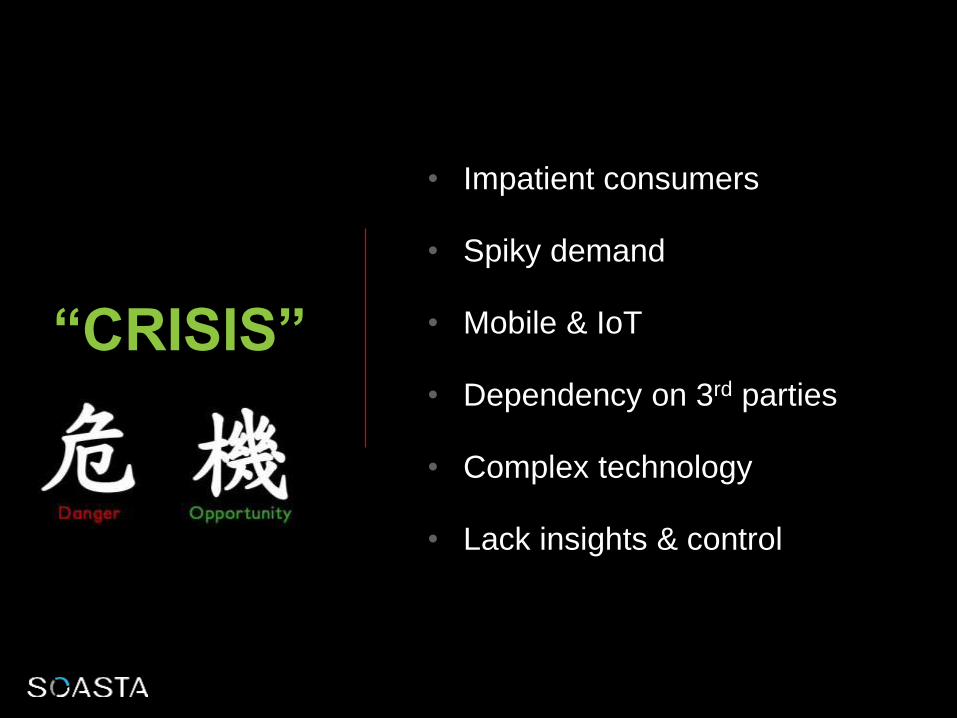
“CRISIS”
• Impatient consumers
• Spiky demand
• Mobile & IoT
• Dependency on 3rd parties
• Complex technology
• Lack insights & control

9
Harris Interactive “Mother’s Day Online Shopping Survey”
Sponsored by SOASTA, April 2015, N=2051
Will go to a competitor’s site
Will never return to the site
Will share their problems
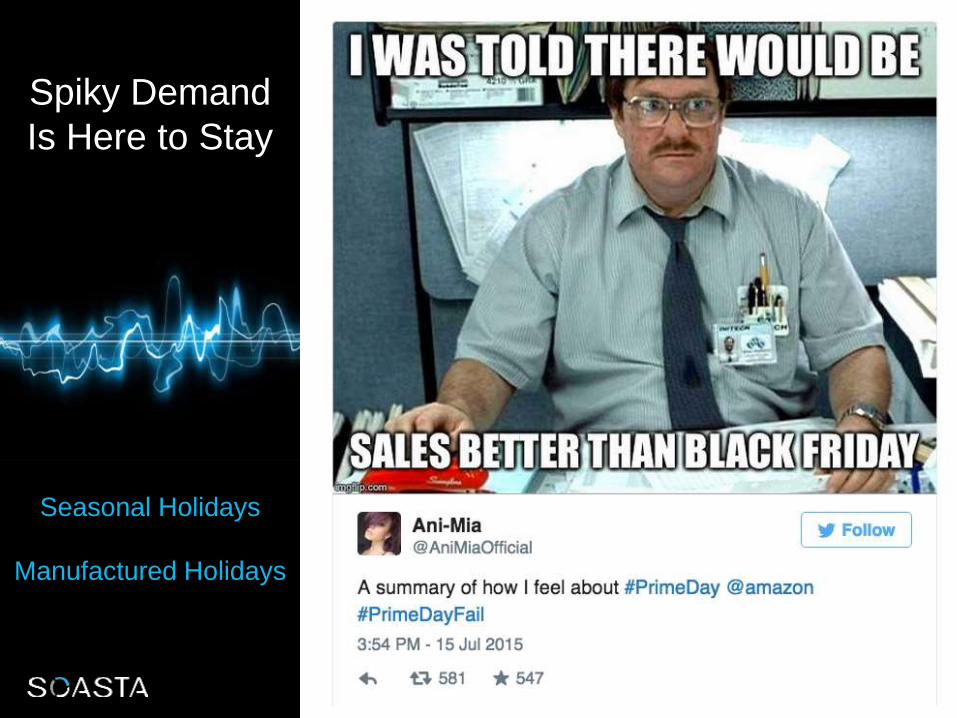
Spiky Demand
Is Here to Stay
Seasonal Holidays
Manufactured Holidays
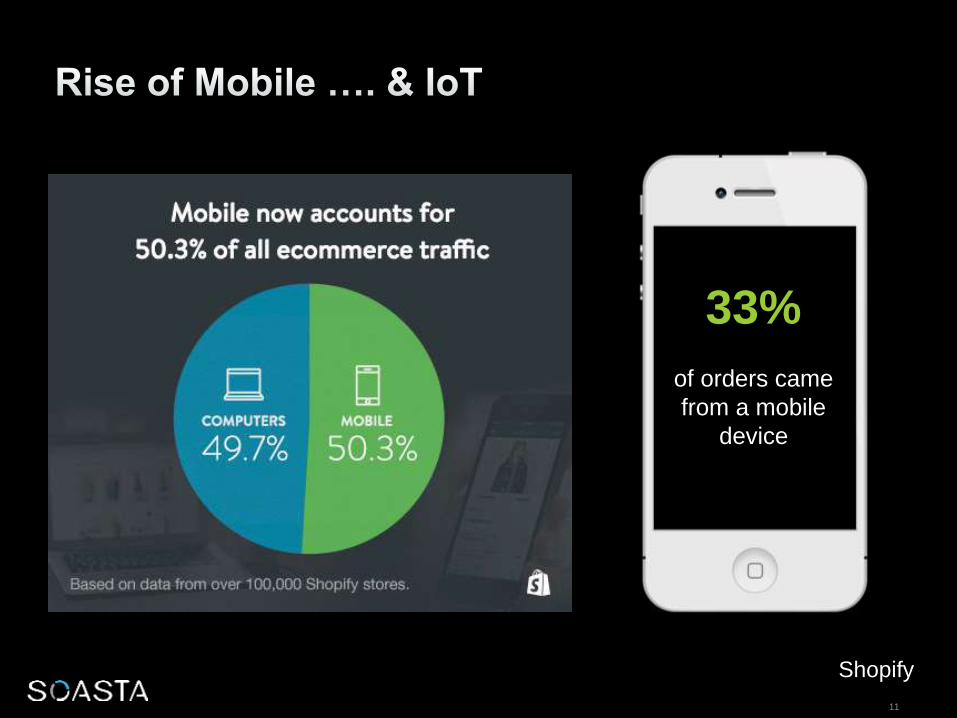
11
33%
of orders came
from a mobile
device
Shopify
12
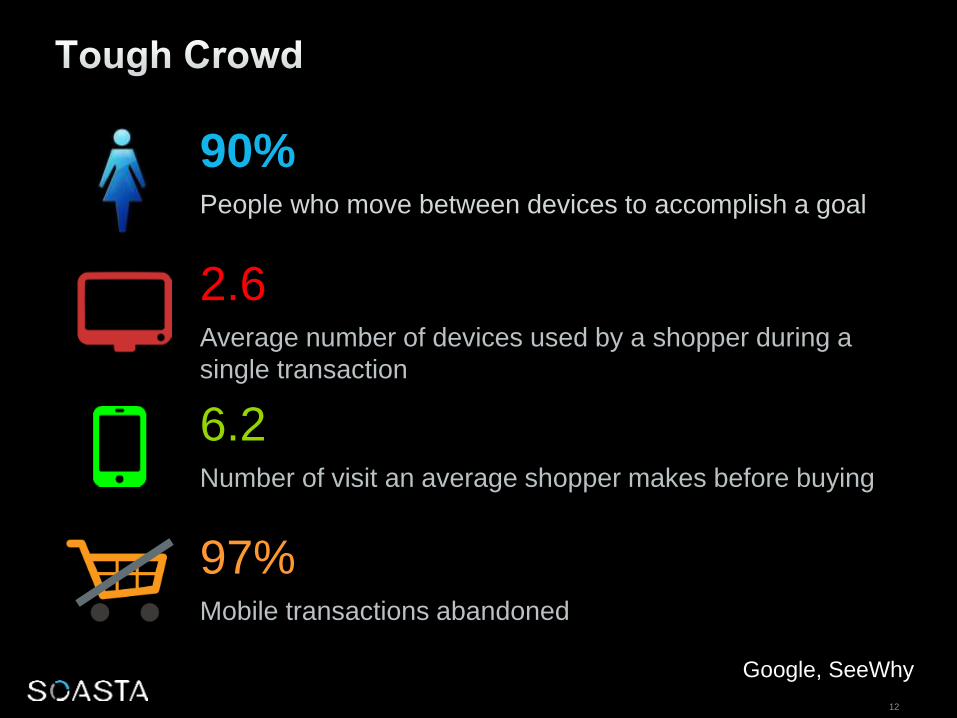
Google, SeeWhy
90%People who move between devices to accomplish a goal
2.6Average number of devices used by a shopper during a
single transaction
6.2Number of visit an average shopper makes before buying
97%Mobile transactions abandoned
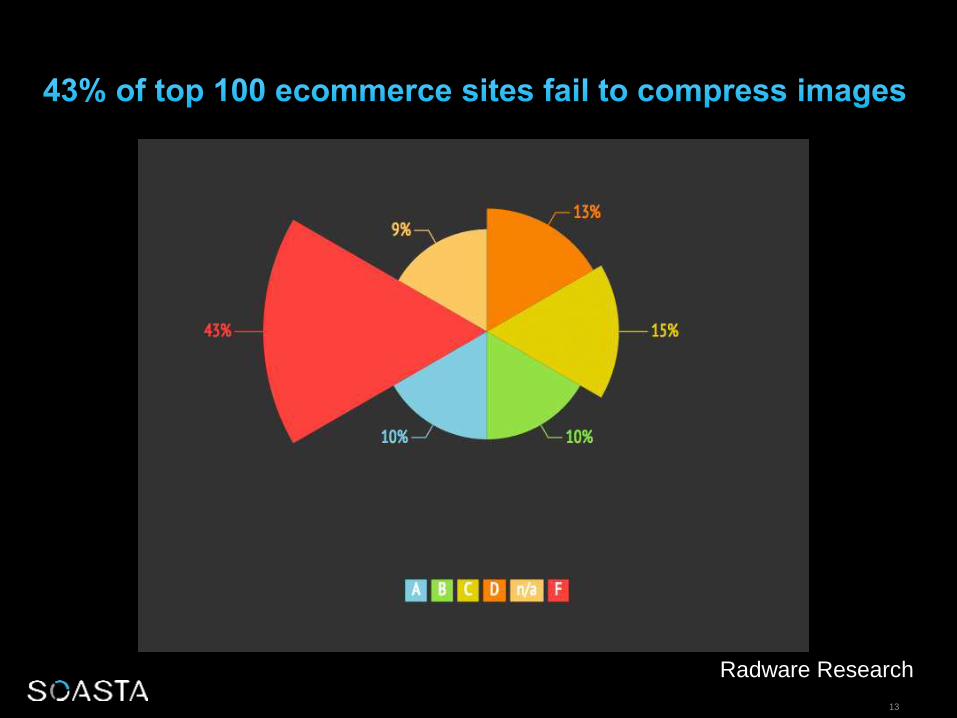
13
Radware Research
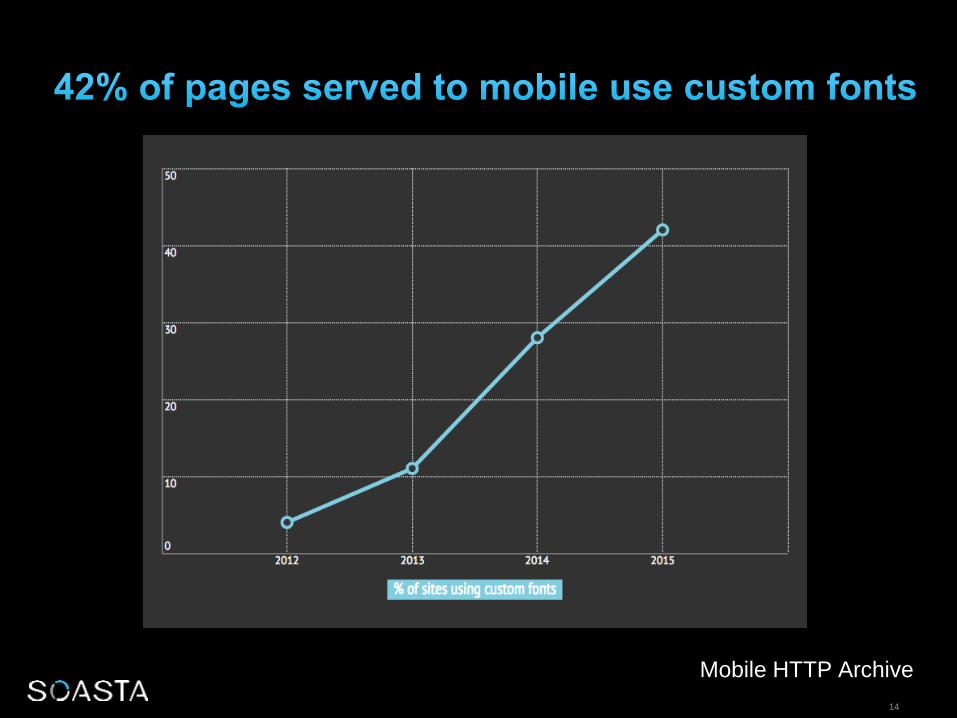
14
Mobile HTTP Archive
15
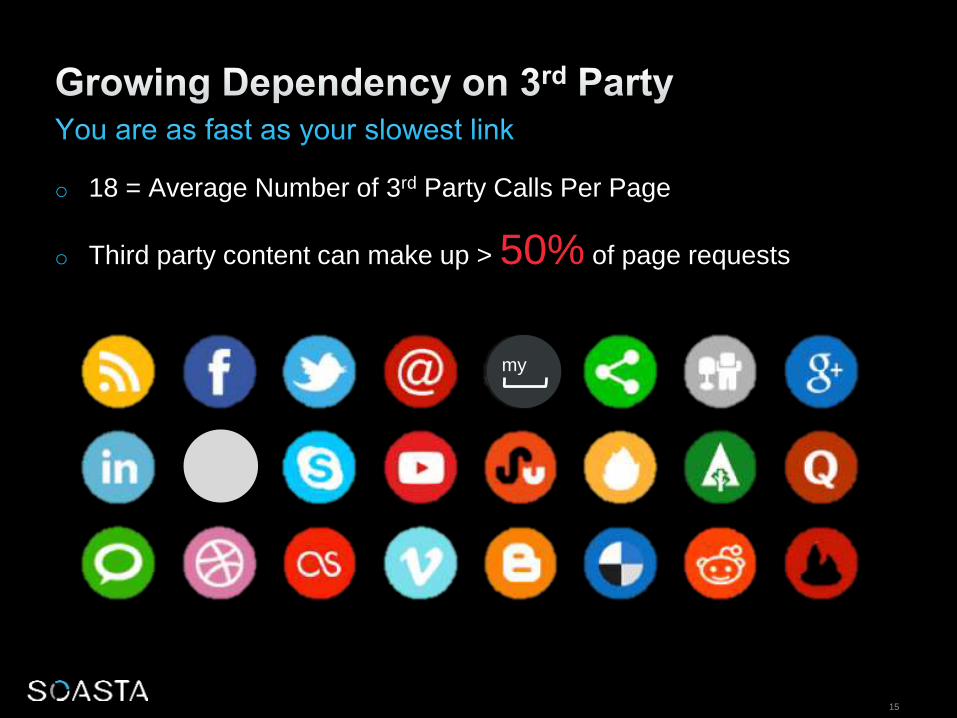
o 18 = Average Number of 3rd Party Calls Per Page
o Third party content can make up > 50% of page requests
my
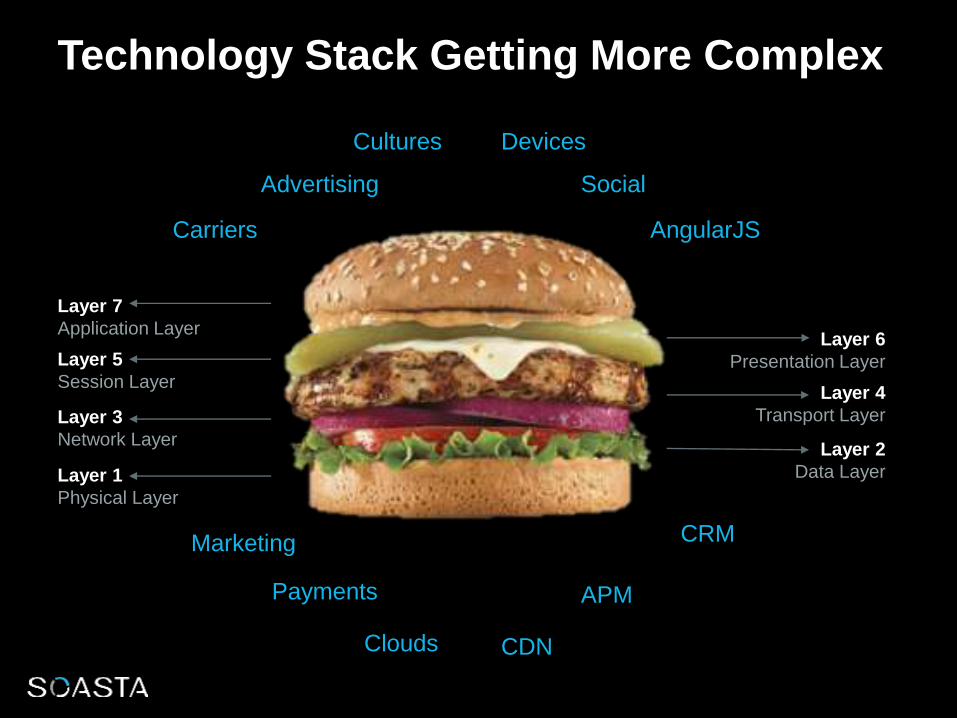
Layer 6
Presentation Layer
Layer 4
Transport Layer
Layer 2
Data Layer
Layer 7
Application Layer
Layer 5
Session Layer
Layer 3
Network Layer
Layer 1
Physical Layer
Technology Stack Getting More Complex
AngularJS
CDN
Payments
Clouds
Social
Cultures
Carriers
CRMMarketing
Advertising
APM
Devices
17
Smart
Need Insights & Control
18
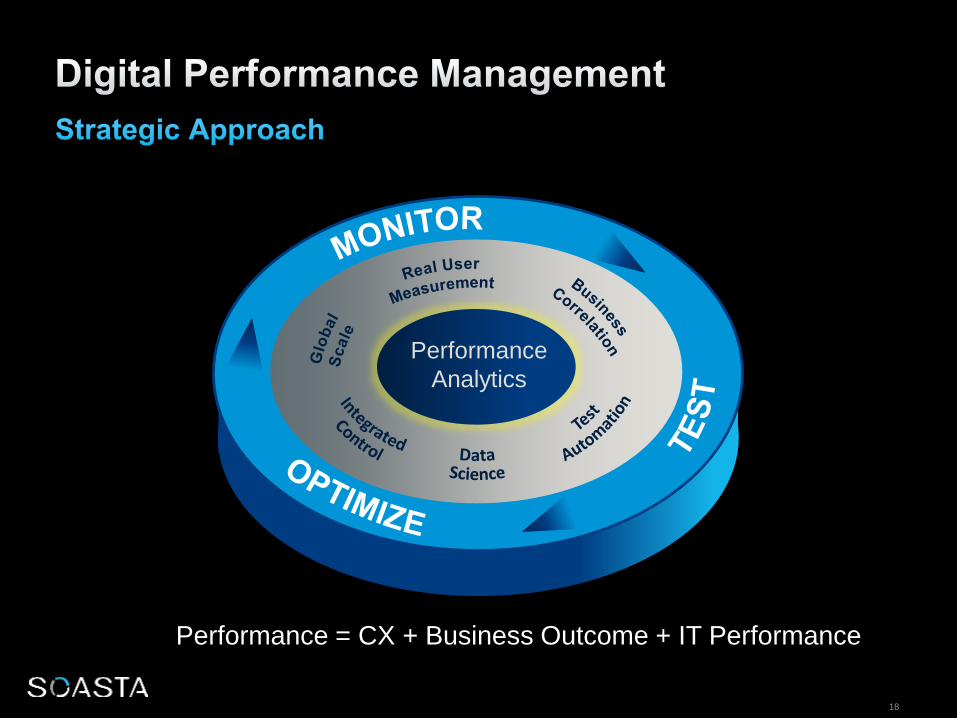
Performance
Analytics
Performance = CX + Business Outcome + IT Performance

DATA SCIENCE TO THE RESCUE
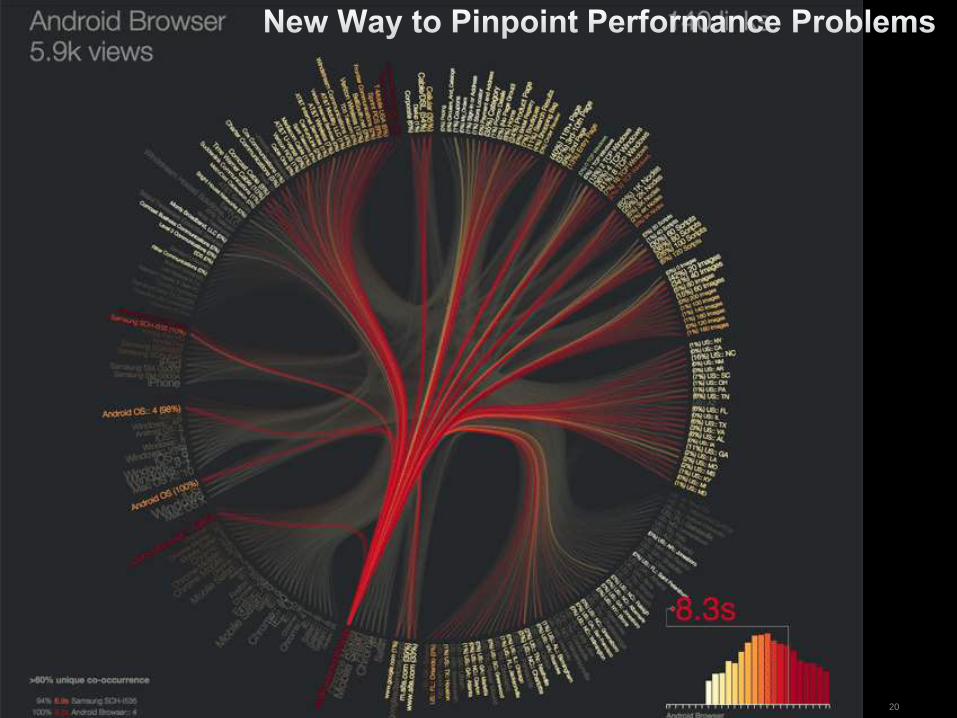
20
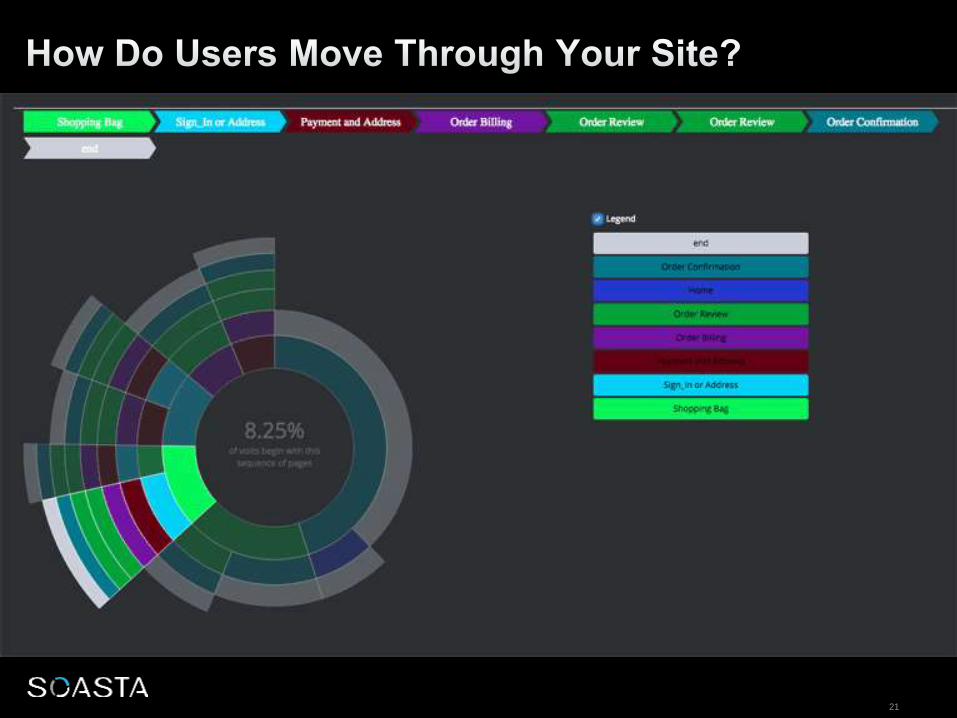
21

22
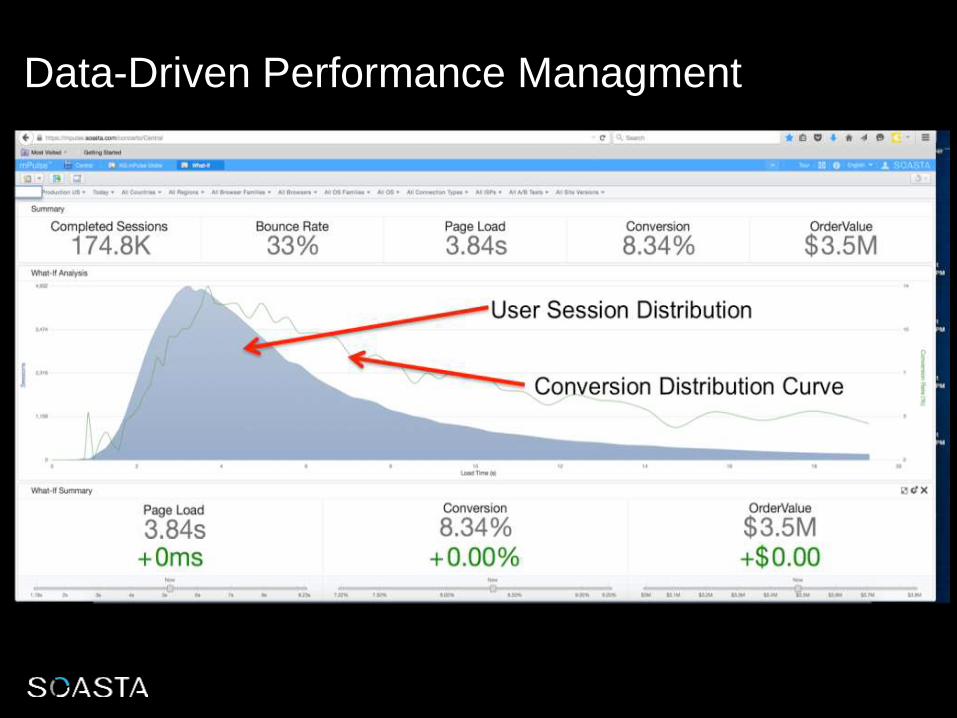
Data-Driven Performance Managment
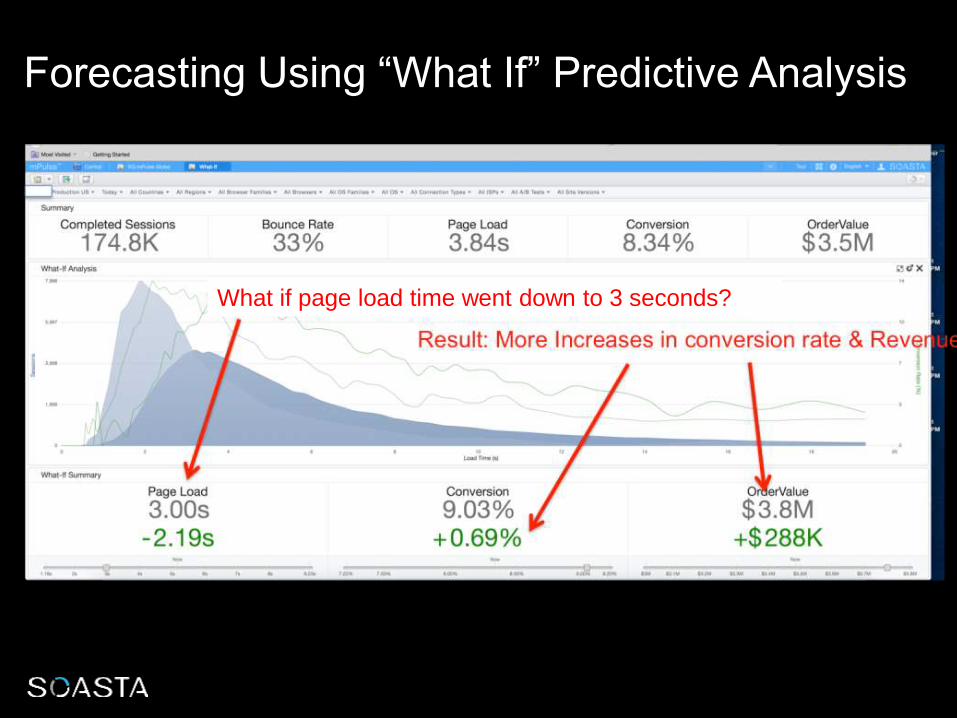
What if page load time went down to 3 seconds?
Forecasting Using “What If” Predictive Analysis
25

27
• Build a high performance culture
• Get to know your “real” users, in real time
• Correlate User Experience, Business & IT metrics
• Identify patterns and optimize smartly
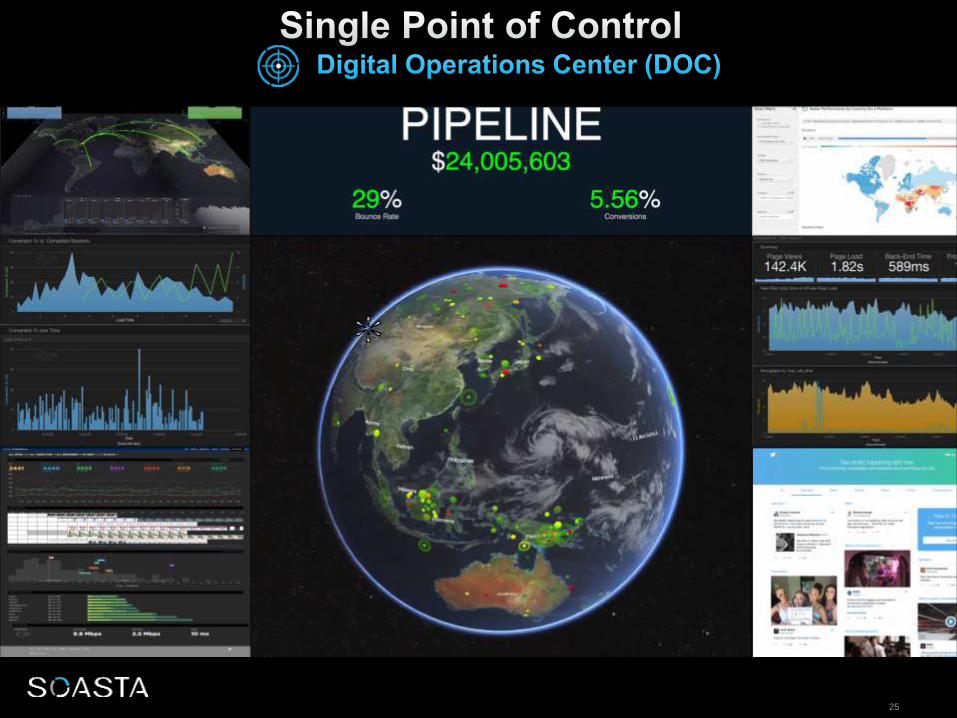
• Get the DOC
Visit Our Booth