ESX IP STORAGE TROUBLESHOOTING BEST PRACTICE · Commercial 10G Packet Capture Solutions ......
20
ESX IP STORAGE TROUBLESHOOTING BEST PRACTICE Packet Capture and Analysis at 10G PERFORMANCE STUDY – DECEMBER 2017
Transcript of ESX IP STORAGE TROUBLESHOOTING BEST PRACTICE · Commercial 10G Packet Capture Solutions ......

ESX IP STORAGE TROUBLESHOOTING BEST PRACTICE Packet Capture and Analysis at 10G
PERFORMANCE STUDY – DECEMBER 2017
ESX IP STORAGE TROUBLESHOOTING BEST PRACTICE PACKET CAPTURE AND ANALYSIS AT 10G
PERFORMANCE STUDY | 2
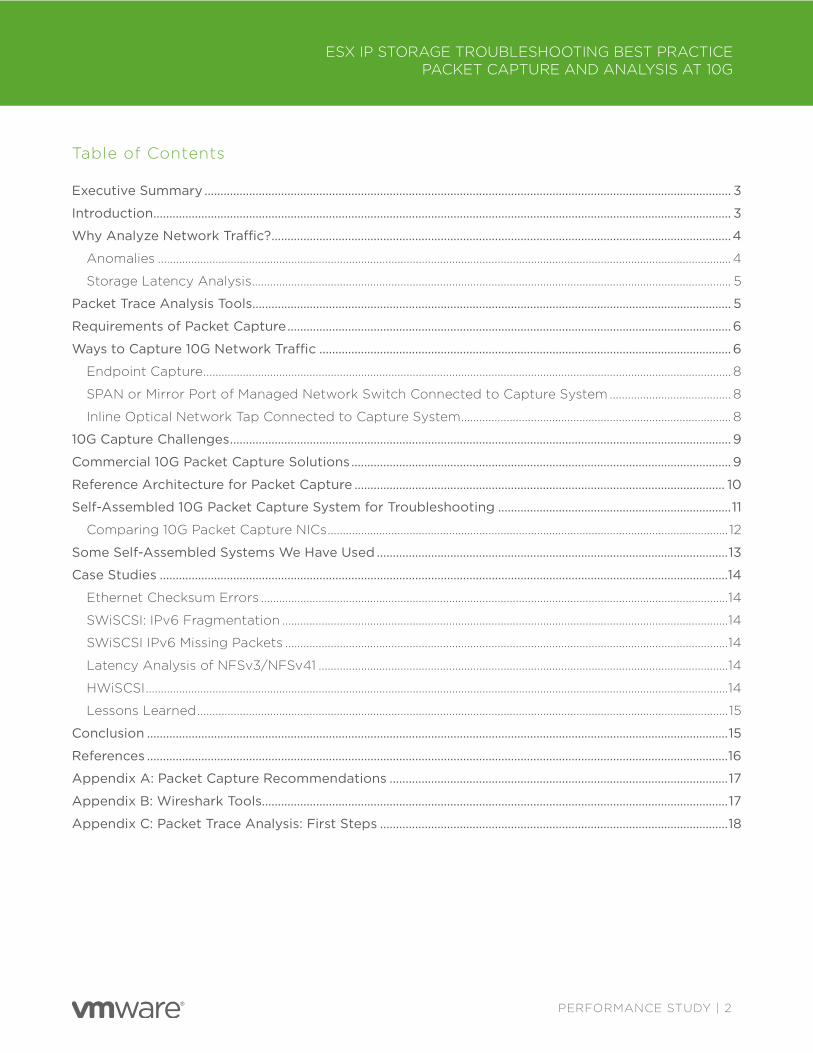
Table of Contents
Executive Summary ..................................................................................................................................................................... 3
Introduction..................................................................................................................................................................................... 3
Why Analyze Network Traffic?................................................................................................................................................ 4
Anomalies ............................................................................................................................................................................................. 4
Storage Latency Analysis .............................................................................................................................................................. 5
Packet Trace Analysis Tools...................................................................................................................................................... 5
Requirements of Packet Capture ........................................................................................................................................... 6
Ways to Capture 10G Network Traffic ................................................................................................................................. 6
Endpoint Capture .............................................................................................................................................................................. 8
SPAN or Mirror Port of Managed Network Switch Connected to Capture System ........................................ 8
Inline Optical Network Tap Connected to Capture System ......................................................................................... 8
10G Capture Challenges ............................................................................................................................................................. 9
Commercial 10G Packet Capture Solutions ....................................................................................................................... 9
Reference Architecture for Packet Capture .................................................................................................................... 10
Self-Assembled 10G Packet Capture System for Troubleshooting ......................................................................... 11
Comparing 10G Packet Capture NICs .................................................................................................................................... 12
Some Self-Assembled Systems We Have Used .............................................................................................................. 13
Case Studies ..................................................................................................................................................................................14
Ethernet Checksum Errors .......................................................................................................................................................... 14
SWiSCSI: IPv6 Fragmentation ................................................................................................................................................... 14
SWiSCSI IPv6 Missing Packets .................................................................................................................................................. 14
Latency Analysis of NFSv3/NFSv41 ....................................................................................................................................... 14
HWiSCSI ................................................................................................................................................................................................ 14
Lessons Learned ............................................................................................................................................................................... 15
Conclusion ...................................................................................................................................................................................... 15
References ...................................................................................................................................................................................... 16
Appendix A: Packet Capture Recommendations .......................................................................................................... 17
Appendix B: Wireshark Tools.................................................................................................................................................. 17
Appendix C: Packet Trace Analysis: First Steps ............................................................................................................. 18
ESX IP STORAGE TROUBLESHOOTING BEST PRACTICE PACKET CAPTURE AND ANALYSIS AT 10G
PERFORMANCE STUDY | 3
Executive Summary Network engineers commonly use network packet traces to troubleshoot TCP/IP networked systems. For this approach to work, the packet trace should ideally include all the packets exchanged by the two network endpoints, and each packet should be tagged by an accurate timestamp. At network speeds of up to 1 gigabit per second (1G), the packet trace can be collected easily using tcpdump on one of the network endpoints. On a 10 gigabit per second (10G) network, the packet rate is significantly higher, and a packet trace collected in this way will suffer from significant capture drops. Furthermore, the packets captured will not be timestamped accurately. These deficiencies preclude the use of such packet traces for a large class of functional or performance analysis in 10G networks.
In this paper, we explore alternatives for packet capture in a VMware vSphere® environment with IP storage (NFS, iSCSI) datastores over a 10G network. We recommend the use of an inline optical network tap to access the traffic of interest. The monitoring outputs of the network tap are connected to a 10G packet capture system, which generates a packet trace file containing a timestamped copy of every packet on the network. Although commercial 10G packet capture systems are commonly available, they may be beyond the budget of some vSphere customers. We present the design of a self-assembled 10G packet capture solution that can be built using commercial components relatively inexpensively. The self-assembled solution is optimized for common troubleshooting scenarios where short duration packet captures can satisfy most analysis requirements.
Our experience troubleshooting a large number of IP storage issues has shown that the ability to capture and analyze packet traces in a VMware ESX® IP storage environment can significantly reduce the mean time to resolution for serious functional and performance issues. We recommend vSphere customers deploying IP storage over 10G networks to include 10G packet capture systems as a best practice to ensure network visibility.
Introduction You might be used to using network packet traces to analyze the functionality and performance of TCP/IP networked systems. For example, a packet trace might:
• Reveal significant packet loss and retransmissions between two network endpoints.
• Indicate that a server is taking an unexpectedly long time to respond to certain client requests.
If you are a vSphere customer using IP storage (NFS, iSCSI) datastores, you might have upgraded your IP storage network from 1 gigabit per second (1G) to 10 gigabits per second (10G). If you have done so, it is important to know that you need specialized hardware to collect high quality packet traces on a 10G network. This is because traditional 1G packet capture techniques can result in capture drops and inaccurate timestamps when used on a 10G network.
Many customers are unaware of this surprising fact about 10G networks until they contact VMware technical support for assistance with some functional or performance issue, and they are directed to collect packet traces for analysis. When high quality packet traces are not available for analysis—as is the case in a large number of customer performance escalations related to IP storage—less efficient troubleshooting techniques must be used, leading to an increase in time to problem resolution.

ESX IP STORAGE TROUBLESHOOTING BEST PRACTICE PACKET CAPTURE AND ANALYSIS AT 10G
PERFORMANCE STUDY | 4
In this paper, we:
• Describe how you can analyze packet traces to identify functional and performance issues in an ESX IP storage environment.
• Compare packet capture alternatives, and explain why we recommend an inline optical network tap connected to a packet capture system.
• Present the challenges of 10G packet capture, and describe key features of commercial 10G capture solutions.
• Describe the design of an inexpensive, self-assembled 10G packet capture solution optimized for troubleshooting that you can build relatively easily. We also describe our experience with multiple prototypes of this design, which we have used in our ESX IP storage testbeds for NFS and iSCSI performance for many years.
• Present examples of analyzing packet traces to solve ESX performance issues for NFSv41, software iSCSI over IPv6, and hardware iSCSI.
The key insight behind our design of the inexpensive, self-assembled 10G packet capture solution for troubleshooting is that in many troubleshooting scenarios where the anomalies can be observed or reproduced easily, short duration packet traces can satisfy most analysis requirements.
Our experience troubleshooting a large number of IP storage issues has shown that capturing and analyzing packet traces in an ESX IP storage environment can significantly reduce the time to resolve serious functional and performance issues. Therefore, we recommend you include 10G packet capture systems in your ESX IP Storage deployment as a best practice to ensure network visibility.
Why Analyze Network Traffic? Consider an ESX host connected to an NFS storage array over some network. Suppose the NFS read performance, in I/Os per second (IOPS), is much lower than expected. To determine what causes the poor performance—ESX, the NFS array, or some interaction between ESX and the NFS array (say by TCP delayed ACK)—we can examine the network traffic between ESX and the NFS array. This can be done by capturing all the packets exchanged between ESX and the NFS array into a packet trace file, and then analyzing this file offline using a packet analyzer utility like Wireshark or tcpdump. By doing so, you can detect anomalies or compute storage latency.
Anomalies By examining a packet trace file, you may detect the following anomalies:
• Ethernet checksum error: This suggests a hardware problem with the sending NIC.
• MTU mismatch: This suggests a configuration issue.
• Packet retransmission (and TCP DUP ACK packets): This suggests potential packet loss in the network.
The particular anomaly you observe will usually help identify the source of the problem. If the problem turns out to be an issue with the NFS array, the packet trace file provides convincing evidence if you report the problem to the NFS array vendor.
ESX IP STORAGE TROUBLESHOOTING BEST PRACTICE PACKET CAPTURE AND ANALYSIS AT 10G
PERFORMANCE STUDY | 5
Storage Latency Analysis You can also analyze a packet trace file to compute the client and server-side latencies of an IP storage system (say NFS).
• Total latency: You can compute the total latency of an I/O operation from the observed IOPS (say from esxtop) and the number of concurrent operations (or outstanding IOs, aka OIOs) from the I/O workload generator (for example, Iometer [1]).
• Server (storage array) latency: NFS I/O consists of Remote Procedure Call (RPC) Call and Reply messages. There is a unique transaction ID (xid) for each matching Call and Reply pair. The latency of a particular RPC Call-Reply pair is the timestamp delta of the two packets containing the corresponding Call and Reply. You can compute the mean server latency from the packet trace by computing the Call-Reply latencies of individual Call-Reply pairs.
You can use Tshark [2], the command-line variant of Wireshark, to select RPC Call and Reply packets and to extract timestamps and xids from these packets.
• Client (ESX) latency: Assuming negligible network delay in the physical network, total latency is the sum of client and server latencies. Hence, client latency is the difference between total latency and server latency.
You can analyze packet traces to compute precise server and client-side latencies without incurring any probe effect on the server or client. The client (or server) latency includes all the time spent on the client (or server) side, until packets are sent onto the physical network.
Note: We don’t recommend endpoint-based capture because it is typically unable to provide latency estimates covering the entire I/O and network stack down to the physical network.
Packet Trace Analysis Tools You can analyze packet traces offline using common tools such as tcpdump [3], tcptrace [4], Wireshark [5], or Tshark [2]. Tshark is the command-line variant of Wireshark, and you can incorporate it into higher-level packet analysis software. See “Appendix B: Wireshark Tools” for a brief overview of Wireshark tools and recommended initial steps for packet trace analysis.
ESX IP STORAGE TROUBLESHOOTING BEST PRACTICE PACKET CAPTURE AND ANALYSIS AT 10G
PERFORMANCE STUDY | 6
Requirements of Packet Capture A packet trace used for troubleshooting functional or performance issues should ideally possess the following properties:
• No capture drops: The trace should contain all packets exchanged between the two network endpoints. A packet trace with capture drops significantly increases the complexity of packet trace analysis. When you (or a software tool) detects a missing packet in the packet trace (say from TCP sequence number analysis), the analysis must determine if the missing packet is a packet loss on the monitored network, or if the missing packet is simply an artifact of a capture drop.
• Accurate and high resolution packet timestamps: Each packet should be timestamped at the time it is observed on the network. A packet trace with accurate timestamps enables you to deduce the time delta between network events of interest. For example, you can use the timestamps to estimate the time between packet loss and retransmission.
• Full packet (not header only): For the performance analysis of application-level protocols, it is useful to capture full packets and not only TCP packet headers. Using NFS as an example, you can compute the RPC Call-Reply latency of individual RPC requests from the time delta between Call and Reply operations with matching transaction IDs. This method for measuring latency is only feasible if full packets are captured. For the analysis of TCP-level anomalies (say, packet loss), it may be sufficient to capture only TCP headers.
The act of packet capture should satisfy the following requirement:
• Minimal probe effect: Packet capture should not perturb any component of the network being monitored, especially the network endpoints. A packet capture application such as tcpdump should not be run on a network endpoint because of its potential impact on the timing or scheduling behavior of the endpoint.
Ways to Capture 10G Network Traffic You can capture network traffic between two endpoints (ESX and the NFS array in our example) in the following ways, as shown in Figure 1. The tradeoffs of the packet capture alternatives are summarized in Table 1.

ESX IP STORAGE TROUBLESHOOTING BEST PRACTICE PACKET CAPTURE AND ANALYSIS AT 10G
PERFORMANCE STUDY | 7
Figure 1: Packet capture observation points (in red)
Observation Point
Capture By Probe Effect
Packet Trace Quality (Timestamp accuracy &
capture drops)
Ease of Deployment
Notes
EndPoint High Poor High (best) TSO/LRO, driver bugs
Mirror port + Capture system Medium Fair Low Switch introduces jitter
Inline Tap + Capture system Low (best) Good (best) Low Network outage to install
Table 1: Packet capture alternatives and tradeoffs

ESX IP STORAGE TROUBLESHOOTING BEST PRACTICE PACKET CAPTURE AND ANALYSIS AT 10G
PERFORMANCE STUDY | 8
Endpoint Capture You can use a software application such as tcpdump on a network endpoint. No extra hardware is required, and the capture can be accomplished easily. (On ESX, this is done using pktcap-uw with the vmknic.)
However, endpoint capture is problematic because it may introduce probe effects—including additional CPU usage or extra latency—that may alter the behavior of the endpoint being analyzed.
Endpoint capture is also limited because it produces a packet trace of the packets being sent from the TCP/IP stack to the physical NIC driver, which is not necessarily identical to a trace of the packets that will be sent by the NIC onto the physical network. This distinction becomes important when common optimizations such as TCP Segmentation Offload (TSO, for send) or Large Receive Offload (LRO, for receive) are implemented in the TCP/IP stack or in the NIC. In particular, the packet rate and packet size of the packets traversing the TCP/IP stack will be very different from similar metrics of the packets on the physical network. If there are issues with the TSO/LRO implementation, this distinction may become important because the endpoint-captured packet trace might not exhibit the problems that are actually occurring on the physical network.
For endpoint capture on ESX, you can obtain a packet trace on ESX by configuring a virtual network switch in promiscuous mode, and then connecting a capture VM running tcpdump to the vswitch. This option incurs substantial probe effects and might alter the behavior of the ESX endpoint.
SPAN or Mirror Port of Managed Network Switch Connected to Capture System You can configure a managed physical network switch to send a copy of all the traffic between two ports (say the ports for ESX and the NFS array) to a mirror port. If you connect a capture system to the mirror port, all the packets between the two endpoints are captured. However, the switch might introduce timing jitter into the mirrored traffic, especially when the switch is under heavy load.
Inline Optical Network Tap Connected to Capture System You can install an inline optical network tap between the two network endpoints of interest. A copy of the network traffic between the two endpoints is sent through the tap's monitoring port to a capture system. However, tap installation disrupts network traffic between the endpoints and requires brief network downtime.
In a troubleshooting environment where you want minimal probe effects and packet traces with accurate timestamps and no capture drops, an inline optical network tap connected to a capture system is the preferred packet capture solution. This solution requires a relatively high effort to deploy, but it greatly reduces the time to resolve problems on the network.
ESX IP STORAGE TROUBLESHOOTING BEST PRACTICE PACKET CAPTURE AND ANALYSIS AT 10G
PERFORMANCE STUDY | 9
10G Capture Challenges Before moving ahead with a packet capture system, you should be aware of the following challenges:
• Capture Drops: On a 1G and slower network, the packet rate is relatively low. In this case, you can successfully capture without capture drops when you use endpoint capture or a capture system with a generic 1G NIC connected to a mirror port or to a network tap. On a 10G network, the packet rate is substantially higher. In this case, there will be capture drops if you use endpoint capture (including using pktcap-uw on ESX) or a generic 10G NIC on a capture system connected to a mirror port or a network tap [6].
• Packet Timestamps: If you use a capture system with a generic 10G NIC, the packet timestamps will be inaccurate. The packets are timestamped when they are transferred from the NIC to the operating system kernel, and not when they arrive on the NIC. Because many packets are transferred from the NIC to the kernel at the same time at 10G line rate, these packets will have very similar timestamps. The timestamp delta for these packets will not accurately reflect the difference in packet arrival time at the NIC.
• Sequential Write Throughput: When you capture packets at 10G line rate, you need a very fast storage subsystem because the packet trace file grows at the rate of 2 × 10 gigabits (Gb) per second, which equals 2.5 gigabytes (GB) per second.
Commercial 10G Packet Capture Solutions Commercial 10G packet capture solutions are commonly available from multiple vendors. The high-end versions of these products can capture a full-duplex 10G connection and write all the packets (including payload) to persistent storage continuously. Such a system uses a specialized 10G packet capture NIC (typically with an FPGA) with a lot of memory onboard and can handle 10G packet rates without capture drops. In addition, each packet is timestamped on the NIC when it arrives, not when the packet is eventually transferred to the operating system kernel of the capture system. As these systems are targeted for the continuous capture market—not for the troubleshooting market—most use elaborate RAID-based storage systems and proprietary OS kernel modifications to support high sustained sequential write throughput. Many of these systems are relatively expensive—with a significant fraction of the cost dominated by the storage subsystem—and may be beyond the budgets of some customer environments.

ESX IP STORAGE TROUBLESHOOTING BEST PRACTICE PACKET CAPTURE AND ANALYSIS AT 10G
PERFORMANCE STUDY | 10
Reference Architecture for Packet Capture In our reference architecture for packet capture (Figure 2), we installed an inline optical network tap on the physical network between the ESX host and the storage array. We connected the monitoring outputs of the tap to a 10G packet capture system, which writes a packet trace file containing a timestamped copy of every packet of the traffic being monitored.
Figure 2: Optical tap connections
ESX IP STORAGE TROUBLESHOOTING BEST PRACTICE PACKET CAPTURE AND ANALYSIS AT 10G
PERFORMANCE STUDY | 11
Self-Assembled 10G Packet Capture System for Troubleshooting In this paper, we focus on less expensive systems you can build yourself for troubleshooting purposes. In a troubleshooting use case where high quality but short duration packet traces (lasting minutes, not hours) is sufficient for most analysis, the RAID-based storage system in commercial solutions that support high sustained write throughput for continuous capture is not needed.
In our experience, you can build your own packet capture system for troubleshooting with the following components:
• Native (not virtualized) Linux system: The system should include fast processors (3.0+GHz) and a significant amount of memory (say 96GB).
• 10G packet capture NIC: A specialized NIC (not a generic 10G NIC) is required to handle 10G packet rates without capture drops, and is also required to timestamp packets accurately. These NICs are available from multiple vendors. The packet capture NIC vendor usually provides the packet capture application, and no software development is required.
• Memory-based filesystem: TmpFS or RamFS is used to store the packet trace file being generated. The use of a memory-based filesystem reduces the complexity and cost of the capture system significantly. Alternatively, you can use high-performance SSDs.
Figure 3 shows the architecture of the self-assembled packet capture system for troubleshooting.
Limitation: In this design, the sequential-write throughput of the memory-based filesystem will most likely be the performance bottleneck, and the system might not be able to capture at sustained 10G line rate. Nevertheless, the capability to capture lossless packet traces with accurate timestamps at multiple gigabits per second (<10G) will be useful in many troubleshooting scenarios.

ESX IP STORAGE TROUBLESHOOTING BEST PRACTICE PACKET CAPTURE AND ANALYSIS AT 10G
PERFORMANCE STUDY | 12
Figure 3: Architecture of the self-assembled packet capture system
Comparing 10G Packet Capture NICs 10G packet capture NICs are commercially available from multiple vendors. Because packet capture NICs from different vendors differ in subtle but significant ways, the following criteria are useful when selecting a packet capture NIC when building your own packet capture system:
• 10G: Does the capture NIC support sustained bidirectional 10G line-rate capture?
• Packet timestamp resolution: This is typically in single-digit nanoseconds.
• Bidirectional traffic capture: Does the capture software generate one bidirectional packet trace file, or two unidirectional trace files that must be merged post capture?
• Capture file format: Does the capture software generate a file in pcap (or pcapng) format, or in some proprietary format? For a proprietary format, can Wireshark (or your favorite packet analysis tool) open the packet trace file without format conversion? Would the workflow involve a packet file format conversion step?
• Capture card specs: PCIe Gen3 (x8 or x16) and physical form factor.

ESX IP STORAGE TROUBLESHOOTING BEST PRACTICE PACKET CAPTURE AND ANALYSIS AT 10G
PERFORMANCE STUDY | 13
Some Self-Assembled Systems We Have Used In our lab, we use three self-assembled packet capture systems for IP storage performance analysis. Each system uses a packet capture NIC from a different vendor: Endace DAG 9.2x2 [7], Napatech NT20E2 [8], and Solarflare SFN7322F [9]. We built these systems when commercial packet capture systems were extremely expensive. In recent years, we added a commercial capture appliance, Fmad FMADIO20 [10], to our lab because the price of it became competitive with the self-assembled solutions we built. We list the specifications of each system in Table 2.
Each capture system is used with the testbed of an IP storage array, and is used extensively for performance analysis. The commercial system has a Web UI, while the self-assembled systems are controlled with different command-line interfaces. We have been pleased with our experience with all the capture systems in our lab.
When choosing between self-assembled packet capture systems and commercial capture appliances, you should consider capture system performance, the feasibility of deploying self-assembled packet capture systems in your environment, and vendor preference.
Capture System 1 Capture System 2 Capture System 3 Specs
Capture NIC Endace DAG 9.2x2 Napatech NT20E2 Solarflare SFN7322F 10G optical dual port capture NIC
Capture NIC Form Factor Half height, half length Half height, half length Half height, half length Half height, half length
Timestamp Resolution 7.5ns 10ns 7.5ns
File Format erf cap pcap
Capture file(s) 1: bidirectional 1: bidirectional 2: one per direction
System HP DL380 G7 HP DL380p G8 HP DL380 G7
CPU 3.46 GHz 3.3 GHz 3.46 GHz 3.0+ GHz
RAM 96GB 96GB 96GB 64+GB
PCIe Slot PCIe Gen2 x8 PCIe Gen2 x8 PCIe Gen2 x8 PCIe Gen3 x8
OS RHEL 6.0 RHEL 6.1 RHEL 6.2 RHEL 6.0+ (64bit)
Filesystem RamFS+ext2 RamFS+ext2 TmpFS RamFS+ext2 or TmpFS
In Use Since 2012 2012 2014
Table 2: Self-assembled packet capture systems we use in a VMware Performance Engineering lab

ESX IP STORAGE TROUBLESHOOTING BEST PRACTICE PACKET CAPTURE AND ANALYSIS AT 10G
PERFORMANCE STUDY | 14
Case Studies To illustrate the power of packet trace analysis, we present sample issues encountered on our ESX IP storage performance testbeds during ESX development that we resolved by analyzing packet traces.
Ethernet Checksum Errors A storage array sent packets that had Ethernet checksum errors, which we detected using the Expert Info feature of Wireshark. As a result, we identified and replaced the malfunctioning 10G NIC on the storage array.
SWiSCSI: IPv6 Fragmentation ESX SWiSCSI read IOPS for IPv6 was significantly lower than that for IPv4. ESX timing profiler stats indicated that IPv6 fragments were being reassembled on ESX. An IPv6 packet trace confirmed that the storage array was unexpectedly sending IPv6 fragments. We reported the problem to the storage array vendor with a relevant packet trace, and it was fixed in a later version of the storage array firmware.
SWiSCSI IPv6 Missing Packets ESX SWiSCSI IPv6 read (64K+) IOPS for MTU=1500 was significantly lower than that for MTU=9000. ESX net-stats reported a large number of out-of-order packets for the vmknic for MTU=1500. The initial suspicion was a bug in ESX's Large Receive Offload (LRO) implementation. However, a packet trace showed a significant amount of packet loss and packet retransmission from the storage array. We reported the problem to the storage array vendor, who responded that TCP Segmentation Offload (TSO) in the array's TCP/IP stack sends large TSO segments, which triggers a 10G NIC driver bug on the array. This driver bug drops TSO segments of larger than 64K bytes, resulting in retransmissions and poor throughput.
This problem of missing packets caused by the NIC driver is a perfect example of problems that can be observed in a packet trace captured on the physical connection, but cannot be observed in a packet trace captured on the TCP/IP stack by using endpoint capture. The NIC driver problem was fixed in a subsequent version of the storage array firmware.
Latency Analysis of NFSv3/NFSv41 NFSv3 and NFSv41 are different protocols with very different implementations, for both the client (ESX) and the server (storage array). When comparing NFSv3 and NFSv41 performance, packet traces provide a relatively easy way to determine if NFSv41 performance degradations (relative to NFSv3) are caused by issues on the client, the server, or due to client-server interactions. (See “Storage Latency Analysis” earlier in this paper.)
HWiSCSI An ESX device driver upgrade for a dependent HWiSCSI adapter resulted in a huge drop in ESX HWiSCSI read (64K) throughput to almost zero for storage arrays from a particular vendor. The HWiSCSI adapter vendor eventually isolated the problem to the use of a specific brand of 10G NIC on the storage array. As ESX dependent HWiSCSI adapters bypass ESX's TCP/IP stack for HWiSCSI data
ESX IP STORAGE TROUBLESHOOTING BEST PRACTICE PACKET CAPTURE AND ANALYSIS AT 10G
PERFORMANCE STUDY | 15
traffic, endpoint capture on ESX using pktcap-uw was not able to capture any packet trace for this traffic for analysis. To assist the HWiSCSI adapter vendor with its analysis, we collected a large number of packet traces from our testbed, where we could easily reproduce the problem.
Lessons Learned Packet trace analysis is an indispensable technique for the functional and performance troubleshooting of ESX IP storage systems. The technique allows us to quickly isolate an issue to ESX or to the storage array. In either case, the packet trace becomes an irrefutable piece of evidence when the problem is reported to ESX Engineering or to the storage array vendor.
Conclusion In this paper, we:
• Described how you can use network packet traces for the functional and performance analysis of ESX IP storage systems. The analysis can detect network anomalies, and it can also compute server-side latency from the packet trace.
• Compared packet capture alternatives for physical networks in an ESX IP storage environment.
• Recommended the use of inline optical network taps for access to the network traffic being monitored.
• Presented the challenges for 10G packet capture, and described key features in commercial 10G capture solutions. Because commercial 10G capture solutions are relatively expensive, we described the design of a 10G packet capture solution for troubleshooting that you can build relatively inexpensively using commercial components. The key insight behind this design is that in many troubleshooting scenarios where the anomalies can be observed or reproduced easily, short duration but high quality packet traces (with no capture drops and with accurate timestamps) can satisfy most analysis requirements.
We have used multiple prototypes of the self-assembled capture solution, as well as a commercial capture solution, in our ESX IP storage testbeds for NFS and iSCSI performance analysis over multiple years. We presented examples of ESX IP storage performance issues that were identified using packet trace analysis. Although this paper has focused on the use of packet trace analysis in ESX IP storage environments, the techniques described here can be applied to other networked use cases, such as vMotion and vSAN.
Our experience troubleshooting many IP storage issues has shown that the ability to capture and analyze packet traces in an ESX IP storage environment can significantly reduce the mean time to resolution for serious functional and performance issues. When reporting an IP storage problem to VMware or to a storage array vendor, an accompanying packet trace file is a great piece of evidence that can reduce the time required by the responsible engineering teams to identify the problem. We recommend vSphere customers deploying ESX IP storage over 10G networks to deploy 10G packet capture systems as a best practice to ensure network visibility.
ESX IP STORAGE TROUBLESHOOTING BEST PRACTICE PACKET CAPTURE AND ANALYSIS AT 10G
PERFORMANCE STUDY | 16
References
[1] Iometer. http://www.iometer.org
[2] Wireshark Foundation. Tshark: Terminal-based Wireshark. http://www.wireshark.org/docs/wsug_html_chunked/AppToolstshark.html
[3] Tcpdump. http://www.tcpdump.org
[4] Tcptrace. http://www.tcptrace.org
[5] Wireshark Foundation. (2017, November) Wireshark. http://www.wireshark.org
[6] Fabian Schneider, Jörg Wallerich, and Anja Feldmann. (2007) Packet Capture in 10-Gigabit Ethernet Environments Using Contemporary Commodity Hardware. https://link.springer.com/chapter/10.1007/978-3-540-71617-4_21
[7] Endace Technology Limited. (2016) Endace DAG 9.2x2. https://www.endace.com/dag-9.2x2-datasheet.pdf
[8] Napatech Inc. (2014) NT20E2 Capture for Ethernet and SONET/SDH. http://ca.westcon.com/documents/53847/dn0364_nt20e2_capture_for_ethernet_sonet_sdh_data_sheet.pdf
[9] Solarflare Communications, Inc. (2015) Flareon Ultra SFN7322F Dual-Port 10GbE PCIe 3.0. https://www.solarflare.com/Media/Default/PDFs/SF-111380-CD-LATEST_Solarflare_SFN7322F_Product_Brief.pdf
[10] Fmad Engineering LLC. (2017) FMADIO: Ultimate 20G Packet Capture. http://fmad.io/products-20G-packet-capture.html
[11] Wireshark Foundation. Conference proceedings of SharkFest, annual conference of Wireshark developers and users. https://sharkfestus.wireshark.org/retrospective
[12] Wireshark Foundation. (2012) A-1: Deep Dive Packet Analysis. https://sharkfest.wireshark.org/sharkfest.12/presentations/A-1_Deep_Dive_Packet_Analysis.pdf
[13] Wireshark Foundation. (2017) Wireshark Manual Pages. https://www.wireshark.org/docs/man-pages

ESX IP STORAGE TROUBLESHOOTING BEST PRACTICE PACKET CAPTURE AND ANALYSIS AT 10G
PERFORMANCE STUDY | 17
Note: An earlier version of this paper was published in the proceedings of RADIO 2014, VMWare's internal research and development conference.
• Title: Affordable 10Gigabit Packet Capture Solution for Physical Networks in a Lab Environment
• Author: Kinson Ho, Performance Engineering.
• Reference: RADIO 2014, May 12-14, 2014, San Francisco, CA, USA.
Appendix A: Packet Capture Recommendations Fine points: We recommend the following guidelines for packet capture:
• Capture TCP's 3-way handshake (if possible), which includes the TCP window size scaling factor for the connection.
• Capture with nanosecond timestamps (for 10G), if supported by the capture system.
• Capture the full payload, not only TCP headers.
File format: When sending packet trace files to VMware for analysis, we recommend that the files be in .pcap.gz or .pcapng.gz format.
Appendix B: Wireshark Tools Wireshark is a free and open source network packet analyzer that is widely used for packet trace analysis. The Wireshark distribution includes Wireshark (GUI), Tshark (command line), and packet trace manipulation tools including mergecap, editcap, reordercap, and capinfos. The tools run on Windows, Linux, FreeBSD and macOS. We highly recommend the use of Wireshark/Tshark for packet trace analysis.
• wireshark: GUI packet analyzer. wireshark -r <infile>
• tshark: Command-line version of Wireshark. Great for scripting and batch processing. tshark -r <infile> ...
• mergecap: merge multiple capture files into one file. mergecap -w <outfile> <infile> [<infile> ...]
• editcap: extract a subset of packets from a capture file. editcap -r <infile> <outfile> <packetMin>-<packetMax>
• reordercap: sort packets of capture file by timestamp. reordercap <infile> <outfile>
• capinfos: print summary info about capture file. capinfos <infile>
Note: The above tools can open gzipped packet trace files (*.pcap.gz or *.pcapng.gz) directly. There is no need to unzip a packet trace file before invoking these tools.
ESX IP STORAGE TROUBLESHOOTING BEST PRACTICE PACKET CAPTURE AND ANALYSIS AT 10G
PERFORMANCE STUDY | 18
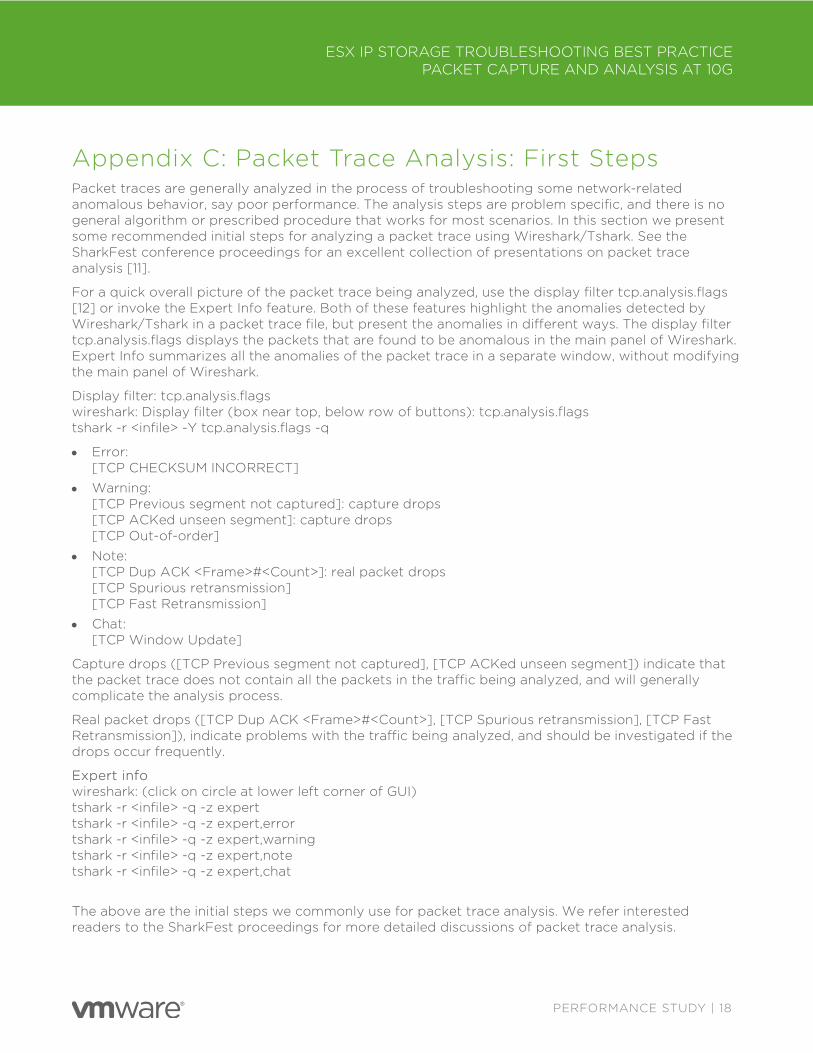
Appendix C: Packet Trace Analysis: First Steps Packet traces are generally analyzed in the process of troubleshooting some network-related anomalous behavior, say poor performance. The analysis steps are problem specific, and there is no general algorithm or prescribed procedure that works for most scenarios. In this section we present some recommended initial steps for analyzing a packet trace using Wireshark/Tshark. See the SharkFest conference proceedings for an excellent collection of presentations on packet trace analysis [11].
For a quick overall picture of the packet trace being analyzed, use the display filter tcp.analysis.flags [12] or invoke the Expert Info feature. Both of these features highlight the anomalies detected by Wireshark/Tshark in a packet trace file, but present the anomalies in different ways. The display filter tcp.analysis.flags displays the packets that are found to be anomalous in the main panel of Wireshark. Expert Info summarizes all the anomalies of the packet trace in a separate window, without modifying the main panel of Wireshark.
Display filter: tcp.analysis.flags wireshark: Display filter (box near top, below row of buttons): tcp.analysis.flags tshark -r <infile> -Y tcp.analysis.flags -q
• Error: [TCP CHECKSUM INCORRECT]
• Warning: [TCP Previous segment not captured]: capture drops [TCP ACKed unseen segment]: capture drops [TCP Out-of-order]
• Note: [TCP Dup ACK <Frame>#<Count>]: real packet drops [TCP Spurious retransmission] [TCP Fast Retransmission]
• Chat: [TCP Window Update]
Capture drops ([TCP Previous segment not captured], [TCP ACKed unseen segment]) indicate that the packet trace does not contain all the packets in the traffic being analyzed, and will generally complicate the analysis process.
Real packet drops ([TCP Dup ACK <Frame>#<Count>], [TCP Spurious retransmission], [TCP Fast Retransmission]), indicate problems with the traffic being analyzed, and should be investigated if the drops occur frequently.
Expert info wireshark: (click on circle at lower left corner of GUI) tshark -r <infile> -q -z expert tshark -r <infile> -q -z expert,error tshark -r <infile> -q -z expert,warning tshark -r <infile> -q -z expert,note tshark -r <infile> -q -z expert,chat
The above are the initial steps we commonly use for packet trace analysis. We refer interested readers to the SharkFest proceedings for more detailed discussions of packet trace analysis.
ESX IP STORAGE TROUBLESHOOTING BEST PRACTICE PACKET CAPTURE AND ANALYSIS AT 10G
PERFORMANCE STUDY | 19
About the Author
Kinson Ho is a Staff Engineer in Performance Engineering at VMware with a focus on vSphere storage performance, including FC, NFS and iSCSI performance. His interests include the use of packet capture and analysis for performance troubleshooting on 10G networks.
Acknowledgements
The author thanks Mark Achtemichuk, Boon Ang, Brian Garrett, Shashank Rajvanshi, and Sankaran Sivathanu for their insightful comments about the paper, Su Tang for the beautiful illustrations that help convey key concepts, and Julie Brodeur for superb technical editing that greatly improved the organization and readability of the paper.
Special thanks are due to Hansang Bae, Jasper Bongertz, and Christian Landstrom for their excellent SharkFest presentations on the art of packet trace analysis, and Stephen Donnelly for discussions regarding 10G packet capture systems.

VMware, Inc. 3401 Hillview Avenue Palo Alto CA 94304 USA Tel 877-486-9273 Fax 650-427-5001 www.vmware.com Copyright © 2017 VMware, Inc. All rights reserved. This product is protected by U.S. and international copyright and intellectual property laws. VMware products are covered by one or more patents listed at http://www.vmware.com/go/patents. VMware is a registered trademark or trademark of VMware, Inc. in the United States and/or other jurisdictions. All other marks and names mentioned herein may be trademarks of their respective companies. Doc feedback: https://communities.vmware.com/docs/DOC-37132