Estimation of TOA radiative fluxes from the GERB instrument ... · Estimation of TOA radiative...
11
Estimation of TOA radiative fluxes from the GERB instrument data N. Clerbaux, C. Bertrand, S. Dewitte, L. Gonzalez, A. Ipe, B. Nicula Royal Meteorological Institute of Belgium, Avenue Circulaire 3, B-1180 Brussels, Belgium. ABSTRACT The first Meteosat Second Generation (MSG) satellite was launched in August 2002. This EUMETSAT satellite carries 2 new instruments on the geostationary orbit: the Spinning Enhanced Visible and InfraRed Imager, SEVIRI, and the Geostationary Earth Radiation Budget, GERB. The unique feature of GERB in comparison with previous measurement missions of the Earth’s radiation budget (e.g. ERBE, ScaRab and CERES experiments) is the high temporal sampling afforded by the geostationary orbit, albeit for a limited region of the globe. The GERB instrument provides accurate broadband measurements of the radiant energy originating in the reflection of the incoming solar energy by the Earth–atmosphere system and in the thermal emission within this system. The synergetic use of the SEVIRI data is needed to convert these directional measurements (radiances) into radiative fluxes at the top–of–atmosphere. Additionally, the SEVIRI data allows the enhancement of the spatial resolution of the GERB measurement. This paper describes the near real–time GERB processing system that has been set up at the Royal Meteorological Institute of Belgium (RMIB). This includes the unfiltering of the instrument data, the radiance–to–flux conversions and the enhancement of the instrument spatial resolution. An early validation of the instrument data by comparison with CERES data is presented. Finally, the different data formats, the way to access them and their expected accuracy are presented. Keywords: Earth radiation budget, radiative fluxes, remote sensing 1. INTRODUCTION On August 28th 2002 the first Geostationary Earth Radiation Budget instrument 1 (GERB–2) was launched on MSG-1, first of the EUMETSAT Meteosat Second Generation series of geostationary satellites. 2 With this instrument, time continuous broadband measurements of the Earth became available for the first time, thanks to the geostationary orbit. In this sense, this data will complement in a unique way those of broadband instruments on low orbit satellites like ERBE, 3 ScaRaB 4 or CERES. 5 The GERB data is processed in near real time in the GERB ground segment at the Rutherford Appleton Laboratory (RAL) and at the Royal Meteorological Institute of Belgium (RMIB). RAL is responsible for the generation of Level–1.5 data which mainly consists in the calibration and the geolocation of the raw instrument data, while RMIB is responsible for the determination of unfiltered radiances and fluxes at the Top Of the Atmosphere (TOA) which are the Level–2.0 data. This paper gives a general overview of the GERB data processing with emphasis on the RMIB part of the processing. Section 2 presents the main characteristics of the GERB instrument and the calibration and geolocation of the data. As most of the GERB data processing relies on narrow band data from the Spinning Enhanced Visible and InfraRed Imager, 2 this new meteorological imager shortly presented in Sect. 3. The sections 4 to 7 present the estimation of the synthetic long wave radiance, the unfiltering process, the radiance– to–flux conversion and the enhancement of the instrument spatial resolution, respectively. Then, the Level–2 product formats are presented (Sect. 8), with their associated estimated error (Sect. 9). First comparison with CERES-Terra instrument data are presented in Sect. 10. Send correspondence to Nicolas Clerbaux: E-mail: [email protected], Telephone: +32 2 373 0610
Transcript of Estimation of TOA radiative fluxes from the GERB instrument ... · Estimation of TOA radiative...
Estimation of TOA radiative fluxes from the GERBinstrument data
N. Clerbaux, C. Bertrand, S. Dewitte, L. Gonzalez, A. Ipe, B. Nicula
Royal Meteorological Institute of Belgium, Avenue Circulaire 3, B-1180 Brussels, Belgium.
ABSTRACT
The first Meteosat Second Generation (MSG) satellite was launched in August 2002. This EUMETSAT satellitecarries 2 new instruments on the geostationary orbit: the Spinning Enhanced Visible and InfraRed Imager,SEVIRI, and the Geostationary Earth Radiation Budget, GERB. The unique feature of GERB in comparison withprevious measurement missions of the Earth’s radiation budget (e.g. ERBE, ScaRab and CERES experiments)is the high temporal sampling afforded by the geostationary orbit, albeit for a limited region of the globe. TheGERB instrument provides accurate broadband measurements of the radiant energy originating in the reflectionof the incoming solar energy by the Earth–atmosphere system and in the thermal emission within this system.The synergetic use of the SEVIRI data is needed to convert these directional measurements (radiances) intoradiative fluxes at the top–of–atmosphere. Additionally, the SEVIRI data allows the enhancement of the spatialresolution of the GERB measurement. This paper describes the near real–time GERB processing system thathas been set up at the Royal Meteorological Institute of Belgium (RMIB). This includes the unfiltering of theinstrument data, the radiance–to–flux conversions and the enhancement of the instrument spatial resolution. Anearly validation of the instrument data by comparison with CERES data is presented. Finally, the different dataformats, the way to access them and their expected accuracy are presented.
Keywords: Earth radiation budget, radiative fluxes, remote sensing
1. INTRODUCTION
On August 28th 2002 the first Geostationary Earth Radiation Budget instrument1 (GERB–2) was launched onMSG-1, first of the EUMETSAT Meteosat Second Generation series of geostationary satellites.2 With thisinstrument, time continuous broadband measurements of the Earth became available for the first time, thanks tothe geostationary orbit. In this sense, this data will complement in a unique way those of broadband instrumentson low orbit satellites like ERBE,3 ScaRaB4 or CERES.5
The GERB data is processed in near real time in the GERB ground segment at the Rutherford AppletonLaboratory (RAL) and at the Royal Meteorological Institute of Belgium (RMIB). RAL is responsible for thegeneration of Level–1.5 data which mainly consists in the calibration and the geolocation of the raw instrumentdata, while RMIB is responsible for the determination of unfiltered radiances and fluxes at the Top Of theAtmosphere (TOA) which are the Level–2.0 data.
This paper gives a general overview of the GERB data processing with emphasis on the RMIB part ofthe processing. Section 2 presents the main characteristics of the GERB instrument and the calibration andgeolocation of the data. As most of the GERB data processing relies on narrow band data from the SpinningEnhanced Visible and InfraRed Imager,2 this new meteorological imager shortly presented in Sect. 3. Thesections 4 to 7 present the estimation of the synthetic long wave radiance, the unfiltering process, the radiance–to–flux conversion and the enhancement of the instrument spatial resolution, respectively. Then, the Level–2product formats are presented (Sect. 8), with their associated estimated error (Sect. 9). First comparison withCERES-Terra instrument data are presented in Sect. 10.
Send correspondence to Nicolas Clerbaux: E-mail: [email protected], Telephone: +32 2 373 0610

-0.2
0
0.2
0.4
0.6
0.8
1
0.1 1 10 100
Res
pons
e Fu
nctio
n
Wavelength [µm]
GERB-2 Averaged Spectral response Functions
SWTOTLW
Figure 1. GERB instrument drawing (left) and Ad-interim averaged spectral response functions for the GERB-2instrument (right).
2. GERB INSTRUMENTS
The GERB instrument (Fig. (1)) is a small (45x20x15cm) and accurate broadband radiometer designed for theMSG satellite. As the instrument is located at the edge of this spin–stabilized satellite (100 rpm), it is subjectedto strong acceleration (18g) which complicated its mechanical design. In the instrument, the De–Scan Mirror(DSM) has its rotation axis aligned with that of the satellite and rotates in the opposite direction at half theangular velocity of the satellite. This mirror reflects the radiation towards a linear array of 256 detectors thatobserve a stationary image of Earth for a sustained period of time (about 40ms). At each rotation of the satellite(i.e. each 0.6s) the detectors measure along one North–South swath of the Earth which can be programmed tomove in the East–West direction. Using this functionality, a full disk image of the Earth at a spatial resolutionof approximately 50 km2 is acquired after 282 satellite rotations (or about 2.5 minutes).
The GERB instrument measures broadband radiances with an accuracy better than 1%. The instrumentperforms successive scans of the Earth disk for total radiation (from about 0.32 to more than 100µm) and, usinga quartz filter, for short wave radiation (about λ < 4µm). The long wave radiation can then be obtained bysubtracting the short wave from the total one. The averaged spectral response functions (or spectral sensitivity)for the total, short wave and long wave channels of the GERB–2 instrument are given in Fig. (1). Of course,each detector has its own spectral sensitivity but the differences are very small.
The calibration is known to be of prime importance for Earth radiation studies. Pre–flight ground calibrationsof the GERB–1,–2 and –3 instruments have been carried out at Imperial College (London). Those calibrationstry to characterize: the instrument’s gains in the two channels, the detectors’ Point Spread Functions (PSFs),the on–board calibration devices (black body and solar integrating sphere), and the spectral response of theinstrument with and without the quartz filter. Concerning the latter, the ground characterization of the spectralresponse functions for GERB–2 is currently ad–interim because there are plans to reprocess this data in thefuture.
In addition to pre–flight characterization, on–board monitoring of the calibration over the lifetime in orbit ismade possible by a black body source and a solar diffuser. A deep space look is used for zero reference. Mea-surements of the on–board blackbody are made during every rotation of the satellite, i.e. for each measurement,to ensure that the accuracy requirements are met. The solar diffuser is deployed on a regular basis to determinechanges in the short wave measurements due to drift or degradation of the optics.
The geolocation of the GERB data is computed at the RAL based on the position of the instrument De–ScanMirror provided by an angular positioning sensor and on information about the satellite position and attitudeprovided by EUMETSAT. The accuracy of the geolocation can be checked, monitored and possibly improved bymatching the large GERB footprint in the finer SEVIRI instrument images.
3. SEVIRI SYNERGY
The SEVIRI instrument2 generates multi–spectral imagery of the Earth surface and cloud systems every 15minutes with a spatial resolution of 3km at the sub–satellite point (1km for the High Resolution Visible channel).Compared with previous Meteosat satellites, the main improvement is relies on the number of spectral channelswhich is twelve compared to three for Meteosat. The instrument measures in narrow–band solar channels at0.6µm, 0.8µm and 1.6µm, one broadband visible channel (from 0.5µm to 0.9µm) and eight thermal channelsranging from 3.9µm to 13.4µm.
As described in the following, SEVIRI narrow band instrument data is used during most of the real timeGERB data processing as well as for monitoring and validation activities. As a meteorological satellite imager,the instrument is well–suited for the cloud cover characterization which is of prime importance to describe theradiation field anisotropy at the TOA needed for an accurate conversion of the radiances in fluxes.
The SEVIRI narrow band radiances are also used to estimate the broad band radiances through a standardnarrow band to broad band conversion. In this case, the broad band short wave or long wave quantity isestimated using polynomial regression on the imager radiances where the regression coefficients are dependenton the viewing and solar geometry. Obviously, compared with actual GERB measurements, those estimates sufferfrom the less accurate calibration of the SEVIRI channels (especially for the shortwave) and from inaccuraciesintroduced by the spectral modeling. However, they allow the generation of GERB products at the improvedspatial resolution of 10 km (Sect. 7).
4. GERB LW ESTIMATION
This first step of the processing performs the estimation of a synthetic long wave radiance by subtraction of theshortwave from the total radiance:
LLW = LTOT −A LSW (1)
The factor A is defined such that LLW is zero when a black body of 5800K (solar spectrum) is observed. As thereare small differences in the spectral responses, each detector has its own A factor. The spectral response functionfor the long wave channel in Fig. (1) is defined from the total and short wave spectral responses in an equationsimilar to Eq. (1). The estimation of the synthetic long wave using Eq. (1) involves a preliminary spatial andtemporal interpolation of the measurements. In practice, the total measurements are linearly interpolated atthe short wave time and geolocation. In the worst case, the difference in time between their acquisitions is 2.5minutes. Due to the interpolations, the estimated synthetic long wave may appear noisy in case of fast cloudmotion or in case of non–repeatability of the instrument line–of–sight (LOS). The latter case corresponds to aspatial dispersion of the actual measurement off the nominal position. Fig. (2) shows that this dispersion isabout one GERB pixel in the East–West direction. The figure illustrates the noise in the GERB synthetic longwave radiance due to the non–repeatability of the LOS: in the left part of the disk (day time) noise is introducedby the subtraction of Eq. 1, while in the right part the long wave is not affected because the SW is zero (nighttime).
In a second step, the noise affecting the long wave radiance is filtered using an estimate of this broadbandradiance by the SEVIRI narrowband radiances (narrowband–to–broadband conversion). The difference betweenthe GERB synthetic long wave radiance and the SEVIRI estimate is limited to 3%.
5. GERB RADIANCES UNFILTERING
The GERB unfiltering is designed for the averaged short wave and long wave spectral response functions forits 256 detectors. The small differences in spectral response function can be corrected before the unfiltering asdescribed in Ref. 6. Because at this time there is no significant difference in spectral response, the processingdoes not perform this correction. Nevertheless, this correction may be used for future GERB instruments if oneor several detectors display non–nominal spectral responses.
For natural scenes, there are small contributions of the emitted thermal radiation to the short wave radianceLSW and of the reflected solar radiance to the synthetic long wave radiance LLW . The former is relatively

short wave filtered radiance
0
0.01
0.02
0.03
0.04
0.05
0.06
-2 -1.5 -1 -0.5 0 0.5 1 1.5 2 2.5E/W Jitter [GERB pixel]
E-W LOS jitter histogram
total filtered radiance long wave filtered radiance
Figure 2. East-West jitter histogram for one GERB image and example of shortwave, total wave and long wave images.
small and can be modelized as a function of the long wave thermal radiance as illustrated by Fig. (3, top–left). On this figure the symbols ’+’ correspond to radiative transfer computations for 4320 conditions for theEarth–atmosphere system. A detailed description of this data base is given in7).
The estimation of the solar contamination in the long wave channel is harder as shown in Fig. (3, top–right).For solar radiation, the residual error of a simple fit:
LLW = −1.614 LSW (2)
can reach up to 1Wm−2sr−1 for scenes having a spectral signature very different of the solar spectrum (e.g.ocean). The RMS error on the data base is 0.34Wm−2sr−1. The estimation of this contamination is improvedusing spectral information from SEVIRI.
Once the contaminations are subtracted from the measurements, the unfiltered radiances are estimated fromthe filtered ones as:
LufLW = αLW LLW
LufSW = αSW LSW (3)
where LufLW is the unfiltered radiance due to the thermal emission and Luf
SW is the one due to the reflection ofsolar radiation. Bottom plots of Fig. (3) show the unfiltering factors αSW and αLW according to the filteredradiances for the data base mentioned above. Using the polynomial fits displayed in the plots, the RMS errorintroduced during the unfiltering is about 0.1% for the LW and 0.4% for the SW. This procedure is similar tothe one adopted by CERES and described in Ref. 8.
For the GERB unfiltering some spectral information can be extracted from the SEVIRI data and be usedto improve the estimation of the contaminations and the unfiltering factors. For example, when the long wavecontamination by the solar radiation is estimated using the SEVIRI solar measurements L0.6µm, L0.8µm andL1.6µm as:
LLW = −0.21− 0.104L0.6µm − 0.027L0.8µm + 0.0997L1.6µm (4)
the RMS error reduces to 0.12Wm−2sr−1, three times more accurate than the use of Eq. (2). The unfilter-ing factors are estimated as the ratio of the unfiltered and filtered broadband quantities derived by standardnarrowband–to–broadband conversions applied on SEVIRI data:
αLW =Luf
LW
LfLW
αSW =Luf
SW
LfSW
(5)
On the above data base, the RMS unfiltering error with Eq. (5) is 0.25% for the short wave and 0.025% forthe long wave. According to the approach that does not use SEVIRI data, the Eq. (5) allows to improve theunfiltering by reducing the unfiltering error of a factor 2 for the short wave and 4 for the long wave. The betterimprovement observed for the long wave radtaion is explained by the greater number of SEVIRI channels in thethermal part of the spectrum.
6. GERB ANGULAR MODELING
At this step, the fluxes are estimated from the unfiltered radiances. This requires the use of a model, R,accounting for the angular distribution of the radiance field at the TOA:
FLW =πLuf
LW
R(θv)
FSW =πLuf
SW
R(θs, θv, φ)(6)
where θs and θv are the solar and viewing zenith angles and φ is the relative azimuth angle.
For the short wave radiation, the best available models are a set of 590 models R(θs, θv, φr) derived by theCERES inversion team from 8 months of data from the CERES instrument on the Tropical Rainfall MeasuringMission (TRMM) satellite as described in Ref. 9. Each of those models is valid for a given range of surface andcloud cover conditions. A set of ADMs is only valid for a given footprint size. For CERES–TRMM the footprintsize at the subsatellite point is 10x10 km which prohibits their direct use for the GERB footprint. For thisreason, the ADMs are applied on the SEVIRI estimate of the broadband unfiltered radiances (Luf
SW and LufLW in
the Eq. 3) over boxes of 3x3 SEVIRI pixels.
The selection of the best–suited ADM for Eq. (6) needs a characterization of the footprint in terms of surfacetype, cloud fraction, cloud optical depth and thermodynamical cloud phase. For clear ocean footprints, the

0
0.5
1
1.5
2
0 20 40 60 80 100 120
SW
ther
mal
radi
ance
[Wm
-2sr
-1]
LW thermal radiance [Wm-2sr-1]
SW thermal contamintaion for VZA=0°
Best fit : 7.737691e-09 *x**4
-4.5
-4
-3.5
-3
-2.5
-2
-1.5
-1
-0.5
0
0 50 100 150 200 250 300
LW s
olar
radi
ance
[Wm
-2sr
-1]
SW solar radiance [Wm-2sr-1]
LW solar contamintaion for SZA=0°
Best fit : -1.613684e-02 *x
1.08
1.085
1.09
1.095
1.1
0 20 40 60 80 100 120
Unf
ilter
ing
fact
or fo
r the
LW
α)
LW thermal radiance [Wm-2sr-1]
Unfiltering of the LW radiance for VZA=0°
Best fit
1.3
1.32
1.34
1.36
1.38
1.4
1.42
1.44
1.46
1.48
1.5
0 50 100 150 200 250 300
Unf
ilter
ing
fact
or fo
r the
SW
α)
SW solar radiance [Wm-2sr-1]
Unfiltering of the SW radiance for SZA=0°
Best fit : 2.222408/x+1.319553
Figure 3. Top: scatter plots of short wave versus long wave radiance for emitted thermal radiation (left) and long waveversus short wave for reflected solar radiation (right). Bottom: scatter plots of unfiltering factor α for the long wavechannel (left) and for the short wave channel (right).
angular modeling can be improved using information about surface wind speed and aerosol optical thickness.9
Because this information is not yet operationaly available over the MSG disk, standard values are used in theGERB data processing. The footprint is characterized as belonging to one of the following surface classes: ocean,moderate–to–high vegetation, low–to–moderate vegetation, dark desert, bright desert or snow. For this, a globalIGBP classification10 at 1km resolution is used. The resulting 6–classes map at the 10km resolution is shown onFig. (4, a). Once available, fresh snow map derived for the MSG disk will be used. The cloud cover is estimatedby comparison of the visible band reflectance at 0.6µm and 0.8µm with the corresponding reflectance in clear–skycondition. The cloud optical thickness τ is then estimated for each imager pixels using look–up–tables (LUT):
τ = τ(ρ, ρcs, θv, θs, φ); (7)
Those LUT were computed using STREAMER radiative transfer model for the 6 CERES surface types and waterand ice clouds. The cloud identification takes advantage of the accurate estimation of the clear sky reflectanceρcs which is made possible by the geostationary orbit as described in Ref. 11. Illustration of the clear skyreflectance image is given on Fig. (4, c). In a second step, a cloud mask is built by thresholding the cloud opticaldepth. The cloud fraction is then derived for 3x3 pixel boxes (i.e. 10 km resolution). Finally, the averaged cloudoptical depth and thermodynamic phase is recomputed for the cloudy part of the boxes. As the above cloudidentification relies on the SEVIRI visible channels, it can not be used during night time. This is not a problembecause in this case there is no need for ADM selection as there is no solar reflected radiation in Eq. (6).
For the long wave, the CERES–TRMM ADMs are not used because night time cloud identification is outsidethe scope of the GERB project. We plan to use cloud identification from the EUMETSAT Now Casting SatelliteApplication Facility, once available. In the meanwhile, a modeling of the limb darkening has been implemented

based on the thermal measurements of SEVIRI, as described in Ref. 7:
R(θv) = R(θv, L3.9µm, L6.2µm, L7.3µm, L8.7µm, L9.7µm, L10.8µm, L12µm, L13.4µm) (8)
This approach is similar to the implementation12 of Schmetz and Liu for Meteosat. As the parameterization of Eq.(8) has been done using plane-parallel radiative transfer computations, the approach leads to an underestimationof the anisotropy over broken cloud fields. As the CERES–TRMM models, this model does not depend on theazimuthal angle of observation. Nevertheless, it has been proved that the azimuthal anisotropy over dry andmountainous regions may lead to a significant overestimation of the flux from the geostationary orbit13). Indeed,GERB is always observing the southern faces of the mountains in the northern hemisphere and the northernfaces in the southern hemisphere. Currently, those limitations are not compensated for.
7. ENHANCEMENT OF GERB SPATIAL RESOLUTION
Each GERB short wave and long wave radiance is compared with the estimated value from SEVIRI. For this theimager estimate, at the 10 km resolution, is convoluted with the GERB footprint using the detector PSF. Theratio between the actual measurement and the SEVIRI estimation can be used to correct the SEVIRI derivedradiances and fluxes provided it is possible to increase the spatial resolution of the ratio from the GERB 50 kmresolution to the 10 km spatial resolution.
For this, an iterative processing14 has been implemented that searches the best correction ratio at the 10 kmresolution in such a way that, after correction, the estimated products at the fine spatial resolution are consistentwith the GERB measurements.
This can be see as a kind of correction of the SEVIRI estimated radiances and fluxes for the imager narrowband channel calibration errors and, at least at large spatial scale, for the error introduced by the SEVIRI narrowband to broad band conversion.
8. PRODUCTS CUSTOMIZATION AND DISSEMINATION
The RMIB Level–2 products exist in 3 categories of space and time sampling:
• the Averaged Rectified Geolocated (ARG) products are obtained by averaging three consecutive GERBmeasurements. The products are rectified on a fixed geolocation grid having the same spatial resolutionthan the original GERB measurements (the geostationary satellite grid is used). In the ARG product, thespatial shape of one pixel is an average of the different GERB footprints that have contributed to it in therectification and time averaging process.
• the Snap-shot High-resolution Images (SHI) are snapshot at the SEVIRI acquisition time and for 3*3SEVIRI pixels. The product is the SEVIRI estimate which have been corrected by GERB through theresolution enhancement process and is directly compatible with others SEVIRI products like cloud identi-fication.
• the Binned Averaged Rectified Geolocated (BARG) are defined as averages over exact 15 minutes bins(first bin is 00:00-00:15UTC, etc). The spatial resolution of this product is about 50 km and is obtain bysimple averaging over 5x5 SHI pixels (and then 15x15 SEVIRI pixels). This product aims to simplify thecomparison with NWP outputs.
For these 3 categories of products, separate files are generated for short wave and long wave radiation, eachcontaining radiance and flux data as well as some additional information.15 The SHI product is disseminatedfor a window over Europe but is available on request over the full disk area.
The GERB data is made available to the user community through 2 different FTP servers: the RAL(http://ggspspro.ag.rl.ac.uk) provides access to the climatological archive of ARG products and the RMIB OnLine Short-term Service (ROLSS) (http://gerb.oma.be) gives access to the three categories of products in nearreal time (meaning within 4 hours).

(a) Surface type (b) Instantaneous NB reflectance image ρ
(c) Clear sky reflectance image ρcs (d) Cloud optical depth τ
(e) Cloud fraction f (f) Cloud phase
Figure 4. Main results of the GERB/SEVIRI scene identification applied on Meteosat-7 data for 12h, 17th June 2003.

9. ERROR SOURCES AND EXPECTED ACCURACY
Multiple error sources contribute to the errors on the final products. The error sources that are inherent toprocess of flux estimation from a broadband radiometer are:
• calibration of filtered radiances
• thermal/solar radiance separation
• spectral unfiltering
• radiance to flux conversion
The resulting errors on the unfiltered radiances are summarized in Tab. (1), those on the fluxes are summa-rized in Tab. (2). The viewing zenith angle of 50 degrees in Tab. (2)-which is the optimum observation angle interms of flux errors- is representative for the METEOSAT view of Europe.
thermal radiance solar radianceerror on absolute scale 0.46% 1.75%noise level (1 sigma) 0.22Wm−2sr−1 0.30Wm−2sr−1
Table 1. Summary of errors on the unfiltered radiances due to calibration of filtered radiances, thermal/solar radianceseparation and spectral unfiltering.
NADIR VIEW thermal flux solar fluxerror on absolute scale 8.3% 10.7%noise level (1 sigma) 6.2Wm−2 10Wm−2
50 ◦ VIEW thermal flux solar fluxerror on absolute scale 1.7% 6.2%noise level (1 sigma) 1.2Wm−2 5.1Wm−2
Table 2. Summary of errors on the nadir view (top) and the 50 view (bottom) fluxes due to calibration of filteredradiances, thermal/solar radiance separation, spectral unfiltering and radiance to flux conversion.
10. VALIDATION ACTIVITIES
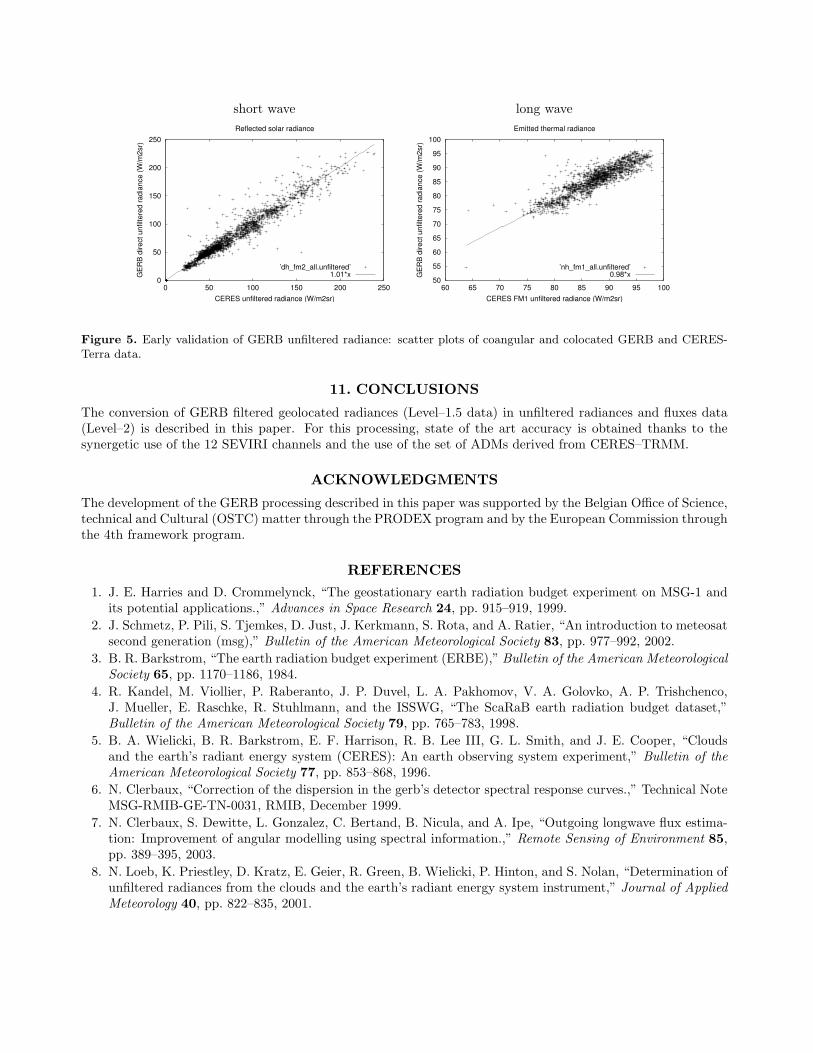
The validation of the GERB products is an on–going activity. Fig. (5) shows early comparison of GERBand CERES-Terra colocated and coangular unfiltered short wave and long wave radiances. For this kind ofcomparison, one CERES instrument is operated in a particular scanning mode that maximizes the number ofcoangular measurement. The scatter plots indicate a 1% and 2% difference for the shortwave and long wavemeasurement, respectively:
GERBSW
CERESSW= 1.011± 0.013
GERBLW
CERESLW= 0.980± 0.034 (9)
Of course, the radiance level validations will continue and will be followed by flux level data validation.
short wave long wave
0
50
100
150
200
250
0 50 100 150 200 250
GE
RB
dire
ct u
nfilt
ered
radi
ance
(W/m
2sr)
CERES unfiltered radiance (W/m2sr)
Reflected solar radiance
’dh_fm2_all.unfiltered’1.01*x
50
55
60
65
70
75
80
85
90
95
100
60 65 70 75 80 85 90 95 100
GE
RB
dire
ct u
nfilt
ered
radi
ance
(W/m
2sr)
CERES FM1 unfiltered radiance (W/m2sr)
Emitted thermal radiance
’nh_fm1_all.unfiltered’0.98*x
Figure 5. Early validation of GERB unfiltered radiance: scatter plots of coangular and colocated GERB and CERES-Terra data.
11. CONCLUSIONS
The conversion of GERB filtered geolocated radiances (Level–1.5 data) in unfiltered radiances and fluxes data(Level–2) is described in this paper. For this processing, state of the art accuracy is obtained thanks to thesynergetic use of the 12 SEVIRI channels and the use of the set of ADMs derived from CERES–TRMM.
ACKNOWLEDGMENTS
The development of the GERB processing described in this paper was supported by the Belgian Office of Science,technical and Cultural (OSTC) matter through the PRODEX program and by the European Commission throughthe 4th framework program.
REFERENCES1. J. E. Harries and D. Crommelynck, “The geostationary earth radiation budget experiment on MSG-1 and
its potential applications.,” Advances in Space Research 24, pp. 915–919, 1999.2. J. Schmetz, P. Pili, S. Tjemkes, D. Just, J. Kerkmann, S. Rota, and A. Ratier, “An introduction to meteosat
second generation (msg),” Bulletin of the American Meteorological Society 83, pp. 977–992, 2002.3. B. R. Barkstrom, “The earth radiation budget experiment (ERBE),” Bulletin of the American Meteorological
Society 65, pp. 1170–1186, 1984.4. R. Kandel, M. Viollier, P. Raberanto, J. P. Duvel, L. A. Pakhomov, V. A. Golovko, A. P. Trishchenco,
J. Mueller, E. Raschke, R. Stuhlmann, and the ISSWG, “The ScaRaB earth radiation budget dataset,”Bulletin of the American Meteorological Society 79, pp. 765–783, 1998.
5. B. A. Wielicki, B. R. Barkstrom, E. F. Harrison, R. B. Lee III, G. L. Smith, and J. E. Cooper, “Cloudsand the earth’s radiant energy system (CERES): An earth observing system experiment,” Bulletin of theAmerican Meteorological Society 77, pp. 853–868, 1996.
6. N. Clerbaux, “Correction of the dispersion in the gerb’s detector spectral response curves.,” Technical NoteMSG-RMIB-GE-TN-0031, RMIB, December 1999.
7. N. Clerbaux, S. Dewitte, L. Gonzalez, C. Bertand, B. Nicula, and A. Ipe, “Outgoing longwave flux estima-tion: Improvement of angular modelling using spectral information.,” Remote Sensing of Environment 85,pp. 389–395, 2003.
8. N. Loeb, K. Priestley, D. Kratz, E. Geier, R. Green, B. Wielicki, P. Hinton, and S. Nolan, “Determination ofunfiltered radiances from the clouds and the earth’s radiant energy system instrument,” Journal of AppliedMeteorology 40, pp. 822–835, 2001.
9. N. Loeb, N. Smith, S. Kato, W. Miller, S. Gupta, P. Minnis, and B. Wielicki, “Angular distribution modelsfor top-of-atmosphere radiative flux estimation from the clouds and the earth’s radiant energy systeminstrument on the tropical rainfall measuring mission satellite. part i: Methodology,” Journal of AppliedMeteorology 42, pp. 240–265, 2003.
10. J. Townshend, C. Justice, D. Skole, J.-P. Malingreau, J. Cihlar, P. Teillet, F. Sadowski, , and S. Ruttenberg,“The 1-km avhrr global data set: needs of the international geosphere biosphere program,” InternationalJournal for Remote Sensing 15, pp. 3319–3332, 1994.
11. A. Ipe, N. Clerbaux, C. Bertrand, D. S., and L. Gonzalez, “Pixel–scale composite toa clear–sky reflectancesfor meteosat–7 visible data,” Journal of Geophysical Research ?, p. accepted, 2003.
12. J. Schmetz and Q. Liu, “Outgoing longwave radiation and its diurnal variation at regional scales derivedfrom meteosat,” Journal of Geophysical Research 93, pp. 11192–11204, September 1988.
13. N. Clerbaux, A. Ipe, C. Bertrand, D. S., B. Nicula, and L. Gonzalez, “Evidence of azimuthal anisotropy forthe thermal infrared radiation leaving the earth’s atmosphere,” International Journal for Remote Sensing24, pp. 3005–3010, 2003.
14. L. Gonzalez, A. Hermans, S. Dewitte, A. Ipe, G. Sadowski, and N. Clerbaux, “Resolution enhancement ofGERB data,” in Proc. of the 2000 EUMETSAT Meteorological Satellite Data User’s Conference., pp. 619–625, (Bologna, Italy), May 29 – June 2 2000.
15. S. Dewitte, G. Sadowski, and L. Gonzalez, “L2 RMIB GERB products user guide,” Tech. Rep. MSG-RMIB-GE-UG, RMIB, http://gerb.oma.be, 2002.