Relationship between eustacy and stratigraphic sequence of passive margins Walter C. Pitman III.

December 7 2006 [ 314J ‐ FINAL PAPER ‐ ] Edoardo Cavalieri drsquoOro
Estimation of the Safety Margins between Design and Failure Conditions of PWR Containments
Prepared By Edoardo Cavalieri drsquoOro
Prepared For 22314
Prepared On December 7th 2006
P a g e | 1
December 7 2006 [ 314J ‐ FINAL PAPER ‐ ] Edoardo Cavalieri drsquoOro
Abstract
The design of a nuclear power plant imposes to build an external barrier nominally thecontainment made of concrete reinforced with steel bars which very often are pre‐stressed in order toaugment the overall capability to resist to tensile stresses The state of the art of these huge structures did not advance lastly but the new features of future plants (bigger than the current standard in size and power or based on innovative technologies such as the Fast Gas Reactors with higher operating pressures) are going to push the industry rethink the current standards in order to meet new requirements at least in cost terms The key variable for the containment building is the design of an adequate margin which from a structural point of view corresponds to determine the strengthen configuration of concrete and steel as a response to internal and external loads In this paper we analyze the existing and more common configurations as they were adopted by the US nuclear marketfrom to Sixties to these days and then provide some calculations of the safety margins for a classical large PWR dry containment The example provided in the calculations is executed mainly by means ofthe data provided in the Safety Analysis Report SAR of an existing plant the Indian Point Unit 3 IP3
The work is organized as follow Sections 2 and 3 of this paper give an overview of the differenttypes of containment built in the US In Section 4 the detailed model structure is provided and the scenarios analyzed together with the results of the study are described Finally a discussion of the obtained results and some future utilizations of the model are givenIn addition to the calculations performed as an illustrative exercise for the 314 class at MIT this paper also analyzes the current regulatory framework and standards of the ASME and ACI codes and emphasizes in the conclusions the excessive use of conservativism and the contradictions in theadoption of these codes
This work has been prepared in partial fulfillment of the 314J ClassMassachusetts Institute of Technology Nuclear Engineering Department December 2006
P a g e | 2
December 7 2006 [ 314J ‐ FINAL PAPER ‐ ] Edoardo Cavalieri drsquoOro
Estimation of the Safety Margins between Design and Failure Conditions of PWR Containments
By
Edoardo Cavalieri dOro
Source of the figure layout of the EPR containment from AREVA
P a g e | 3
December 7 2006 [ 314J ‐ FINAL PAPER ‐ ] Edoardo Cavalieri drsquoOro
Index
1 Introduction some Historical Notions about Containments pp 05
2 LWR Containment Types and Characteristics pp 06
3 Specific and useful Notions about Containments pp 08
31 Containment Functionalities pp 08 32 Current Regulations pp 09 33 Loads on containment pp 1034 Accident Evolution and Containment Capacity pp 1135 Safety Margins in a Probabilistic Context pp 1336 Capital Expenditures for the Containment Building pp 15
4 Calculations pp 16
41 Preliminary Calculations from the IP3 PWR pp 16
411 Plantrsquos Description and Basic Assumptions pp 16412 Calculations and Analyses pp 19
42 Comments and Final Remarks pp 25
5 Tables and Graphs pp 26
6 References pp 28
P a g e | 4
December 7 2006 [ 314J ‐ FINAL PAPER ‐ ] Edoardo Cavalieri drsquoOro
1 Introduction some Historical Notions about Containments
The containment building which constitutes the ultimate barrier for each unit has the fundamentaltask to protect the people and the environment around itin case of an accident Because of this the so callednuclear island (basically everything that is inside thecontainment) is subjected to massive amount of regulations which are often very complex to decipher and apply A containment building in its most common usageis a steel or concrete structure enclosing a nuclear reactor
Containment buildings are an intricate and expensive part of a nuclear plant and the attention to them is also lately increasing togeth
Designers of U er with security concerns
S containment are mainly GE who
containments he BWRs containments while PWRs produced thave been provided by the Combustion
Engineering Co the Backcock Wilcox Co and the Westinghouse Electric Co The Stone Webster Co also designed several containments with reduced internal aipressure versus the more common dry‐containment type
r
In the United States the design and thickness of the
Figure 1 A LWR containment building Source
containment are governed by 10 CFR 5055a
anEPRI study on Aircraft Crash Impact t Demonstrate Nuclear Power Plantrsquos Structural
o
Strengthrdquo December 2002
Some historical notes about containments the first one used to house a large power reactor (gt 1000MWe) was the Connecticut Yankee North‐east Utilities deformed‐bar reinforced‐concrete containmentfor a Whestinghouse PWR reactor with a design started in 1962 and completed in 1967 by the Stand Webster Engineering Co The design essentially used the working strength design provisions of
onehet
then‐current ACI Standard 318‐63 Building Code augmented by agreements made between the Atomic Energy Commission (AEC) and the Utility Owner of the plant as documented in the Safety Analysis Report for the plant [14]
Note finally that in the US last containments were built in 1976 and that modern containments typescan be found mainly in Japan while in the Soviet Union it was normal practice not to build containmentbuildings This along with the unstable nature of the RBMK reactors led to the catastrophe of theChernobyl accident In the case of these types of reactors it would be more proper to refer to the building housing the reactor as a reactor building rather than as a containment building
P a g e | 5
December 7 2006 [ 314J ‐ FINAL PAPER ‐ ] Edoardo Cavalieri drsquoOro
2 LWR Containment Types and Characteristics
Pressurized water reactor (PWR) containments typically consist of heavily steel‐reinforced concrete cylinders ranging in thickness from 1 meter to 13 meters capped by a hemispherical dome of steel‐reinforced concrete The cylinder is typically 40 meter high with a 40‐meter diameter Reinforcementbars that form a cage within the concrete are typically Grade 60 18 steel bars on 30 to 40 centimeters centers A 18 rebar is 56 centimeters in diameter ndash about the size of a manrsquos forearm Pressurizedwater reactors constitute about two‐thirds of the 104 reactors operating in the United States
Boiling water reactor (BWR) containments typically consist of a steel containment vesselsurrounded by a reinforced concrete shield that typically has a thickness of four feet or greater and is housed within the reactor building The primary containment of a BWR is typically one‐third thediameter of PWR containment
Figure 2 Different typesconfigurations of containment building as they are in the US
PWR common designs are categorized as either large‐dry sub‐atmospheric or ice‐condenser
For BWRs the containment and missile shield fit close to the reactor vessel The reactor building wall forms a secondary containment during refueling operations The containment designs are referred to by the names Mark I (oldest drywelltorus) Mark II and Mark III (newest) All three types house a large body of water used to quench steam released from the reactor system during transients
Different properties and features of these containment types are reported in detail in Table 1
P a g e | 6
[ 314J ‐ FINAL PAPER ‐ ] Edoardo Cavalieri drsquoOro December 7 2006
Table 1 Main containment features and characteristics of the US fleet divided by design type (Pressure Water reactors and Boiling Water Reactors)
Characteristics of the US Containments (109 units)
BWR Containment DesignTypes PWR Containment DesignTypes (5)
Mark I Mark II Mark III Sub‐atmospheric Ice Condenser Large‐Dry
Number of Units 24 8 4 7 9 57
Pressure Suppression Yes Yes Yes No Yes No
Number of Barriers 2 2 3 3 3 3
Volume (103m3) 12 15 48 52‐70 36‐ 40 46‐100
Heat Capacity billion of BTU 17 13 13 ‐ ‐ ‐
Design Pressure MPa 0528 048 020 041 030 042‐052
LOCA Pressure MPa 04 04 016 ‐ ‐ 034
Reactor thermal power (MWth) 1593 ‐ 3293 3293 ‐ 3323 2894 ‐ 3833 2441 ‐3411 3411 1500 ‐ 3800
Containment free volume (ft3) drywell wetwell
200000 ‐ 320000 110000‐ 180000 90000 ‐ 140000
200000‐310000 140000 ‐ 190000 340000 ‐ 500000
1440000‐ 1800000 250000 ‐ 280000
1165000‐ 1550000 1800000 1200000 2600000
Containment free volume (103m3) 1586 2563 4943 5493 3662 7934
Cont volume to thermal power ratio (m3MWth) 753‐364 451‐456 1252‐1659 2052‐2130 1114 2632‐3067
Containment strength Containment design pressure (MPa) Median containment failure press (MPa) in IPE
049‐053 078 ‐ 141
041‐048 107‐ 142
02 049‐075
041‐052 093‐100
018‐031 035‐076
038‐052 072‐141
Containment construction 22 steel
2 concrete 1 steel
7 concrete 2 steel
2 concrete 7 concrete
‐7 steel
2 concrete 7 steel
50 concrete
Vapor pressure suppression system Vent header with
vertical bents DWWW vacuum breakers
Vertical vents DWWW vacuum
breakers
Horizontal vents and SPMU(1) DWWW vacuum breakers(2)
No Ice condenser and recirculation fans
No
Containment heat removal system (3) RHR(1) system in SPC(1)
or DWS(1) mode RHR system in SPC or DWS mode
RHR system in SPC or DWS mode(4)
Containment spray(6) and fan coolers
Containment spray(6) and fan coolers
Containment spray(6) fan coolers
Combustion gas control Inerted by N2 Inerted by N2 Igniter System Hydrogen recombiner (for
design‐basis) Hydrogen igniters
Hydrogen recombiner (for design‐basis)
Containment venting for pressure control Hardened vent pipe requested by CPI(1)
Hardened vent pipe not requested byCPI
Hardened vent pipe not requested by CPI
‐ ‐ ‐
Allowable Leak Rate (volume day) 05 05 04 01 025 01
Capability Pressure (MPa)
‐091 (7) 107 052 103 045 092
(1) RHR Residual Heat Removal SPC ‐ Suppression Pool Cooling DWS ‐ Drywell (or Containment Spray System SPMU ‐ Suppression Pool (2) River Bend does not have an SPMU systems or DWWW vacuum breakers (3) There is also a fax cooler system for CHR during normal plant operation It is not a safety system and is usually not credited in the PRA (4) River Bend does not have a containment spray system but has two safety‐related containment unit coolers (5) From NUREG‐1560 November 1996 (6) Recirculation spray taking suction from the containment sump (7) CPWGutilized the capability pressure predicted for Browns Ferry
P a g e | 7
December 7 2006 [ 314J ‐ FINAL PAPER ‐ ] Edoardo Cavalieri drsquoOro
3 Specific and Useful Notions about Containments
31 Containment Functions
The primary function of the containment building is to contain radioactivity in case of an accidentfrom public and to maintain the internal pressure without leaking in case a major accident occurs
bull Public Protection ‐ Retention of radioactivity ‐ Retention of missiles (internal missiles)
But beside those there are further implicationsfunctions of primary importance which have to deal with the protection of the plant itself and we reported as
bull Protection of Plant Systems ‐ Natural elements (flood storms hurricanes t‐ Human actions (crashes and explosions)
ornados and wind)
‐ Fires‐ Missiles and planes (external missiles)
Finally consider that at the containment are anchored many of the systems it contains so it has tosupport their weight and other permanent load such as dead loads
bull Structural Support of Systems‐ Routine‐ Seismic or other dynamic effects ‐ Internal loads during accidents
Note that from an economic point of view assess all these functions all together is impossible and that is most of the efforts about containment is to reduce costs by means of opportune optimization techniques find the right tradeoffs among all of the functionalities we reported above Also consider that as being the last barrier of the plant design conditions should be very complex to figure and takeinto account even more of the functionalities introduced (or we think about new reactor designs using
sodium as coolant or with higher pressure operating and accident conditions as the S‐CO2 FGR at MIT)
P a g e | 8
December 7 2006 [ 314J ‐ FINAL PAPER ‐ ] Edoardo Cavalieri drsquoOro
32 Current Regulations
In this Section we want to give a flavor of the exceptional and sometimes atypical amount ofobligations designers have to follow in the case of concrete containment buildings Among the manyregulations guidelines and codes the guiding one is the NUREG‐0800 ldquoStandard Review Plan for theReview of Safety Analysis Reports for Nuclear Power Plantsrdquo[3] Tregulatory guides for decades but today as a new regulatory framewor k
his constituted the referenceis expected to review and add
new features and constrictions to the containment design because of the list of factors reported below
1 US nuclear power plants have an average age of 40 years and some initially undersigned agemechanisms are showing up all around the US nuclear fleet typically for our purposes here aging ofconcrete
2 As a consequence of that many plants faced and are facing re‐licensing which exposes them tomore restrictive inspect
3 New designs asionsFast Gas Reactors are expected to render the environment within the
containment more aggressive and hostile (higgher values of the main thermodynamic variables such as
the pressure at which they operate or higher radients of temperature are classical examples) or othersas IRIS pose new challenging specifications and functions to the traditional containment design
Thus in the last years the Nuclear regulation Commissionrsquos (NRC) staff was currently evaluatingcertain regulatory guides for adequacy for use in new reactor licensing and a preview of the new outcoming rules regarding containment buildings (specifically SRP sections 381 382 and 383) willprescribe new mandatory prescriptions on concrete and steel containments In addition to this the NRCRegulatory Guides ‐ Power Reactors (Division 1) also explicitly addresses In‐service Inspection ofUngrouted Tendons in Prestressed Concrete Containments (Regulatory Guide RG 135 and 1351)Containment Isolation Provisions for Fluid Systems (RG 1141) and Performance‐Based ContainmentLeak‐Test Program (RG 1163) to which descends the RG 1136 regulates Construction and Testing ofConcrete Containments Containment System Leakage Testing Requirements addresses a regulatoryposition which addresses new containment system leakage testing necessities Ultimately the ReactorLicense Renewal process gives further regulations for the future installations of plants in the unitedstates Reactor License Renewal Guidance Documents NUREG‐1611Aging Management of NuclearPower Plant Containments for License Renewal gives evidence of needing in terms of in‐serviceinspection requirements (as promulgated in 10 CFR 555a for license renewal)
Containment construction criteria which include design loads load combinations and acceptablebehavior applicable to concrete nuclear containments developed originally as a unique combination ofmechanical and civil structural engineering procedures They are composed of procedures consideredin design and analysis of boiler and pressure vessel components developed by the ASME Boiler andPressure Vessel Code Committee and those procedures used in design of conventional concrete buildingstructures as developed by the American Concrete Institute (ACI) 318 Code Committee This situationnaturally follows from an understanding that such containments perform a dual function (1) to be a
P a g e | 9
December 7 2006 [ 314J ‐ FINAL PAPER ‐ ] Edoardo Cavalieri drsquoOro
building structure used to house and to protect from design‐basis hazards nuclear safety‐relatedstructures mechanical and electrical components and distribution systems associated with a reactor coolant system and (2) to serve a primary function as an engineered safeguard to contain the postulatedradiological consequences of a loss‐of‐coolant accident in the nuclear steam supply system
In addition to the pure regulatory framework imposed by the NRC we also found a historical contraposition of the rules that of the ASME imposed to all boiling and vessel systems and the specifications given by the ACI in case the containment is going to be built with concrete
33 Containment Load Factored Loads
The load to which the containment should be exposed to constitutes a major source of uncertainty and it reflects the various functionalities presented in the previous section Problems here are
determining the different loads and types of loads and theircombination concurring to the ldquoworst possible scenariordquo Moreover also note that all the uncertainties coming from the PRA I and PRA II analyses involving the deepest barriers of the plant sort of cumulate in containmentanalysis and also sum up with the uncertainties naturally arising from the definition of a proper environmentalmodel of dispersion after this ultimate barrier failsFurthermore also the evolution of these loads within theaccident time constitutes a major concern especially regarding new under design technologies such as the S‐CO2FGR here at MIT where the design of the containment willbe crucial because of the different amount of heat (due tothe different fuel and coolant) and of the different heat
Another inmechanismstransport teresting aspect we have to consider is that the
distributions of loads could be both of dynamic and staticnature but in the particular example we are going toconsider the Indian Point 3 plant are not computed tokeep calculation easier
Figure 3 Load combinations for IP3 [10]
In order to incorporate the earthquake ground acceleration load which has a dynamic nature we should use the model proposed by Wen [13] to combine them as shown in figure 3 (Table 3 offer an idea of the final output that is usually provided by these models) Because of all the possible sources of uncertainties already mentioned ASME and ACI codes reduce them by factorizing loads into differentwell specified load factors and also as in Section III of the BampPV ASME Code factorize loads and takeinto account the standard deviation and mean values of the concrete properties It is thus obvious that a probabilistic framework would fit fine in this context and later section will go further explaining it
P a g e | 10
December 7 2006 [ 314J ‐ FINAL PAPER ‐ ] Edoardo Cavalieri drsquoOro
34 Containment Capacity and Accident Evolution
The capacity of a given structure is subjected both to vary over time and to uncertainties around itsvalue at a defined instant time To address uncertainties o structural strength of the containment we here provide a list of related meaningful considerations
1) The retaining of the CG (presence of leaks ruptures) and the size of the leak or penetration (whichdetermines a depressurization rate and also a possible release of contaminated material)
2) The chemical reactions between steel and oxygen concrete and CO2 or other minor reactions capable to affect in the few hours of the accident the strength of the concrete walls or liner
3) Temperature on the wall of the CG (ASME code provides different margins depending on T)4) The stratification of the gas mixture or other mechanisms that can reduce locally the strength of the
concrete or of the liner surface
In the model we are using in these paper as shown in next section a normal distribution will take 1into account of possible uncertainties in its mean value The capacity provided in figure 4 as the upper
curve is always thought as a constant line but actually over the reactorrsquos lifetime it would not be appropriate to consider it as a constant In reality by recalling the factors listed above a concurrent series of mechanisms are going to modifyaffect its initial design value and consequently its value over time
1 Corrosions or any other Aging Mechanisms 2 Chemical reactions with CO2 (carbonation of the concrete)3 Fragility curve of the steel (ASME code for the temperat4 Penetration due to impact with internal or external missiles
ure effects)
5 Water release within the containment
The discussion provide her is actually given for completeness but actually none of these mechanisms will be analyzed in the present analysis But the hope is that as emphasized in theprevious section the reader will be aware that new regulations (by new we mean the last 15 years or so) are trying to consistently address material degradation mechanisms and that a complete analysisas recent papers in the field are showing will include the effects of uncertainties as time change
Now we need to connect the concept of load to the concept of capacity The load is the evolution of pressure (which is varying in a more stringent time that is the time of the evolution of a possibleaccident) Figure 4 provides a possible example of pressure load history during different scenarios of evolution of the accident and leading to different reliability end states The capacity (expected failurepressure) is the demarcation zone for scenarios ending in a failure state Note that from this figure could be better explained trough the set of observations that follow
1 The Capacity is given primarily by the external pre‐stressed concrete barrierrsquos strength so in this case itrsquos deducible from the mechanical properties
of a single component and this because the internal steel liner plays a marginal role in supporting the structure
P a g e | 11
December 7 2006 [ 314J ‐ FINAL PAPER ‐ ] Edoardo Cavalieri drsquoOro
The black line shown in figure 4 represents the pressure evolution during an accident The accidentcan follow different paths or scenarios Until the peak the accident can be thought as the DBA orclassical LOCA where the energy and amount of inventory reversed from primary trough containmentare essentially determining it The peak pressure is used to determine the design basis accidentpressure by increasing it of a factor that usually ranges from 10 to 252 The bifurcation point is in thisillustrator example the last point in which to achieve or not the desired mitigation trough ie the ECCSsystem If we donrsquot have the expected mitigation the pressure evolves following the path of a severescenario with meltdown where the pressure is going to pass the boundaries imposed by the designpressure and then ultimately ends in a failure state of the containment this is the region we are goingto refer The region between the red and the brown line constitute the safety margins in terms ofpressure for the reactor building Passing
g the red line means going below the required margins for
safety and passing the brown one means oing through a failure mode of the containment This secondupper boundary is also known as capability of the system and we are going to refer to it later on in thiswork when the phase of conceptualization of a calculation will require that Finally note that the graphpresented below refers to pressure and not to stresses A proper safety margin representation will be ina stress‐time space and would take into account not just pressure but as we anticipated in the previousSection also other factors piling up with it such as temperature dynamic loads
Figure 4 Pressure histories in the containment after a large LOCA leading to reactor meltdown
2 Containment design pressures typically have been defined as 10-25 above maximum pressure Initial design of containment typically used a 40 margin for containment barriers and 20 for interior structures that did not serve a barrier function These margins were reduced to half these values when all the geometry of the interior compartments are known as part of the final design An even lower margin can be used if rigorous modeling and dynamic load effects are considered
P a g e | 12
December 7 2006 [ 314J ‐ FINAL PAPER ‐ ] Edoardo Cavalieri drsquoOro
35 Safety Margins in a Probabilistic Context
The safety margin nomenclature does not find an official definition in the literature Despite its wideuse in the last decades we are not able to provide a definition that is common to all the different actors that should play a consistent within the current nuclear industry and regulation Thus we are going toprovide a definition with which is connected intimately with the definition of ldquoadequate safety marginsrdquo stated by [11] with which we agree and that is in line with the scopes of the present workNote that the definition I provide below descends and applies to a single event sequence The event sequence can be a DBA design‐basis accident or a sequence from an event tree ET
In general the Safety Margin SM has been devised to deal with uncertainty But different types ofuncertainties exist and their quantification is also different and challenging too aleatory uncertainties that are uncertainties attributable to quantities that are inherently random or stochastic and the epistemic ones attributable to lack of knowledge The trivial part of uncertainties quantifications ismostly given by the second category the epistemic uncertainties the advantage in dealing with them is the fact that they can be reduced with the acquisition of new data on the other hand they are hard tomanage because they may reflect limited lack of knowledge as well as complete ignorance or by using the definition of M Gavrilas the ldquounknown‐unknownsrdquo [12]
The more general definition of safety margin was cast for structural‐mechanics analyses recognizing the fact that both load L and strength S are distributed parameters Figure 5 shows probability densities for load and capacity which shape the bases for the more general definition of safety margin
+infin +infin
( gt P ) = ⎢⎡
( f L d )⎥⎤
( ) P P ( ) L f C dCL C int int L C
minusinfin ⎣ P ⎦
Figure 5 Capacity and load distributions within the containment and SM def
The quantity safety margin SM describes the reliability of a barrier or system in light of load‐strength or load‐capacity considerations It is computed from the following equation
P a g e | 13
December 7 2006 [ 314J ‐ FINAL PAPER ‐ ] Edoardo Cavalieri drsquoOro
C - L (11)SM = σC
2 +σ2L
where C is the mean capacity or containment strength L is the mean load σc is the capacity standarddeviation and σ is the load standard deviation3 Thus the safety margin results to be an indirectL
measure of the overlap in the probability density functions and can be used to estimate the probabilitythat the load does exceed the capacity (ie the probability of failure)
+infin +infin ⎡ ⎤( gt ⎢ L ( ) L f C dP L C ) = int int ( f L d )⎥ C ( ) C (12)
minusinfin ⎣ C ⎦
4Under the strength‐stress model (see Fig 5) for failure mode i the reliability is defined as the probability that the strength C is greater than the stress L The strength and stress are in generalsense Any resistance such as a yield strength allowable force or allowable deflection can be
5considered as strength and any loading‐type quantity such as a bending stress external force ordeflection can be considered as a stress
For normally distributed C L the probability of failure (ie 1‐reliability) can be expressed as a function of safety margin (Equation 11) alone This is one reason why safety margin emerged as thesole proxy for reliability in many applications The other reason is that the design goal (in the nuclear industry especially in the related field of the pressure vessel construction as presented here) is to build components and systems that have negligible failure probabilities This can be attained by having sufficient safety margin (ie a large separation between mean capacity and load relative to theircombined standard deviations) This solidified the generalization that having adequate safety margin is asufficient condition for high reliability Thus a highly reliable system (ie one in which the probability offailure is negligible) shows no overlap between the probability densities of capacity and load On theother hand refer to figure 5 a non reliable system shows a configuration of the system that ibecause it shows a common area for the capacity of the system and the load at the accident
s defective
With the definitions provided in the last two Sections we can now define the Capacity and Load condition in the case of the specific example of the Indian Point 3 unit for which data ( in terms ofdistributions) are available Before doing that please note once again that the capacity as reported in figures 4 and 5 is drown as a brown straight line but that in reality the strength of the concrete andsteel are subjected to several degradation mechanism (as reported in the list given in the previous Section) not reported here and for which we assume to be all negligible over the lifetime of the reactor
3 The ratio in Eq 11 means that for a given distance between C an L can be reduced if L or C present big uncertainties This is a measure of the probability for the two curves to overlap in presence of flat distribution curves and its aim is different from the (C-L)C ratio that we are going to use later which is typically showing the variation of the margin with regard of the original C (mean) value Note the two formulations can be both used and they are consistent with each other
4 Note that failure mode for containment are not addressed in this paper so we refer to the general definition of a potential crack which is going to reach adefined size which in turn allow the gas to be released in the environment This definition in its generality includes the loss of almost all the functionalities of the containment as presented in Section 31
5 Or combinations of loads as it will be the case of the factored load that we have to deal with in the example provided in this paper
P a g e | 14
December 7 2006 [ 314J ‐ FINAL PAPER ‐ ] Edoardo Cavalieri drsquoOro
36 Capital Expenditures for the Containment Building
We conclude this preliminary section about the containment by providing a range of possibleestimation of a large dry atmospheric containment We will recall later on these numbers in Section 4when it will be required to evaluate a less ldquosafe marginedrdquo solution in terms of economical benefits
The containment building is usually costing between 8 to 12 of the total initial expenditure in construction and it is particularly sensible to delay in construction
Cost of containments varies widely by design (PWR vs BWR) and location of the plant A BWR typically has more concrete and rebar due to wetwell drywell configuration The location is importantbecause of the seismic zone As an example the ABWR that the Shaw Group is building in Taiwan theground force acceleration is very large and as a result the amount of concreterebar is very high There is also a variation in techniques or philosophies adopted worldwide some France plants like theldquoBrennilisrdquo are regardless of costs completely pre‐stressed including the base‐mat while an US plantlike ldquoGinnardquo is partially pre‐stressed axially and just in the cylinder
Also the labor rates will impact in addition to material costs For instance in the Northeast US labor rates are much more than in the Gulf Coast This will vary worldwide also and likely depend
3greatly on labor productivity QA Cat 1 concrete runs about $120yd these days[1] I can take that acomplete new nuclear plant holds 100000 m3 of concrete and roughly 50 goes to the containmentThe labor is hard to predict so it will be excluded from present economic evaluations
Anyway if we select todayrsquos cost and suppose a containment to be costing around 20 Million man‐hours for units (which is reasonable and deducible from past average construction times) done several years ago By discounting the obtainable value by about 25 and then applying perhaps 25 to the containment we could also be able to do a rough estimation of the labor force required too Howeverthe concrete rebar and labor dont make the whole containment Most containment in fact have liners and most have a lot of embeddedattached equipment that should bring total costs closer to 15 of the total initial capital expenditure (so something around 30 million dollar for the containment of a 2
About the liner consider that ang to be our maximum value in the calculations) billion dollar LWRrsquos plant is goi
ll US containments have one In the US is part of normal practice tobuilt it because of it provides a leak‐tight membrane whose integrity is obviously important to preserve Beside this main scope it is anchored to the concrete shell with systems ofangels or grid of studs which serve to limit large scale deflections and in turn limit strains
channels and
We conclude giving the assumptions we are going to use Imagining not to consider labor costs 3specific costs for concrete are 270 $m [1]and for the steel used for the bars a price estimate for steel
3equal to 25 $kg (consider that steel has a density of 7850 kgm )
P a g e | 15
December 7 2006 [ 314J ‐ FINAL PAPER ‐ ] Edoardo Cavalieri drsquoOro
4 Calculations and Results
41 Preliminary Calculations from the IP3 PWR
This Section constitutes the core in computational terms of the present paper and its aim is toevaluate the safety margins of a concrete‐steel reinforced containment The objective is to answer or at least provide a solid basis to answer the question if it is possible to double the pressure of a LWRrsquos containment and maintaining appropriate margins as well The evaluation of the safety margins of any building implies the knowledge of the capacity (or maximum strength or capacity = C) of the structure
and the load (or maximum stress or load = L) to which the structure is exposed to The safety marginscan be roughly determined by the difference of the two mean values of the strength and load our focus here is first to provide an estimate of the safety margins under initial proper load conditions which will be then doubled in a second moment The different load conditions are deduced by elaborating some results available from studies conducted on a selected reference plant (Indian Point unit 3) which had been chosen for both its representativeness and the availability of studies related to it [9][11]
411 Plantrsquos Description and Basic Assumptions
The initial geometry of the problem is defined by Figure 6 which sketches the containment of theIndian Point while figure 7 and 8 are showing the configuration of the bars immersed in the concretewe are going to refer to Table 4 summarizes the characteristic of the Indian Point unit 3 plant
We here report the material properties and geometry of the IP3 plant as extracted from the various pertinent sources available
Material Properties
The material properties intrinsically involve epistemic and aleatory uncertainties Hence an appropriate probabilistic model should for instance consider the material strengths as random variables while Youngrsquos modulus and Poisson ratio as deterministic ones The properties of theconcrete and reinforcements are summarized as follows as referred to the Indian Point unit 3rsquoscontainment
A Concrete the concrete has a minimum compressive strength frsquoc (or design minimum ultimatestrength) equal to 3000 psi (2068 MPa) and which we should assume is normally distributed and
statistical data of available tests provides a microσ= 4896 627 in psi (3437 432 MPa) [10] [11] Youngrsquos modulus and Poisson Ratio are equal to Ec=31 MPsi (21373 GPa) and 02 which is equal to the bar
P a g e | 16
December 7 2006 [ 314J ‐ FINAL PAPER ‐ ] Edoardo Cavalieri drsquoOro
value while bars have a Es=29 MPsi (20 GPa) The statistic used for the steel bar yielding strength are obtained by considering the predominant reinforcement as constituted by 18 bars as clearly shown byTable 2 Thus from same data fy result to be normally distributed with microσ= 718 518 in Ksi (495 357MPa) Note that the Ec value of the concrete has been varied between the 30 and 100 in order toevaluate different behaviors of the concrete with cracks
B Steel Liner the plate steel liner is carbon steel conforming with ASTM designation A442‐65 grade 60 This steel has a minimum yield strength of 32000 psi ( σymin= 220MPa) and minimum tensilestrength of 60000 psi ( σtmin= 413 MPa) with an elongation of 22 in an 8‐inch gauge length of failure
Geometry
Figure 7 shows the IP3 containment analyzed
Figure 6 Containment with spherical shell on the top of the PWR type as for the Indian Point 3 unit
Main dimensions are
R+L=H m R= 20574 m H= 667512 m L= 461772 m Ss= 10668 m Sc=13716 m
P a g e | 17
December 7 2006 [ 314J ‐ FINAL PAPER ‐ ] Edoardo Cavalieri drsquoOro
Containment Capabilit
Containment capability is given from the probabilistic safety study of Indian Point Plant in theappendix 441 [11] It is an essential element of risk evaluation for degraded core events because itdefines the realistic lower bound ultimate containment building capability for withstanding internalpressure loads This had been determined to be 0972 MPa (or 141 psia) for IP3 based on a failurecriterion defined as the state of having reached general yield in the reinforced walls At that pressurethe strains start to significantly increase and radial deflections of the containment wall may becomeunacceptably large This value is consistent with the average value for capability we provided in Table1 so it confirms that the IP3 is a good representative example of large dry containment building Thecapability was defined as the maximum combination of temperature and pressure to produce a generalyield state
Load factors
Load factors used in IP3 safety report were calculated by following the ACI 318‐63 load factors inthe design primarily provide for a safety margin on the load assumptions Specific combinations used inthe design are presented below The design included the consideration of both primary and secondarystresses The load capacity (the capacity in the old way
yto define it) was based on the ultimate strength
values presented in part IV B of ACI‐318 as reduced b a capacity factor φ = 09 for flexure and 085 fordiagonal tension bond and anchorage For the liner steel it is equal to 095 for tension while forcompression is maintained below 095 yield
The loads used to determine the required limiting capacity of any structural element on thecontainment structures are
(1) L=D+‐ 005 D +15 P + 10 (T +TL)
where D=dead load of the structure P= pressure associated to the DBA accident as shown in transientcalculations and T = load due to the maximum temperature gradient trough the concrete shell upontemperatures associated with 15 P while TL= load exerted by the liner based on 15P
Three other loads were defined by inserting also other possible contributions such asearthquakes winds and tornado We here report just the first condition which mean that thecontainment has the capacity to withstand loadings at least 50 greater than those calculated for theLOCA alone6
The loads we are going to consider are the DEAD LOAD the ACCIDENTAL PRESSURE andTEMPERATURE and the PRESTRESSING LOAD
6 All the structural components are designed to have a capacity required by the most several loads combination The loads resulting from the use of these
equations will hereafter be termed ldquoLoad Factorsrdquo
P a g e | 18
December 7 2006 [ 314J ‐ FINAL PAPER ‐ ] Edoardo Cavalieri drsquoOro
Results of the SM analysis conducted on the IP units 2 and 3
Containment can withstand a pressure of 0972 MPa which is 27 times the DBA pressure (032MPa) and this without impairing the functional capability of the containment This analysis at that timewas conducted manually at different levels of the structure and in correspondence of critical regions like membrane region of the dome and cylinder base‐mat liner or close to large penetrations The critical region was to be found in the cylinder just above the base‐mat (first elevation in Table 2) in a zone where the seismic reinforcing steel is reduced
The 27 factor found corresponds to the conservatism applied in the original design as summarized below
1 Application of load factors2 Application of capacity reduction factors3 Strength of liner not accounted for4 Minimum strength of the material accounted for 5 Seismic rebar resi6 Designer conservatism
sting LOCA loads
So all of these considerations concur to prove that the actual capability is higher than 0972 MPa Notefinally that the role of the concrete cracking on shell stiffness is also incorporated into the calculations as required
412 Calculations and Analyses
The present analysis is conducted only on the main cylindrical wall and steel liner and upper dome are not considered so any analysis of the dome over the cylinder is provided here
A welded steel liner with a minimum thickness of one‐quarter inch it is attached to the inside faceof the concrete shell The load carrying capacity of the liner is usually disregarded from calculationsbecause this is not functional to the scope of the liner which is to ensure a high degree of leak tightness
Note that the surface of the containment is imagined without penetrations personnel locks and equipment hatches
The containment wall is reinforced with hoop meridian and diagonal rebar The typical rebar arrangement we refer to for the cylindrical wall is shown in Figure 8 The hoop and meridional rebars are divided into two groups and each group is placed close to the wall surface We consider that the tendons move in the longitudinal direction the same as the concrete So the rigidity is calculated on thebasis that plane sections remain plane and that transverse Poissons ratio of the bars can be treatedthe same as the concrete The details of the rebar arrangements for the cylindrical portion of the IP3containment are shown by Table 2 [11] The sense of this table is to observe that rebar is changing atdifferent elevations (note that a proper calculation would inspect the various elevations by means of a
P a g e | 19
December 7 2006 [ 314J ‐ FINAL PAPER ‐ ] Edoardo Cavalieri drsquoOro
traditional finite element mash but also the safety report did not conducted it at that time) An average value among all the elevations has been used to perform our calculations Among the differentelevations and point in space we selected the region near the base mat We considered the cylinder tbe built‐in at the position it joins the base mat (zero radial deflection zero slope of radial deflection)
o
About pre‐stressing conditions we assume there is no bending of the shell in the unpressurizedcondition and that pre‐stressing is going to be achieved by ldquopost‐tensioningrdquo
Finally we assumed elastic behavior and we define flexural rigidity on the basis of the section ofmaterial shown in Fig 8
Figure 7 Rebar arrangement for Cylindrical Wall Figure 8 Section of the reinforcing steel array for IP3
Evaluate the impact of changing the capacity of the bars in the longitudinal tendon on the required pre‐stress level to prevent tensile in the concrete upon pressurization and verify that the obtainedvalues stay beyond the prescribed margins requires calculating the required pre‐stress level of thegeneric containment shell
First we compute some constants that will be used and then perform an analysis of the single piece of concrete based on the thin shell theory as cited in L54 notes of the 314J class Beside the different values assigned to the material and some differences in the design the calculation proposed herewhich is qualitative but provides the order of magnitude we deal with iand not deterministic Assumptions of the analysis are reported at t h
n safety analysis is probabilistic the present Section e end of
In order to compute calculation and uncertainties propagations we made use of the Crystall Ball [17] software which allows using as an input the different load distributions composing the factoredload formula and easily provides as an output the probability of failure of the structure or in other words the margins we are interested to The software in use was also useful to optimize the results as a function of costs and to perform Monte Carlo sampling of crucial parameters such as Ec
P a g e | 20
December 7 2006 [ 314J ‐ FINAL PAPER ‐ ] Edoardo Cavalieri drsquoOro
Remember the intent is to verify the margins under accident conditions so we will refer mainly toregulations directly imposing specifics and affecting the margins in question mainly NUREG‐0800 and Section CC‐3540 of ACI‐359 applies specifically to the pre‐stressed containment designs however all manner of ASME III and ACI codes apply Also Code of Federal Regulations 10CFR 5055a applies and inaccordance with ASME Section XI Subsections IWE and IWL The minimum value usually is reported tobe equal to 2 (see NUREG‐800) in our calculations conservatively we are going to assume it in thrange that goes to 2 to 3 (IP3 has a 27 [11] value of applicable margins see eq 18 in the next Section)
e
Calculation 1 Safety Margins of the IP3 plant with our Model
The safety margins of the structure as reported in figure 6 from the shell theory and thus referred to figure 7 and 8 is computed as follow
||
1 1 25
1 85
2
(13)(14)(15)
(16)(17)(18)
90
So accordi t tions the load factor ldquoLrdquo of Eq 1defined from t Pa and increased of
he γ value
o our assumphe accident sequence pressure
esis conservatively
Eqbecause here we donrsquot know a
b
ng
i
t4 or the design pressure is mainly he margin we previously described the details of the load) settled equal
he concrete with the thin shell theory Fthe structure and its
Hereto 1
( lltgn pressure in
and D are then obtained by assuming nties are overshadowed
effect on the limit state probabilities
t
25 The d 13 is obtained analyzithat the dead l
tngoad is mainly the weight of
y the large variability introduced b the other two so it has a mihus its value is going to e deterministic and equal to 150 lbsft
a ran as een treate as a Gaussian with mean
iuncerta y nor 3b
t
The accidental is indeedvalue of 47 psi = 032 MPa and s
The capacity ldquoCrdquo is in contrast decreased to taand uncertainties regarding
dom variable and h b d
pressure d dev of 502 Psi (00346 MPa) according to the data o
ke into account possible imperfectiending moment acting on the structure and here corresponds to a
t to be equal to of th
f ref [11]ons of the material
he btresidual factor=90 Note
ihat the value we choose for frsquoy is se
strength of the mater al as imposed to be for average tensile stresses for bounded reinforcing steel In addition to this we have to avoid that the concrete faces creep deformations and
impose a limit on the pre‐stress F Eq 17 as given from the ACI‐359nto the tensions within the shell of reference
50 ieldt e y
hus we t
iThus constriction imposed on the material translates
MAX(σHspreS =(1‐Xhs)XhsσHcmax microσLspreS = (1‐Xls)XlsσLcmax)lt085fc (19)
P a g e | 21
December 7 2006 [ 314J ‐ FINAL PAPER ‐ ] Edoardo Cavalieri drsquoOro
Equation 18 provides ultimately the safety margins in a deterministic formulation while the probabilistic one assuming that both Load and Capacity are normally distributed as was given in Eq11 is at the moment not considered Because the system of the equation identified revealed to be linear the formulation of Eq 12 can be used and thus the margins we found are going to be expressedin terms of their relative initial capacity (see also footnote 3 at page 13)
SM = (C‐L)C (110)
Note that as stated before we expect the absolute value (C‐L) to be equal to 2 at least (see NUREG‐800) but our calculation initially find evidence of bigger margins because we donrsquot consider abnormalload conditions (see Table 5 where SM=805) By varying the coefficient γ in equation 15 (Table 5makes use of a typical 125 factor which is used for DBA Accidents)in typical ranges are used to express abnormal load conditions (to value of 2 and 3) we can take into account of other possible load combing into the final load factor such as wind or earthquakes
So the calculation we settled takes into account all this limits and optimize the parameters we identified as crucial which are the Area of the steel bar=As the thickness of the shell=Sc=t the Young Modulus =Ec for the concrete which should be subject to cracking [16] the Pressure (by means of γ)within the containment and the Volume Vc which is actually based on the pressure itself (See figure 9)
7The software is calculating the safety margins following the criteria already defined and if the margins are not respected the area of the steel in the structure is increased or Ec increased in such a way to fitthe constraints given by the problem and optimize costs
Figure 9 Free volume and equilibrium pressure LOCA
7Note there are a set of different criteria we can establish and use to set up our limits or boundaries to the system which are related to the different performances desired from the structure (here we referred to strength and thus to measures of performance based on the yielding stress because a mere structural criteria was adopted but there are other performances we should be interested to such as serviceability stability plasticity and vibrations)
P a g e | 22
December 7 2006 [ 314J ‐ FINAL PAPER ‐ ] Edoardo Cavalieri drsquoOro
A final clarification about the way we determined costs assuming there is no change of technology or construction methods corresponding to thickness variations of the concrete and of the area of thesteel bars used to pretension costs are simply calculable by multiplying the corresponding volumes ofmaterial in use for their costs for kg
(111)
( )
Results provided by Table 5 gives an overall cost that correspond to 147 of the initialinvestment cost we hypothesized to be for a PWR of this type (1000 MWe) around 2 billion $
112
Calculation 2 Sensitivities to Material and Geometry
After the calculation of the SM we run a couple of sensitivity analysis to verify some properties ofthe material such as the Young Modulus for the concrete Ec and to verify cost variations as a function of the parameter As
As is responsible of both the strength of the shell element and also of the weight of steel costs over the concrete ones The results are reported in the tables below as a function of costs and cost variation in percentage but this time with regard of the initial value given by ldquoCalculation 1rdquo By varying As above
2its mean value of 000255 m we obtained a maximum 1‐LC equal to 1139 for an As equal to2002707 m corresponding to a overall cost increase equal to 1656 above the base case
SM var and Cost var
000
200
400
600
800
1000
1200
SM
Cost 000 473 903 1295
Fig 10 SM as it varies with cost (capital cost as var )
P a g e | 23
December 7 2006 [ 314J ‐ FINAL PAPER ‐ ] Edoardo Cavalieri drsquoOro
Third calculation we computed is a sensitivity analysis on the parameter Ec or Elastic modulus of the concrete to see how the results are varying depending on the possible initial degradation of thematerial such as small cracks or imperfections [16] Results are reported below
SM var and Es var 02‐1
000
500
1000
1500
2000
SM
Es 1 09 08 07 06 05 04
Fig 11 SM as it varies with the young Modulus of concrete (crack effect)
Final note on other calculations of interest
Also a preliminary calculation has not been included in the tables but we cite it here as an interesting one which is reformulating the same exercise in the case we use a stainless steel containment instead of a concrete pre‐stressed one Calculations are pretty straightforward here and from the basic thin shell theory predict a 40 increase of the thickness Formulas which are reportedin the tables have been used as a reference to validate and compare the results of the calculations performed for the concrete case Evidently the steel containment is more expensive and not able toaccount all the functionalities of the concrete one But if we were going to consider it we should clearlytake into account the strength variation of the material at different temperatures (things about the restrictions given from ASME codes to the 16Cr‐12Ni‐2Mo Plate SA‐240 type 316 of which IP3rsquos liner is made of) thus forcing to take into incorporate temperature loads into the margins on the capacity side (which could be a good example of one of the mechanism we referred into Section 34 where the upper boundary of the system is varying with time in other words C=C(t) )
P a g e | 24
December 7 2006 [ 314J ‐ FINAL PAPER ‐ ] Edoardo Cavalieri drsquoOro
42 Comments and Final Remarks
In this paper an overall methodology to calculate the SM for a pre‐stressed concrete containment was given By referring to a specific plant with has been particularly studied by the literature the basisto compute probabilistic calculations of the safety margins were provided The analyses tries to put emphasis a wide discussion that has been both in class and during the writing of the paper withdifferent Professor of the departments of Civil and Nuclear Engineering here at MIT regarding thecurrent methodology to address safety margins The basic conclusions I would like to concentrate on here are even if not always clearly and explicitly addressed or still to be accomplished in possible futureworks are summarized the below
The current methodology used to address safety margins can be interpreted in respect of the following sentence that appears at the end of the safety report of the Surryrsquos containment ldquoFor Surrythere were no intersections of the load distributions with the containment strength distribution and thus the DHC issue for Surry can be resolved on containments loads alonerdquo
So current containments are adequately safe and as partially but quantitatively presented in thispaper is opinion of the author that thanks to developed state of the art of probabilistic criteria thecurrent regulation that looks obsolete and redundant in many parts could be replaced with appropriate ad hoc SM evaluations
Future part of the work should consider all the basic factors composing load factors and runs thesame optimization used here along all the possible beyond DBA scenarios (we here in fact just selected one and we limited the factors in the load factor formula to 3) comprehending all the loads involved inthe factorized formula of the L
A clearer framework would help to feel the gap that the hyper conservativism intrinsic to theregulation and caused by the overlapping of different standards as ASME and ACI especially in view ofthe imminent development of future nuclear technologies with innovative (and thus costly)containments (See IRIS ESBWR and also ITER) The NISTI report entitled ldquoStructures Division Prediction of Cracking in Reinforced Concrete Structuresrdquo [16] is giving good clarifications in this sense and provides a set of different model which takes into account the different misinterpretations we cited
P a g e | 25
December 7 2006 [ 314J ‐ FINAL PAPER ‐ ] Edoardo Cavalieri drsquoOro
Table 2 Spacing at different elevations and divided by layers for the IP3 PWR Cont [11]
elevation
(m)
hoop meridional diagonal (dmnldmnlcm) primary secondary
layer bar pitch layer bar pitch layer bar pitch layer bar pitch
76 2 18 355 1 18 305 1 18 305 1 18 762
138 2 18 355 1 11 305 1 11 305 1 18 762
153 2 18 355 1 18 305 1 11 915 1 18 762
164 2 18 355 1 11 305 1 11 915 1 18 762
337 2 18 355 1 18 305 1 18 305 1 18 762
451 2 18 355 1 11 305 1 11 305 1 18 1524
Table 3 Mean duration of the combined load acting on the containment (IP3) [11] Load combo Occurrence rate Cumulative occur
[combined occurrencesyear] [ occurrences]
mean duration
[sec]
D+P D+E
D+P+E
216E‐03 864E‐02 164E‐02 656E‐01
136E‐09 546E‐08
1200 15
1481
Table 4 The Indian Point 3 Unit Features of the Containment and of the Plant [11]
LOADS
D=dead load=150 lbsft3= 2226586 kgm3
P=accidental pressure=(ms)=N(0288 0034) E=earthquake loads T=accidental temperature corresponding to P
GEOMETRY MATERIAL
R+L=H m Concrete REACTOR FEATURES
R= 20574 m Ec=21373 GPa Reactor type PWR
H= 667512 m vc=02 24 MI N of New York City NY
L= 461772 m frsquoc=frsquoc(ms)=N(3375 432) [MPa] Docket Number 05000286 Operating License Issued ‐ 04051976 Expires ‐
Ss= 10668 m frsquocmin=2068 MPa 12152015
Sc=13716 m Reinforced bars Operator Entergy Nuclear Operations Inc
Es= 200 GPa Electrical Output 979 MWe
vs=02 Reactor VendorType Westinghouse Four‐Loop fy=fy(ms)=lognormal(495 3571) Containment Type Dry Ambient Pressure
P a g e | 26
December 7 2006 [ 314J ‐ FINAL PAPER ‐ ] Edoardo Cavalieri drsquoOro
Table 5 Final Results of the IP3 Calculation for Safety Margins of a Concrete Containment GEOMETRY INPUT STRUCTURAL CALCULATIONS
t=Sc 1371 m
R 206 m
d 0057 m
de 0165 m
PL 0165 m
PH 02 m
X ‐06855 m
Xs 05205 m
L 461772 m
R+L=H 667512 m
Ss 10668 m
εLcmax 669286E‐05
Wp=Wmax 0004671207
W
εhcmax 0000226758
εbL(z)
εbLmax(z=0) 0
σLcmax 243100313
σHcmax 5277691233
σLspreS 1053239714
σHspreS 1365012879
Pa
Pa
Pa
Pa
LOADS AN CAP mean [MPa]
MATERIAL INPUT nominal
distribution γ 125
Paγ 1421888416
D 218205428
F 1365012879
T 1279699574
L=tot 4284806298
φ 09
C=φfy 4455
SM 8509685116
dmnl
MPa
MPa
MPa
MPa
MPa
dmnl
MPa
MPa
Es 2E+11 Pa
Ec 2137E+10 Pa
Pi 450000 Pa
vc=vs 02 dmnl
frsquoc=frsquoc(ms) 33750000 Pa
fy=fy(ms) 495000000 Pa
fuc Pa
OTHER QUANTITIES nominal distribution
σr ‐275000 Pa
As 00025518 m2
Xls 00225605 dmnl
D 6644E+09 Pam3
Xhs 00372248 dmnl
NL 3605000 Pam
EL 2176E+10 Pa
Eh 2143E+10 Pa
E 2627E+10 Pa
α 1875E+09 Pa
γ 51250367
β 0241911
VOLUMES mean [ m^3]
Volume (free) 6140658409
Vcil 8456642372
Vsbar 0117833069
bars 484
Vs=Vsbar bars 11406
Vc=Vcil‐Vs 8342579961
m^3
m^3
m^3
dmnl
m^3
m^3
COSTS mean value
Unit Cost concrete 2685646061
Unit Cost steel 25
ρs (steel density) 7850
Unit Costs 0000318471
Tot Costc=VcUcc 2240521701
Tot Costs=VsUcs 2851560264
Tot Cost= Cs+Cc)tot 2873965481
$m^3
$kg
kgm^3
$m^3
Million $
Million $
Million $
OPTIMIZATION ON COSTS
max F max P max L‐S given fc fy
Total invest costs 2 Billion $
Cost fraction 1437
P a g e | 27
December 7 2006 [ 314J ‐ FINAL PAPER ‐ ] Edoardo Cavalieri drsquoOro
6 References
[1] ABWR CostScheduleCOL Project at TVAs Bellefonte Site August 2005 Tennessee Valley Authority New
Nuclear Power Plant Licensing Demonstration Project DE‐AI07‐04ID14620 Prepared by Toshiba
Corporation GE Company USEC Bechtel Power Corporation Global Nuclear Fuel ndashUS August 2005 [2] Ellingwood Bruce et al RrdquoNuclear Power Plant Containment Pressure Boundary Aging Research (D8‐
A1‐US) ORNLCP‐l02338rdquo Department of Civil Engineering at the Johns Hopkins University Baltimore MD 21218‐2682 (USA) May 1999
[3] NUREG‐0800 (Formerly NUREG‐75087) US Nuclear Regulatory Commission ‐Standard Review Plan‐ Office of Nuclear Reactor Regulation Section 381 Concrete Containment draft review 2 April 1996
[4] NUREG‐0800 US Nuclear Regulatory Commission ‐Standard Review Plan‐ Office Of Nuclear Reactor
Regulation Section 382 Steel Containment draft review 2 April 1996[5] NUREG‐0800 US Nuclear Regulatory Commission ‐Standard Review Plan‐ Office of Nuclear Reactor
Regulation Section 383 Concrete and Steel Internal Structures of Steel or Concrete Containments draftreview 2 April 1996
[6] NRC Information Notice 2004‐09 Corrosion of Steel Containment and Containment Liner Office ofNuclear Reactor Regulation Washington DC 20555‐000‐ April 27 2004
[7] NUREG‐1150 Volume 1 Reactor Risk Reference Document MIT Nuclear Eng Dept Internal Copy 1996[8] DC Williams JJ Gregory SR Tieszen JL TillisrdquoContainment Loads Scoping Calculations for Severe
Nuclear Reactor Accidentsrdquo Sandia Report SAND92‐2774 UC‐940 NPRW‐SA90‐5 Unlimited Release
Printed February 2003[9] Shinozuka MH Hwang and M Reich ldquoReliability assessment of reinforced concrete containment
structuresrdquo Nucle Eng amp Des 80 (1984) pp 247‐267[10] Kawakami H Hwang MTChang and M Reich ldquoReliability assessment of Indian point unit 3 containment
structuresrdquo BNL‐NUREGCR‐3641 January 1984[11] Power Authority of the state of New York ldquoIndian Point NPP unit 3 final safety analysis reportrdquo Docket
250286 1994[12] Mirela Gavrilas ldquoA framework for Integrating Risk and Safety Marginsrdquo RESDSARPNRCA August
2006[13] Wen YK ldquoMethods for reliability in structures under multiple time varying loadsrdquo Nucl Eng ampDes 60[14] John D Stevenson ldquoCompanion Guide Book A guide to the ASME CODE Code for Concrete Reactor
vessels and Containmentsrdquo Edited by KR Rao and published in 2006 [15] Levin Howard Alan ldquoPrestressed concrete containments for nuclear power plantsrdquo Institute Archives ndash
Non‐circulating Collection 3 MS Thesis 1976 [16] Nicholas J and Carino ldquoStructures Division Prediction of Cracking in Reinforced Concrete Structuresrdquo
NISTI report 5634 Gaithersburg MD 20899 April 1995[17] Crystall Ball a risk analysis simulation and optimization Software distributed from Decision
Engineering Ver 72 August 2006
P a g e | 28
December 7 2006 [ 314J ‐ FINAL PAPER ‐ ] Edoardo Cavalieri drsquoOro
Estimation of the Safety Margins between Design and Failure Conditions of PWR Containments
By
Edoardo Cavalieri dOro
Source of the figure layout of the EPR containment from AREVA
P a g e | 3
December 7 2006 [ 314J ‐ FINAL PAPER ‐ ] Edoardo Cavalieri drsquoOro
Index
1 Introduction some Historical Notions about Containments pp 05
2 LWR Containment Types and Characteristics pp 06
3 Specific and useful Notions about Containments pp 08
31 Containment Functionalities pp 08 32 Current Regulations pp 09 33 Loads on containment pp 1034 Accident Evolution and Containment Capacity pp 1135 Safety Margins in a Probabilistic Context pp 1336 Capital Expenditures for the Containment Building pp 15
4 Calculations pp 16
41 Preliminary Calculations from the IP3 PWR pp 16
411 Plantrsquos Description and Basic Assumptions pp 16412 Calculations and Analyses pp 19
42 Comments and Final Remarks pp 25
5 Tables and Graphs pp 26
6 References pp 28
P a g e | 4
December 7 2006 [ 314J ‐ FINAL PAPER ‐ ] Edoardo Cavalieri drsquoOro
1 Introduction some Historical Notions about Containments
The containment building which constitutes the ultimate barrier for each unit has the fundamentaltask to protect the people and the environment around itin case of an accident Because of this the so callednuclear island (basically everything that is inside thecontainment) is subjected to massive amount of regulations which are often very complex to decipher and apply A containment building in its most common usageis a steel or concrete structure enclosing a nuclear reactor
Containment buildings are an intricate and expensive part of a nuclear plant and the attention to them is also lately increasing togeth
Designers of U er with security concerns
S containment are mainly GE who
containments he BWRs containments while PWRs produced thave been provided by the Combustion
Engineering Co the Backcock Wilcox Co and the Westinghouse Electric Co The Stone Webster Co also designed several containments with reduced internal aipressure versus the more common dry‐containment type
r
In the United States the design and thickness of the
Figure 1 A LWR containment building Source
containment are governed by 10 CFR 5055a
anEPRI study on Aircraft Crash Impact t Demonstrate Nuclear Power Plantrsquos Structural
o
Strengthrdquo December 2002
Some historical notes about containments the first one used to house a large power reactor (gt 1000MWe) was the Connecticut Yankee North‐east Utilities deformed‐bar reinforced‐concrete containmentfor a Whestinghouse PWR reactor with a design started in 1962 and completed in 1967 by the Stand Webster Engineering Co The design essentially used the working strength design provisions of
onehet
then‐current ACI Standard 318‐63 Building Code augmented by agreements made between the Atomic Energy Commission (AEC) and the Utility Owner of the plant as documented in the Safety Analysis Report for the plant [14]
Note finally that in the US last containments were built in 1976 and that modern containments typescan be found mainly in Japan while in the Soviet Union it was normal practice not to build containmentbuildings This along with the unstable nature of the RBMK reactors led to the catastrophe of theChernobyl accident In the case of these types of reactors it would be more proper to refer to the building housing the reactor as a reactor building rather than as a containment building
P a g e | 5
December 7 2006 [ 314J ‐ FINAL PAPER ‐ ] Edoardo Cavalieri drsquoOro
2 LWR Containment Types and Characteristics
Pressurized water reactor (PWR) containments typically consist of heavily steel‐reinforced concrete cylinders ranging in thickness from 1 meter to 13 meters capped by a hemispherical dome of steel‐reinforced concrete The cylinder is typically 40 meter high with a 40‐meter diameter Reinforcementbars that form a cage within the concrete are typically Grade 60 18 steel bars on 30 to 40 centimeters centers A 18 rebar is 56 centimeters in diameter ndash about the size of a manrsquos forearm Pressurizedwater reactors constitute about two‐thirds of the 104 reactors operating in the United States
Boiling water reactor (BWR) containments typically consist of a steel containment vesselsurrounded by a reinforced concrete shield that typically has a thickness of four feet or greater and is housed within the reactor building The primary containment of a BWR is typically one‐third thediameter of PWR containment
Figure 2 Different typesconfigurations of containment building as they are in the US
PWR common designs are categorized as either large‐dry sub‐atmospheric or ice‐condenser
For BWRs the containment and missile shield fit close to the reactor vessel The reactor building wall forms a secondary containment during refueling operations The containment designs are referred to by the names Mark I (oldest drywelltorus) Mark II and Mark III (newest) All three types house a large body of water used to quench steam released from the reactor system during transients
Different properties and features of these containment types are reported in detail in Table 1
P a g e | 6
[ 314J ‐ FINAL PAPER ‐ ] Edoardo Cavalieri drsquoOro December 7 2006
Table 1 Main containment features and characteristics of the US fleet divided by design type (Pressure Water reactors and Boiling Water Reactors)
Characteristics of the US Containments (109 units)
BWR Containment DesignTypes PWR Containment DesignTypes (5)
Mark I Mark II Mark III Sub‐atmospheric Ice Condenser Large‐Dry
Number of Units 24 8 4 7 9 57
Pressure Suppression Yes Yes Yes No Yes No
Number of Barriers 2 2 3 3 3 3
Volume (103m3) 12 15 48 52‐70 36‐ 40 46‐100
Heat Capacity billion of BTU 17 13 13 ‐ ‐ ‐
Design Pressure MPa 0528 048 020 041 030 042‐052
LOCA Pressure MPa 04 04 016 ‐ ‐ 034
Reactor thermal power (MWth) 1593 ‐ 3293 3293 ‐ 3323 2894 ‐ 3833 2441 ‐3411 3411 1500 ‐ 3800
Containment free volume (ft3) drywell wetwell
200000 ‐ 320000 110000‐ 180000 90000 ‐ 140000
200000‐310000 140000 ‐ 190000 340000 ‐ 500000
1440000‐ 1800000 250000 ‐ 280000
1165000‐ 1550000 1800000 1200000 2600000
Containment free volume (103m3) 1586 2563 4943 5493 3662 7934
Cont volume to thermal power ratio (m3MWth) 753‐364 451‐456 1252‐1659 2052‐2130 1114 2632‐3067
Containment strength Containment design pressure (MPa) Median containment failure press (MPa) in IPE
049‐053 078 ‐ 141
041‐048 107‐ 142
02 049‐075
041‐052 093‐100
018‐031 035‐076
038‐052 072‐141
Containment construction 22 steel
2 concrete 1 steel
7 concrete 2 steel
2 concrete 7 concrete
‐7 steel
2 concrete 7 steel
50 concrete
Vapor pressure suppression system Vent header with
vertical bents DWWW vacuum breakers
Vertical vents DWWW vacuum
breakers
Horizontal vents and SPMU(1) DWWW vacuum breakers(2)
No Ice condenser and recirculation fans
No
Containment heat removal system (3) RHR(1) system in SPC(1)
or DWS(1) mode RHR system in SPC or DWS mode
RHR system in SPC or DWS mode(4)
Containment spray(6) and fan coolers
Containment spray(6) and fan coolers
Containment spray(6) fan coolers
Combustion gas control Inerted by N2 Inerted by N2 Igniter System Hydrogen recombiner (for
design‐basis) Hydrogen igniters
Hydrogen recombiner (for design‐basis)
Containment venting for pressure control Hardened vent pipe requested by CPI(1)
Hardened vent pipe not requested byCPI
Hardened vent pipe not requested by CPI
‐ ‐ ‐
Allowable Leak Rate (volume day) 05 05 04 01 025 01
Capability Pressure (MPa)
‐091 (7) 107 052 103 045 092
(1) RHR Residual Heat Removal SPC ‐ Suppression Pool Cooling DWS ‐ Drywell (or Containment Spray System SPMU ‐ Suppression Pool (2) River Bend does not have an SPMU systems or DWWW vacuum breakers (3) There is also a fax cooler system for CHR during normal plant operation It is not a safety system and is usually not credited in the PRA (4) River Bend does not have a containment spray system but has two safety‐related containment unit coolers (5) From NUREG‐1560 November 1996 (6) Recirculation spray taking suction from the containment sump (7) CPWGutilized the capability pressure predicted for Browns Ferry
P a g e | 7
December 7 2006 [ 314J ‐ FINAL PAPER ‐ ] Edoardo Cavalieri drsquoOro
3 Specific and Useful Notions about Containments
31 Containment Functions
The primary function of the containment building is to contain radioactivity in case of an accidentfrom public and to maintain the internal pressure without leaking in case a major accident occurs
bull Public Protection ‐ Retention of radioactivity ‐ Retention of missiles (internal missiles)
But beside those there are further implicationsfunctions of primary importance which have to deal with the protection of the plant itself and we reported as
bull Protection of Plant Systems ‐ Natural elements (flood storms hurricanes t‐ Human actions (crashes and explosions)
ornados and wind)
‐ Fires‐ Missiles and planes (external missiles)
Finally consider that at the containment are anchored many of the systems it contains so it has tosupport their weight and other permanent load such as dead loads
bull Structural Support of Systems‐ Routine‐ Seismic or other dynamic effects ‐ Internal loads during accidents
Note that from an economic point of view assess all these functions all together is impossible and that is most of the efforts about containment is to reduce costs by means of opportune optimization techniques find the right tradeoffs among all of the functionalities we reported above Also consider that as being the last barrier of the plant design conditions should be very complex to figure and takeinto account even more of the functionalities introduced (or we think about new reactor designs using
sodium as coolant or with higher pressure operating and accident conditions as the S‐CO2 FGR at MIT)
P a g e | 8
December 7 2006 [ 314J ‐ FINAL PAPER ‐ ] Edoardo Cavalieri drsquoOro
32 Current Regulations
In this Section we want to give a flavor of the exceptional and sometimes atypical amount ofobligations designers have to follow in the case of concrete containment buildings Among the manyregulations guidelines and codes the guiding one is the NUREG‐0800 ldquoStandard Review Plan for theReview of Safety Analysis Reports for Nuclear Power Plantsrdquo[3] Tregulatory guides for decades but today as a new regulatory framewor k
his constituted the referenceis expected to review and add
new features and constrictions to the containment design because of the list of factors reported below
1 US nuclear power plants have an average age of 40 years and some initially undersigned agemechanisms are showing up all around the US nuclear fleet typically for our purposes here aging ofconcrete
2 As a consequence of that many plants faced and are facing re‐licensing which exposes them tomore restrictive inspect
3 New designs asionsFast Gas Reactors are expected to render the environment within the
containment more aggressive and hostile (higgher values of the main thermodynamic variables such as
the pressure at which they operate or higher radients of temperature are classical examples) or othersas IRIS pose new challenging specifications and functions to the traditional containment design
Thus in the last years the Nuclear regulation Commissionrsquos (NRC) staff was currently evaluatingcertain regulatory guides for adequacy for use in new reactor licensing and a preview of the new outcoming rules regarding containment buildings (specifically SRP sections 381 382 and 383) willprescribe new mandatory prescriptions on concrete and steel containments In addition to this the NRCRegulatory Guides ‐ Power Reactors (Division 1) also explicitly addresses In‐service Inspection ofUngrouted Tendons in Prestressed Concrete Containments (Regulatory Guide RG 135 and 1351)Containment Isolation Provisions for Fluid Systems (RG 1141) and Performance‐Based ContainmentLeak‐Test Program (RG 1163) to which descends the RG 1136 regulates Construction and Testing ofConcrete Containments Containment System Leakage Testing Requirements addresses a regulatoryposition which addresses new containment system leakage testing necessities Ultimately the ReactorLicense Renewal process gives further regulations for the future installations of plants in the unitedstates Reactor License Renewal Guidance Documents NUREG‐1611Aging Management of NuclearPower Plant Containments for License Renewal gives evidence of needing in terms of in‐serviceinspection requirements (as promulgated in 10 CFR 555a for license renewal)
Containment construction criteria which include design loads load combinations and acceptablebehavior applicable to concrete nuclear containments developed originally as a unique combination ofmechanical and civil structural engineering procedures They are composed of procedures consideredin design and analysis of boiler and pressure vessel components developed by the ASME Boiler andPressure Vessel Code Committee and those procedures used in design of conventional concrete buildingstructures as developed by the American Concrete Institute (ACI) 318 Code Committee This situationnaturally follows from an understanding that such containments perform a dual function (1) to be a
P a g e | 9
December 7 2006 [ 314J ‐ FINAL PAPER ‐ ] Edoardo Cavalieri drsquoOro
building structure used to house and to protect from design‐basis hazards nuclear safety‐relatedstructures mechanical and electrical components and distribution systems associated with a reactor coolant system and (2) to serve a primary function as an engineered safeguard to contain the postulatedradiological consequences of a loss‐of‐coolant accident in the nuclear steam supply system
In addition to the pure regulatory framework imposed by the NRC we also found a historical contraposition of the rules that of the ASME imposed to all boiling and vessel systems and the specifications given by the ACI in case the containment is going to be built with concrete
33 Containment Load Factored Loads
The load to which the containment should be exposed to constitutes a major source of uncertainty and it reflects the various functionalities presented in the previous section Problems here are
determining the different loads and types of loads and theircombination concurring to the ldquoworst possible scenariordquo Moreover also note that all the uncertainties coming from the PRA I and PRA II analyses involving the deepest barriers of the plant sort of cumulate in containmentanalysis and also sum up with the uncertainties naturally arising from the definition of a proper environmentalmodel of dispersion after this ultimate barrier failsFurthermore also the evolution of these loads within theaccident time constitutes a major concern especially regarding new under design technologies such as the S‐CO2FGR here at MIT where the design of the containment willbe crucial because of the different amount of heat (due tothe different fuel and coolant) and of the different heat
Another inmechanismstransport teresting aspect we have to consider is that the
distributions of loads could be both of dynamic and staticnature but in the particular example we are going toconsider the Indian Point 3 plant are not computed tokeep calculation easier
Figure 3 Load combinations for IP3 [10]
In order to incorporate the earthquake ground acceleration load which has a dynamic nature we should use the model proposed by Wen [13] to combine them as shown in figure 3 (Table 3 offer an idea of the final output that is usually provided by these models) Because of all the possible sources of uncertainties already mentioned ASME and ACI codes reduce them by factorizing loads into differentwell specified load factors and also as in Section III of the BampPV ASME Code factorize loads and takeinto account the standard deviation and mean values of the concrete properties It is thus obvious that a probabilistic framework would fit fine in this context and later section will go further explaining it
P a g e | 10
December 7 2006 [ 314J ‐ FINAL PAPER ‐ ] Edoardo Cavalieri drsquoOro
34 Containment Capacity and Accident Evolution
The capacity of a given structure is subjected both to vary over time and to uncertainties around itsvalue at a defined instant time To address uncertainties o structural strength of the containment we here provide a list of related meaningful considerations
1) The retaining of the CG (presence of leaks ruptures) and the size of the leak or penetration (whichdetermines a depressurization rate and also a possible release of contaminated material)
2) The chemical reactions between steel and oxygen concrete and CO2 or other minor reactions capable to affect in the few hours of the accident the strength of the concrete walls or liner
3) Temperature on the wall of the CG (ASME code provides different margins depending on T)4) The stratification of the gas mixture or other mechanisms that can reduce locally the strength of the
concrete or of the liner surface
In the model we are using in these paper as shown in next section a normal distribution will take 1into account of possible uncertainties in its mean value The capacity provided in figure 4 as the upper
curve is always thought as a constant line but actually over the reactorrsquos lifetime it would not be appropriate to consider it as a constant In reality by recalling the factors listed above a concurrent series of mechanisms are going to modifyaffect its initial design value and consequently its value over time
1 Corrosions or any other Aging Mechanisms 2 Chemical reactions with CO2 (carbonation of the concrete)3 Fragility curve of the steel (ASME code for the temperat4 Penetration due to impact with internal or external missiles
ure effects)
5 Water release within the containment
The discussion provide her is actually given for completeness but actually none of these mechanisms will be analyzed in the present analysis But the hope is that as emphasized in theprevious section the reader will be aware that new regulations (by new we mean the last 15 years or so) are trying to consistently address material degradation mechanisms and that a complete analysisas recent papers in the field are showing will include the effects of uncertainties as time change
Now we need to connect the concept of load to the concept of capacity The load is the evolution of pressure (which is varying in a more stringent time that is the time of the evolution of a possibleaccident) Figure 4 provides a possible example of pressure load history during different scenarios of evolution of the accident and leading to different reliability end states The capacity (expected failurepressure) is the demarcation zone for scenarios ending in a failure state Note that from this figure could be better explained trough the set of observations that follow
1 The Capacity is given primarily by the external pre‐stressed concrete barrierrsquos strength so in this case itrsquos deducible from the mechanical properties
of a single component and this because the internal steel liner plays a marginal role in supporting the structure
P a g e | 11
December 7 2006 [ 314J ‐ FINAL PAPER ‐ ] Edoardo Cavalieri drsquoOro
The black line shown in figure 4 represents the pressure evolution during an accident The accidentcan follow different paths or scenarios Until the peak the accident can be thought as the DBA orclassical LOCA where the energy and amount of inventory reversed from primary trough containmentare essentially determining it The peak pressure is used to determine the design basis accidentpressure by increasing it of a factor that usually ranges from 10 to 252 The bifurcation point is in thisillustrator example the last point in which to achieve or not the desired mitigation trough ie the ECCSsystem If we donrsquot have the expected mitigation the pressure evolves following the path of a severescenario with meltdown where the pressure is going to pass the boundaries imposed by the designpressure and then ultimately ends in a failure state of the containment this is the region we are goingto refer The region between the red and the brown line constitute the safety margins in terms ofpressure for the reactor building Passing
g the red line means going below the required margins for
safety and passing the brown one means oing through a failure mode of the containment This secondupper boundary is also known as capability of the system and we are going to refer to it later on in thiswork when the phase of conceptualization of a calculation will require that Finally note that the graphpresented below refers to pressure and not to stresses A proper safety margin representation will be ina stress‐time space and would take into account not just pressure but as we anticipated in the previousSection also other factors piling up with it such as temperature dynamic loads
Figure 4 Pressure histories in the containment after a large LOCA leading to reactor meltdown
2 Containment design pressures typically have been defined as 10-25 above maximum pressure Initial design of containment typically used a 40 margin for containment barriers and 20 for interior structures that did not serve a barrier function These margins were reduced to half these values when all the geometry of the interior compartments are known as part of the final design An even lower margin can be used if rigorous modeling and dynamic load effects are considered
P a g e | 12
December 7 2006 [ 314J ‐ FINAL PAPER ‐ ] Edoardo Cavalieri drsquoOro
35 Safety Margins in a Probabilistic Context
The safety margin nomenclature does not find an official definition in the literature Despite its wideuse in the last decades we are not able to provide a definition that is common to all the different actors that should play a consistent within the current nuclear industry and regulation Thus we are going toprovide a definition with which is connected intimately with the definition of ldquoadequate safety marginsrdquo stated by [11] with which we agree and that is in line with the scopes of the present workNote that the definition I provide below descends and applies to a single event sequence The event sequence can be a DBA design‐basis accident or a sequence from an event tree ET
In general the Safety Margin SM has been devised to deal with uncertainty But different types ofuncertainties exist and their quantification is also different and challenging too aleatory uncertainties that are uncertainties attributable to quantities that are inherently random or stochastic and the epistemic ones attributable to lack of knowledge The trivial part of uncertainties quantifications ismostly given by the second category the epistemic uncertainties the advantage in dealing with them is the fact that they can be reduced with the acquisition of new data on the other hand they are hard tomanage because they may reflect limited lack of knowledge as well as complete ignorance or by using the definition of M Gavrilas the ldquounknown‐unknownsrdquo [12]
The more general definition of safety margin was cast for structural‐mechanics analyses recognizing the fact that both load L and strength S are distributed parameters Figure 5 shows probability densities for load and capacity which shape the bases for the more general definition of safety margin
+infin +infin
( gt P ) = ⎢⎡
( f L d )⎥⎤
( ) P P ( ) L f C dCL C int int L C
minusinfin ⎣ P ⎦
Figure 5 Capacity and load distributions within the containment and SM def
The quantity safety margin SM describes the reliability of a barrier or system in light of load‐strength or load‐capacity considerations It is computed from the following equation
P a g e | 13
December 7 2006 [ 314J ‐ FINAL PAPER ‐ ] Edoardo Cavalieri drsquoOro
C - L (11)SM = σC
2 +σ2L
where C is the mean capacity or containment strength L is the mean load σc is the capacity standarddeviation and σ is the load standard deviation3 Thus the safety margin results to be an indirectL
measure of the overlap in the probability density functions and can be used to estimate the probabilitythat the load does exceed the capacity (ie the probability of failure)
+infin +infin ⎡ ⎤( gt ⎢ L ( ) L f C dP L C ) = int int ( f L d )⎥ C ( ) C (12)
minusinfin ⎣ C ⎦
4Under the strength‐stress model (see Fig 5) for failure mode i the reliability is defined as the probability that the strength C is greater than the stress L The strength and stress are in generalsense Any resistance such as a yield strength allowable force or allowable deflection can be
5considered as strength and any loading‐type quantity such as a bending stress external force ordeflection can be considered as a stress
For normally distributed C L the probability of failure (ie 1‐reliability) can be expressed as a function of safety margin (Equation 11) alone This is one reason why safety margin emerged as thesole proxy for reliability in many applications The other reason is that the design goal (in the nuclear industry especially in the related field of the pressure vessel construction as presented here) is to build components and systems that have negligible failure probabilities This can be attained by having sufficient safety margin (ie a large separation between mean capacity and load relative to theircombined standard deviations) This solidified the generalization that having adequate safety margin is asufficient condition for high reliability Thus a highly reliable system (ie one in which the probability offailure is negligible) shows no overlap between the probability densities of capacity and load On theother hand refer to figure 5 a non reliable system shows a configuration of the system that ibecause it shows a common area for the capacity of the system and the load at the accident
s defective
With the definitions provided in the last two Sections we can now define the Capacity and Load condition in the case of the specific example of the Indian Point 3 unit for which data ( in terms ofdistributions) are available Before doing that please note once again that the capacity as reported in figures 4 and 5 is drown as a brown straight line but that in reality the strength of the concrete andsteel are subjected to several degradation mechanism (as reported in the list given in the previous Section) not reported here and for which we assume to be all negligible over the lifetime of the reactor
3 The ratio in Eq 11 means that for a given distance between C an L can be reduced if L or C present big uncertainties This is a measure of the probability for the two curves to overlap in presence of flat distribution curves and its aim is different from the (C-L)C ratio that we are going to use later which is typically showing the variation of the margin with regard of the original C (mean) value Note the two formulations can be both used and they are consistent with each other
4 Note that failure mode for containment are not addressed in this paper so we refer to the general definition of a potential crack which is going to reach adefined size which in turn allow the gas to be released in the environment This definition in its generality includes the loss of almost all the functionalities of the containment as presented in Section 31
5 Or combinations of loads as it will be the case of the factored load that we have to deal with in the example provided in this paper
P a g e | 14
December 7 2006 [ 314J ‐ FINAL PAPER ‐ ] Edoardo Cavalieri drsquoOro
36 Capital Expenditures for the Containment Building
We conclude this preliminary section about the containment by providing a range of possibleestimation of a large dry atmospheric containment We will recall later on these numbers in Section 4when it will be required to evaluate a less ldquosafe marginedrdquo solution in terms of economical benefits
The containment building is usually costing between 8 to 12 of the total initial expenditure in construction and it is particularly sensible to delay in construction
Cost of containments varies widely by design (PWR vs BWR) and location of the plant A BWR typically has more concrete and rebar due to wetwell drywell configuration The location is importantbecause of the seismic zone As an example the ABWR that the Shaw Group is building in Taiwan theground force acceleration is very large and as a result the amount of concreterebar is very high There is also a variation in techniques or philosophies adopted worldwide some France plants like theldquoBrennilisrdquo are regardless of costs completely pre‐stressed including the base‐mat while an US plantlike ldquoGinnardquo is partially pre‐stressed axially and just in the cylinder
Also the labor rates will impact in addition to material costs For instance in the Northeast US labor rates are much more than in the Gulf Coast This will vary worldwide also and likely depend
3greatly on labor productivity QA Cat 1 concrete runs about $120yd these days[1] I can take that acomplete new nuclear plant holds 100000 m3 of concrete and roughly 50 goes to the containmentThe labor is hard to predict so it will be excluded from present economic evaluations
Anyway if we select todayrsquos cost and suppose a containment to be costing around 20 Million man‐hours for units (which is reasonable and deducible from past average construction times) done several years ago By discounting the obtainable value by about 25 and then applying perhaps 25 to the containment we could also be able to do a rough estimation of the labor force required too Howeverthe concrete rebar and labor dont make the whole containment Most containment in fact have liners and most have a lot of embeddedattached equipment that should bring total costs closer to 15 of the total initial capital expenditure (so something around 30 million dollar for the containment of a 2
About the liner consider that ang to be our maximum value in the calculations) billion dollar LWRrsquos plant is goi
ll US containments have one In the US is part of normal practice tobuilt it because of it provides a leak‐tight membrane whose integrity is obviously important to preserve Beside this main scope it is anchored to the concrete shell with systems ofangels or grid of studs which serve to limit large scale deflections and in turn limit strains
channels and
We conclude giving the assumptions we are going to use Imagining not to consider labor costs 3specific costs for concrete are 270 $m [1]and for the steel used for the bars a price estimate for steel
3equal to 25 $kg (consider that steel has a density of 7850 kgm )
P a g e | 15
December 7 2006 [ 314J ‐ FINAL PAPER ‐ ] Edoardo Cavalieri drsquoOro
4 Calculations and Results
41 Preliminary Calculations from the IP3 PWR
This Section constitutes the core in computational terms of the present paper and its aim is toevaluate the safety margins of a concrete‐steel reinforced containment The objective is to answer or at least provide a solid basis to answer the question if it is possible to double the pressure of a LWRrsquos containment and maintaining appropriate margins as well The evaluation of the safety margins of any building implies the knowledge of the capacity (or maximum strength or capacity = C) of the structure
and the load (or maximum stress or load = L) to which the structure is exposed to The safety marginscan be roughly determined by the difference of the two mean values of the strength and load our focus here is first to provide an estimate of the safety margins under initial proper load conditions which will be then doubled in a second moment The different load conditions are deduced by elaborating some results available from studies conducted on a selected reference plant (Indian Point unit 3) which had been chosen for both its representativeness and the availability of studies related to it [9][11]
411 Plantrsquos Description and Basic Assumptions
The initial geometry of the problem is defined by Figure 6 which sketches the containment of theIndian Point while figure 7 and 8 are showing the configuration of the bars immersed in the concretewe are going to refer to Table 4 summarizes the characteristic of the Indian Point unit 3 plant
We here report the material properties and geometry of the IP3 plant as extracted from the various pertinent sources available
Material Properties
The material properties intrinsically involve epistemic and aleatory uncertainties Hence an appropriate probabilistic model should for instance consider the material strengths as random variables while Youngrsquos modulus and Poisson ratio as deterministic ones The properties of theconcrete and reinforcements are summarized as follows as referred to the Indian Point unit 3rsquoscontainment
A Concrete the concrete has a minimum compressive strength frsquoc (or design minimum ultimatestrength) equal to 3000 psi (2068 MPa) and which we should assume is normally distributed and
statistical data of available tests provides a microσ= 4896 627 in psi (3437 432 MPa) [10] [11] Youngrsquos modulus and Poisson Ratio are equal to Ec=31 MPsi (21373 GPa) and 02 which is equal to the bar
P a g e | 16
December 7 2006 [ 314J ‐ FINAL PAPER ‐ ] Edoardo Cavalieri drsquoOro
value while bars have a Es=29 MPsi (20 GPa) The statistic used for the steel bar yielding strength are obtained by considering the predominant reinforcement as constituted by 18 bars as clearly shown byTable 2 Thus from same data fy result to be normally distributed with microσ= 718 518 in Ksi (495 357MPa) Note that the Ec value of the concrete has been varied between the 30 and 100 in order toevaluate different behaviors of the concrete with cracks
B Steel Liner the plate steel liner is carbon steel conforming with ASTM designation A442‐65 grade 60 This steel has a minimum yield strength of 32000 psi ( σymin= 220MPa) and minimum tensilestrength of 60000 psi ( σtmin= 413 MPa) with an elongation of 22 in an 8‐inch gauge length of failure
Geometry
Figure 7 shows the IP3 containment analyzed
Figure 6 Containment with spherical shell on the top of the PWR type as for the Indian Point 3 unit
Main dimensions are
R+L=H m R= 20574 m H= 667512 m L= 461772 m Ss= 10668 m Sc=13716 m
P a g e | 17
December 7 2006 [ 314J ‐ FINAL PAPER ‐ ] Edoardo Cavalieri drsquoOro
Containment Capabilit
Containment capability is given from the probabilistic safety study of Indian Point Plant in theappendix 441 [11] It is an essential element of risk evaluation for degraded core events because itdefines the realistic lower bound ultimate containment building capability for withstanding internalpressure loads This had been determined to be 0972 MPa (or 141 psia) for IP3 based on a failurecriterion defined as the state of having reached general yield in the reinforced walls At that pressurethe strains start to significantly increase and radial deflections of the containment wall may becomeunacceptably large This value is consistent with the average value for capability we provided in Table1 so it confirms that the IP3 is a good representative example of large dry containment building Thecapability was defined as the maximum combination of temperature and pressure to produce a generalyield state
Load factors
Load factors used in IP3 safety report were calculated by following the ACI 318‐63 load factors inthe design primarily provide for a safety margin on the load assumptions Specific combinations used inthe design are presented below The design included the consideration of both primary and secondarystresses The load capacity (the capacity in the old way
yto define it) was based on the ultimate strength
values presented in part IV B of ACI‐318 as reduced b a capacity factor φ = 09 for flexure and 085 fordiagonal tension bond and anchorage For the liner steel it is equal to 095 for tension while forcompression is maintained below 095 yield
The loads used to determine the required limiting capacity of any structural element on thecontainment structures are
(1) L=D+‐ 005 D +15 P + 10 (T +TL)
where D=dead load of the structure P= pressure associated to the DBA accident as shown in transientcalculations and T = load due to the maximum temperature gradient trough the concrete shell upontemperatures associated with 15 P while TL= load exerted by the liner based on 15P
Three other loads were defined by inserting also other possible contributions such asearthquakes winds and tornado We here report just the first condition which mean that thecontainment has the capacity to withstand loadings at least 50 greater than those calculated for theLOCA alone6
The loads we are going to consider are the DEAD LOAD the ACCIDENTAL PRESSURE andTEMPERATURE and the PRESTRESSING LOAD
6 All the structural components are designed to have a capacity required by the most several loads combination The loads resulting from the use of these
equations will hereafter be termed ldquoLoad Factorsrdquo
P a g e | 18
December 7 2006 [ 314J ‐ FINAL PAPER ‐ ] Edoardo Cavalieri drsquoOro
Results of the SM analysis conducted on the IP units 2 and 3
Containment can withstand a pressure of 0972 MPa which is 27 times the DBA pressure (032MPa) and this without impairing the functional capability of the containment This analysis at that timewas conducted manually at different levels of the structure and in correspondence of critical regions like membrane region of the dome and cylinder base‐mat liner or close to large penetrations The critical region was to be found in the cylinder just above the base‐mat (first elevation in Table 2) in a zone where the seismic reinforcing steel is reduced
The 27 factor found corresponds to the conservatism applied in the original design as summarized below
1 Application of load factors2 Application of capacity reduction factors3 Strength of liner not accounted for4 Minimum strength of the material accounted for 5 Seismic rebar resi6 Designer conservatism
sting LOCA loads
So all of these considerations concur to prove that the actual capability is higher than 0972 MPa Notefinally that the role of the concrete cracking on shell stiffness is also incorporated into the calculations as required
412 Calculations and Analyses
The present analysis is conducted only on the main cylindrical wall and steel liner and upper dome are not considered so any analysis of the dome over the cylinder is provided here
A welded steel liner with a minimum thickness of one‐quarter inch it is attached to the inside faceof the concrete shell The load carrying capacity of the liner is usually disregarded from calculationsbecause this is not functional to the scope of the liner which is to ensure a high degree of leak tightness
Note that the surface of the containment is imagined without penetrations personnel locks and equipment hatches
The containment wall is reinforced with hoop meridian and diagonal rebar The typical rebar arrangement we refer to for the cylindrical wall is shown in Figure 8 The hoop and meridional rebars are divided into two groups and each group is placed close to the wall surface We consider that the tendons move in the longitudinal direction the same as the concrete So the rigidity is calculated on thebasis that plane sections remain plane and that transverse Poissons ratio of the bars can be treatedthe same as the concrete The details of the rebar arrangements for the cylindrical portion of the IP3containment are shown by Table 2 [11] The sense of this table is to observe that rebar is changing atdifferent elevations (note that a proper calculation would inspect the various elevations by means of a
P a g e | 19
December 7 2006 [ 314J ‐ FINAL PAPER ‐ ] Edoardo Cavalieri drsquoOro
traditional finite element mash but also the safety report did not conducted it at that time) An average value among all the elevations has been used to perform our calculations Among the differentelevations and point in space we selected the region near the base mat We considered the cylinder tbe built‐in at the position it joins the base mat (zero radial deflection zero slope of radial deflection)
o
About pre‐stressing conditions we assume there is no bending of the shell in the unpressurizedcondition and that pre‐stressing is going to be achieved by ldquopost‐tensioningrdquo
Finally we assumed elastic behavior and we define flexural rigidity on the basis of the section ofmaterial shown in Fig 8
Figure 7 Rebar arrangement for Cylindrical Wall Figure 8 Section of the reinforcing steel array for IP3
Evaluate the impact of changing the capacity of the bars in the longitudinal tendon on the required pre‐stress level to prevent tensile in the concrete upon pressurization and verify that the obtainedvalues stay beyond the prescribed margins requires calculating the required pre‐stress level of thegeneric containment shell
First we compute some constants that will be used and then perform an analysis of the single piece of concrete based on the thin shell theory as cited in L54 notes of the 314J class Beside the different values assigned to the material and some differences in the design the calculation proposed herewhich is qualitative but provides the order of magnitude we deal with iand not deterministic Assumptions of the analysis are reported at t h
n safety analysis is probabilistic the present Section e end of
In order to compute calculation and uncertainties propagations we made use of the Crystall Ball [17] software which allows using as an input the different load distributions composing the factoredload formula and easily provides as an output the probability of failure of the structure or in other words the margins we are interested to The software in use was also useful to optimize the results as a function of costs and to perform Monte Carlo sampling of crucial parameters such as Ec
P a g e | 20
December 7 2006 [ 314J ‐ FINAL PAPER ‐ ] Edoardo Cavalieri drsquoOro
Remember the intent is to verify the margins under accident conditions so we will refer mainly toregulations directly imposing specifics and affecting the margins in question mainly NUREG‐0800 and Section CC‐3540 of ACI‐359 applies specifically to the pre‐stressed containment designs however all manner of ASME III and ACI codes apply Also Code of Federal Regulations 10CFR 5055a applies and inaccordance with ASME Section XI Subsections IWE and IWL The minimum value usually is reported tobe equal to 2 (see NUREG‐800) in our calculations conservatively we are going to assume it in thrange that goes to 2 to 3 (IP3 has a 27 [11] value of applicable margins see eq 18 in the next Section)
e
Calculation 1 Safety Margins of the IP3 plant with our Model
The safety margins of the structure as reported in figure 6 from the shell theory and thus referred to figure 7 and 8 is computed as follow
||
1 1 25
1 85
2
(13)(14)(15)
(16)(17)(18)
90
So accordi t tions the load factor ldquoLrdquo of Eq 1defined from t Pa and increased of
he γ value
o our assumphe accident sequence pressure
esis conservatively
Eqbecause here we donrsquot know a
b
ng
i
t4 or the design pressure is mainly he margin we previously described the details of the load) settled equal
he concrete with the thin shell theory Fthe structure and its
Hereto 1
( lltgn pressure in
and D are then obtained by assuming nties are overshadowed
effect on the limit state probabilities
t
25 The d 13 is obtained analyzithat the dead l
tngoad is mainly the weight of
y the large variability introduced b the other two so it has a mihus its value is going to e deterministic and equal to 150 lbsft
a ran as een treate as a Gaussian with mean
iuncerta y nor 3b
t
The accidental is indeedvalue of 47 psi = 032 MPa and s
The capacity ldquoCrdquo is in contrast decreased to taand uncertainties regarding
dom variable and h b d
pressure d dev of 502 Psi (00346 MPa) according to the data o
ke into account possible imperfectiending moment acting on the structure and here corresponds to a
t to be equal to of th
f ref [11]ons of the material
he btresidual factor=90 Note
ihat the value we choose for frsquoy is se
strength of the mater al as imposed to be for average tensile stresses for bounded reinforcing steel In addition to this we have to avoid that the concrete faces creep deformations and
impose a limit on the pre‐stress F Eq 17 as given from the ACI‐359nto the tensions within the shell of reference
50 ieldt e y
hus we t
iThus constriction imposed on the material translates
MAX(σHspreS =(1‐Xhs)XhsσHcmax microσLspreS = (1‐Xls)XlsσLcmax)lt085fc (19)
P a g e | 21
December 7 2006 [ 314J ‐ FINAL PAPER ‐ ] Edoardo Cavalieri drsquoOro
Equation 18 provides ultimately the safety margins in a deterministic formulation while the probabilistic one assuming that both Load and Capacity are normally distributed as was given in Eq11 is at the moment not considered Because the system of the equation identified revealed to be linear the formulation of Eq 12 can be used and thus the margins we found are going to be expressedin terms of their relative initial capacity (see also footnote 3 at page 13)
SM = (C‐L)C (110)
Note that as stated before we expect the absolute value (C‐L) to be equal to 2 at least (see NUREG‐800) but our calculation initially find evidence of bigger margins because we donrsquot consider abnormalload conditions (see Table 5 where SM=805) By varying the coefficient γ in equation 15 (Table 5makes use of a typical 125 factor which is used for DBA Accidents)in typical ranges are used to express abnormal load conditions (to value of 2 and 3) we can take into account of other possible load combing into the final load factor such as wind or earthquakes
So the calculation we settled takes into account all this limits and optimize the parameters we identified as crucial which are the Area of the steel bar=As the thickness of the shell=Sc=t the Young Modulus =Ec for the concrete which should be subject to cracking [16] the Pressure (by means of γ)within the containment and the Volume Vc which is actually based on the pressure itself (See figure 9)
7The software is calculating the safety margins following the criteria already defined and if the margins are not respected the area of the steel in the structure is increased or Ec increased in such a way to fitthe constraints given by the problem and optimize costs
Figure 9 Free volume and equilibrium pressure LOCA
7Note there are a set of different criteria we can establish and use to set up our limits or boundaries to the system which are related to the different performances desired from the structure (here we referred to strength and thus to measures of performance based on the yielding stress because a mere structural criteria was adopted but there are other performances we should be interested to such as serviceability stability plasticity and vibrations)
P a g e | 22
December 7 2006 [ 314J ‐ FINAL PAPER ‐ ] Edoardo Cavalieri drsquoOro
A final clarification about the way we determined costs assuming there is no change of technology or construction methods corresponding to thickness variations of the concrete and of the area of thesteel bars used to pretension costs are simply calculable by multiplying the corresponding volumes ofmaterial in use for their costs for kg
(111)
( )
Results provided by Table 5 gives an overall cost that correspond to 147 of the initialinvestment cost we hypothesized to be for a PWR of this type (1000 MWe) around 2 billion $
112
Calculation 2 Sensitivities to Material and Geometry
After the calculation of the SM we run a couple of sensitivity analysis to verify some properties ofthe material such as the Young Modulus for the concrete Ec and to verify cost variations as a function of the parameter As
As is responsible of both the strength of the shell element and also of the weight of steel costs over the concrete ones The results are reported in the tables below as a function of costs and cost variation in percentage but this time with regard of the initial value given by ldquoCalculation 1rdquo By varying As above
2its mean value of 000255 m we obtained a maximum 1‐LC equal to 1139 for an As equal to2002707 m corresponding to a overall cost increase equal to 1656 above the base case
SM var and Cost var
000
200
400
600
800
1000
1200
SM
Cost 000 473 903 1295
Fig 10 SM as it varies with cost (capital cost as var )
P a g e | 23
December 7 2006 [ 314J ‐ FINAL PAPER ‐ ] Edoardo Cavalieri drsquoOro
Third calculation we computed is a sensitivity analysis on the parameter Ec or Elastic modulus of the concrete to see how the results are varying depending on the possible initial degradation of thematerial such as small cracks or imperfections [16] Results are reported below
SM var and Es var 02‐1
000
500
1000
1500
2000
SM
Es 1 09 08 07 06 05 04
Fig 11 SM as it varies with the young Modulus of concrete (crack effect)
Final note on other calculations of interest
Also a preliminary calculation has not been included in the tables but we cite it here as an interesting one which is reformulating the same exercise in the case we use a stainless steel containment instead of a concrete pre‐stressed one Calculations are pretty straightforward here and from the basic thin shell theory predict a 40 increase of the thickness Formulas which are reportedin the tables have been used as a reference to validate and compare the results of the calculations performed for the concrete case Evidently the steel containment is more expensive and not able toaccount all the functionalities of the concrete one But if we were going to consider it we should clearlytake into account the strength variation of the material at different temperatures (things about the restrictions given from ASME codes to the 16Cr‐12Ni‐2Mo Plate SA‐240 type 316 of which IP3rsquos liner is made of) thus forcing to take into incorporate temperature loads into the margins on the capacity side (which could be a good example of one of the mechanism we referred into Section 34 where the upper boundary of the system is varying with time in other words C=C(t) )
P a g e | 24
December 7 2006 [ 314J ‐ FINAL PAPER ‐ ] Edoardo Cavalieri drsquoOro
42 Comments and Final Remarks
In this paper an overall methodology to calculate the SM for a pre‐stressed concrete containment was given By referring to a specific plant with has been particularly studied by the literature the basisto compute probabilistic calculations of the safety margins were provided The analyses tries to put emphasis a wide discussion that has been both in class and during the writing of the paper withdifferent Professor of the departments of Civil and Nuclear Engineering here at MIT regarding thecurrent methodology to address safety margins The basic conclusions I would like to concentrate on here are even if not always clearly and explicitly addressed or still to be accomplished in possible futureworks are summarized the below
The current methodology used to address safety margins can be interpreted in respect of the following sentence that appears at the end of the safety report of the Surryrsquos containment ldquoFor Surrythere were no intersections of the load distributions with the containment strength distribution and thus the DHC issue for Surry can be resolved on containments loads alonerdquo
So current containments are adequately safe and as partially but quantitatively presented in thispaper is opinion of the author that thanks to developed state of the art of probabilistic criteria thecurrent regulation that looks obsolete and redundant in many parts could be replaced with appropriate ad hoc SM evaluations
Future part of the work should consider all the basic factors composing load factors and runs thesame optimization used here along all the possible beyond DBA scenarios (we here in fact just selected one and we limited the factors in the load factor formula to 3) comprehending all the loads involved inthe factorized formula of the L
A clearer framework would help to feel the gap that the hyper conservativism intrinsic to theregulation and caused by the overlapping of different standards as ASME and ACI especially in view ofthe imminent development of future nuclear technologies with innovative (and thus costly)containments (See IRIS ESBWR and also ITER) The NISTI report entitled ldquoStructures Division Prediction of Cracking in Reinforced Concrete Structuresrdquo [16] is giving good clarifications in this sense and provides a set of different model which takes into account the different misinterpretations we cited
P a g e | 25
December 7 2006 [ 314J ‐ FINAL PAPER ‐ ] Edoardo Cavalieri drsquoOro
Table 2 Spacing at different elevations and divided by layers for the IP3 PWR Cont [11]
elevation
(m)
hoop meridional diagonal (dmnldmnlcm) primary secondary
layer bar pitch layer bar pitch layer bar pitch layer bar pitch
76 2 18 355 1 18 305 1 18 305 1 18 762
138 2 18 355 1 11 305 1 11 305 1 18 762
153 2 18 355 1 18 305 1 11 915 1 18 762
164 2 18 355 1 11 305 1 11 915 1 18 762
337 2 18 355 1 18 305 1 18 305 1 18 762
451 2 18 355 1 11 305 1 11 305 1 18 1524
Table 3 Mean duration of the combined load acting on the containment (IP3) [11] Load combo Occurrence rate Cumulative occur
[combined occurrencesyear] [ occurrences]
mean duration
[sec]
D+P D+E
D+P+E
216E‐03 864E‐02 164E‐02 656E‐01
136E‐09 546E‐08
1200 15
1481
Table 4 The Indian Point 3 Unit Features of the Containment and of the Plant [11]
LOADS
D=dead load=150 lbsft3= 2226586 kgm3
P=accidental pressure=(ms)=N(0288 0034) E=earthquake loads T=accidental temperature corresponding to P
GEOMETRY MATERIAL
R+L=H m Concrete REACTOR FEATURES
R= 20574 m Ec=21373 GPa Reactor type PWR
H= 667512 m vc=02 24 MI N of New York City NY
L= 461772 m frsquoc=frsquoc(ms)=N(3375 432) [MPa] Docket Number 05000286 Operating License Issued ‐ 04051976 Expires ‐
Ss= 10668 m frsquocmin=2068 MPa 12152015
Sc=13716 m Reinforced bars Operator Entergy Nuclear Operations Inc
Es= 200 GPa Electrical Output 979 MWe
vs=02 Reactor VendorType Westinghouse Four‐Loop fy=fy(ms)=lognormal(495 3571) Containment Type Dry Ambient Pressure
P a g e | 26
December 7 2006 [ 314J ‐ FINAL PAPER ‐ ] Edoardo Cavalieri drsquoOro
Table 5 Final Results of the IP3 Calculation for Safety Margins of a Concrete Containment GEOMETRY INPUT STRUCTURAL CALCULATIONS
t=Sc 1371 m
R 206 m
d 0057 m
de 0165 m
PL 0165 m
PH 02 m
X ‐06855 m
Xs 05205 m
L 461772 m
R+L=H 667512 m
Ss 10668 m
εLcmax 669286E‐05
Wp=Wmax 0004671207
W
εhcmax 0000226758
εbL(z)
εbLmax(z=0) 0
σLcmax 243100313
σHcmax 5277691233
σLspreS 1053239714
σHspreS 1365012879
Pa
Pa
Pa
Pa
LOADS AN CAP mean [MPa]
MATERIAL INPUT nominal
distribution γ 125
Paγ 1421888416
D 218205428
F 1365012879
T 1279699574
L=tot 4284806298
φ 09
C=φfy 4455
SM 8509685116
dmnl
MPa
MPa
MPa
MPa
MPa
dmnl
MPa
MPa
Es 2E+11 Pa
Ec 2137E+10 Pa
Pi 450000 Pa
vc=vs 02 dmnl
frsquoc=frsquoc(ms) 33750000 Pa
fy=fy(ms) 495000000 Pa
fuc Pa
OTHER QUANTITIES nominal distribution
σr ‐275000 Pa
As 00025518 m2
Xls 00225605 dmnl
D 6644E+09 Pam3
Xhs 00372248 dmnl
NL 3605000 Pam
EL 2176E+10 Pa
Eh 2143E+10 Pa
E 2627E+10 Pa
α 1875E+09 Pa
γ 51250367
β 0241911
VOLUMES mean [ m^3]
Volume (free) 6140658409
Vcil 8456642372
Vsbar 0117833069
bars 484
Vs=Vsbar bars 11406
Vc=Vcil‐Vs 8342579961
m^3
m^3
m^3
dmnl
m^3
m^3
COSTS mean value
Unit Cost concrete 2685646061
Unit Cost steel 25
ρs (steel density) 7850
Unit Costs 0000318471
Tot Costc=VcUcc 2240521701
Tot Costs=VsUcs 2851560264
Tot Cost= Cs+Cc)tot 2873965481
$m^3
$kg
kgm^3
$m^3
Million $
Million $
Million $
OPTIMIZATION ON COSTS
max F max P max L‐S given fc fy
Total invest costs 2 Billion $
Cost fraction 1437
P a g e | 27
December 7 2006 [ 314J ‐ FINAL PAPER ‐ ] Edoardo Cavalieri drsquoOro
6 References
[1] ABWR CostScheduleCOL Project at TVAs Bellefonte Site August 2005 Tennessee Valley Authority New
Nuclear Power Plant Licensing Demonstration Project DE‐AI07‐04ID14620 Prepared by Toshiba
Corporation GE Company USEC Bechtel Power Corporation Global Nuclear Fuel ndashUS August 2005 [2] Ellingwood Bruce et al RrdquoNuclear Power Plant Containment Pressure Boundary Aging Research (D8‐
A1‐US) ORNLCP‐l02338rdquo Department of Civil Engineering at the Johns Hopkins University Baltimore MD 21218‐2682 (USA) May 1999
[3] NUREG‐0800 (Formerly NUREG‐75087) US Nuclear Regulatory Commission ‐Standard Review Plan‐ Office of Nuclear Reactor Regulation Section 381 Concrete Containment draft review 2 April 1996
[4] NUREG‐0800 US Nuclear Regulatory Commission ‐Standard Review Plan‐ Office Of Nuclear Reactor
Regulation Section 382 Steel Containment draft review 2 April 1996[5] NUREG‐0800 US Nuclear Regulatory Commission ‐Standard Review Plan‐ Office of Nuclear Reactor
Regulation Section 383 Concrete and Steel Internal Structures of Steel or Concrete Containments draftreview 2 April 1996
[6] NRC Information Notice 2004‐09 Corrosion of Steel Containment and Containment Liner Office ofNuclear Reactor Regulation Washington DC 20555‐000‐ April 27 2004
[7] NUREG‐1150 Volume 1 Reactor Risk Reference Document MIT Nuclear Eng Dept Internal Copy 1996[8] DC Williams JJ Gregory SR Tieszen JL TillisrdquoContainment Loads Scoping Calculations for Severe
Nuclear Reactor Accidentsrdquo Sandia Report SAND92‐2774 UC‐940 NPRW‐SA90‐5 Unlimited Release
Printed February 2003[9] Shinozuka MH Hwang and M Reich ldquoReliability assessment of reinforced concrete containment
structuresrdquo Nucle Eng amp Des 80 (1984) pp 247‐267[10] Kawakami H Hwang MTChang and M Reich ldquoReliability assessment of Indian point unit 3 containment
structuresrdquo BNL‐NUREGCR‐3641 January 1984[11] Power Authority of the state of New York ldquoIndian Point NPP unit 3 final safety analysis reportrdquo Docket
250286 1994[12] Mirela Gavrilas ldquoA framework for Integrating Risk and Safety Marginsrdquo RESDSARPNRCA August
2006[13] Wen YK ldquoMethods for reliability in structures under multiple time varying loadsrdquo Nucl Eng ampDes 60[14] John D Stevenson ldquoCompanion Guide Book A guide to the ASME CODE Code for Concrete Reactor
vessels and Containmentsrdquo Edited by KR Rao and published in 2006 [15] Levin Howard Alan ldquoPrestressed concrete containments for nuclear power plantsrdquo Institute Archives ndash
Non‐circulating Collection 3 MS Thesis 1976 [16] Nicholas J and Carino ldquoStructures Division Prediction of Cracking in Reinforced Concrete Structuresrdquo
NISTI report 5634 Gaithersburg MD 20899 April 1995[17] Crystall Ball a risk analysis simulation and optimization Software distributed from Decision
Engineering Ver 72 August 2006
P a g e | 28

December 7 2006 [ 314J ‐ FINAL PAPER ‐ ] Edoardo Cavalieri drsquoOro
Index
1 Introduction some Historical Notions about Containments pp 05
2 LWR Containment Types and Characteristics pp 06
3 Specific and useful Notions about Containments pp 08
31 Containment Functionalities pp 08 32 Current Regulations pp 09 33 Loads on containment pp 1034 Accident Evolution and Containment Capacity pp 1135 Safety Margins in a Probabilistic Context pp 1336 Capital Expenditures for the Containment Building pp 15
4 Calculations pp 16
41 Preliminary Calculations from the IP3 PWR pp 16
411 Plantrsquos Description and Basic Assumptions pp 16412 Calculations and Analyses pp 19
42 Comments and Final Remarks pp 25
5 Tables and Graphs pp 26
6 References pp 28
P a g e | 4
December 7 2006 [ 314J ‐ FINAL PAPER ‐ ] Edoardo Cavalieri drsquoOro
1 Introduction some Historical Notions about Containments
The containment building which constitutes the ultimate barrier for each unit has the fundamentaltask to protect the people and the environment around itin case of an accident Because of this the so callednuclear island (basically everything that is inside thecontainment) is subjected to massive amount of regulations which are often very complex to decipher and apply A containment building in its most common usageis a steel or concrete structure enclosing a nuclear reactor
Containment buildings are an intricate and expensive part of a nuclear plant and the attention to them is also lately increasing togeth
Designers of U er with security concerns
S containment are mainly GE who
containments he BWRs containments while PWRs produced thave been provided by the Combustion
Engineering Co the Backcock Wilcox Co and the Westinghouse Electric Co The Stone Webster Co also designed several containments with reduced internal aipressure versus the more common dry‐containment type
r
In the United States the design and thickness of the
Figure 1 A LWR containment building Source
containment are governed by 10 CFR 5055a
anEPRI study on Aircraft Crash Impact t Demonstrate Nuclear Power Plantrsquos Structural
o
Strengthrdquo December 2002
Some historical notes about containments the first one used to house a large power reactor (gt 1000MWe) was the Connecticut Yankee North‐east Utilities deformed‐bar reinforced‐concrete containmentfor a Whestinghouse PWR reactor with a design started in 1962 and completed in 1967 by the Stand Webster Engineering Co The design essentially used the working strength design provisions of
onehet
then‐current ACI Standard 318‐63 Building Code augmented by agreements made between the Atomic Energy Commission (AEC) and the Utility Owner of the plant as documented in the Safety Analysis Report for the plant [14]
Note finally that in the US last containments were built in 1976 and that modern containments typescan be found mainly in Japan while in the Soviet Union it was normal practice not to build containmentbuildings This along with the unstable nature of the RBMK reactors led to the catastrophe of theChernobyl accident In the case of these types of reactors it would be more proper to refer to the building housing the reactor as a reactor building rather than as a containment building
P a g e | 5
December 7 2006 [ 314J ‐ FINAL PAPER ‐ ] Edoardo Cavalieri drsquoOro
2 LWR Containment Types and Characteristics
Pressurized water reactor (PWR) containments typically consist of heavily steel‐reinforced concrete cylinders ranging in thickness from 1 meter to 13 meters capped by a hemispherical dome of steel‐reinforced concrete The cylinder is typically 40 meter high with a 40‐meter diameter Reinforcementbars that form a cage within the concrete are typically Grade 60 18 steel bars on 30 to 40 centimeters centers A 18 rebar is 56 centimeters in diameter ndash about the size of a manrsquos forearm Pressurizedwater reactors constitute about two‐thirds of the 104 reactors operating in the United States
Boiling water reactor (BWR) containments typically consist of a steel containment vesselsurrounded by a reinforced concrete shield that typically has a thickness of four feet or greater and is housed within the reactor building The primary containment of a BWR is typically one‐third thediameter of PWR containment
Figure 2 Different typesconfigurations of containment building as they are in the US
PWR common designs are categorized as either large‐dry sub‐atmospheric or ice‐condenser
For BWRs the containment and missile shield fit close to the reactor vessel The reactor building wall forms a secondary containment during refueling operations The containment designs are referred to by the names Mark I (oldest drywelltorus) Mark II and Mark III (newest) All three types house a large body of water used to quench steam released from the reactor system during transients
Different properties and features of these containment types are reported in detail in Table 1
P a g e | 6
[ 314J ‐ FINAL PAPER ‐ ] Edoardo Cavalieri drsquoOro December 7 2006
Table 1 Main containment features and characteristics of the US fleet divided by design type (Pressure Water reactors and Boiling Water Reactors)
Characteristics of the US Containments (109 units)
BWR Containment DesignTypes PWR Containment DesignTypes (5)
Mark I Mark II Mark III Sub‐atmospheric Ice Condenser Large‐Dry
Number of Units 24 8 4 7 9 57
Pressure Suppression Yes Yes Yes No Yes No
Number of Barriers 2 2 3 3 3 3
Volume (103m3) 12 15 48 52‐70 36‐ 40 46‐100
Heat Capacity billion of BTU 17 13 13 ‐ ‐ ‐
Design Pressure MPa 0528 048 020 041 030 042‐052
LOCA Pressure MPa 04 04 016 ‐ ‐ 034
Reactor thermal power (MWth) 1593 ‐ 3293 3293 ‐ 3323 2894 ‐ 3833 2441 ‐3411 3411 1500 ‐ 3800
Containment free volume (ft3) drywell wetwell
200000 ‐ 320000 110000‐ 180000 90000 ‐ 140000
200000‐310000 140000 ‐ 190000 340000 ‐ 500000
1440000‐ 1800000 250000 ‐ 280000
1165000‐ 1550000 1800000 1200000 2600000
Containment free volume (103m3) 1586 2563 4943 5493 3662 7934
Cont volume to thermal power ratio (m3MWth) 753‐364 451‐456 1252‐1659 2052‐2130 1114 2632‐3067
Containment strength Containment design pressure (MPa) Median containment failure press (MPa) in IPE
049‐053 078 ‐ 141
041‐048 107‐ 142
02 049‐075
041‐052 093‐100
018‐031 035‐076
038‐052 072‐141
Containment construction 22 steel
2 concrete 1 steel
7 concrete 2 steel
2 concrete 7 concrete
‐7 steel
2 concrete 7 steel
50 concrete
Vapor pressure suppression system Vent header with
vertical bents DWWW vacuum breakers
Vertical vents DWWW vacuum
breakers
Horizontal vents and SPMU(1) DWWW vacuum breakers(2)
No Ice condenser and recirculation fans
No
Containment heat removal system (3) RHR(1) system in SPC(1)
or DWS(1) mode RHR system in SPC or DWS mode
RHR system in SPC or DWS mode(4)
Containment spray(6) and fan coolers
Containment spray(6) and fan coolers
Containment spray(6) fan coolers
Combustion gas control Inerted by N2 Inerted by N2 Igniter System Hydrogen recombiner (for
design‐basis) Hydrogen igniters
Hydrogen recombiner (for design‐basis)
Containment venting for pressure control Hardened vent pipe requested by CPI(1)
Hardened vent pipe not requested byCPI
Hardened vent pipe not requested by CPI
‐ ‐ ‐
Allowable Leak Rate (volume day) 05 05 04 01 025 01
Capability Pressure (MPa)
‐091 (7) 107 052 103 045 092
(1) RHR Residual Heat Removal SPC ‐ Suppression Pool Cooling DWS ‐ Drywell (or Containment Spray System SPMU ‐ Suppression Pool (2) River Bend does not have an SPMU systems or DWWW vacuum breakers (3) There is also a fax cooler system for CHR during normal plant operation It is not a safety system and is usually not credited in the PRA (4) River Bend does not have a containment spray system but has two safety‐related containment unit coolers (5) From NUREG‐1560 November 1996 (6) Recirculation spray taking suction from the containment sump (7) CPWGutilized the capability pressure predicted for Browns Ferry
P a g e | 7
December 7 2006 [ 314J ‐ FINAL PAPER ‐ ] Edoardo Cavalieri drsquoOro
3 Specific and Useful Notions about Containments
31 Containment Functions
The primary function of the containment building is to contain radioactivity in case of an accidentfrom public and to maintain the internal pressure without leaking in case a major accident occurs
bull Public Protection ‐ Retention of radioactivity ‐ Retention of missiles (internal missiles)
But beside those there are further implicationsfunctions of primary importance which have to deal with the protection of the plant itself and we reported as
bull Protection of Plant Systems ‐ Natural elements (flood storms hurricanes t‐ Human actions (crashes and explosions)
ornados and wind)
‐ Fires‐ Missiles and planes (external missiles)
Finally consider that at the containment are anchored many of the systems it contains so it has tosupport their weight and other permanent load such as dead loads
bull Structural Support of Systems‐ Routine‐ Seismic or other dynamic effects ‐ Internal loads during accidents
Note that from an economic point of view assess all these functions all together is impossible and that is most of the efforts about containment is to reduce costs by means of opportune optimization techniques find the right tradeoffs among all of the functionalities we reported above Also consider that as being the last barrier of the plant design conditions should be very complex to figure and takeinto account even more of the functionalities introduced (or we think about new reactor designs using
sodium as coolant or with higher pressure operating and accident conditions as the S‐CO2 FGR at MIT)
P a g e | 8
December 7 2006 [ 314J ‐ FINAL PAPER ‐ ] Edoardo Cavalieri drsquoOro
32 Current Regulations
In this Section we want to give a flavor of the exceptional and sometimes atypical amount ofobligations designers have to follow in the case of concrete containment buildings Among the manyregulations guidelines and codes the guiding one is the NUREG‐0800 ldquoStandard Review Plan for theReview of Safety Analysis Reports for Nuclear Power Plantsrdquo[3] Tregulatory guides for decades but today as a new regulatory framewor k
his constituted the referenceis expected to review and add
new features and constrictions to the containment design because of the list of factors reported below
1 US nuclear power plants have an average age of 40 years and some initially undersigned agemechanisms are showing up all around the US nuclear fleet typically for our purposes here aging ofconcrete
2 As a consequence of that many plants faced and are facing re‐licensing which exposes them tomore restrictive inspect
3 New designs asionsFast Gas Reactors are expected to render the environment within the
containment more aggressive and hostile (higgher values of the main thermodynamic variables such as
the pressure at which they operate or higher radients of temperature are classical examples) or othersas IRIS pose new challenging specifications and functions to the traditional containment design
Thus in the last years the Nuclear regulation Commissionrsquos (NRC) staff was currently evaluatingcertain regulatory guides for adequacy for use in new reactor licensing and a preview of the new outcoming rules regarding containment buildings (specifically SRP sections 381 382 and 383) willprescribe new mandatory prescriptions on concrete and steel containments In addition to this the NRCRegulatory Guides ‐ Power Reactors (Division 1) also explicitly addresses In‐service Inspection ofUngrouted Tendons in Prestressed Concrete Containments (Regulatory Guide RG 135 and 1351)Containment Isolation Provisions for Fluid Systems (RG 1141) and Performance‐Based ContainmentLeak‐Test Program (RG 1163) to which descends the RG 1136 regulates Construction and Testing ofConcrete Containments Containment System Leakage Testing Requirements addresses a regulatoryposition which addresses new containment system leakage testing necessities Ultimately the ReactorLicense Renewal process gives further regulations for the future installations of plants in the unitedstates Reactor License Renewal Guidance Documents NUREG‐1611Aging Management of NuclearPower Plant Containments for License Renewal gives evidence of needing in terms of in‐serviceinspection requirements (as promulgated in 10 CFR 555a for license renewal)
Containment construction criteria which include design loads load combinations and acceptablebehavior applicable to concrete nuclear containments developed originally as a unique combination ofmechanical and civil structural engineering procedures They are composed of procedures consideredin design and analysis of boiler and pressure vessel components developed by the ASME Boiler andPressure Vessel Code Committee and those procedures used in design of conventional concrete buildingstructures as developed by the American Concrete Institute (ACI) 318 Code Committee This situationnaturally follows from an understanding that such containments perform a dual function (1) to be a
P a g e | 9
December 7 2006 [ 314J ‐ FINAL PAPER ‐ ] Edoardo Cavalieri drsquoOro
building structure used to house and to protect from design‐basis hazards nuclear safety‐relatedstructures mechanical and electrical components and distribution systems associated with a reactor coolant system and (2) to serve a primary function as an engineered safeguard to contain the postulatedradiological consequences of a loss‐of‐coolant accident in the nuclear steam supply system
In addition to the pure regulatory framework imposed by the NRC we also found a historical contraposition of the rules that of the ASME imposed to all boiling and vessel systems and the specifications given by the ACI in case the containment is going to be built with concrete
33 Containment Load Factored Loads
The load to which the containment should be exposed to constitutes a major source of uncertainty and it reflects the various functionalities presented in the previous section Problems here are
determining the different loads and types of loads and theircombination concurring to the ldquoworst possible scenariordquo Moreover also note that all the uncertainties coming from the PRA I and PRA II analyses involving the deepest barriers of the plant sort of cumulate in containmentanalysis and also sum up with the uncertainties naturally arising from the definition of a proper environmentalmodel of dispersion after this ultimate barrier failsFurthermore also the evolution of these loads within theaccident time constitutes a major concern especially regarding new under design technologies such as the S‐CO2FGR here at MIT where the design of the containment willbe crucial because of the different amount of heat (due tothe different fuel and coolant) and of the different heat
Another inmechanismstransport teresting aspect we have to consider is that the
distributions of loads could be both of dynamic and staticnature but in the particular example we are going toconsider the Indian Point 3 plant are not computed tokeep calculation easier
Figure 3 Load combinations for IP3 [10]
In order to incorporate the earthquake ground acceleration load which has a dynamic nature we should use the model proposed by Wen [13] to combine them as shown in figure 3 (Table 3 offer an idea of the final output that is usually provided by these models) Because of all the possible sources of uncertainties already mentioned ASME and ACI codes reduce them by factorizing loads into differentwell specified load factors and also as in Section III of the BampPV ASME Code factorize loads and takeinto account the standard deviation and mean values of the concrete properties It is thus obvious that a probabilistic framework would fit fine in this context and later section will go further explaining it
P a g e | 10
December 7 2006 [ 314J ‐ FINAL PAPER ‐ ] Edoardo Cavalieri drsquoOro
34 Containment Capacity and Accident Evolution
The capacity of a given structure is subjected both to vary over time and to uncertainties around itsvalue at a defined instant time To address uncertainties o structural strength of the containment we here provide a list of related meaningful considerations
1) The retaining of the CG (presence of leaks ruptures) and the size of the leak or penetration (whichdetermines a depressurization rate and also a possible release of contaminated material)
2) The chemical reactions between steel and oxygen concrete and CO2 or other minor reactions capable to affect in the few hours of the accident the strength of the concrete walls or liner
3) Temperature on the wall of the CG (ASME code provides different margins depending on T)4) The stratification of the gas mixture or other mechanisms that can reduce locally the strength of the
concrete or of the liner surface
In the model we are using in these paper as shown in next section a normal distribution will take 1into account of possible uncertainties in its mean value The capacity provided in figure 4 as the upper
curve is always thought as a constant line but actually over the reactorrsquos lifetime it would not be appropriate to consider it as a constant In reality by recalling the factors listed above a concurrent series of mechanisms are going to modifyaffect its initial design value and consequently its value over time
1 Corrosions or any other Aging Mechanisms 2 Chemical reactions with CO2 (carbonation of the concrete)3 Fragility curve of the steel (ASME code for the temperat4 Penetration due to impact with internal or external missiles
ure effects)
5 Water release within the containment
The discussion provide her is actually given for completeness but actually none of these mechanisms will be analyzed in the present analysis But the hope is that as emphasized in theprevious section the reader will be aware that new regulations (by new we mean the last 15 years or so) are trying to consistently address material degradation mechanisms and that a complete analysisas recent papers in the field are showing will include the effects of uncertainties as time change
Now we need to connect the concept of load to the concept of capacity The load is the evolution of pressure (which is varying in a more stringent time that is the time of the evolution of a possibleaccident) Figure 4 provides a possible example of pressure load history during different scenarios of evolution of the accident and leading to different reliability end states The capacity (expected failurepressure) is the demarcation zone for scenarios ending in a failure state Note that from this figure could be better explained trough the set of observations that follow
1 The Capacity is given primarily by the external pre‐stressed concrete barrierrsquos strength so in this case itrsquos deducible from the mechanical properties
of a single component and this because the internal steel liner plays a marginal role in supporting the structure
P a g e | 11
December 7 2006 [ 314J ‐ FINAL PAPER ‐ ] Edoardo Cavalieri drsquoOro
The black line shown in figure 4 represents the pressure evolution during an accident The accidentcan follow different paths or scenarios Until the peak the accident can be thought as the DBA orclassical LOCA where the energy and amount of inventory reversed from primary trough containmentare essentially determining it The peak pressure is used to determine the design basis accidentpressure by increasing it of a factor that usually ranges from 10 to 252 The bifurcation point is in thisillustrator example the last point in which to achieve or not the desired mitigation trough ie the ECCSsystem If we donrsquot have the expected mitigation the pressure evolves following the path of a severescenario with meltdown where the pressure is going to pass the boundaries imposed by the designpressure and then ultimately ends in a failure state of the containment this is the region we are goingto refer The region between the red and the brown line constitute the safety margins in terms ofpressure for the reactor building Passing
g the red line means going below the required margins for
safety and passing the brown one means oing through a failure mode of the containment This secondupper boundary is also known as capability of the system and we are going to refer to it later on in thiswork when the phase of conceptualization of a calculation will require that Finally note that the graphpresented below refers to pressure and not to stresses A proper safety margin representation will be ina stress‐time space and would take into account not just pressure but as we anticipated in the previousSection also other factors piling up with it such as temperature dynamic loads
Figure 4 Pressure histories in the containment after a large LOCA leading to reactor meltdown
2 Containment design pressures typically have been defined as 10-25 above maximum pressure Initial design of containment typically used a 40 margin for containment barriers and 20 for interior structures that did not serve a barrier function These margins were reduced to half these values when all the geometry of the interior compartments are known as part of the final design An even lower margin can be used if rigorous modeling and dynamic load effects are considered
P a g e | 12
December 7 2006 [ 314J ‐ FINAL PAPER ‐ ] Edoardo Cavalieri drsquoOro
35 Safety Margins in a Probabilistic Context
The safety margin nomenclature does not find an official definition in the literature Despite its wideuse in the last decades we are not able to provide a definition that is common to all the different actors that should play a consistent within the current nuclear industry and regulation Thus we are going toprovide a definition with which is connected intimately with the definition of ldquoadequate safety marginsrdquo stated by [11] with which we agree and that is in line with the scopes of the present workNote that the definition I provide below descends and applies to a single event sequence The event sequence can be a DBA design‐basis accident or a sequence from an event tree ET
In general the Safety Margin SM has been devised to deal with uncertainty But different types ofuncertainties exist and their quantification is also different and challenging too aleatory uncertainties that are uncertainties attributable to quantities that are inherently random or stochastic and the epistemic ones attributable to lack of knowledge The trivial part of uncertainties quantifications ismostly given by the second category the epistemic uncertainties the advantage in dealing with them is the fact that they can be reduced with the acquisition of new data on the other hand they are hard tomanage because they may reflect limited lack of knowledge as well as complete ignorance or by using the definition of M Gavrilas the ldquounknown‐unknownsrdquo [12]
The more general definition of safety margin was cast for structural‐mechanics analyses recognizing the fact that both load L and strength S are distributed parameters Figure 5 shows probability densities for load and capacity which shape the bases for the more general definition of safety margin
+infin +infin
( gt P ) = ⎢⎡
( f L d )⎥⎤
( ) P P ( ) L f C dCL C int int L C
minusinfin ⎣ P ⎦
Figure 5 Capacity and load distributions within the containment and SM def
The quantity safety margin SM describes the reliability of a barrier or system in light of load‐strength or load‐capacity considerations It is computed from the following equation
P a g e | 13
December 7 2006 [ 314J ‐ FINAL PAPER ‐ ] Edoardo Cavalieri drsquoOro
C - L (11)SM = σC
2 +σ2L
where C is the mean capacity or containment strength L is the mean load σc is the capacity standarddeviation and σ is the load standard deviation3 Thus the safety margin results to be an indirectL
measure of the overlap in the probability density functions and can be used to estimate the probabilitythat the load does exceed the capacity (ie the probability of failure)
+infin +infin ⎡ ⎤( gt ⎢ L ( ) L f C dP L C ) = int int ( f L d )⎥ C ( ) C (12)
minusinfin ⎣ C ⎦
4Under the strength‐stress model (see Fig 5) for failure mode i the reliability is defined as the probability that the strength C is greater than the stress L The strength and stress are in generalsense Any resistance such as a yield strength allowable force or allowable deflection can be
5considered as strength and any loading‐type quantity such as a bending stress external force ordeflection can be considered as a stress
For normally distributed C L the probability of failure (ie 1‐reliability) can be expressed as a function of safety margin (Equation 11) alone This is one reason why safety margin emerged as thesole proxy for reliability in many applications The other reason is that the design goal (in the nuclear industry especially in the related field of the pressure vessel construction as presented here) is to build components and systems that have negligible failure probabilities This can be attained by having sufficient safety margin (ie a large separation between mean capacity and load relative to theircombined standard deviations) This solidified the generalization that having adequate safety margin is asufficient condition for high reliability Thus a highly reliable system (ie one in which the probability offailure is negligible) shows no overlap between the probability densities of capacity and load On theother hand refer to figure 5 a non reliable system shows a configuration of the system that ibecause it shows a common area for the capacity of the system and the load at the accident
s defective
With the definitions provided in the last two Sections we can now define the Capacity and Load condition in the case of the specific example of the Indian Point 3 unit for which data ( in terms ofdistributions) are available Before doing that please note once again that the capacity as reported in figures 4 and 5 is drown as a brown straight line but that in reality the strength of the concrete andsteel are subjected to several degradation mechanism (as reported in the list given in the previous Section) not reported here and for which we assume to be all negligible over the lifetime of the reactor
3 The ratio in Eq 11 means that for a given distance between C an L can be reduced if L or C present big uncertainties This is a measure of the probability for the two curves to overlap in presence of flat distribution curves and its aim is different from the (C-L)C ratio that we are going to use later which is typically showing the variation of the margin with regard of the original C (mean) value Note the two formulations can be both used and they are consistent with each other
4 Note that failure mode for containment are not addressed in this paper so we refer to the general definition of a potential crack which is going to reach adefined size which in turn allow the gas to be released in the environment This definition in its generality includes the loss of almost all the functionalities of the containment as presented in Section 31
5 Or combinations of loads as it will be the case of the factored load that we have to deal with in the example provided in this paper
P a g e | 14
December 7 2006 [ 314J ‐ FINAL PAPER ‐ ] Edoardo Cavalieri drsquoOro
36 Capital Expenditures for the Containment Building
We conclude this preliminary section about the containment by providing a range of possibleestimation of a large dry atmospheric containment We will recall later on these numbers in Section 4when it will be required to evaluate a less ldquosafe marginedrdquo solution in terms of economical benefits
The containment building is usually costing between 8 to 12 of the total initial expenditure in construction and it is particularly sensible to delay in construction
Cost of containments varies widely by design (PWR vs BWR) and location of the plant A BWR typically has more concrete and rebar due to wetwell drywell configuration The location is importantbecause of the seismic zone As an example the ABWR that the Shaw Group is building in Taiwan theground force acceleration is very large and as a result the amount of concreterebar is very high There is also a variation in techniques or philosophies adopted worldwide some France plants like theldquoBrennilisrdquo are regardless of costs completely pre‐stressed including the base‐mat while an US plantlike ldquoGinnardquo is partially pre‐stressed axially and just in the cylinder
Also the labor rates will impact in addition to material costs For instance in the Northeast US labor rates are much more than in the Gulf Coast This will vary worldwide also and likely depend
3greatly on labor productivity QA Cat 1 concrete runs about $120yd these days[1] I can take that acomplete new nuclear plant holds 100000 m3 of concrete and roughly 50 goes to the containmentThe labor is hard to predict so it will be excluded from present economic evaluations
Anyway if we select todayrsquos cost and suppose a containment to be costing around 20 Million man‐hours for units (which is reasonable and deducible from past average construction times) done several years ago By discounting the obtainable value by about 25 and then applying perhaps 25 to the containment we could also be able to do a rough estimation of the labor force required too Howeverthe concrete rebar and labor dont make the whole containment Most containment in fact have liners and most have a lot of embeddedattached equipment that should bring total costs closer to 15 of the total initial capital expenditure (so something around 30 million dollar for the containment of a 2
About the liner consider that ang to be our maximum value in the calculations) billion dollar LWRrsquos plant is goi
ll US containments have one In the US is part of normal practice tobuilt it because of it provides a leak‐tight membrane whose integrity is obviously important to preserve Beside this main scope it is anchored to the concrete shell with systems ofangels or grid of studs which serve to limit large scale deflections and in turn limit strains
channels and
We conclude giving the assumptions we are going to use Imagining not to consider labor costs 3specific costs for concrete are 270 $m [1]and for the steel used for the bars a price estimate for steel
3equal to 25 $kg (consider that steel has a density of 7850 kgm )
P a g e | 15
December 7 2006 [ 314J ‐ FINAL PAPER ‐ ] Edoardo Cavalieri drsquoOro
4 Calculations and Results
41 Preliminary Calculations from the IP3 PWR
This Section constitutes the core in computational terms of the present paper and its aim is toevaluate the safety margins of a concrete‐steel reinforced containment The objective is to answer or at least provide a solid basis to answer the question if it is possible to double the pressure of a LWRrsquos containment and maintaining appropriate margins as well The evaluation of the safety margins of any building implies the knowledge of the capacity (or maximum strength or capacity = C) of the structure
and the load (or maximum stress or load = L) to which the structure is exposed to The safety marginscan be roughly determined by the difference of the two mean values of the strength and load our focus here is first to provide an estimate of the safety margins under initial proper load conditions which will be then doubled in a second moment The different load conditions are deduced by elaborating some results available from studies conducted on a selected reference plant (Indian Point unit 3) which had been chosen for both its representativeness and the availability of studies related to it [9][11]
411 Plantrsquos Description and Basic Assumptions
The initial geometry of the problem is defined by Figure 6 which sketches the containment of theIndian Point while figure 7 and 8 are showing the configuration of the bars immersed in the concretewe are going to refer to Table 4 summarizes the characteristic of the Indian Point unit 3 plant
We here report the material properties and geometry of the IP3 plant as extracted from the various pertinent sources available
Material Properties
The material properties intrinsically involve epistemic and aleatory uncertainties Hence an appropriate probabilistic model should for instance consider the material strengths as random variables while Youngrsquos modulus and Poisson ratio as deterministic ones The properties of theconcrete and reinforcements are summarized as follows as referred to the Indian Point unit 3rsquoscontainment
A Concrete the concrete has a minimum compressive strength frsquoc (or design minimum ultimatestrength) equal to 3000 psi (2068 MPa) and which we should assume is normally distributed and
statistical data of available tests provides a microσ= 4896 627 in psi (3437 432 MPa) [10] [11] Youngrsquos modulus and Poisson Ratio are equal to Ec=31 MPsi (21373 GPa) and 02 which is equal to the bar
P a g e | 16
December 7 2006 [ 314J ‐ FINAL PAPER ‐ ] Edoardo Cavalieri drsquoOro
value while bars have a Es=29 MPsi (20 GPa) The statistic used for the steel bar yielding strength are obtained by considering the predominant reinforcement as constituted by 18 bars as clearly shown byTable 2 Thus from same data fy result to be normally distributed with microσ= 718 518 in Ksi (495 357MPa) Note that the Ec value of the concrete has been varied between the 30 and 100 in order toevaluate different behaviors of the concrete with cracks
B Steel Liner the plate steel liner is carbon steel conforming with ASTM designation A442‐65 grade 60 This steel has a minimum yield strength of 32000 psi ( σymin= 220MPa) and minimum tensilestrength of 60000 psi ( σtmin= 413 MPa) with an elongation of 22 in an 8‐inch gauge length of failure
Geometry
Figure 7 shows the IP3 containment analyzed
Figure 6 Containment with spherical shell on the top of the PWR type as for the Indian Point 3 unit
Main dimensions are
R+L=H m R= 20574 m H= 667512 m L= 461772 m Ss= 10668 m Sc=13716 m
P a g e | 17
December 7 2006 [ 314J ‐ FINAL PAPER ‐ ] Edoardo Cavalieri drsquoOro
Containment Capabilit
Containment capability is given from the probabilistic safety study of Indian Point Plant in theappendix 441 [11] It is an essential element of risk evaluation for degraded core events because itdefines the realistic lower bound ultimate containment building capability for withstanding internalpressure loads This had been determined to be 0972 MPa (or 141 psia) for IP3 based on a failurecriterion defined as the state of having reached general yield in the reinforced walls At that pressurethe strains start to significantly increase and radial deflections of the containment wall may becomeunacceptably large This value is consistent with the average value for capability we provided in Table1 so it confirms that the IP3 is a good representative example of large dry containment building Thecapability was defined as the maximum combination of temperature and pressure to produce a generalyield state
Load factors
Load factors used in IP3 safety report were calculated by following the ACI 318‐63 load factors inthe design primarily provide for a safety margin on the load assumptions Specific combinations used inthe design are presented below The design included the consideration of both primary and secondarystresses The load capacity (the capacity in the old way
yto define it) was based on the ultimate strength
values presented in part IV B of ACI‐318 as reduced b a capacity factor φ = 09 for flexure and 085 fordiagonal tension bond and anchorage For the liner steel it is equal to 095 for tension while forcompression is maintained below 095 yield
The loads used to determine the required limiting capacity of any structural element on thecontainment structures are
(1) L=D+‐ 005 D +15 P + 10 (T +TL)
where D=dead load of the structure P= pressure associated to the DBA accident as shown in transientcalculations and T = load due to the maximum temperature gradient trough the concrete shell upontemperatures associated with 15 P while TL= load exerted by the liner based on 15P
Three other loads were defined by inserting also other possible contributions such asearthquakes winds and tornado We here report just the first condition which mean that thecontainment has the capacity to withstand loadings at least 50 greater than those calculated for theLOCA alone6
The loads we are going to consider are the DEAD LOAD the ACCIDENTAL PRESSURE andTEMPERATURE and the PRESTRESSING LOAD
6 All the structural components are designed to have a capacity required by the most several loads combination The loads resulting from the use of these
equations will hereafter be termed ldquoLoad Factorsrdquo
P a g e | 18
December 7 2006 [ 314J ‐ FINAL PAPER ‐ ] Edoardo Cavalieri drsquoOro
Results of the SM analysis conducted on the IP units 2 and 3
Containment can withstand a pressure of 0972 MPa which is 27 times the DBA pressure (032MPa) and this without impairing the functional capability of the containment This analysis at that timewas conducted manually at different levels of the structure and in correspondence of critical regions like membrane region of the dome and cylinder base‐mat liner or close to large penetrations The critical region was to be found in the cylinder just above the base‐mat (first elevation in Table 2) in a zone where the seismic reinforcing steel is reduced
The 27 factor found corresponds to the conservatism applied in the original design as summarized below
1 Application of load factors2 Application of capacity reduction factors3 Strength of liner not accounted for4 Minimum strength of the material accounted for 5 Seismic rebar resi6 Designer conservatism
sting LOCA loads
So all of these considerations concur to prove that the actual capability is higher than 0972 MPa Notefinally that the role of the concrete cracking on shell stiffness is also incorporated into the calculations as required
412 Calculations and Analyses
The present analysis is conducted only on the main cylindrical wall and steel liner and upper dome are not considered so any analysis of the dome over the cylinder is provided here
A welded steel liner with a minimum thickness of one‐quarter inch it is attached to the inside faceof the concrete shell The load carrying capacity of the liner is usually disregarded from calculationsbecause this is not functional to the scope of the liner which is to ensure a high degree of leak tightness
Note that the surface of the containment is imagined without penetrations personnel locks and equipment hatches
The containment wall is reinforced with hoop meridian and diagonal rebar The typical rebar arrangement we refer to for the cylindrical wall is shown in Figure 8 The hoop and meridional rebars are divided into two groups and each group is placed close to the wall surface We consider that the tendons move in the longitudinal direction the same as the concrete So the rigidity is calculated on thebasis that plane sections remain plane and that transverse Poissons ratio of the bars can be treatedthe same as the concrete The details of the rebar arrangements for the cylindrical portion of the IP3containment are shown by Table 2 [11] The sense of this table is to observe that rebar is changing atdifferent elevations (note that a proper calculation would inspect the various elevations by means of a
P a g e | 19
December 7 2006 [ 314J ‐ FINAL PAPER ‐ ] Edoardo Cavalieri drsquoOro
traditional finite element mash but also the safety report did not conducted it at that time) An average value among all the elevations has been used to perform our calculations Among the differentelevations and point in space we selected the region near the base mat We considered the cylinder tbe built‐in at the position it joins the base mat (zero radial deflection zero slope of radial deflection)
o
About pre‐stressing conditions we assume there is no bending of the shell in the unpressurizedcondition and that pre‐stressing is going to be achieved by ldquopost‐tensioningrdquo
Finally we assumed elastic behavior and we define flexural rigidity on the basis of the section ofmaterial shown in Fig 8
Figure 7 Rebar arrangement for Cylindrical Wall Figure 8 Section of the reinforcing steel array for IP3
Evaluate the impact of changing the capacity of the bars in the longitudinal tendon on the required pre‐stress level to prevent tensile in the concrete upon pressurization and verify that the obtainedvalues stay beyond the prescribed margins requires calculating the required pre‐stress level of thegeneric containment shell
First we compute some constants that will be used and then perform an analysis of the single piece of concrete based on the thin shell theory as cited in L54 notes of the 314J class Beside the different values assigned to the material and some differences in the design the calculation proposed herewhich is qualitative but provides the order of magnitude we deal with iand not deterministic Assumptions of the analysis are reported at t h
n safety analysis is probabilistic the present Section e end of
In order to compute calculation and uncertainties propagations we made use of the Crystall Ball [17] software which allows using as an input the different load distributions composing the factoredload formula and easily provides as an output the probability of failure of the structure or in other words the margins we are interested to The software in use was also useful to optimize the results as a function of costs and to perform Monte Carlo sampling of crucial parameters such as Ec
P a g e | 20
December 7 2006 [ 314J ‐ FINAL PAPER ‐ ] Edoardo Cavalieri drsquoOro
Remember the intent is to verify the margins under accident conditions so we will refer mainly toregulations directly imposing specifics and affecting the margins in question mainly NUREG‐0800 and Section CC‐3540 of ACI‐359 applies specifically to the pre‐stressed containment designs however all manner of ASME III and ACI codes apply Also Code of Federal Regulations 10CFR 5055a applies and inaccordance with ASME Section XI Subsections IWE and IWL The minimum value usually is reported tobe equal to 2 (see NUREG‐800) in our calculations conservatively we are going to assume it in thrange that goes to 2 to 3 (IP3 has a 27 [11] value of applicable margins see eq 18 in the next Section)
e
Calculation 1 Safety Margins of the IP3 plant with our Model
The safety margins of the structure as reported in figure 6 from the shell theory and thus referred to figure 7 and 8 is computed as follow
||
1 1 25
1 85
2
(13)(14)(15)
(16)(17)(18)
90
So accordi t tions the load factor ldquoLrdquo of Eq 1defined from t Pa and increased of
he γ value
o our assumphe accident sequence pressure
esis conservatively
Eqbecause here we donrsquot know a
b
ng
i
t4 or the design pressure is mainly he margin we previously described the details of the load) settled equal
he concrete with the thin shell theory Fthe structure and its
Hereto 1
( lltgn pressure in
and D are then obtained by assuming nties are overshadowed
effect on the limit state probabilities
t
25 The d 13 is obtained analyzithat the dead l
tngoad is mainly the weight of
y the large variability introduced b the other two so it has a mihus its value is going to e deterministic and equal to 150 lbsft
a ran as een treate as a Gaussian with mean
iuncerta y nor 3b
t
The accidental is indeedvalue of 47 psi = 032 MPa and s
The capacity ldquoCrdquo is in contrast decreased to taand uncertainties regarding
dom variable and h b d
pressure d dev of 502 Psi (00346 MPa) according to the data o
ke into account possible imperfectiending moment acting on the structure and here corresponds to a
t to be equal to of th
f ref [11]ons of the material
he btresidual factor=90 Note
ihat the value we choose for frsquoy is se
strength of the mater al as imposed to be for average tensile stresses for bounded reinforcing steel In addition to this we have to avoid that the concrete faces creep deformations and
impose a limit on the pre‐stress F Eq 17 as given from the ACI‐359nto the tensions within the shell of reference
50 ieldt e y
hus we t
iThus constriction imposed on the material translates
MAX(σHspreS =(1‐Xhs)XhsσHcmax microσLspreS = (1‐Xls)XlsσLcmax)lt085fc (19)
P a g e | 21
December 7 2006 [ 314J ‐ FINAL PAPER ‐ ] Edoardo Cavalieri drsquoOro
Equation 18 provides ultimately the safety margins in a deterministic formulation while the probabilistic one assuming that both Load and Capacity are normally distributed as was given in Eq11 is at the moment not considered Because the system of the equation identified revealed to be linear the formulation of Eq 12 can be used and thus the margins we found are going to be expressedin terms of their relative initial capacity (see also footnote 3 at page 13)
SM = (C‐L)C (110)
Note that as stated before we expect the absolute value (C‐L) to be equal to 2 at least (see NUREG‐800) but our calculation initially find evidence of bigger margins because we donrsquot consider abnormalload conditions (see Table 5 where SM=805) By varying the coefficient γ in equation 15 (Table 5makes use of a typical 125 factor which is used for DBA Accidents)in typical ranges are used to express abnormal load conditions (to value of 2 and 3) we can take into account of other possible load combing into the final load factor such as wind or earthquakes
So the calculation we settled takes into account all this limits and optimize the parameters we identified as crucial which are the Area of the steel bar=As the thickness of the shell=Sc=t the Young Modulus =Ec for the concrete which should be subject to cracking [16] the Pressure (by means of γ)within the containment and the Volume Vc which is actually based on the pressure itself (See figure 9)
7The software is calculating the safety margins following the criteria already defined and if the margins are not respected the area of the steel in the structure is increased or Ec increased in such a way to fitthe constraints given by the problem and optimize costs
Figure 9 Free volume and equilibrium pressure LOCA
7Note there are a set of different criteria we can establish and use to set up our limits or boundaries to the system which are related to the different performances desired from the structure (here we referred to strength and thus to measures of performance based on the yielding stress because a mere structural criteria was adopted but there are other performances we should be interested to such as serviceability stability plasticity and vibrations)
P a g e | 22
December 7 2006 [ 314J ‐ FINAL PAPER ‐ ] Edoardo Cavalieri drsquoOro
A final clarification about the way we determined costs assuming there is no change of technology or construction methods corresponding to thickness variations of the concrete and of the area of thesteel bars used to pretension costs are simply calculable by multiplying the corresponding volumes ofmaterial in use for their costs for kg
(111)
( )
Results provided by Table 5 gives an overall cost that correspond to 147 of the initialinvestment cost we hypothesized to be for a PWR of this type (1000 MWe) around 2 billion $
112
Calculation 2 Sensitivities to Material and Geometry
After the calculation of the SM we run a couple of sensitivity analysis to verify some properties ofthe material such as the Young Modulus for the concrete Ec and to verify cost variations as a function of the parameter As
As is responsible of both the strength of the shell element and also of the weight of steel costs over the concrete ones The results are reported in the tables below as a function of costs and cost variation in percentage but this time with regard of the initial value given by ldquoCalculation 1rdquo By varying As above
2its mean value of 000255 m we obtained a maximum 1‐LC equal to 1139 for an As equal to2002707 m corresponding to a overall cost increase equal to 1656 above the base case
SM var and Cost var
000
200
400
600
800
1000
1200
SM
Cost 000 473 903 1295
Fig 10 SM as it varies with cost (capital cost as var )
P a g e | 23
December 7 2006 [ 314J ‐ FINAL PAPER ‐ ] Edoardo Cavalieri drsquoOro
Third calculation we computed is a sensitivity analysis on the parameter Ec or Elastic modulus of the concrete to see how the results are varying depending on the possible initial degradation of thematerial such as small cracks or imperfections [16] Results are reported below
SM var and Es var 02‐1
000
500
1000
1500
2000
SM
Es 1 09 08 07 06 05 04
Fig 11 SM as it varies with the young Modulus of concrete (crack effect)
Final note on other calculations of interest
Also a preliminary calculation has not been included in the tables but we cite it here as an interesting one which is reformulating the same exercise in the case we use a stainless steel containment instead of a concrete pre‐stressed one Calculations are pretty straightforward here and from the basic thin shell theory predict a 40 increase of the thickness Formulas which are reportedin the tables have been used as a reference to validate and compare the results of the calculations performed for the concrete case Evidently the steel containment is more expensive and not able toaccount all the functionalities of the concrete one But if we were going to consider it we should clearlytake into account the strength variation of the material at different temperatures (things about the restrictions given from ASME codes to the 16Cr‐12Ni‐2Mo Plate SA‐240 type 316 of which IP3rsquos liner is made of) thus forcing to take into incorporate temperature loads into the margins on the capacity side (which could be a good example of one of the mechanism we referred into Section 34 where the upper boundary of the system is varying with time in other words C=C(t) )
P a g e | 24
December 7 2006 [ 314J ‐ FINAL PAPER ‐ ] Edoardo Cavalieri drsquoOro
42 Comments and Final Remarks
In this paper an overall methodology to calculate the SM for a pre‐stressed concrete containment was given By referring to a specific plant with has been particularly studied by the literature the basisto compute probabilistic calculations of the safety margins were provided The analyses tries to put emphasis a wide discussion that has been both in class and during the writing of the paper withdifferent Professor of the departments of Civil and Nuclear Engineering here at MIT regarding thecurrent methodology to address safety margins The basic conclusions I would like to concentrate on here are even if not always clearly and explicitly addressed or still to be accomplished in possible futureworks are summarized the below
The current methodology used to address safety margins can be interpreted in respect of the following sentence that appears at the end of the safety report of the Surryrsquos containment ldquoFor Surrythere were no intersections of the load distributions with the containment strength distribution and thus the DHC issue for Surry can be resolved on containments loads alonerdquo
So current containments are adequately safe and as partially but quantitatively presented in thispaper is opinion of the author that thanks to developed state of the art of probabilistic criteria thecurrent regulation that looks obsolete and redundant in many parts could be replaced with appropriate ad hoc SM evaluations
Future part of the work should consider all the basic factors composing load factors and runs thesame optimization used here along all the possible beyond DBA scenarios (we here in fact just selected one and we limited the factors in the load factor formula to 3) comprehending all the loads involved inthe factorized formula of the L
A clearer framework would help to feel the gap that the hyper conservativism intrinsic to theregulation and caused by the overlapping of different standards as ASME and ACI especially in view ofthe imminent development of future nuclear technologies with innovative (and thus costly)containments (See IRIS ESBWR and also ITER) The NISTI report entitled ldquoStructures Division Prediction of Cracking in Reinforced Concrete Structuresrdquo [16] is giving good clarifications in this sense and provides a set of different model which takes into account the different misinterpretations we cited
P a g e | 25
December 7 2006 [ 314J ‐ FINAL PAPER ‐ ] Edoardo Cavalieri drsquoOro
Table 2 Spacing at different elevations and divided by layers for the IP3 PWR Cont [11]
elevation
(m)
hoop meridional diagonal (dmnldmnlcm) primary secondary
layer bar pitch layer bar pitch layer bar pitch layer bar pitch
76 2 18 355 1 18 305 1 18 305 1 18 762
138 2 18 355 1 11 305 1 11 305 1 18 762
153 2 18 355 1 18 305 1 11 915 1 18 762
164 2 18 355 1 11 305 1 11 915 1 18 762
337 2 18 355 1 18 305 1 18 305 1 18 762
451 2 18 355 1 11 305 1 11 305 1 18 1524
Table 3 Mean duration of the combined load acting on the containment (IP3) [11] Load combo Occurrence rate Cumulative occur
[combined occurrencesyear] [ occurrences]
mean duration
[sec]
D+P D+E
D+P+E
216E‐03 864E‐02 164E‐02 656E‐01
136E‐09 546E‐08
1200 15
1481
Table 4 The Indian Point 3 Unit Features of the Containment and of the Plant [11]
LOADS
D=dead load=150 lbsft3= 2226586 kgm3
P=accidental pressure=(ms)=N(0288 0034) E=earthquake loads T=accidental temperature corresponding to P
GEOMETRY MATERIAL
R+L=H m Concrete REACTOR FEATURES
R= 20574 m Ec=21373 GPa Reactor type PWR
H= 667512 m vc=02 24 MI N of New York City NY
L= 461772 m frsquoc=frsquoc(ms)=N(3375 432) [MPa] Docket Number 05000286 Operating License Issued ‐ 04051976 Expires ‐
Ss= 10668 m frsquocmin=2068 MPa 12152015
Sc=13716 m Reinforced bars Operator Entergy Nuclear Operations Inc
Es= 200 GPa Electrical Output 979 MWe
vs=02 Reactor VendorType Westinghouse Four‐Loop fy=fy(ms)=lognormal(495 3571) Containment Type Dry Ambient Pressure
P a g e | 26
December 7 2006 [ 314J ‐ FINAL PAPER ‐ ] Edoardo Cavalieri drsquoOro
Table 5 Final Results of the IP3 Calculation for Safety Margins of a Concrete Containment GEOMETRY INPUT STRUCTURAL CALCULATIONS
t=Sc 1371 m
R 206 m
d 0057 m
de 0165 m
PL 0165 m
PH 02 m
X ‐06855 m
Xs 05205 m
L 461772 m
R+L=H 667512 m
Ss 10668 m
εLcmax 669286E‐05
Wp=Wmax 0004671207
W
εhcmax 0000226758
εbL(z)
εbLmax(z=0) 0
σLcmax 243100313
σHcmax 5277691233
σLspreS 1053239714
σHspreS 1365012879
Pa
Pa
Pa
Pa
LOADS AN CAP mean [MPa]
MATERIAL INPUT nominal
distribution γ 125
Paγ 1421888416
D 218205428
F 1365012879
T 1279699574
L=tot 4284806298
φ 09
C=φfy 4455
SM 8509685116
dmnl
MPa
MPa
MPa
MPa
MPa
dmnl
MPa
MPa
Es 2E+11 Pa
Ec 2137E+10 Pa
Pi 450000 Pa
vc=vs 02 dmnl
frsquoc=frsquoc(ms) 33750000 Pa
fy=fy(ms) 495000000 Pa
fuc Pa
OTHER QUANTITIES nominal distribution
σr ‐275000 Pa
As 00025518 m2
Xls 00225605 dmnl
D 6644E+09 Pam3
Xhs 00372248 dmnl
NL 3605000 Pam
EL 2176E+10 Pa
Eh 2143E+10 Pa
E 2627E+10 Pa
α 1875E+09 Pa
γ 51250367
β 0241911
VOLUMES mean [ m^3]
Volume (free) 6140658409
Vcil 8456642372
Vsbar 0117833069
bars 484
Vs=Vsbar bars 11406
Vc=Vcil‐Vs 8342579961
m^3
m^3
m^3
dmnl
m^3
m^3
COSTS mean value
Unit Cost concrete 2685646061
Unit Cost steel 25
ρs (steel density) 7850
Unit Costs 0000318471
Tot Costc=VcUcc 2240521701
Tot Costs=VsUcs 2851560264
Tot Cost= Cs+Cc)tot 2873965481
$m^3
$kg
kgm^3
$m^3
Million $
Million $
Million $
OPTIMIZATION ON COSTS
max F max P max L‐S given fc fy
Total invest costs 2 Billion $
Cost fraction 1437
P a g e | 27
December 7 2006 [ 314J ‐ FINAL PAPER ‐ ] Edoardo Cavalieri drsquoOro
6 References
[1] ABWR CostScheduleCOL Project at TVAs Bellefonte Site August 2005 Tennessee Valley Authority New
Nuclear Power Plant Licensing Demonstration Project DE‐AI07‐04ID14620 Prepared by Toshiba
Corporation GE Company USEC Bechtel Power Corporation Global Nuclear Fuel ndashUS August 2005 [2] Ellingwood Bruce et al RrdquoNuclear Power Plant Containment Pressure Boundary Aging Research (D8‐
A1‐US) ORNLCP‐l02338rdquo Department of Civil Engineering at the Johns Hopkins University Baltimore MD 21218‐2682 (USA) May 1999
[3] NUREG‐0800 (Formerly NUREG‐75087) US Nuclear Regulatory Commission ‐Standard Review Plan‐ Office of Nuclear Reactor Regulation Section 381 Concrete Containment draft review 2 April 1996
[4] NUREG‐0800 US Nuclear Regulatory Commission ‐Standard Review Plan‐ Office Of Nuclear Reactor
Regulation Section 382 Steel Containment draft review 2 April 1996[5] NUREG‐0800 US Nuclear Regulatory Commission ‐Standard Review Plan‐ Office of Nuclear Reactor
Regulation Section 383 Concrete and Steel Internal Structures of Steel or Concrete Containments draftreview 2 April 1996
[6] NRC Information Notice 2004‐09 Corrosion of Steel Containment and Containment Liner Office ofNuclear Reactor Regulation Washington DC 20555‐000‐ April 27 2004
[7] NUREG‐1150 Volume 1 Reactor Risk Reference Document MIT Nuclear Eng Dept Internal Copy 1996[8] DC Williams JJ Gregory SR Tieszen JL TillisrdquoContainment Loads Scoping Calculations for Severe
Nuclear Reactor Accidentsrdquo Sandia Report SAND92‐2774 UC‐940 NPRW‐SA90‐5 Unlimited Release
Printed February 2003[9] Shinozuka MH Hwang and M Reich ldquoReliability assessment of reinforced concrete containment
structuresrdquo Nucle Eng amp Des 80 (1984) pp 247‐267[10] Kawakami H Hwang MTChang and M Reich ldquoReliability assessment of Indian point unit 3 containment
structuresrdquo BNL‐NUREGCR‐3641 January 1984[11] Power Authority of the state of New York ldquoIndian Point NPP unit 3 final safety analysis reportrdquo Docket
250286 1994[12] Mirela Gavrilas ldquoA framework for Integrating Risk and Safety Marginsrdquo RESDSARPNRCA August
2006[13] Wen YK ldquoMethods for reliability in structures under multiple time varying loadsrdquo Nucl Eng ampDes 60[14] John D Stevenson ldquoCompanion Guide Book A guide to the ASME CODE Code for Concrete Reactor
vessels and Containmentsrdquo Edited by KR Rao and published in 2006 [15] Levin Howard Alan ldquoPrestressed concrete containments for nuclear power plantsrdquo Institute Archives ndash
Non‐circulating Collection 3 MS Thesis 1976 [16] Nicholas J and Carino ldquoStructures Division Prediction of Cracking in Reinforced Concrete Structuresrdquo
NISTI report 5634 Gaithersburg MD 20899 April 1995[17] Crystall Ball a risk analysis simulation and optimization Software distributed from Decision
Engineering Ver 72 August 2006
P a g e | 28
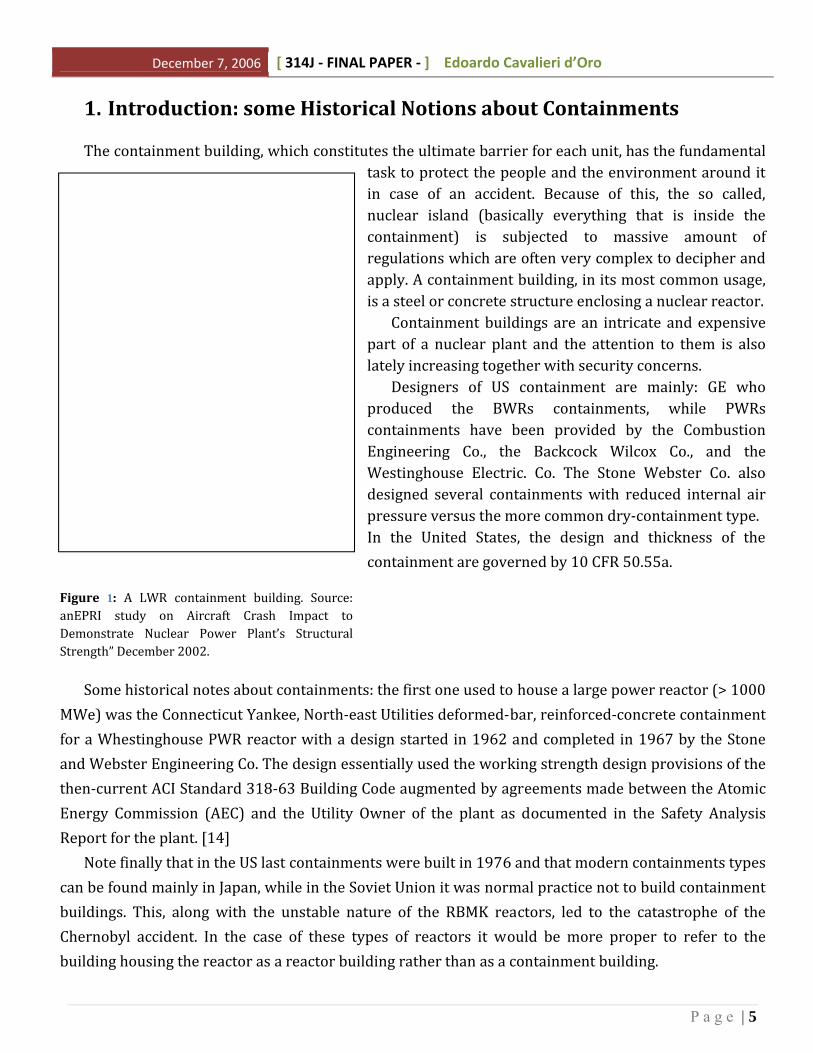
December 7 2006 [ 314J ‐ FINAL PAPER ‐ ] Edoardo Cavalieri drsquoOro
2 LWR Containment Types and Characteristics
Pressurized water reactor (PWR) containments typically consist of heavily steel‐reinforced concrete cylinders ranging in thickness from 1 meter to 13 meters capped by a hemispherical dome of steel‐reinforced concrete The cylinder is typically 40 meter high with a 40‐meter diameter Reinforcementbars that form a cage within the concrete are typically Grade 60 18 steel bars on 30 to 40 centimeters centers A 18 rebar is 56 centimeters in diameter ndash about the size of a manrsquos forearm Pressurizedwater reactors constitute about two‐thirds of the 104 reactors operating in the United States
Boiling water reactor (BWR) containments typically consist of a steel containment vesselsurrounded by a reinforced concrete shield that typically has a thickness of four feet or greater and is housed within the reactor building The primary containment of a BWR is typically one‐third thediameter of PWR containment
Figure 2 Different typesconfigurations of containment building as they are in the US
PWR common designs are categorized as either large‐dry sub‐atmospheric or ice‐condenser
For BWRs the containment and missile shield fit close to the reactor vessel The reactor building wall forms a secondary containment during refueling operations The containment designs are referred to by the names Mark I (oldest drywelltorus) Mark II and Mark III (newest) All three types house a large body of water used to quench steam released from the reactor system during transients
Different properties and features of these containment types are reported in detail in Table 1
P a g e | 6
[ 314J ‐ FINAL PAPER ‐ ] Edoardo Cavalieri drsquoOro December 7 2006
Table 1 Main containment features and characteristics of the US fleet divided by design type (Pressure Water reactors and Boiling Water Reactors)
Characteristics of the US Containments (109 units)
BWR Containment DesignTypes PWR Containment DesignTypes (5)
Mark I Mark II Mark III Sub‐atmospheric Ice Condenser Large‐Dry
Number of Units 24 8 4 7 9 57
Pressure Suppression Yes Yes Yes No Yes No
Number of Barriers 2 2 3 3 3 3
Volume (103m3) 12 15 48 52‐70 36‐ 40 46‐100
Heat Capacity billion of BTU 17 13 13 ‐ ‐ ‐
Design Pressure MPa 0528 048 020 041 030 042‐052
LOCA Pressure MPa 04 04 016 ‐ ‐ 034
Reactor thermal power (MWth) 1593 ‐ 3293 3293 ‐ 3323 2894 ‐ 3833 2441 ‐3411 3411 1500 ‐ 3800
Containment free volume (ft3) drywell wetwell
200000 ‐ 320000 110000‐ 180000 90000 ‐ 140000
200000‐310000 140000 ‐ 190000 340000 ‐ 500000
1440000‐ 1800000 250000 ‐ 280000
1165000‐ 1550000 1800000 1200000 2600000
Containment free volume (103m3) 1586 2563 4943 5493 3662 7934
Cont volume to thermal power ratio (m3MWth) 753‐364 451‐456 1252‐1659 2052‐2130 1114 2632‐3067
Containment strength Containment design pressure (MPa) Median containment failure press (MPa) in IPE
049‐053 078 ‐ 141
041‐048 107‐ 142
02 049‐075
041‐052 093‐100
018‐031 035‐076
038‐052 072‐141
Containment construction 22 steel
2 concrete 1 steel
7 concrete 2 steel
2 concrete 7 concrete
‐7 steel
2 concrete 7 steel
50 concrete
Vapor pressure suppression system Vent header with
vertical bents DWWW vacuum breakers
Vertical vents DWWW vacuum
breakers
Horizontal vents and SPMU(1) DWWW vacuum breakers(2)
No Ice condenser and recirculation fans
No
Containment heat removal system (3) RHR(1) system in SPC(1)
or DWS(1) mode RHR system in SPC or DWS mode
RHR system in SPC or DWS mode(4)
Containment spray(6) and fan coolers
Containment spray(6) and fan coolers
Containment spray(6) fan coolers
Combustion gas control Inerted by N2 Inerted by N2 Igniter System Hydrogen recombiner (for
design‐basis) Hydrogen igniters
Hydrogen recombiner (for design‐basis)
Containment venting for pressure control Hardened vent pipe requested by CPI(1)
Hardened vent pipe not requested byCPI
Hardened vent pipe not requested by CPI
‐ ‐ ‐
Allowable Leak Rate (volume day) 05 05 04 01 025 01
Capability Pressure (MPa)
‐091 (7) 107 052 103 045 092
(1) RHR Residual Heat Removal SPC ‐ Suppression Pool Cooling DWS ‐ Drywell (or Containment Spray System SPMU ‐ Suppression Pool (2) River Bend does not have an SPMU systems or DWWW vacuum breakers (3) There is also a fax cooler system for CHR during normal plant operation It is not a safety system and is usually not credited in the PRA (4) River Bend does not have a containment spray system but has two safety‐related containment unit coolers (5) From NUREG‐1560 November 1996 (6) Recirculation spray taking suction from the containment sump (7) CPWGutilized the capability pressure predicted for Browns Ferry
P a g e | 7
December 7 2006 [ 314J ‐ FINAL PAPER ‐ ] Edoardo Cavalieri drsquoOro
3 Specific and Useful Notions about Containments
31 Containment Functions
The primary function of the containment building is to contain radioactivity in case of an accidentfrom public and to maintain the internal pressure without leaking in case a major accident occurs
bull Public Protection ‐ Retention of radioactivity ‐ Retention of missiles (internal missiles)
But beside those there are further implicationsfunctions of primary importance which have to deal with the protection of the plant itself and we reported as
bull Protection of Plant Systems ‐ Natural elements (flood storms hurricanes t‐ Human actions (crashes and explosions)
ornados and wind)
‐ Fires‐ Missiles and planes (external missiles)
Finally consider that at the containment are anchored many of the systems it contains so it has tosupport their weight and other permanent load such as dead loads
bull Structural Support of Systems‐ Routine‐ Seismic or other dynamic effects ‐ Internal loads during accidents
Note that from an economic point of view assess all these functions all together is impossible and that is most of the efforts about containment is to reduce costs by means of opportune optimization techniques find the right tradeoffs among all of the functionalities we reported above Also consider that as being the last barrier of the plant design conditions should be very complex to figure and takeinto account even more of the functionalities introduced (or we think about new reactor designs using
sodium as coolant or with higher pressure operating and accident conditions as the S‐CO2 FGR at MIT)
P a g e | 8
December 7 2006 [ 314J ‐ FINAL PAPER ‐ ] Edoardo Cavalieri drsquoOro
32 Current Regulations
In this Section we want to give a flavor of the exceptional and sometimes atypical amount ofobligations designers have to follow in the case of concrete containment buildings Among the manyregulations guidelines and codes the guiding one is the NUREG‐0800 ldquoStandard Review Plan for theReview of Safety Analysis Reports for Nuclear Power Plantsrdquo[3] Tregulatory guides for decades but today as a new regulatory framewor k
his constituted the referenceis expected to review and add
new features and constrictions to the containment design because of the list of factors reported below
1 US nuclear power plants have an average age of 40 years and some initially undersigned agemechanisms are showing up all around the US nuclear fleet typically for our purposes here aging ofconcrete
2 As a consequence of that many plants faced and are facing re‐licensing which exposes them tomore restrictive inspect
3 New designs asionsFast Gas Reactors are expected to render the environment within the
containment more aggressive and hostile (higgher values of the main thermodynamic variables such as
the pressure at which they operate or higher radients of temperature are classical examples) or othersas IRIS pose new challenging specifications and functions to the traditional containment design
Thus in the last years the Nuclear regulation Commissionrsquos (NRC) staff was currently evaluatingcertain regulatory guides for adequacy for use in new reactor licensing and a preview of the new outcoming rules regarding containment buildings (specifically SRP sections 381 382 and 383) willprescribe new mandatory prescriptions on concrete and steel containments In addition to this the NRCRegulatory Guides ‐ Power Reactors (Division 1) also explicitly addresses In‐service Inspection ofUngrouted Tendons in Prestressed Concrete Containments (Regulatory Guide RG 135 and 1351)Containment Isolation Provisions for Fluid Systems (RG 1141) and Performance‐Based ContainmentLeak‐Test Program (RG 1163) to which descends the RG 1136 regulates Construction and Testing ofConcrete Containments Containment System Leakage Testing Requirements addresses a regulatoryposition which addresses new containment system leakage testing necessities Ultimately the ReactorLicense Renewal process gives further regulations for the future installations of plants in the unitedstates Reactor License Renewal Guidance Documents NUREG‐1611Aging Management of NuclearPower Plant Containments for License Renewal gives evidence of needing in terms of in‐serviceinspection requirements (as promulgated in 10 CFR 555a for license renewal)
Containment construction criteria which include design loads load combinations and acceptablebehavior applicable to concrete nuclear containments developed originally as a unique combination ofmechanical and civil structural engineering procedures They are composed of procedures consideredin design and analysis of boiler and pressure vessel components developed by the ASME Boiler andPressure Vessel Code Committee and those procedures used in design of conventional concrete buildingstructures as developed by the American Concrete Institute (ACI) 318 Code Committee This situationnaturally follows from an understanding that such containments perform a dual function (1) to be a
P a g e | 9
December 7 2006 [ 314J ‐ FINAL PAPER ‐ ] Edoardo Cavalieri drsquoOro
building structure used to house and to protect from design‐basis hazards nuclear safety‐relatedstructures mechanical and electrical components and distribution systems associated with a reactor coolant system and (2) to serve a primary function as an engineered safeguard to contain the postulatedradiological consequences of a loss‐of‐coolant accident in the nuclear steam supply system
In addition to the pure regulatory framework imposed by the NRC we also found a historical contraposition of the rules that of the ASME imposed to all boiling and vessel systems and the specifications given by the ACI in case the containment is going to be built with concrete
33 Containment Load Factored Loads
The load to which the containment should be exposed to constitutes a major source of uncertainty and it reflects the various functionalities presented in the previous section Problems here are
determining the different loads and types of loads and theircombination concurring to the ldquoworst possible scenariordquo Moreover also note that all the uncertainties coming from the PRA I and PRA II analyses involving the deepest barriers of the plant sort of cumulate in containmentanalysis and also sum up with the uncertainties naturally arising from the definition of a proper environmentalmodel of dispersion after this ultimate barrier failsFurthermore also the evolution of these loads within theaccident time constitutes a major concern especially regarding new under design technologies such as the S‐CO2FGR here at MIT where the design of the containment willbe crucial because of the different amount of heat (due tothe different fuel and coolant) and of the different heat
Another inmechanismstransport teresting aspect we have to consider is that the
distributions of loads could be both of dynamic and staticnature but in the particular example we are going toconsider the Indian Point 3 plant are not computed tokeep calculation easier
Figure 3 Load combinations for IP3 [10]
In order to incorporate the earthquake ground acceleration load which has a dynamic nature we should use the model proposed by Wen [13] to combine them as shown in figure 3 (Table 3 offer an idea of the final output that is usually provided by these models) Because of all the possible sources of uncertainties already mentioned ASME and ACI codes reduce them by factorizing loads into differentwell specified load factors and also as in Section III of the BampPV ASME Code factorize loads and takeinto account the standard deviation and mean values of the concrete properties It is thus obvious that a probabilistic framework would fit fine in this context and later section will go further explaining it
P a g e | 10
December 7 2006 [ 314J ‐ FINAL PAPER ‐ ] Edoardo Cavalieri drsquoOro
34 Containment Capacity and Accident Evolution
The capacity of a given structure is subjected both to vary over time and to uncertainties around itsvalue at a defined instant time To address uncertainties o structural strength of the containment we here provide a list of related meaningful considerations
1) The retaining of the CG (presence of leaks ruptures) and the size of the leak or penetration (whichdetermines a depressurization rate and also a possible release of contaminated material)
2) The chemical reactions between steel and oxygen concrete and CO2 or other minor reactions capable to affect in the few hours of the accident the strength of the concrete walls or liner
3) Temperature on the wall of the CG (ASME code provides different margins depending on T)4) The stratification of the gas mixture or other mechanisms that can reduce locally the strength of the
concrete or of the liner surface
In the model we are using in these paper as shown in next section a normal distribution will take 1into account of possible uncertainties in its mean value The capacity provided in figure 4 as the upper
curve is always thought as a constant line but actually over the reactorrsquos lifetime it would not be appropriate to consider it as a constant In reality by recalling the factors listed above a concurrent series of mechanisms are going to modifyaffect its initial design value and consequently its value over time
1 Corrosions or any other Aging Mechanisms 2 Chemical reactions with CO2 (carbonation of the concrete)3 Fragility curve of the steel (ASME code for the temperat4 Penetration due to impact with internal or external missiles
ure effects)
5 Water release within the containment
The discussion provide her is actually given for completeness but actually none of these mechanisms will be analyzed in the present analysis But the hope is that as emphasized in theprevious section the reader will be aware that new regulations (by new we mean the last 15 years or so) are trying to consistently address material degradation mechanisms and that a complete analysisas recent papers in the field are showing will include the effects of uncertainties as time change
Now we need to connect the concept of load to the concept of capacity The load is the evolution of pressure (which is varying in a more stringent time that is the time of the evolution of a possibleaccident) Figure 4 provides a possible example of pressure load history during different scenarios of evolution of the accident and leading to different reliability end states The capacity (expected failurepressure) is the demarcation zone for scenarios ending in a failure state Note that from this figure could be better explained trough the set of observations that follow
1 The Capacity is given primarily by the external pre‐stressed concrete barrierrsquos strength so in this case itrsquos deducible from the mechanical properties
of a single component and this because the internal steel liner plays a marginal role in supporting the structure
P a g e | 11
December 7 2006 [ 314J ‐ FINAL PAPER ‐ ] Edoardo Cavalieri drsquoOro
The black line shown in figure 4 represents the pressure evolution during an accident The accidentcan follow different paths or scenarios Until the peak the accident can be thought as the DBA orclassical LOCA where the energy and amount of inventory reversed from primary trough containmentare essentially determining it The peak pressure is used to determine the design basis accidentpressure by increasing it of a factor that usually ranges from 10 to 252 The bifurcation point is in thisillustrator example the last point in which to achieve or not the desired mitigation trough ie the ECCSsystem If we donrsquot have the expected mitigation the pressure evolves following the path of a severescenario with meltdown where the pressure is going to pass the boundaries imposed by the designpressure and then ultimately ends in a failure state of the containment this is the region we are goingto refer The region between the red and the brown line constitute the safety margins in terms ofpressure for the reactor building Passing
g the red line means going below the required margins for
safety and passing the brown one means oing through a failure mode of the containment This secondupper boundary is also known as capability of the system and we are going to refer to it later on in thiswork when the phase of conceptualization of a calculation will require that Finally note that the graphpresented below refers to pressure and not to stresses A proper safety margin representation will be ina stress‐time space and would take into account not just pressure but as we anticipated in the previousSection also other factors piling up with it such as temperature dynamic loads
Figure 4 Pressure histories in the containment after a large LOCA leading to reactor meltdown
2 Containment design pressures typically have been defined as 10-25 above maximum pressure Initial design of containment typically used a 40 margin for containment barriers and 20 for interior structures that did not serve a barrier function These margins were reduced to half these values when all the geometry of the interior compartments are known as part of the final design An even lower margin can be used if rigorous modeling and dynamic load effects are considered
P a g e | 12
December 7 2006 [ 314J ‐ FINAL PAPER ‐ ] Edoardo Cavalieri drsquoOro
35 Safety Margins in a Probabilistic Context
The safety margin nomenclature does not find an official definition in the literature Despite its wideuse in the last decades we are not able to provide a definition that is common to all the different actors that should play a consistent within the current nuclear industry and regulation Thus we are going toprovide a definition with which is connected intimately with the definition of ldquoadequate safety marginsrdquo stated by [11] with which we agree and that is in line with the scopes of the present workNote that the definition I provide below descends and applies to a single event sequence The event sequence can be a DBA design‐basis accident or a sequence from an event tree ET
In general the Safety Margin SM has been devised to deal with uncertainty But different types ofuncertainties exist and their quantification is also different and challenging too aleatory uncertainties that are uncertainties attributable to quantities that are inherently random or stochastic and the epistemic ones attributable to lack of knowledge The trivial part of uncertainties quantifications ismostly given by the second category the epistemic uncertainties the advantage in dealing with them is the fact that they can be reduced with the acquisition of new data on the other hand they are hard tomanage because they may reflect limited lack of knowledge as well as complete ignorance or by using the definition of M Gavrilas the ldquounknown‐unknownsrdquo [12]
The more general definition of safety margin was cast for structural‐mechanics analyses recognizing the fact that both load L and strength S are distributed parameters Figure 5 shows probability densities for load and capacity which shape the bases for the more general definition of safety margin
+infin +infin
( gt P ) = ⎢⎡
( f L d )⎥⎤
( ) P P ( ) L f C dCL C int int L C
minusinfin ⎣ P ⎦
Figure 5 Capacity and load distributions within the containment and SM def
The quantity safety margin SM describes the reliability of a barrier or system in light of load‐strength or load‐capacity considerations It is computed from the following equation
P a g e | 13
December 7 2006 [ 314J ‐ FINAL PAPER ‐ ] Edoardo Cavalieri drsquoOro
C - L (11)SM = σC
2 +σ2L
where C is the mean capacity or containment strength L is the mean load σc is the capacity standarddeviation and σ is the load standard deviation3 Thus the safety margin results to be an indirectL
measure of the overlap in the probability density functions and can be used to estimate the probabilitythat the load does exceed the capacity (ie the probability of failure)
+infin +infin ⎡ ⎤( gt ⎢ L ( ) L f C dP L C ) = int int ( f L d )⎥ C ( ) C (12)
minusinfin ⎣ C ⎦
4Under the strength‐stress model (see Fig 5) for failure mode i the reliability is defined as the probability that the strength C is greater than the stress L The strength and stress are in generalsense Any resistance such as a yield strength allowable force or allowable deflection can be
5considered as strength and any loading‐type quantity such as a bending stress external force ordeflection can be considered as a stress
For normally distributed C L the probability of failure (ie 1‐reliability) can be expressed as a function of safety margin (Equation 11) alone This is one reason why safety margin emerged as thesole proxy for reliability in many applications The other reason is that the design goal (in the nuclear industry especially in the related field of the pressure vessel construction as presented here) is to build components and systems that have negligible failure probabilities This can be attained by having sufficient safety margin (ie a large separation between mean capacity and load relative to theircombined standard deviations) This solidified the generalization that having adequate safety margin is asufficient condition for high reliability Thus a highly reliable system (ie one in which the probability offailure is negligible) shows no overlap between the probability densities of capacity and load On theother hand refer to figure 5 a non reliable system shows a configuration of the system that ibecause it shows a common area for the capacity of the system and the load at the accident
s defective
With the definitions provided in the last two Sections we can now define the Capacity and Load condition in the case of the specific example of the Indian Point 3 unit for which data ( in terms ofdistributions) are available Before doing that please note once again that the capacity as reported in figures 4 and 5 is drown as a brown straight line but that in reality the strength of the concrete andsteel are subjected to several degradation mechanism (as reported in the list given in the previous Section) not reported here and for which we assume to be all negligible over the lifetime of the reactor
3 The ratio in Eq 11 means that for a given distance between C an L can be reduced if L or C present big uncertainties This is a measure of the probability for the two curves to overlap in presence of flat distribution curves and its aim is different from the (C-L)C ratio that we are going to use later which is typically showing the variation of the margin with regard of the original C (mean) value Note the two formulations can be both used and they are consistent with each other
4 Note that failure mode for containment are not addressed in this paper so we refer to the general definition of a potential crack which is going to reach adefined size which in turn allow the gas to be released in the environment This definition in its generality includes the loss of almost all the functionalities of the containment as presented in Section 31
5 Or combinations of loads as it will be the case of the factored load that we have to deal with in the example provided in this paper
P a g e | 14
December 7 2006 [ 314J ‐ FINAL PAPER ‐ ] Edoardo Cavalieri drsquoOro
36 Capital Expenditures for the Containment Building
We conclude this preliminary section about the containment by providing a range of possibleestimation of a large dry atmospheric containment We will recall later on these numbers in Section 4when it will be required to evaluate a less ldquosafe marginedrdquo solution in terms of economical benefits
The containment building is usually costing between 8 to 12 of the total initial expenditure in construction and it is particularly sensible to delay in construction
Cost of containments varies widely by design (PWR vs BWR) and location of the plant A BWR typically has more concrete and rebar due to wetwell drywell configuration The location is importantbecause of the seismic zone As an example the ABWR that the Shaw Group is building in Taiwan theground force acceleration is very large and as a result the amount of concreterebar is very high There is also a variation in techniques or philosophies adopted worldwide some France plants like theldquoBrennilisrdquo are regardless of costs completely pre‐stressed including the base‐mat while an US plantlike ldquoGinnardquo is partially pre‐stressed axially and just in the cylinder
Also the labor rates will impact in addition to material costs For instance in the Northeast US labor rates are much more than in the Gulf Coast This will vary worldwide also and likely depend
3greatly on labor productivity QA Cat 1 concrete runs about $120yd these days[1] I can take that acomplete new nuclear plant holds 100000 m3 of concrete and roughly 50 goes to the containmentThe labor is hard to predict so it will be excluded from present economic evaluations
Anyway if we select todayrsquos cost and suppose a containment to be costing around 20 Million man‐hours for units (which is reasonable and deducible from past average construction times) done several years ago By discounting the obtainable value by about 25 and then applying perhaps 25 to the containment we could also be able to do a rough estimation of the labor force required too Howeverthe concrete rebar and labor dont make the whole containment Most containment in fact have liners and most have a lot of embeddedattached equipment that should bring total costs closer to 15 of the total initial capital expenditure (so something around 30 million dollar for the containment of a 2
About the liner consider that ang to be our maximum value in the calculations) billion dollar LWRrsquos plant is goi
ll US containments have one In the US is part of normal practice tobuilt it because of it provides a leak‐tight membrane whose integrity is obviously important to preserve Beside this main scope it is anchored to the concrete shell with systems ofangels or grid of studs which serve to limit large scale deflections and in turn limit strains
channels and
We conclude giving the assumptions we are going to use Imagining not to consider labor costs 3specific costs for concrete are 270 $m [1]and for the steel used for the bars a price estimate for steel
3equal to 25 $kg (consider that steel has a density of 7850 kgm )
P a g e | 15
December 7 2006 [ 314J ‐ FINAL PAPER ‐ ] Edoardo Cavalieri drsquoOro
4 Calculations and Results
41 Preliminary Calculations from the IP3 PWR
This Section constitutes the core in computational terms of the present paper and its aim is toevaluate the safety margins of a concrete‐steel reinforced containment The objective is to answer or at least provide a solid basis to answer the question if it is possible to double the pressure of a LWRrsquos containment and maintaining appropriate margins as well The evaluation of the safety margins of any building implies the knowledge of the capacity (or maximum strength or capacity = C) of the structure
and the load (or maximum stress or load = L) to which the structure is exposed to The safety marginscan be roughly determined by the difference of the two mean values of the strength and load our focus here is first to provide an estimate of the safety margins under initial proper load conditions which will be then doubled in a second moment The different load conditions are deduced by elaborating some results available from studies conducted on a selected reference plant (Indian Point unit 3) which had been chosen for both its representativeness and the availability of studies related to it [9][11]
411 Plantrsquos Description and Basic Assumptions
The initial geometry of the problem is defined by Figure 6 which sketches the containment of theIndian Point while figure 7 and 8 are showing the configuration of the bars immersed in the concretewe are going to refer to Table 4 summarizes the characteristic of the Indian Point unit 3 plant
We here report the material properties and geometry of the IP3 plant as extracted from the various pertinent sources available
Material Properties
The material properties intrinsically involve epistemic and aleatory uncertainties Hence an appropriate probabilistic model should for instance consider the material strengths as random variables while Youngrsquos modulus and Poisson ratio as deterministic ones The properties of theconcrete and reinforcements are summarized as follows as referred to the Indian Point unit 3rsquoscontainment
A Concrete the concrete has a minimum compressive strength frsquoc (or design minimum ultimatestrength) equal to 3000 psi (2068 MPa) and which we should assume is normally distributed and
statistical data of available tests provides a microσ= 4896 627 in psi (3437 432 MPa) [10] [11] Youngrsquos modulus and Poisson Ratio are equal to Ec=31 MPsi (21373 GPa) and 02 which is equal to the bar
P a g e | 16
December 7 2006 [ 314J ‐ FINAL PAPER ‐ ] Edoardo Cavalieri drsquoOro
value while bars have a Es=29 MPsi (20 GPa) The statistic used for the steel bar yielding strength are obtained by considering the predominant reinforcement as constituted by 18 bars as clearly shown byTable 2 Thus from same data fy result to be normally distributed with microσ= 718 518 in Ksi (495 357MPa) Note that the Ec value of the concrete has been varied between the 30 and 100 in order toevaluate different behaviors of the concrete with cracks
B Steel Liner the plate steel liner is carbon steel conforming with ASTM designation A442‐65 grade 60 This steel has a minimum yield strength of 32000 psi ( σymin= 220MPa) and minimum tensilestrength of 60000 psi ( σtmin= 413 MPa) with an elongation of 22 in an 8‐inch gauge length of failure
Geometry
Figure 7 shows the IP3 containment analyzed
Figure 6 Containment with spherical shell on the top of the PWR type as for the Indian Point 3 unit
Main dimensions are
R+L=H m R= 20574 m H= 667512 m L= 461772 m Ss= 10668 m Sc=13716 m
P a g e | 17
December 7 2006 [ 314J ‐ FINAL PAPER ‐ ] Edoardo Cavalieri drsquoOro
Containment Capabilit
Containment capability is given from the probabilistic safety study of Indian Point Plant in theappendix 441 [11] It is an essential element of risk evaluation for degraded core events because itdefines the realistic lower bound ultimate containment building capability for withstanding internalpressure loads This had been determined to be 0972 MPa (or 141 psia) for IP3 based on a failurecriterion defined as the state of having reached general yield in the reinforced walls At that pressurethe strains start to significantly increase and radial deflections of the containment wall may becomeunacceptably large This value is consistent with the average value for capability we provided in Table1 so it confirms that the IP3 is a good representative example of large dry containment building Thecapability was defined as the maximum combination of temperature and pressure to produce a generalyield state
Load factors
Load factors used in IP3 safety report were calculated by following the ACI 318‐63 load factors inthe design primarily provide for a safety margin on the load assumptions Specific combinations used inthe design are presented below The design included the consideration of both primary and secondarystresses The load capacity (the capacity in the old way
yto define it) was based on the ultimate strength
values presented in part IV B of ACI‐318 as reduced b a capacity factor φ = 09 for flexure and 085 fordiagonal tension bond and anchorage For the liner steel it is equal to 095 for tension while forcompression is maintained below 095 yield
The loads used to determine the required limiting capacity of any structural element on thecontainment structures are
(1) L=D+‐ 005 D +15 P + 10 (T +TL)
where D=dead load of the structure P= pressure associated to the DBA accident as shown in transientcalculations and T = load due to the maximum temperature gradient trough the concrete shell upontemperatures associated with 15 P while TL= load exerted by the liner based on 15P
Three other loads were defined by inserting also other possible contributions such asearthquakes winds and tornado We here report just the first condition which mean that thecontainment has the capacity to withstand loadings at least 50 greater than those calculated for theLOCA alone6
The loads we are going to consider are the DEAD LOAD the ACCIDENTAL PRESSURE andTEMPERATURE and the PRESTRESSING LOAD
6 All the structural components are designed to have a capacity required by the most several loads combination The loads resulting from the use of these
equations will hereafter be termed ldquoLoad Factorsrdquo
P a g e | 18
December 7 2006 [ 314J ‐ FINAL PAPER ‐ ] Edoardo Cavalieri drsquoOro
Results of the SM analysis conducted on the IP units 2 and 3
Containment can withstand a pressure of 0972 MPa which is 27 times the DBA pressure (032MPa) and this without impairing the functional capability of the containment This analysis at that timewas conducted manually at different levels of the structure and in correspondence of critical regions like membrane region of the dome and cylinder base‐mat liner or close to large penetrations The critical region was to be found in the cylinder just above the base‐mat (first elevation in Table 2) in a zone where the seismic reinforcing steel is reduced
The 27 factor found corresponds to the conservatism applied in the original design as summarized below
1 Application of load factors2 Application of capacity reduction factors3 Strength of liner not accounted for4 Minimum strength of the material accounted for 5 Seismic rebar resi6 Designer conservatism
sting LOCA loads
So all of these considerations concur to prove that the actual capability is higher than 0972 MPa Notefinally that the role of the concrete cracking on shell stiffness is also incorporated into the calculations as required
412 Calculations and Analyses
The present analysis is conducted only on the main cylindrical wall and steel liner and upper dome are not considered so any analysis of the dome over the cylinder is provided here
A welded steel liner with a minimum thickness of one‐quarter inch it is attached to the inside faceof the concrete shell The load carrying capacity of the liner is usually disregarded from calculationsbecause this is not functional to the scope of the liner which is to ensure a high degree of leak tightness
Note that the surface of the containment is imagined without penetrations personnel locks and equipment hatches
The containment wall is reinforced with hoop meridian and diagonal rebar The typical rebar arrangement we refer to for the cylindrical wall is shown in Figure 8 The hoop and meridional rebars are divided into two groups and each group is placed close to the wall surface We consider that the tendons move in the longitudinal direction the same as the concrete So the rigidity is calculated on thebasis that plane sections remain plane and that transverse Poissons ratio of the bars can be treatedthe same as the concrete The details of the rebar arrangements for the cylindrical portion of the IP3containment are shown by Table 2 [11] The sense of this table is to observe that rebar is changing atdifferent elevations (note that a proper calculation would inspect the various elevations by means of a
P a g e | 19
December 7 2006 [ 314J ‐ FINAL PAPER ‐ ] Edoardo Cavalieri drsquoOro
traditional finite element mash but also the safety report did not conducted it at that time) An average value among all the elevations has been used to perform our calculations Among the differentelevations and point in space we selected the region near the base mat We considered the cylinder tbe built‐in at the position it joins the base mat (zero radial deflection zero slope of radial deflection)
o
About pre‐stressing conditions we assume there is no bending of the shell in the unpressurizedcondition and that pre‐stressing is going to be achieved by ldquopost‐tensioningrdquo
Finally we assumed elastic behavior and we define flexural rigidity on the basis of the section ofmaterial shown in Fig 8
Figure 7 Rebar arrangement for Cylindrical Wall Figure 8 Section of the reinforcing steel array for IP3
Evaluate the impact of changing the capacity of the bars in the longitudinal tendon on the required pre‐stress level to prevent tensile in the concrete upon pressurization and verify that the obtainedvalues stay beyond the prescribed margins requires calculating the required pre‐stress level of thegeneric containment shell
First we compute some constants that will be used and then perform an analysis of the single piece of concrete based on the thin shell theory as cited in L54 notes of the 314J class Beside the different values assigned to the material and some differences in the design the calculation proposed herewhich is qualitative but provides the order of magnitude we deal with iand not deterministic Assumptions of the analysis are reported at t h
n safety analysis is probabilistic the present Section e end of
In order to compute calculation and uncertainties propagations we made use of the Crystall Ball [17] software which allows using as an input the different load distributions composing the factoredload formula and easily provides as an output the probability of failure of the structure or in other words the margins we are interested to The software in use was also useful to optimize the results as a function of costs and to perform Monte Carlo sampling of crucial parameters such as Ec
P a g e | 20
December 7 2006 [ 314J ‐ FINAL PAPER ‐ ] Edoardo Cavalieri drsquoOro
Remember the intent is to verify the margins under accident conditions so we will refer mainly toregulations directly imposing specifics and affecting the margins in question mainly NUREG‐0800 and Section CC‐3540 of ACI‐359 applies specifically to the pre‐stressed containment designs however all manner of ASME III and ACI codes apply Also Code of Federal Regulations 10CFR 5055a applies and inaccordance with ASME Section XI Subsections IWE and IWL The minimum value usually is reported tobe equal to 2 (see NUREG‐800) in our calculations conservatively we are going to assume it in thrange that goes to 2 to 3 (IP3 has a 27 [11] value of applicable margins see eq 18 in the next Section)
e
Calculation 1 Safety Margins of the IP3 plant with our Model
The safety margins of the structure as reported in figure 6 from the shell theory and thus referred to figure 7 and 8 is computed as follow
||
1 1 25
1 85
2
(13)(14)(15)
(16)(17)(18)
90
So accordi t tions the load factor ldquoLrdquo of Eq 1defined from t Pa and increased of
he γ value
o our assumphe accident sequence pressure
esis conservatively
Eqbecause here we donrsquot know a
b
ng
i
t4 or the design pressure is mainly he margin we previously described the details of the load) settled equal
he concrete with the thin shell theory Fthe structure and its
Hereto 1
( lltgn pressure in
and D are then obtained by assuming nties are overshadowed
effect on the limit state probabilities
t
25 The d 13 is obtained analyzithat the dead l
tngoad is mainly the weight of
y the large variability introduced b the other two so it has a mihus its value is going to e deterministic and equal to 150 lbsft
a ran as een treate as a Gaussian with mean
iuncerta y nor 3b
t
The accidental is indeedvalue of 47 psi = 032 MPa and s
The capacity ldquoCrdquo is in contrast decreased to taand uncertainties regarding
dom variable and h b d
pressure d dev of 502 Psi (00346 MPa) according to the data o
ke into account possible imperfectiending moment acting on the structure and here corresponds to a
t to be equal to of th
f ref [11]ons of the material
he btresidual factor=90 Note
ihat the value we choose for frsquoy is se
strength of the mater al as imposed to be for average tensile stresses for bounded reinforcing steel In addition to this we have to avoid that the concrete faces creep deformations and
impose a limit on the pre‐stress F Eq 17 as given from the ACI‐359nto the tensions within the shell of reference
50 ieldt e y
hus we t
iThus constriction imposed on the material translates
MAX(σHspreS =(1‐Xhs)XhsσHcmax microσLspreS = (1‐Xls)XlsσLcmax)lt085fc (19)
P a g e | 21
December 7 2006 [ 314J ‐ FINAL PAPER ‐ ] Edoardo Cavalieri drsquoOro
Equation 18 provides ultimately the safety margins in a deterministic formulation while the probabilistic one assuming that both Load and Capacity are normally distributed as was given in Eq11 is at the moment not considered Because the system of the equation identified revealed to be linear the formulation of Eq 12 can be used and thus the margins we found are going to be expressedin terms of their relative initial capacity (see also footnote 3 at page 13)
SM = (C‐L)C (110)
Note that as stated before we expect the absolute value (C‐L) to be equal to 2 at least (see NUREG‐800) but our calculation initially find evidence of bigger margins because we donrsquot consider abnormalload conditions (see Table 5 where SM=805) By varying the coefficient γ in equation 15 (Table 5makes use of a typical 125 factor which is used for DBA Accidents)in typical ranges are used to express abnormal load conditions (to value of 2 and 3) we can take into account of other possible load combing into the final load factor such as wind or earthquakes
So the calculation we settled takes into account all this limits and optimize the parameters we identified as crucial which are the Area of the steel bar=As the thickness of the shell=Sc=t the Young Modulus =Ec for the concrete which should be subject to cracking [16] the Pressure (by means of γ)within the containment and the Volume Vc which is actually based on the pressure itself (See figure 9)
7The software is calculating the safety margins following the criteria already defined and if the margins are not respected the area of the steel in the structure is increased or Ec increased in such a way to fitthe constraints given by the problem and optimize costs
Figure 9 Free volume and equilibrium pressure LOCA
7Note there are a set of different criteria we can establish and use to set up our limits or boundaries to the system which are related to the different performances desired from the structure (here we referred to strength and thus to measures of performance based on the yielding stress because a mere structural criteria was adopted but there are other performances we should be interested to such as serviceability stability plasticity and vibrations)
P a g e | 22
December 7 2006 [ 314J ‐ FINAL PAPER ‐ ] Edoardo Cavalieri drsquoOro
A final clarification about the way we determined costs assuming there is no change of technology or construction methods corresponding to thickness variations of the concrete and of the area of thesteel bars used to pretension costs are simply calculable by multiplying the corresponding volumes ofmaterial in use for their costs for kg
(111)
( )
Results provided by Table 5 gives an overall cost that correspond to 147 of the initialinvestment cost we hypothesized to be for a PWR of this type (1000 MWe) around 2 billion $
112
Calculation 2 Sensitivities to Material and Geometry
After the calculation of the SM we run a couple of sensitivity analysis to verify some properties ofthe material such as the Young Modulus for the concrete Ec and to verify cost variations as a function of the parameter As
As is responsible of both the strength of the shell element and also of the weight of steel costs over the concrete ones The results are reported in the tables below as a function of costs and cost variation in percentage but this time with regard of the initial value given by ldquoCalculation 1rdquo By varying As above
2its mean value of 000255 m we obtained a maximum 1‐LC equal to 1139 for an As equal to2002707 m corresponding to a overall cost increase equal to 1656 above the base case
SM var and Cost var
000
200
400
600
800
1000
1200
SM
Cost 000 473 903 1295
Fig 10 SM as it varies with cost (capital cost as var )
P a g e | 23
December 7 2006 [ 314J ‐ FINAL PAPER ‐ ] Edoardo Cavalieri drsquoOro
Third calculation we computed is a sensitivity analysis on the parameter Ec or Elastic modulus of the concrete to see how the results are varying depending on the possible initial degradation of thematerial such as small cracks or imperfections [16] Results are reported below
SM var and Es var 02‐1
000
500
1000
1500
2000
SM
Es 1 09 08 07 06 05 04
Fig 11 SM as it varies with the young Modulus of concrete (crack effect)
Final note on other calculations of interest
Also a preliminary calculation has not been included in the tables but we cite it here as an interesting one which is reformulating the same exercise in the case we use a stainless steel containment instead of a concrete pre‐stressed one Calculations are pretty straightforward here and from the basic thin shell theory predict a 40 increase of the thickness Formulas which are reportedin the tables have been used as a reference to validate and compare the results of the calculations performed for the concrete case Evidently the steel containment is more expensive and not able toaccount all the functionalities of the concrete one But if we were going to consider it we should clearlytake into account the strength variation of the material at different temperatures (things about the restrictions given from ASME codes to the 16Cr‐12Ni‐2Mo Plate SA‐240 type 316 of which IP3rsquos liner is made of) thus forcing to take into incorporate temperature loads into the margins on the capacity side (which could be a good example of one of the mechanism we referred into Section 34 where the upper boundary of the system is varying with time in other words C=C(t) )
P a g e | 24
December 7 2006 [ 314J ‐ FINAL PAPER ‐ ] Edoardo Cavalieri drsquoOro
42 Comments and Final Remarks
In this paper an overall methodology to calculate the SM for a pre‐stressed concrete containment was given By referring to a specific plant with has been particularly studied by the literature the basisto compute probabilistic calculations of the safety margins were provided The analyses tries to put emphasis a wide discussion that has been both in class and during the writing of the paper withdifferent Professor of the departments of Civil and Nuclear Engineering here at MIT regarding thecurrent methodology to address safety margins The basic conclusions I would like to concentrate on here are even if not always clearly and explicitly addressed or still to be accomplished in possible futureworks are summarized the below
The current methodology used to address safety margins can be interpreted in respect of the following sentence that appears at the end of the safety report of the Surryrsquos containment ldquoFor Surrythere were no intersections of the load distributions with the containment strength distribution and thus the DHC issue for Surry can be resolved on containments loads alonerdquo
So current containments are adequately safe and as partially but quantitatively presented in thispaper is opinion of the author that thanks to developed state of the art of probabilistic criteria thecurrent regulation that looks obsolete and redundant in many parts could be replaced with appropriate ad hoc SM evaluations
Future part of the work should consider all the basic factors composing load factors and runs thesame optimization used here along all the possible beyond DBA scenarios (we here in fact just selected one and we limited the factors in the load factor formula to 3) comprehending all the loads involved inthe factorized formula of the L
A clearer framework would help to feel the gap that the hyper conservativism intrinsic to theregulation and caused by the overlapping of different standards as ASME and ACI especially in view ofthe imminent development of future nuclear technologies with innovative (and thus costly)containments (See IRIS ESBWR and also ITER) The NISTI report entitled ldquoStructures Division Prediction of Cracking in Reinforced Concrete Structuresrdquo [16] is giving good clarifications in this sense and provides a set of different model which takes into account the different misinterpretations we cited
P a g e | 25
December 7 2006 [ 314J ‐ FINAL PAPER ‐ ] Edoardo Cavalieri drsquoOro
Table 2 Spacing at different elevations and divided by layers for the IP3 PWR Cont [11]
elevation
(m)
hoop meridional diagonal (dmnldmnlcm) primary secondary
layer bar pitch layer bar pitch layer bar pitch layer bar pitch
76 2 18 355 1 18 305 1 18 305 1 18 762
138 2 18 355 1 11 305 1 11 305 1 18 762
153 2 18 355 1 18 305 1 11 915 1 18 762
164 2 18 355 1 11 305 1 11 915 1 18 762
337 2 18 355 1 18 305 1 18 305 1 18 762
451 2 18 355 1 11 305 1 11 305 1 18 1524
Table 3 Mean duration of the combined load acting on the containment (IP3) [11] Load combo Occurrence rate Cumulative occur
[combined occurrencesyear] [ occurrences]
mean duration
[sec]
D+P D+E
D+P+E
216E‐03 864E‐02 164E‐02 656E‐01
136E‐09 546E‐08
1200 15
1481
Table 4 The Indian Point 3 Unit Features of the Containment and of the Plant [11]
LOADS
D=dead load=150 lbsft3= 2226586 kgm3
P=accidental pressure=(ms)=N(0288 0034) E=earthquake loads T=accidental temperature corresponding to P
GEOMETRY MATERIAL
R+L=H m Concrete REACTOR FEATURES
R= 20574 m Ec=21373 GPa Reactor type PWR
H= 667512 m vc=02 24 MI N of New York City NY
L= 461772 m frsquoc=frsquoc(ms)=N(3375 432) [MPa] Docket Number 05000286 Operating License Issued ‐ 04051976 Expires ‐
Ss= 10668 m frsquocmin=2068 MPa 12152015
Sc=13716 m Reinforced bars Operator Entergy Nuclear Operations Inc
Es= 200 GPa Electrical Output 979 MWe
vs=02 Reactor VendorType Westinghouse Four‐Loop fy=fy(ms)=lognormal(495 3571) Containment Type Dry Ambient Pressure
P a g e | 26
December 7 2006 [ 314J ‐ FINAL PAPER ‐ ] Edoardo Cavalieri drsquoOro
Table 5 Final Results of the IP3 Calculation for Safety Margins of a Concrete Containment GEOMETRY INPUT STRUCTURAL CALCULATIONS
t=Sc 1371 m
R 206 m
d 0057 m
de 0165 m
PL 0165 m
PH 02 m
X ‐06855 m
Xs 05205 m
L 461772 m
R+L=H 667512 m
Ss 10668 m
εLcmax 669286E‐05
Wp=Wmax 0004671207
W
εhcmax 0000226758
εbL(z)
εbLmax(z=0) 0
σLcmax 243100313
σHcmax 5277691233
σLspreS 1053239714
σHspreS 1365012879
Pa
Pa
Pa
Pa
LOADS AN CAP mean [MPa]
MATERIAL INPUT nominal
distribution γ 125
Paγ 1421888416
D 218205428
F 1365012879
T 1279699574
L=tot 4284806298
φ 09
C=φfy 4455
SM 8509685116
dmnl
MPa
MPa
MPa
MPa
MPa
dmnl
MPa
MPa
Es 2E+11 Pa
Ec 2137E+10 Pa
Pi 450000 Pa
vc=vs 02 dmnl
frsquoc=frsquoc(ms) 33750000 Pa
fy=fy(ms) 495000000 Pa
fuc Pa
OTHER QUANTITIES nominal distribution
σr ‐275000 Pa
As 00025518 m2
Xls 00225605 dmnl
D 6644E+09 Pam3
Xhs 00372248 dmnl
NL 3605000 Pam
EL 2176E+10 Pa
Eh 2143E+10 Pa
E 2627E+10 Pa
α 1875E+09 Pa
γ 51250367
β 0241911
VOLUMES mean [ m^3]
Volume (free) 6140658409
Vcil 8456642372
Vsbar 0117833069
bars 484
Vs=Vsbar bars 11406
Vc=Vcil‐Vs 8342579961
m^3
m^3
m^3
dmnl
m^3
m^3
COSTS mean value
Unit Cost concrete 2685646061
Unit Cost steel 25
ρs (steel density) 7850
Unit Costs 0000318471
Tot Costc=VcUcc 2240521701
Tot Costs=VsUcs 2851560264
Tot Cost= Cs+Cc)tot 2873965481
$m^3
$kg
kgm^3
$m^3
Million $
Million $
Million $
OPTIMIZATION ON COSTS
max F max P max L‐S given fc fy
Total invest costs 2 Billion $
Cost fraction 1437
P a g e | 27
December 7 2006 [ 314J ‐ FINAL PAPER ‐ ] Edoardo Cavalieri drsquoOro
6 References
[1] ABWR CostScheduleCOL Project at TVAs Bellefonte Site August 2005 Tennessee Valley Authority New
Nuclear Power Plant Licensing Demonstration Project DE‐AI07‐04ID14620 Prepared by Toshiba
Corporation GE Company USEC Bechtel Power Corporation Global Nuclear Fuel ndashUS August 2005 [2] Ellingwood Bruce et al RrdquoNuclear Power Plant Containment Pressure Boundary Aging Research (D8‐
A1‐US) ORNLCP‐l02338rdquo Department of Civil Engineering at the Johns Hopkins University Baltimore MD 21218‐2682 (USA) May 1999
[3] NUREG‐0800 (Formerly NUREG‐75087) US Nuclear Regulatory Commission ‐Standard Review Plan‐ Office of Nuclear Reactor Regulation Section 381 Concrete Containment draft review 2 April 1996
[4] NUREG‐0800 US Nuclear Regulatory Commission ‐Standard Review Plan‐ Office Of Nuclear Reactor
Regulation Section 382 Steel Containment draft review 2 April 1996[5] NUREG‐0800 US Nuclear Regulatory Commission ‐Standard Review Plan‐ Office of Nuclear Reactor
Regulation Section 383 Concrete and Steel Internal Structures of Steel or Concrete Containments draftreview 2 April 1996
[6] NRC Information Notice 2004‐09 Corrosion of Steel Containment and Containment Liner Office ofNuclear Reactor Regulation Washington DC 20555‐000‐ April 27 2004
[7] NUREG‐1150 Volume 1 Reactor Risk Reference Document MIT Nuclear Eng Dept Internal Copy 1996[8] DC Williams JJ Gregory SR Tieszen JL TillisrdquoContainment Loads Scoping Calculations for Severe
Nuclear Reactor Accidentsrdquo Sandia Report SAND92‐2774 UC‐940 NPRW‐SA90‐5 Unlimited Release
Printed February 2003[9] Shinozuka MH Hwang and M Reich ldquoReliability assessment of reinforced concrete containment
structuresrdquo Nucle Eng amp Des 80 (1984) pp 247‐267[10] Kawakami H Hwang MTChang and M Reich ldquoReliability assessment of Indian point unit 3 containment
structuresrdquo BNL‐NUREGCR‐3641 January 1984[11] Power Authority of the state of New York ldquoIndian Point NPP unit 3 final safety analysis reportrdquo Docket
250286 1994[12] Mirela Gavrilas ldquoA framework for Integrating Risk and Safety Marginsrdquo RESDSARPNRCA August
2006[13] Wen YK ldquoMethods for reliability in structures under multiple time varying loadsrdquo Nucl Eng ampDes 60[14] John D Stevenson ldquoCompanion Guide Book A guide to the ASME CODE Code for Concrete Reactor
vessels and Containmentsrdquo Edited by KR Rao and published in 2006 [15] Levin Howard Alan ldquoPrestressed concrete containments for nuclear power plantsrdquo Institute Archives ndash
Non‐circulating Collection 3 MS Thesis 1976 [16] Nicholas J and Carino ldquoStructures Division Prediction of Cracking in Reinforced Concrete Structuresrdquo
NISTI report 5634 Gaithersburg MD 20899 April 1995[17] Crystall Ball a risk analysis simulation and optimization Software distributed from Decision
Engineering Ver 72 August 2006
P a g e | 28

December 7 2006 [ 314J ‐ FINAL PAPER ‐ ] Edoardo Cavalieri drsquoOro
32 Current Regulations
In this Section we want to give a flavor of the exceptional and sometimes atypical amount ofobligations designers have to follow in the case of concrete containment buildings Among the manyregulations guidelines and codes the guiding one is the NUREG‐0800 ldquoStandard Review Plan for theReview of Safety Analysis Reports for Nuclear Power Plantsrdquo[3] Tregulatory guides for decades but today as a new regulatory framewor k
his constituted the referenceis expected to review and add
new features and constrictions to the containment design because of the list of factors reported below
1 US nuclear power plants have an average age of 40 years and some initially undersigned agemechanisms are showing up all around the US nuclear fleet typically for our purposes here aging ofconcrete
2 As a consequence of that many plants faced and are facing re‐licensing which exposes them tomore restrictive inspect
3 New designs asionsFast Gas Reactors are expected to render the environment within the
containment more aggressive and hostile (higgher values of the main thermodynamic variables such as
the pressure at which they operate or higher radients of temperature are classical examples) or othersas IRIS pose new challenging specifications and functions to the traditional containment design
Thus in the last years the Nuclear regulation Commissionrsquos (NRC) staff was currently evaluatingcertain regulatory guides for adequacy for use in new reactor licensing and a preview of the new outcoming rules regarding containment buildings (specifically SRP sections 381 382 and 383) willprescribe new mandatory prescriptions on concrete and steel containments In addition to this the NRCRegulatory Guides ‐ Power Reactors (Division 1) also explicitly addresses In‐service Inspection ofUngrouted Tendons in Prestressed Concrete Containments (Regulatory Guide RG 135 and 1351)Containment Isolation Provisions for Fluid Systems (RG 1141) and Performance‐Based ContainmentLeak‐Test Program (RG 1163) to which descends the RG 1136 regulates Construction and Testing ofConcrete Containments Containment System Leakage Testing Requirements addresses a regulatoryposition which addresses new containment system leakage testing necessities Ultimately the ReactorLicense Renewal process gives further regulations for the future installations of plants in the unitedstates Reactor License Renewal Guidance Documents NUREG‐1611Aging Management of NuclearPower Plant Containments for License Renewal gives evidence of needing in terms of in‐serviceinspection requirements (as promulgated in 10 CFR 555a for license renewal)
Containment construction criteria which include design loads load combinations and acceptablebehavior applicable to concrete nuclear containments developed originally as a unique combination ofmechanical and civil structural engineering procedures They are composed of procedures consideredin design and analysis of boiler and pressure vessel components developed by the ASME Boiler andPressure Vessel Code Committee and those procedures used in design of conventional concrete buildingstructures as developed by the American Concrete Institute (ACI) 318 Code Committee This situationnaturally follows from an understanding that such containments perform a dual function (1) to be a
P a g e | 9
December 7 2006 [ 314J ‐ FINAL PAPER ‐ ] Edoardo Cavalieri drsquoOro
building structure used to house and to protect from design‐basis hazards nuclear safety‐relatedstructures mechanical and electrical components and distribution systems associated with a reactor coolant system and (2) to serve a primary function as an engineered safeguard to contain the postulatedradiological consequences of a loss‐of‐coolant accident in the nuclear steam supply system
In addition to the pure regulatory framework imposed by the NRC we also found a historical contraposition of the rules that of the ASME imposed to all boiling and vessel systems and the specifications given by the ACI in case the containment is going to be built with concrete
33 Containment Load Factored Loads
The load to which the containment should be exposed to constitutes a major source of uncertainty and it reflects the various functionalities presented in the previous section Problems here are
determining the different loads and types of loads and theircombination concurring to the ldquoworst possible scenariordquo Moreover also note that all the uncertainties coming from the PRA I and PRA II analyses involving the deepest barriers of the plant sort of cumulate in containmentanalysis and also sum up with the uncertainties naturally arising from the definition of a proper environmentalmodel of dispersion after this ultimate barrier failsFurthermore also the evolution of these loads within theaccident time constitutes a major concern especially regarding new under design technologies such as the S‐CO2FGR here at MIT where the design of the containment willbe crucial because of the different amount of heat (due tothe different fuel and coolant) and of the different heat
Another inmechanismstransport teresting aspect we have to consider is that the
distributions of loads could be both of dynamic and staticnature but in the particular example we are going toconsider the Indian Point 3 plant are not computed tokeep calculation easier
Figure 3 Load combinations for IP3 [10]
In order to incorporate the earthquake ground acceleration load which has a dynamic nature we should use the model proposed by Wen [13] to combine them as shown in figure 3 (Table 3 offer an idea of the final output that is usually provided by these models) Because of all the possible sources of uncertainties already mentioned ASME and ACI codes reduce them by factorizing loads into differentwell specified load factors and also as in Section III of the BampPV ASME Code factorize loads and takeinto account the standard deviation and mean values of the concrete properties It is thus obvious that a probabilistic framework would fit fine in this context and later section will go further explaining it
P a g e | 10
December 7 2006 [ 314J ‐ FINAL PAPER ‐ ] Edoardo Cavalieri drsquoOro
34 Containment Capacity and Accident Evolution
The capacity of a given structure is subjected both to vary over time and to uncertainties around itsvalue at a defined instant time To address uncertainties o structural strength of the containment we here provide a list of related meaningful considerations
1) The retaining of the CG (presence of leaks ruptures) and the size of the leak or penetration (whichdetermines a depressurization rate and also a possible release of contaminated material)
2) The chemical reactions between steel and oxygen concrete and CO2 or other minor reactions capable to affect in the few hours of the accident the strength of the concrete walls or liner
3) Temperature on the wall of the CG (ASME code provides different margins depending on T)4) The stratification of the gas mixture or other mechanisms that can reduce locally the strength of the
concrete or of the liner surface
In the model we are using in these paper as shown in next section a normal distribution will take 1into account of possible uncertainties in its mean value The capacity provided in figure 4 as the upper
curve is always thought as a constant line but actually over the reactorrsquos lifetime it would not be appropriate to consider it as a constant In reality by recalling the factors listed above a concurrent series of mechanisms are going to modifyaffect its initial design value and consequently its value over time
1 Corrosions or any other Aging Mechanisms 2 Chemical reactions with CO2 (carbonation of the concrete)3 Fragility curve of the steel (ASME code for the temperat4 Penetration due to impact with internal or external missiles
ure effects)
5 Water release within the containment
The discussion provide her is actually given for completeness but actually none of these mechanisms will be analyzed in the present analysis But the hope is that as emphasized in theprevious section the reader will be aware that new regulations (by new we mean the last 15 years or so) are trying to consistently address material degradation mechanisms and that a complete analysisas recent papers in the field are showing will include the effects of uncertainties as time change
Now we need to connect the concept of load to the concept of capacity The load is the evolution of pressure (which is varying in a more stringent time that is the time of the evolution of a possibleaccident) Figure 4 provides a possible example of pressure load history during different scenarios of evolution of the accident and leading to different reliability end states The capacity (expected failurepressure) is the demarcation zone for scenarios ending in a failure state Note that from this figure could be better explained trough the set of observations that follow
1 The Capacity is given primarily by the external pre‐stressed concrete barrierrsquos strength so in this case itrsquos deducible from the mechanical properties
of a single component and this because the internal steel liner plays a marginal role in supporting the structure
P a g e | 11
December 7 2006 [ 314J ‐ FINAL PAPER ‐ ] Edoardo Cavalieri drsquoOro
The black line shown in figure 4 represents the pressure evolution during an accident The accidentcan follow different paths or scenarios Until the peak the accident can be thought as the DBA orclassical LOCA where the energy and amount of inventory reversed from primary trough containmentare essentially determining it The peak pressure is used to determine the design basis accidentpressure by increasing it of a factor that usually ranges from 10 to 252 The bifurcation point is in thisillustrator example the last point in which to achieve or not the desired mitigation trough ie the ECCSsystem If we donrsquot have the expected mitigation the pressure evolves following the path of a severescenario with meltdown where the pressure is going to pass the boundaries imposed by the designpressure and then ultimately ends in a failure state of the containment this is the region we are goingto refer The region between the red and the brown line constitute the safety margins in terms ofpressure for the reactor building Passing
g the red line means going below the required margins for
safety and passing the brown one means oing through a failure mode of the containment This secondupper boundary is also known as capability of the system and we are going to refer to it later on in thiswork when the phase of conceptualization of a calculation will require that Finally note that the graphpresented below refers to pressure and not to stresses A proper safety margin representation will be ina stress‐time space and would take into account not just pressure but as we anticipated in the previousSection also other factors piling up with it such as temperature dynamic loads
Figure 4 Pressure histories in the containment after a large LOCA leading to reactor meltdown
2 Containment design pressures typically have been defined as 10-25 above maximum pressure Initial design of containment typically used a 40 margin for containment barriers and 20 for interior structures that did not serve a barrier function These margins were reduced to half these values when all the geometry of the interior compartments are known as part of the final design An even lower margin can be used if rigorous modeling and dynamic load effects are considered
P a g e | 12
December 7 2006 [ 314J ‐ FINAL PAPER ‐ ] Edoardo Cavalieri drsquoOro
35 Safety Margins in a Probabilistic Context
The safety margin nomenclature does not find an official definition in the literature Despite its wideuse in the last decades we are not able to provide a definition that is common to all the different actors that should play a consistent within the current nuclear industry and regulation Thus we are going toprovide a definition with which is connected intimately with the definition of ldquoadequate safety marginsrdquo stated by [11] with which we agree and that is in line with the scopes of the present workNote that the definition I provide below descends and applies to a single event sequence The event sequence can be a DBA design‐basis accident or a sequence from an event tree ET
In general the Safety Margin SM has been devised to deal with uncertainty But different types ofuncertainties exist and their quantification is also different and challenging too aleatory uncertainties that are uncertainties attributable to quantities that are inherently random or stochastic and the epistemic ones attributable to lack of knowledge The trivial part of uncertainties quantifications ismostly given by the second category the epistemic uncertainties the advantage in dealing with them is the fact that they can be reduced with the acquisition of new data on the other hand they are hard tomanage because they may reflect limited lack of knowledge as well as complete ignorance or by using the definition of M Gavrilas the ldquounknown‐unknownsrdquo [12]
The more general definition of safety margin was cast for structural‐mechanics analyses recognizing the fact that both load L and strength S are distributed parameters Figure 5 shows probability densities for load and capacity which shape the bases for the more general definition of safety margin
+infin +infin
( gt P ) = ⎢⎡
( f L d )⎥⎤
( ) P P ( ) L f C dCL C int int L C
minusinfin ⎣ P ⎦
Figure 5 Capacity and load distributions within the containment and SM def
The quantity safety margin SM describes the reliability of a barrier or system in light of load‐strength or load‐capacity considerations It is computed from the following equation
P a g e | 13
December 7 2006 [ 314J ‐ FINAL PAPER ‐ ] Edoardo Cavalieri drsquoOro
C - L (11)SM = σC
2 +σ2L
where C is the mean capacity or containment strength L is the mean load σc is the capacity standarddeviation and σ is the load standard deviation3 Thus the safety margin results to be an indirectL
measure of the overlap in the probability density functions and can be used to estimate the probabilitythat the load does exceed the capacity (ie the probability of failure)
+infin +infin ⎡ ⎤( gt ⎢ L ( ) L f C dP L C ) = int int ( f L d )⎥ C ( ) C (12)
minusinfin ⎣ C ⎦
4Under the strength‐stress model (see Fig 5) for failure mode i the reliability is defined as the probability that the strength C is greater than the stress L The strength and stress are in generalsense Any resistance such as a yield strength allowable force or allowable deflection can be
5considered as strength and any loading‐type quantity such as a bending stress external force ordeflection can be considered as a stress
For normally distributed C L the probability of failure (ie 1‐reliability) can be expressed as a function of safety margin (Equation 11) alone This is one reason why safety margin emerged as thesole proxy for reliability in many applications The other reason is that the design goal (in the nuclear industry especially in the related field of the pressure vessel construction as presented here) is to build components and systems that have negligible failure probabilities This can be attained by having sufficient safety margin (ie a large separation between mean capacity and load relative to theircombined standard deviations) This solidified the generalization that having adequate safety margin is asufficient condition for high reliability Thus a highly reliable system (ie one in which the probability offailure is negligible) shows no overlap between the probability densities of capacity and load On theother hand refer to figure 5 a non reliable system shows a configuration of the system that ibecause it shows a common area for the capacity of the system and the load at the accident
s defective
With the definitions provided in the last two Sections we can now define the Capacity and Load condition in the case of the specific example of the Indian Point 3 unit for which data ( in terms ofdistributions) are available Before doing that please note once again that the capacity as reported in figures 4 and 5 is drown as a brown straight line but that in reality the strength of the concrete andsteel are subjected to several degradation mechanism (as reported in the list given in the previous Section) not reported here and for which we assume to be all negligible over the lifetime of the reactor
3 The ratio in Eq 11 means that for a given distance between C an L can be reduced if L or C present big uncertainties This is a measure of the probability for the two curves to overlap in presence of flat distribution curves and its aim is different from the (C-L)C ratio that we are going to use later which is typically showing the variation of the margin with regard of the original C (mean) value Note the two formulations can be both used and they are consistent with each other
4 Note that failure mode for containment are not addressed in this paper so we refer to the general definition of a potential crack which is going to reach adefined size which in turn allow the gas to be released in the environment This definition in its generality includes the loss of almost all the functionalities of the containment as presented in Section 31
5 Or combinations of loads as it will be the case of the factored load that we have to deal with in the example provided in this paper
P a g e | 14
December 7 2006 [ 314J ‐ FINAL PAPER ‐ ] Edoardo Cavalieri drsquoOro
36 Capital Expenditures for the Containment Building
We conclude this preliminary section about the containment by providing a range of possibleestimation of a large dry atmospheric containment We will recall later on these numbers in Section 4when it will be required to evaluate a less ldquosafe marginedrdquo solution in terms of economical benefits
The containment building is usually costing between 8 to 12 of the total initial expenditure in construction and it is particularly sensible to delay in construction
Cost of containments varies widely by design (PWR vs BWR) and location of the plant A BWR typically has more concrete and rebar due to wetwell drywell configuration The location is importantbecause of the seismic zone As an example the ABWR that the Shaw Group is building in Taiwan theground force acceleration is very large and as a result the amount of concreterebar is very high There is also a variation in techniques or philosophies adopted worldwide some France plants like theldquoBrennilisrdquo are regardless of costs completely pre‐stressed including the base‐mat while an US plantlike ldquoGinnardquo is partially pre‐stressed axially and just in the cylinder
Also the labor rates will impact in addition to material costs For instance in the Northeast US labor rates are much more than in the Gulf Coast This will vary worldwide also and likely depend
3greatly on labor productivity QA Cat 1 concrete runs about $120yd these days[1] I can take that acomplete new nuclear plant holds 100000 m3 of concrete and roughly 50 goes to the containmentThe labor is hard to predict so it will be excluded from present economic evaluations
Anyway if we select todayrsquos cost and suppose a containment to be costing around 20 Million man‐hours for units (which is reasonable and deducible from past average construction times) done several years ago By discounting the obtainable value by about 25 and then applying perhaps 25 to the containment we could also be able to do a rough estimation of the labor force required too Howeverthe concrete rebar and labor dont make the whole containment Most containment in fact have liners and most have a lot of embeddedattached equipment that should bring total costs closer to 15 of the total initial capital expenditure (so something around 30 million dollar for the containment of a 2
About the liner consider that ang to be our maximum value in the calculations) billion dollar LWRrsquos plant is goi
ll US containments have one In the US is part of normal practice tobuilt it because of it provides a leak‐tight membrane whose integrity is obviously important to preserve Beside this main scope it is anchored to the concrete shell with systems ofangels or grid of studs which serve to limit large scale deflections and in turn limit strains
channels and
We conclude giving the assumptions we are going to use Imagining not to consider labor costs 3specific costs for concrete are 270 $m [1]and for the steel used for the bars a price estimate for steel
3equal to 25 $kg (consider that steel has a density of 7850 kgm )
P a g e | 15
December 7 2006 [ 314J ‐ FINAL PAPER ‐ ] Edoardo Cavalieri drsquoOro
4 Calculations and Results
41 Preliminary Calculations from the IP3 PWR
This Section constitutes the core in computational terms of the present paper and its aim is toevaluate the safety margins of a concrete‐steel reinforced containment The objective is to answer or at least provide a solid basis to answer the question if it is possible to double the pressure of a LWRrsquos containment and maintaining appropriate margins as well The evaluation of the safety margins of any building implies the knowledge of the capacity (or maximum strength or capacity = C) of the structure
and the load (or maximum stress or load = L) to which the structure is exposed to The safety marginscan be roughly determined by the difference of the two mean values of the strength and load our focus here is first to provide an estimate of the safety margins under initial proper load conditions which will be then doubled in a second moment The different load conditions are deduced by elaborating some results available from studies conducted on a selected reference plant (Indian Point unit 3) which had been chosen for both its representativeness and the availability of studies related to it [9][11]
411 Plantrsquos Description and Basic Assumptions
The initial geometry of the problem is defined by Figure 6 which sketches the containment of theIndian Point while figure 7 and 8 are showing the configuration of the bars immersed in the concretewe are going to refer to Table 4 summarizes the characteristic of the Indian Point unit 3 plant
We here report the material properties and geometry of the IP3 plant as extracted from the various pertinent sources available
Material Properties
The material properties intrinsically involve epistemic and aleatory uncertainties Hence an appropriate probabilistic model should for instance consider the material strengths as random variables while Youngrsquos modulus and Poisson ratio as deterministic ones The properties of theconcrete and reinforcements are summarized as follows as referred to the Indian Point unit 3rsquoscontainment
A Concrete the concrete has a minimum compressive strength frsquoc (or design minimum ultimatestrength) equal to 3000 psi (2068 MPa) and which we should assume is normally distributed and
statistical data of available tests provides a microσ= 4896 627 in psi (3437 432 MPa) [10] [11] Youngrsquos modulus and Poisson Ratio are equal to Ec=31 MPsi (21373 GPa) and 02 which is equal to the bar
P a g e | 16
December 7 2006 [ 314J ‐ FINAL PAPER ‐ ] Edoardo Cavalieri drsquoOro
value while bars have a Es=29 MPsi (20 GPa) The statistic used for the steel bar yielding strength are obtained by considering the predominant reinforcement as constituted by 18 bars as clearly shown byTable 2 Thus from same data fy result to be normally distributed with microσ= 718 518 in Ksi (495 357MPa) Note that the Ec value of the concrete has been varied between the 30 and 100 in order toevaluate different behaviors of the concrete with cracks
B Steel Liner the plate steel liner is carbon steel conforming with ASTM designation A442‐65 grade 60 This steel has a minimum yield strength of 32000 psi ( σymin= 220MPa) and minimum tensilestrength of 60000 psi ( σtmin= 413 MPa) with an elongation of 22 in an 8‐inch gauge length of failure
Geometry
Figure 7 shows the IP3 containment analyzed
Figure 6 Containment with spherical shell on the top of the PWR type as for the Indian Point 3 unit
Main dimensions are
R+L=H m R= 20574 m H= 667512 m L= 461772 m Ss= 10668 m Sc=13716 m
P a g e | 17
December 7 2006 [ 314J ‐ FINAL PAPER ‐ ] Edoardo Cavalieri drsquoOro
Containment Capabilit
Containment capability is given from the probabilistic safety study of Indian Point Plant in theappendix 441 [11] It is an essential element of risk evaluation for degraded core events because itdefines the realistic lower bound ultimate containment building capability for withstanding internalpressure loads This had been determined to be 0972 MPa (or 141 psia) for IP3 based on a failurecriterion defined as the state of having reached general yield in the reinforced walls At that pressurethe strains start to significantly increase and radial deflections of the containment wall may becomeunacceptably large This value is consistent with the average value for capability we provided in Table1 so it confirms that the IP3 is a good representative example of large dry containment building Thecapability was defined as the maximum combination of temperature and pressure to produce a generalyield state
Load factors
Load factors used in IP3 safety report were calculated by following the ACI 318‐63 load factors inthe design primarily provide for a safety margin on the load assumptions Specific combinations used inthe design are presented below The design included the consideration of both primary and secondarystresses The load capacity (the capacity in the old way
yto define it) was based on the ultimate strength
values presented in part IV B of ACI‐318 as reduced b a capacity factor φ = 09 for flexure and 085 fordiagonal tension bond and anchorage For the liner steel it is equal to 095 for tension while forcompression is maintained below 095 yield
The loads used to determine the required limiting capacity of any structural element on thecontainment structures are
(1) L=D+‐ 005 D +15 P + 10 (T +TL)
where D=dead load of the structure P= pressure associated to the DBA accident as shown in transientcalculations and T = load due to the maximum temperature gradient trough the concrete shell upontemperatures associated with 15 P while TL= load exerted by the liner based on 15P
Three other loads were defined by inserting also other possible contributions such asearthquakes winds and tornado We here report just the first condition which mean that thecontainment has the capacity to withstand loadings at least 50 greater than those calculated for theLOCA alone6
The loads we are going to consider are the DEAD LOAD the ACCIDENTAL PRESSURE andTEMPERATURE and the PRESTRESSING LOAD
6 All the structural components are designed to have a capacity required by the most several loads combination The loads resulting from the use of these
equations will hereafter be termed ldquoLoad Factorsrdquo
P a g e | 18
December 7 2006 [ 314J ‐ FINAL PAPER ‐ ] Edoardo Cavalieri drsquoOro
Results of the SM analysis conducted on the IP units 2 and 3
Containment can withstand a pressure of 0972 MPa which is 27 times the DBA pressure (032MPa) and this without impairing the functional capability of the containment This analysis at that timewas conducted manually at different levels of the structure and in correspondence of critical regions like membrane region of the dome and cylinder base‐mat liner or close to large penetrations The critical region was to be found in the cylinder just above the base‐mat (first elevation in Table 2) in a zone where the seismic reinforcing steel is reduced
The 27 factor found corresponds to the conservatism applied in the original design as summarized below
1 Application of load factors2 Application of capacity reduction factors3 Strength of liner not accounted for4 Minimum strength of the material accounted for 5 Seismic rebar resi6 Designer conservatism
sting LOCA loads
So all of these considerations concur to prove that the actual capability is higher than 0972 MPa Notefinally that the role of the concrete cracking on shell stiffness is also incorporated into the calculations as required
412 Calculations and Analyses
The present analysis is conducted only on the main cylindrical wall and steel liner and upper dome are not considered so any analysis of the dome over the cylinder is provided here
A welded steel liner with a minimum thickness of one‐quarter inch it is attached to the inside faceof the concrete shell The load carrying capacity of the liner is usually disregarded from calculationsbecause this is not functional to the scope of the liner which is to ensure a high degree of leak tightness
Note that the surface of the containment is imagined without penetrations personnel locks and equipment hatches
The containment wall is reinforced with hoop meridian and diagonal rebar The typical rebar arrangement we refer to for the cylindrical wall is shown in Figure 8 The hoop and meridional rebars are divided into two groups and each group is placed close to the wall surface We consider that the tendons move in the longitudinal direction the same as the concrete So the rigidity is calculated on thebasis that plane sections remain plane and that transverse Poissons ratio of the bars can be treatedthe same as the concrete The details of the rebar arrangements for the cylindrical portion of the IP3containment are shown by Table 2 [11] The sense of this table is to observe that rebar is changing atdifferent elevations (note that a proper calculation would inspect the various elevations by means of a
P a g e | 19
December 7 2006 [ 314J ‐ FINAL PAPER ‐ ] Edoardo Cavalieri drsquoOro
traditional finite element mash but also the safety report did not conducted it at that time) An average value among all the elevations has been used to perform our calculations Among the differentelevations and point in space we selected the region near the base mat We considered the cylinder tbe built‐in at the position it joins the base mat (zero radial deflection zero slope of radial deflection)
o
About pre‐stressing conditions we assume there is no bending of the shell in the unpressurizedcondition and that pre‐stressing is going to be achieved by ldquopost‐tensioningrdquo
Finally we assumed elastic behavior and we define flexural rigidity on the basis of the section ofmaterial shown in Fig 8
Figure 7 Rebar arrangement for Cylindrical Wall Figure 8 Section of the reinforcing steel array for IP3
Evaluate the impact of changing the capacity of the bars in the longitudinal tendon on the required pre‐stress level to prevent tensile in the concrete upon pressurization and verify that the obtainedvalues stay beyond the prescribed margins requires calculating the required pre‐stress level of thegeneric containment shell
First we compute some constants that will be used and then perform an analysis of the single piece of concrete based on the thin shell theory as cited in L54 notes of the 314J class Beside the different values assigned to the material and some differences in the design the calculation proposed herewhich is qualitative but provides the order of magnitude we deal with iand not deterministic Assumptions of the analysis are reported at t h
n safety analysis is probabilistic the present Section e end of
In order to compute calculation and uncertainties propagations we made use of the Crystall Ball [17] software which allows using as an input the different load distributions composing the factoredload formula and easily provides as an output the probability of failure of the structure or in other words the margins we are interested to The software in use was also useful to optimize the results as a function of costs and to perform Monte Carlo sampling of crucial parameters such as Ec
P a g e | 20
December 7 2006 [ 314J ‐ FINAL PAPER ‐ ] Edoardo Cavalieri drsquoOro
Remember the intent is to verify the margins under accident conditions so we will refer mainly toregulations directly imposing specifics and affecting the margins in question mainly NUREG‐0800 and Section CC‐3540 of ACI‐359 applies specifically to the pre‐stressed containment designs however all manner of ASME III and ACI codes apply Also Code of Federal Regulations 10CFR 5055a applies and inaccordance with ASME Section XI Subsections IWE and IWL The minimum value usually is reported tobe equal to 2 (see NUREG‐800) in our calculations conservatively we are going to assume it in thrange that goes to 2 to 3 (IP3 has a 27 [11] value of applicable margins see eq 18 in the next Section)
e
Calculation 1 Safety Margins of the IP3 plant with our Model
The safety margins of the structure as reported in figure 6 from the shell theory and thus referred to figure 7 and 8 is computed as follow
||
1 1 25
1 85
2
(13)(14)(15)
(16)(17)(18)
90
So accordi t tions the load factor ldquoLrdquo of Eq 1defined from t Pa and increased of
he γ value
o our assumphe accident sequence pressure
esis conservatively
Eqbecause here we donrsquot know a
b
ng
i
t4 or the design pressure is mainly he margin we previously described the details of the load) settled equal
he concrete with the thin shell theory Fthe structure and its
Hereto 1
( lltgn pressure in
and D are then obtained by assuming nties are overshadowed
effect on the limit state probabilities
t
25 The d 13 is obtained analyzithat the dead l
tngoad is mainly the weight of
y the large variability introduced b the other two so it has a mihus its value is going to e deterministic and equal to 150 lbsft
a ran as een treate as a Gaussian with mean
iuncerta y nor 3b
t
The accidental is indeedvalue of 47 psi = 032 MPa and s
The capacity ldquoCrdquo is in contrast decreased to taand uncertainties regarding
dom variable and h b d
pressure d dev of 502 Psi (00346 MPa) according to the data o
ke into account possible imperfectiending moment acting on the structure and here corresponds to a
t to be equal to of th
f ref [11]ons of the material
he btresidual factor=90 Note
ihat the value we choose for frsquoy is se
strength of the mater al as imposed to be for average tensile stresses for bounded reinforcing steel In addition to this we have to avoid that the concrete faces creep deformations and
impose a limit on the pre‐stress F Eq 17 as given from the ACI‐359nto the tensions within the shell of reference
50 ieldt e y
hus we t
iThus constriction imposed on the material translates
MAX(σHspreS =(1‐Xhs)XhsσHcmax microσLspreS = (1‐Xls)XlsσLcmax)lt085fc (19)
P a g e | 21
December 7 2006 [ 314J ‐ FINAL PAPER ‐ ] Edoardo Cavalieri drsquoOro
Equation 18 provides ultimately the safety margins in a deterministic formulation while the probabilistic one assuming that both Load and Capacity are normally distributed as was given in Eq11 is at the moment not considered Because the system of the equation identified revealed to be linear the formulation of Eq 12 can be used and thus the margins we found are going to be expressedin terms of their relative initial capacity (see also footnote 3 at page 13)
SM = (C‐L)C (110)
Note that as stated before we expect the absolute value (C‐L) to be equal to 2 at least (see NUREG‐800) but our calculation initially find evidence of bigger margins because we donrsquot consider abnormalload conditions (see Table 5 where SM=805) By varying the coefficient γ in equation 15 (Table 5makes use of a typical 125 factor which is used for DBA Accidents)in typical ranges are used to express abnormal load conditions (to value of 2 and 3) we can take into account of other possible load combing into the final load factor such as wind or earthquakes
So the calculation we settled takes into account all this limits and optimize the parameters we identified as crucial which are the Area of the steel bar=As the thickness of the shell=Sc=t the Young Modulus =Ec for the concrete which should be subject to cracking [16] the Pressure (by means of γ)within the containment and the Volume Vc which is actually based on the pressure itself (See figure 9)
7The software is calculating the safety margins following the criteria already defined and if the margins are not respected the area of the steel in the structure is increased or Ec increased in such a way to fitthe constraints given by the problem and optimize costs
Figure 9 Free volume and equilibrium pressure LOCA
7Note there are a set of different criteria we can establish and use to set up our limits or boundaries to the system which are related to the different performances desired from the structure (here we referred to strength and thus to measures of performance based on the yielding stress because a mere structural criteria was adopted but there are other performances we should be interested to such as serviceability stability plasticity and vibrations)
P a g e | 22
December 7 2006 [ 314J ‐ FINAL PAPER ‐ ] Edoardo Cavalieri drsquoOro
A final clarification about the way we determined costs assuming there is no change of technology or construction methods corresponding to thickness variations of the concrete and of the area of thesteel bars used to pretension costs are simply calculable by multiplying the corresponding volumes ofmaterial in use for their costs for kg
(111)
( )
Results provided by Table 5 gives an overall cost that correspond to 147 of the initialinvestment cost we hypothesized to be for a PWR of this type (1000 MWe) around 2 billion $
112
Calculation 2 Sensitivities to Material and Geometry
After the calculation of the SM we run a couple of sensitivity analysis to verify some properties ofthe material such as the Young Modulus for the concrete Ec and to verify cost variations as a function of the parameter As
As is responsible of both the strength of the shell element and also of the weight of steel costs over the concrete ones The results are reported in the tables below as a function of costs and cost variation in percentage but this time with regard of the initial value given by ldquoCalculation 1rdquo By varying As above
2its mean value of 000255 m we obtained a maximum 1‐LC equal to 1139 for an As equal to2002707 m corresponding to a overall cost increase equal to 1656 above the base case
SM var and Cost var
000
200
400
600
800
1000
1200
SM
Cost 000 473 903 1295
Fig 10 SM as it varies with cost (capital cost as var )
P a g e | 23
December 7 2006 [ 314J ‐ FINAL PAPER ‐ ] Edoardo Cavalieri drsquoOro
Third calculation we computed is a sensitivity analysis on the parameter Ec or Elastic modulus of the concrete to see how the results are varying depending on the possible initial degradation of thematerial such as small cracks or imperfections [16] Results are reported below
SM var and Es var 02‐1
000
500
1000
1500
2000
SM
Es 1 09 08 07 06 05 04
Fig 11 SM as it varies with the young Modulus of concrete (crack effect)
Final note on other calculations of interest
Also a preliminary calculation has not been included in the tables but we cite it here as an interesting one which is reformulating the same exercise in the case we use a stainless steel containment instead of a concrete pre‐stressed one Calculations are pretty straightforward here and from the basic thin shell theory predict a 40 increase of the thickness Formulas which are reportedin the tables have been used as a reference to validate and compare the results of the calculations performed for the concrete case Evidently the steel containment is more expensive and not able toaccount all the functionalities of the concrete one But if we were going to consider it we should clearlytake into account the strength variation of the material at different temperatures (things about the restrictions given from ASME codes to the 16Cr‐12Ni‐2Mo Plate SA‐240 type 316 of which IP3rsquos liner is made of) thus forcing to take into incorporate temperature loads into the margins on the capacity side (which could be a good example of one of the mechanism we referred into Section 34 where the upper boundary of the system is varying with time in other words C=C(t) )
P a g e | 24
December 7 2006 [ 314J ‐ FINAL PAPER ‐ ] Edoardo Cavalieri drsquoOro
42 Comments and Final Remarks
In this paper an overall methodology to calculate the SM for a pre‐stressed concrete containment was given By referring to a specific plant with has been particularly studied by the literature the basisto compute probabilistic calculations of the safety margins were provided The analyses tries to put emphasis a wide discussion that has been both in class and during the writing of the paper withdifferent Professor of the departments of Civil and Nuclear Engineering here at MIT regarding thecurrent methodology to address safety margins The basic conclusions I would like to concentrate on here are even if not always clearly and explicitly addressed or still to be accomplished in possible futureworks are summarized the below
The current methodology used to address safety margins can be interpreted in respect of the following sentence that appears at the end of the safety report of the Surryrsquos containment ldquoFor Surrythere were no intersections of the load distributions with the containment strength distribution and thus the DHC issue for Surry can be resolved on containments loads alonerdquo
So current containments are adequately safe and as partially but quantitatively presented in thispaper is opinion of the author that thanks to developed state of the art of probabilistic criteria thecurrent regulation that looks obsolete and redundant in many parts could be replaced with appropriate ad hoc SM evaluations
Future part of the work should consider all the basic factors composing load factors and runs thesame optimization used here along all the possible beyond DBA scenarios (we here in fact just selected one and we limited the factors in the load factor formula to 3) comprehending all the loads involved inthe factorized formula of the L
A clearer framework would help to feel the gap that the hyper conservativism intrinsic to theregulation and caused by the overlapping of different standards as ASME and ACI especially in view ofthe imminent development of future nuclear technologies with innovative (and thus costly)containments (See IRIS ESBWR and also ITER) The NISTI report entitled ldquoStructures Division Prediction of Cracking in Reinforced Concrete Structuresrdquo [16] is giving good clarifications in this sense and provides a set of different model which takes into account the different misinterpretations we cited
P a g e | 25
December 7 2006 [ 314J ‐ FINAL PAPER ‐ ] Edoardo Cavalieri drsquoOro
Table 2 Spacing at different elevations and divided by layers for the IP3 PWR Cont [11]
elevation
(m)
hoop meridional diagonal (dmnldmnlcm) primary secondary
layer bar pitch layer bar pitch layer bar pitch layer bar pitch
76 2 18 355 1 18 305 1 18 305 1 18 762
138 2 18 355 1 11 305 1 11 305 1 18 762
153 2 18 355 1 18 305 1 11 915 1 18 762
164 2 18 355 1 11 305 1 11 915 1 18 762
337 2 18 355 1 18 305 1 18 305 1 18 762
451 2 18 355 1 11 305 1 11 305 1 18 1524
Table 3 Mean duration of the combined load acting on the containment (IP3) [11] Load combo Occurrence rate Cumulative occur
[combined occurrencesyear] [ occurrences]
mean duration
[sec]
D+P D+E
D+P+E
216E‐03 864E‐02 164E‐02 656E‐01
136E‐09 546E‐08
1200 15
1481
Table 4 The Indian Point 3 Unit Features of the Containment and of the Plant [11]
LOADS
D=dead load=150 lbsft3= 2226586 kgm3
P=accidental pressure=(ms)=N(0288 0034) E=earthquake loads T=accidental temperature corresponding to P
GEOMETRY MATERIAL
R+L=H m Concrete REACTOR FEATURES
R= 20574 m Ec=21373 GPa Reactor type PWR
H= 667512 m vc=02 24 MI N of New York City NY
L= 461772 m frsquoc=frsquoc(ms)=N(3375 432) [MPa] Docket Number 05000286 Operating License Issued ‐ 04051976 Expires ‐
Ss= 10668 m frsquocmin=2068 MPa 12152015
Sc=13716 m Reinforced bars Operator Entergy Nuclear Operations Inc
Es= 200 GPa Electrical Output 979 MWe
vs=02 Reactor VendorType Westinghouse Four‐Loop fy=fy(ms)=lognormal(495 3571) Containment Type Dry Ambient Pressure
P a g e | 26
December 7 2006 [ 314J ‐ FINAL PAPER ‐ ] Edoardo Cavalieri drsquoOro
Table 5 Final Results of the IP3 Calculation for Safety Margins of a Concrete Containment GEOMETRY INPUT STRUCTURAL CALCULATIONS
t=Sc 1371 m
R 206 m
d 0057 m
de 0165 m
PL 0165 m
PH 02 m
X ‐06855 m
Xs 05205 m
L 461772 m
R+L=H 667512 m
Ss 10668 m
εLcmax 669286E‐05
Wp=Wmax 0004671207
W
εhcmax 0000226758
εbL(z)
εbLmax(z=0) 0
σLcmax 243100313
σHcmax 5277691233
σLspreS 1053239714
σHspreS 1365012879
Pa
Pa
Pa
Pa
LOADS AN CAP mean [MPa]
MATERIAL INPUT nominal
distribution γ 125
Paγ 1421888416
D 218205428
F 1365012879
T 1279699574
L=tot 4284806298
φ 09
C=φfy 4455
SM 8509685116
dmnl
MPa
MPa
MPa
MPa
MPa
dmnl
MPa
MPa
Es 2E+11 Pa
Ec 2137E+10 Pa
Pi 450000 Pa
vc=vs 02 dmnl
frsquoc=frsquoc(ms) 33750000 Pa
fy=fy(ms) 495000000 Pa
fuc Pa
OTHER QUANTITIES nominal distribution
σr ‐275000 Pa
As 00025518 m2
Xls 00225605 dmnl
D 6644E+09 Pam3
Xhs 00372248 dmnl
NL 3605000 Pam
EL 2176E+10 Pa
Eh 2143E+10 Pa
E 2627E+10 Pa
α 1875E+09 Pa
γ 51250367
β 0241911
VOLUMES mean [ m^3]
Volume (free) 6140658409
Vcil 8456642372
Vsbar 0117833069
bars 484
Vs=Vsbar bars 11406
Vc=Vcil‐Vs 8342579961
m^3
m^3
m^3
dmnl
m^3
m^3
COSTS mean value
Unit Cost concrete 2685646061
Unit Cost steel 25
ρs (steel density) 7850
Unit Costs 0000318471
Tot Costc=VcUcc 2240521701
Tot Costs=VsUcs 2851560264
Tot Cost= Cs+Cc)tot 2873965481
$m^3
$kg
kgm^3
$m^3
Million $
Million $
Million $
OPTIMIZATION ON COSTS
max F max P max L‐S given fc fy
Total invest costs 2 Billion $
Cost fraction 1437
P a g e | 27
December 7 2006 [ 314J ‐ FINAL PAPER ‐ ] Edoardo Cavalieri drsquoOro
6 References
[1] ABWR CostScheduleCOL Project at TVAs Bellefonte Site August 2005 Tennessee Valley Authority New
Nuclear Power Plant Licensing Demonstration Project DE‐AI07‐04ID14620 Prepared by Toshiba
Corporation GE Company USEC Bechtel Power Corporation Global Nuclear Fuel ndashUS August 2005 [2] Ellingwood Bruce et al RrdquoNuclear Power Plant Containment Pressure Boundary Aging Research (D8‐
A1‐US) ORNLCP‐l02338rdquo Department of Civil Engineering at the Johns Hopkins University Baltimore MD 21218‐2682 (USA) May 1999
[3] NUREG‐0800 (Formerly NUREG‐75087) US Nuclear Regulatory Commission ‐Standard Review Plan‐ Office of Nuclear Reactor Regulation Section 381 Concrete Containment draft review 2 April 1996
[4] NUREG‐0800 US Nuclear Regulatory Commission ‐Standard Review Plan‐ Office Of Nuclear Reactor
Regulation Section 382 Steel Containment draft review 2 April 1996[5] NUREG‐0800 US Nuclear Regulatory Commission ‐Standard Review Plan‐ Office of Nuclear Reactor
Regulation Section 383 Concrete and Steel Internal Structures of Steel or Concrete Containments draftreview 2 April 1996
[6] NRC Information Notice 2004‐09 Corrosion of Steel Containment and Containment Liner Office ofNuclear Reactor Regulation Washington DC 20555‐000‐ April 27 2004
[7] NUREG‐1150 Volume 1 Reactor Risk Reference Document MIT Nuclear Eng Dept Internal Copy 1996[8] DC Williams JJ Gregory SR Tieszen JL TillisrdquoContainment Loads Scoping Calculations for Severe
Nuclear Reactor Accidentsrdquo Sandia Report SAND92‐2774 UC‐940 NPRW‐SA90‐5 Unlimited Release
Printed February 2003[9] Shinozuka MH Hwang and M Reich ldquoReliability assessment of reinforced concrete containment
structuresrdquo Nucle Eng amp Des 80 (1984) pp 247‐267[10] Kawakami H Hwang MTChang and M Reich ldquoReliability assessment of Indian point unit 3 containment
structuresrdquo BNL‐NUREGCR‐3641 January 1984[11] Power Authority of the state of New York ldquoIndian Point NPP unit 3 final safety analysis reportrdquo Docket
250286 1994[12] Mirela Gavrilas ldquoA framework for Integrating Risk and Safety Marginsrdquo RESDSARPNRCA August
2006[13] Wen YK ldquoMethods for reliability in structures under multiple time varying loadsrdquo Nucl Eng ampDes 60[14] John D Stevenson ldquoCompanion Guide Book A guide to the ASME CODE Code for Concrete Reactor
vessels and Containmentsrdquo Edited by KR Rao and published in 2006 [15] Levin Howard Alan ldquoPrestressed concrete containments for nuclear power plantsrdquo Institute Archives ndash
Non‐circulating Collection 3 MS Thesis 1976 [16] Nicholas J and Carino ldquoStructures Division Prediction of Cracking in Reinforced Concrete Structuresrdquo
NISTI report 5634 Gaithersburg MD 20899 April 1995[17] Crystall Ball a risk analysis simulation and optimization Software distributed from Decision
Engineering Ver 72 August 2006
P a g e | 28
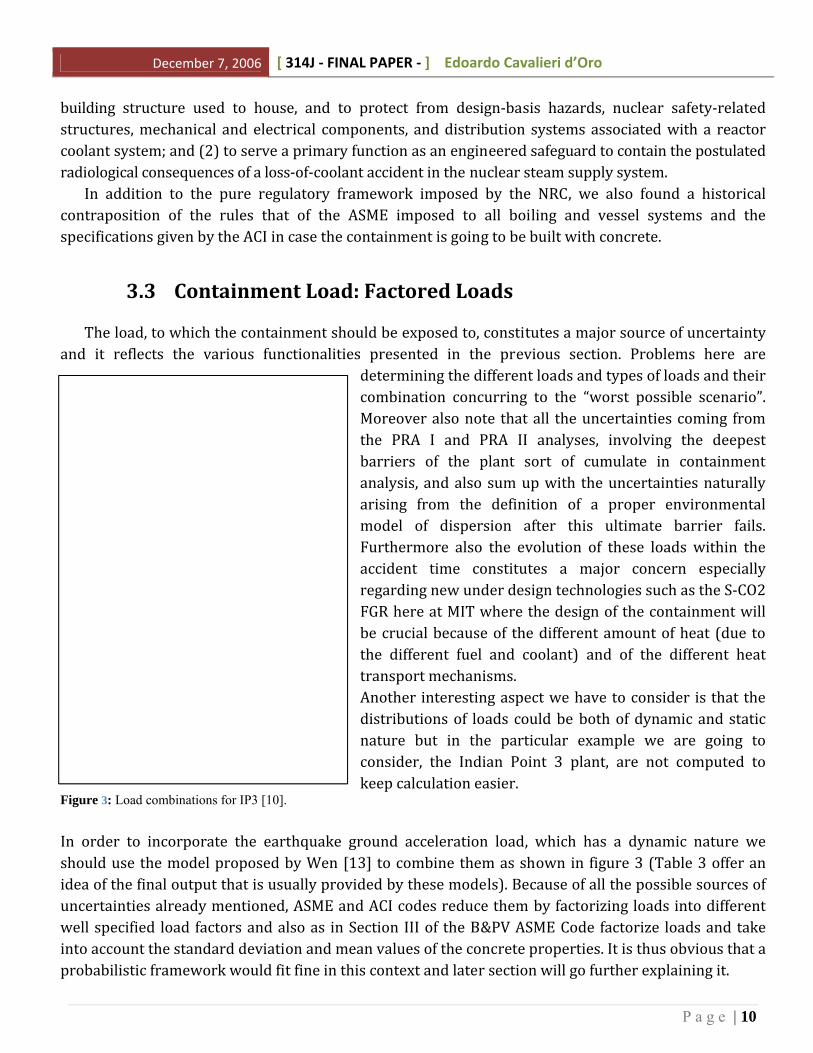
December 7 2006 [ 314J ‐ FINAL PAPER ‐ ] Edoardo Cavalieri drsquoOro
Remember the intent is to verify the margins under accident conditions so we will refer mainly toregulations directly imposing specifics and affecting the margins in question mainly NUREG‐0800 and Section CC‐3540 of ACI‐359 applies specifically to the pre‐stressed containment designs however all manner of ASME III and ACI codes apply Also Code of Federal Regulations 10CFR 5055a applies and inaccordance with ASME Section XI Subsections IWE and IWL The minimum value usually is reported tobe equal to 2 (see NUREG‐800) in our calculations conservatively we are going to assume it in thrange that goes to 2 to 3 (IP3 has a 27 [11] value of applicable margins see eq 18 in the next Section)
e
Calculation 1 Safety Margins of the IP3 plant with our Model
The safety margins of the structure as reported in figure 6 from the shell theory and thus referred to figure 7 and 8 is computed as follow
||
1 1 25
1 85
2
(13)(14)(15)
(16)(17)(18)
90
So accordi t tions the load factor ldquoLrdquo of Eq 1defined from t Pa and increased of
he γ value
o our assumphe accident sequence pressure
esis conservatively
Eqbecause here we donrsquot know a
b
ng
i
t4 or the design pressure is mainly he margin we previously described the details of the load) settled equal
he concrete with the thin shell theory Fthe structure and its
Hereto 1
( lltgn pressure in
and D are then obtained by assuming nties are overshadowed
effect on the limit state probabilities
t
25 The d 13 is obtained analyzithat the dead l
tngoad is mainly the weight of
y the large variability introduced b the other two so it has a mihus its value is going to e deterministic and equal to 150 lbsft
a ran as een treate as a Gaussian with mean
iuncerta y nor 3b
t
The accidental is indeedvalue of 47 psi = 032 MPa and s
The capacity ldquoCrdquo is in contrast decreased to taand uncertainties regarding
dom variable and h b d
pressure d dev of 502 Psi (00346 MPa) according to the data o
ke into account possible imperfectiending moment acting on the structure and here corresponds to a
t to be equal to of th
f ref [11]ons of the material
he btresidual factor=90 Note
ihat the value we choose for frsquoy is se
strength of the mater al as imposed to be for average tensile stresses for bounded reinforcing steel In addition to this we have to avoid that the concrete faces creep deformations and
impose a limit on the pre‐stress F Eq 17 as given from the ACI‐359nto the tensions within the shell of reference
50 ieldt e y
hus we t
iThus constriction imposed on the material translates
MAX(σHspreS =(1‐Xhs)XhsσHcmax microσLspreS = (1‐Xls)XlsσLcmax)lt085fc (19)
P a g e | 21
December 7 2006 [ 314J ‐ FINAL PAPER ‐ ] Edoardo Cavalieri drsquoOro
Equation 18 provides ultimately the safety margins in a deterministic formulation while the probabilistic one assuming that both Load and Capacity are normally distributed as was given in Eq11 is at the moment not considered Because the system of the equation identified revealed to be linear the formulation of Eq 12 can be used and thus the margins we found are going to be expressedin terms of their relative initial capacity (see also footnote 3 at page 13)
SM = (C‐L)C (110)
Note that as stated before we expect the absolute value (C‐L) to be equal to 2 at least (see NUREG‐800) but our calculation initially find evidence of bigger margins because we donrsquot consider abnormalload conditions (see Table 5 where SM=805) By varying the coefficient γ in equation 15 (Table 5makes use of a typical 125 factor which is used for DBA Accidents)in typical ranges are used to express abnormal load conditions (to value of 2 and 3) we can take into account of other possible load combing into the final load factor such as wind or earthquakes
So the calculation we settled takes into account all this limits and optimize the parameters we identified as crucial which are the Area of the steel bar=As the thickness of the shell=Sc=t the Young Modulus =Ec for the concrete which should be subject to cracking [16] the Pressure (by means of γ)within the containment and the Volume Vc which is actually based on the pressure itself (See figure 9)
7The software is calculating the safety margins following the criteria already defined and if the margins are not respected the area of the steel in the structure is increased or Ec increased in such a way to fitthe constraints given by the problem and optimize costs
Figure 9 Free volume and equilibrium pressure LOCA
7Note there are a set of different criteria we can establish and use to set up our limits or boundaries to the system which are related to the different performances desired from the structure (here we referred to strength and thus to measures of performance based on the yielding stress because a mere structural criteria was adopted but there are other performances we should be interested to such as serviceability stability plasticity and vibrations)
P a g e | 22
December 7 2006 [ 314J ‐ FINAL PAPER ‐ ] Edoardo Cavalieri drsquoOro
A final clarification about the way we determined costs assuming there is no change of technology or construction methods corresponding to thickness variations of the concrete and of the area of thesteel bars used to pretension costs are simply calculable by multiplying the corresponding volumes ofmaterial in use for their costs for kg
(111)
( )
Results provided by Table 5 gives an overall cost that correspond to 147 of the initialinvestment cost we hypothesized to be for a PWR of this type (1000 MWe) around 2 billion $
112
Calculation 2 Sensitivities to Material and Geometry
After the calculation of the SM we run a couple of sensitivity analysis to verify some properties ofthe material such as the Young Modulus for the concrete Ec and to verify cost variations as a function of the parameter As
As is responsible of both the strength of the shell element and also of the weight of steel costs over the concrete ones The results are reported in the tables below as a function of costs and cost variation in percentage but this time with regard of the initial value given by ldquoCalculation 1rdquo By varying As above
2its mean value of 000255 m we obtained a maximum 1‐LC equal to 1139 for an As equal to2002707 m corresponding to a overall cost increase equal to 1656 above the base case
SM var and Cost var
000
200
400
600
800
1000
1200
SM
Cost 000 473 903 1295
Fig 10 SM as it varies with cost (capital cost as var )
P a g e | 23
December 7 2006 [ 314J ‐ FINAL PAPER ‐ ] Edoardo Cavalieri drsquoOro
Third calculation we computed is a sensitivity analysis on the parameter Ec or Elastic modulus of the concrete to see how the results are varying depending on the possible initial degradation of thematerial such as small cracks or imperfections [16] Results are reported below
SM var and Es var 02‐1
000
500
1000
1500
2000
SM
Es 1 09 08 07 06 05 04
Fig 11 SM as it varies with the young Modulus of concrete (crack effect)
Final note on other calculations of interest
Also a preliminary calculation has not been included in the tables but we cite it here as an interesting one which is reformulating the same exercise in the case we use a stainless steel containment instead of a concrete pre‐stressed one Calculations are pretty straightforward here and from the basic thin shell theory predict a 40 increase of the thickness Formulas which are reportedin the tables have been used as a reference to validate and compare the results of the calculations performed for the concrete case Evidently the steel containment is more expensive and not able toaccount all the functionalities of the concrete one But if we were going to consider it we should clearlytake into account the strength variation of the material at different temperatures (things about the restrictions given from ASME codes to the 16Cr‐12Ni‐2Mo Plate SA‐240 type 316 of which IP3rsquos liner is made of) thus forcing to take into incorporate temperature loads into the margins on the capacity side (which could be a good example of one of the mechanism we referred into Section 34 where the upper boundary of the system is varying with time in other words C=C(t) )
P a g e | 24
December 7 2006 [ 314J ‐ FINAL PAPER ‐ ] Edoardo Cavalieri drsquoOro
42 Comments and Final Remarks
In this paper an overall methodology to calculate the SM for a pre‐stressed concrete containment was given By referring to a specific plant with has been particularly studied by the literature the basisto compute probabilistic calculations of the safety margins were provided The analyses tries to put emphasis a wide discussion that has been both in class and during the writing of the paper withdifferent Professor of the departments of Civil and Nuclear Engineering here at MIT regarding thecurrent methodology to address safety margins The basic conclusions I would like to concentrate on here are even if not always clearly and explicitly addressed or still to be accomplished in possible futureworks are summarized the below
The current methodology used to address safety margins can be interpreted in respect of the following sentence that appears at the end of the safety report of the Surryrsquos containment ldquoFor Surrythere were no intersections of the load distributions with the containment strength distribution and thus the DHC issue for Surry can be resolved on containments loads alonerdquo
So current containments are adequately safe and as partially but quantitatively presented in thispaper is opinion of the author that thanks to developed state of the art of probabilistic criteria thecurrent regulation that looks obsolete and redundant in many parts could be replaced with appropriate ad hoc SM evaluations
Future part of the work should consider all the basic factors composing load factors and runs thesame optimization used here along all the possible beyond DBA scenarios (we here in fact just selected one and we limited the factors in the load factor formula to 3) comprehending all the loads involved inthe factorized formula of the L
A clearer framework would help to feel the gap that the hyper conservativism intrinsic to theregulation and caused by the overlapping of different standards as ASME and ACI especially in view ofthe imminent development of future nuclear technologies with innovative (and thus costly)containments (See IRIS ESBWR and also ITER) The NISTI report entitled ldquoStructures Division Prediction of Cracking in Reinforced Concrete Structuresrdquo [16] is giving good clarifications in this sense and provides a set of different model which takes into account the different misinterpretations we cited
P a g e | 25
December 7 2006 [ 314J ‐ FINAL PAPER ‐ ] Edoardo Cavalieri drsquoOro
Table 2 Spacing at different elevations and divided by layers for the IP3 PWR Cont [11]
elevation
(m)
hoop meridional diagonal (dmnldmnlcm) primary secondary
layer bar pitch layer bar pitch layer bar pitch layer bar pitch
76 2 18 355 1 18 305 1 18 305 1 18 762
138 2 18 355 1 11 305 1 11 305 1 18 762
153 2 18 355 1 18 305 1 11 915 1 18 762
164 2 18 355 1 11 305 1 11 915 1 18 762
337 2 18 355 1 18 305 1 18 305 1 18 762
451 2 18 355 1 11 305 1 11 305 1 18 1524
Table 3 Mean duration of the combined load acting on the containment (IP3) [11] Load combo Occurrence rate Cumulative occur
[combined occurrencesyear] [ occurrences]
mean duration
[sec]
D+P D+E
D+P+E
216E‐03 864E‐02 164E‐02 656E‐01
136E‐09 546E‐08
1200 15
1481
Table 4 The Indian Point 3 Unit Features of the Containment and of the Plant [11]
LOADS
D=dead load=150 lbsft3= 2226586 kgm3
P=accidental pressure=(ms)=N(0288 0034) E=earthquake loads T=accidental temperature corresponding to P
GEOMETRY MATERIAL
R+L=H m Concrete REACTOR FEATURES
R= 20574 m Ec=21373 GPa Reactor type PWR
H= 667512 m vc=02 24 MI N of New York City NY
L= 461772 m frsquoc=frsquoc(ms)=N(3375 432) [MPa] Docket Number 05000286 Operating License Issued ‐ 04051976 Expires ‐
Ss= 10668 m frsquocmin=2068 MPa 12152015
Sc=13716 m Reinforced bars Operator Entergy Nuclear Operations Inc
Es= 200 GPa Electrical Output 979 MWe
vs=02 Reactor VendorType Westinghouse Four‐Loop fy=fy(ms)=lognormal(495 3571) Containment Type Dry Ambient Pressure
P a g e | 26
December 7 2006 [ 314J ‐ FINAL PAPER ‐ ] Edoardo Cavalieri drsquoOro
Table 5 Final Results of the IP3 Calculation for Safety Margins of a Concrete Containment GEOMETRY INPUT STRUCTURAL CALCULATIONS
t=Sc 1371 m
R 206 m
d 0057 m
de 0165 m
PL 0165 m
PH 02 m
X ‐06855 m
Xs 05205 m
L 461772 m
R+L=H 667512 m
Ss 10668 m
εLcmax 669286E‐05
Wp=Wmax 0004671207
W
εhcmax 0000226758
εbL(z)
εbLmax(z=0) 0
σLcmax 243100313
σHcmax 5277691233
σLspreS 1053239714
σHspreS 1365012879
Pa
Pa
Pa
Pa
LOADS AN CAP mean [MPa]
MATERIAL INPUT nominal
distribution γ 125
Paγ 1421888416
D 218205428
F 1365012879
T 1279699574
L=tot 4284806298
φ 09
C=φfy 4455
SM 8509685116
dmnl
MPa
MPa
MPa
MPa
MPa
dmnl
MPa
MPa
Es 2E+11 Pa
Ec 2137E+10 Pa
Pi 450000 Pa
vc=vs 02 dmnl
frsquoc=frsquoc(ms) 33750000 Pa
fy=fy(ms) 495000000 Pa
fuc Pa
OTHER QUANTITIES nominal distribution
σr ‐275000 Pa
As 00025518 m2
Xls 00225605 dmnl
D 6644E+09 Pam3
Xhs 00372248 dmnl
NL 3605000 Pam
EL 2176E+10 Pa
Eh 2143E+10 Pa
E 2627E+10 Pa
α 1875E+09 Pa
γ 51250367
β 0241911
VOLUMES mean [ m^3]
Volume (free) 6140658409
Vcil 8456642372
Vsbar 0117833069
bars 484
Vs=Vsbar bars 11406
Vc=Vcil‐Vs 8342579961
m^3
m^3
m^3
dmnl
m^3
m^3
COSTS mean value
Unit Cost concrete 2685646061
Unit Cost steel 25
ρs (steel density) 7850
Unit Costs 0000318471
Tot Costc=VcUcc 2240521701
Tot Costs=VsUcs 2851560264
Tot Cost= Cs+Cc)tot 2873965481
$m^3
$kg
kgm^3
$m^3
Million $
Million $
Million $
OPTIMIZATION ON COSTS
max F max P max L‐S given fc fy
Total invest costs 2 Billion $
Cost fraction 1437
P a g e | 27
December 7 2006 [ 314J ‐ FINAL PAPER ‐ ] Edoardo Cavalieri drsquoOro
6 References
[1] ABWR CostScheduleCOL Project at TVAs Bellefonte Site August 2005 Tennessee Valley Authority New
Nuclear Power Plant Licensing Demonstration Project DE‐AI07‐04ID14620 Prepared by Toshiba
Corporation GE Company USEC Bechtel Power Corporation Global Nuclear Fuel ndashUS August 2005 [2] Ellingwood Bruce et al RrdquoNuclear Power Plant Containment Pressure Boundary Aging Research (D8‐
A1‐US) ORNLCP‐l02338rdquo Department of Civil Engineering at the Johns Hopkins University Baltimore MD 21218‐2682 (USA) May 1999
[3] NUREG‐0800 (Formerly NUREG‐75087) US Nuclear Regulatory Commission ‐Standard Review Plan‐ Office of Nuclear Reactor Regulation Section 381 Concrete Containment draft review 2 April 1996
[4] NUREG‐0800 US Nuclear Regulatory Commission ‐Standard Review Plan‐ Office Of Nuclear Reactor
Regulation Section 382 Steel Containment draft review 2 April 1996[5] NUREG‐0800 US Nuclear Regulatory Commission ‐Standard Review Plan‐ Office of Nuclear Reactor
Regulation Section 383 Concrete and Steel Internal Structures of Steel or Concrete Containments draftreview 2 April 1996
[6] NRC Information Notice 2004‐09 Corrosion of Steel Containment and Containment Liner Office ofNuclear Reactor Regulation Washington DC 20555‐000‐ April 27 2004
[7] NUREG‐1150 Volume 1 Reactor Risk Reference Document MIT Nuclear Eng Dept Internal Copy 1996[8] DC Williams JJ Gregory SR Tieszen JL TillisrdquoContainment Loads Scoping Calculations for Severe
Nuclear Reactor Accidentsrdquo Sandia Report SAND92‐2774 UC‐940 NPRW‐SA90‐5 Unlimited Release
Printed February 2003[9] Shinozuka MH Hwang and M Reich ldquoReliability assessment of reinforced concrete containment
structuresrdquo Nucle Eng amp Des 80 (1984) pp 247‐267[10] Kawakami H Hwang MTChang and M Reich ldquoReliability assessment of Indian point unit 3 containment
structuresrdquo BNL‐NUREGCR‐3641 January 1984[11] Power Authority of the state of New York ldquoIndian Point NPP unit 3 final safety analysis reportrdquo Docket
250286 1994[12] Mirela Gavrilas ldquoA framework for Integrating Risk and Safety Marginsrdquo RESDSARPNRCA August
2006[13] Wen YK ldquoMethods for reliability in structures under multiple time varying loadsrdquo Nucl Eng ampDes 60[14] John D Stevenson ldquoCompanion Guide Book A guide to the ASME CODE Code for Concrete Reactor
vessels and Containmentsrdquo Edited by KR Rao and published in 2006 [15] Levin Howard Alan ldquoPrestressed concrete containments for nuclear power plantsrdquo Institute Archives ndash
Non‐circulating Collection 3 MS Thesis 1976 [16] Nicholas J and Carino ldquoStructures Division Prediction of Cracking in Reinforced Concrete Structuresrdquo
NISTI report 5634 Gaithersburg MD 20899 April 1995[17] Crystall Ball a risk analysis simulation and optimization Software distributed from Decision
Engineering Ver 72 August 2006
P a g e | 28
December 7 2006 [ 314J ‐ FINAL PAPER ‐ ] Edoardo Cavalieri drsquoOro
Equation 18 provides ultimately the safety margins in a deterministic formulation while the probabilistic one assuming that both Load and Capacity are normally distributed as was given in Eq11 is at the moment not considered Because the system of the equation identified revealed to be linear the formulation of Eq 12 can be used and thus the margins we found are going to be expressedin terms of their relative initial capacity (see also footnote 3 at page 13)
SM = (C‐L)C (110)
Note that as stated before we expect the absolute value (C‐L) to be equal to 2 at least (see NUREG‐800) but our calculation initially find evidence of bigger margins because we donrsquot consider abnormalload conditions (see Table 5 where SM=805) By varying the coefficient γ in equation 15 (Table 5makes use of a typical 125 factor which is used for DBA Accidents)in typical ranges are used to express abnormal load conditions (to value of 2 and 3) we can take into account of other possible load combing into the final load factor such as wind or earthquakes
So the calculation we settled takes into account all this limits and optimize the parameters we identified as crucial which are the Area of the steel bar=As the thickness of the shell=Sc=t the Young Modulus =Ec for the concrete which should be subject to cracking [16] the Pressure (by means of γ)within the containment and the Volume Vc which is actually based on the pressure itself (See figure 9)
7The software is calculating the safety margins following the criteria already defined and if the margins are not respected the area of the steel in the structure is increased or Ec increased in such a way to fitthe constraints given by the problem and optimize costs
Figure 9 Free volume and equilibrium pressure LOCA
7Note there are a set of different criteria we can establish and use to set up our limits or boundaries to the system which are related to the different performances desired from the structure (here we referred to strength and thus to measures of performance based on the yielding stress because a mere structural criteria was adopted but there are other performances we should be interested to such as serviceability stability plasticity and vibrations)
P a g e | 22
December 7 2006 [ 314J ‐ FINAL PAPER ‐ ] Edoardo Cavalieri drsquoOro
A final clarification about the way we determined costs assuming there is no change of technology or construction methods corresponding to thickness variations of the concrete and of the area of thesteel bars used to pretension costs are simply calculable by multiplying the corresponding volumes ofmaterial in use for their costs for kg
(111)
( )
Results provided by Table 5 gives an overall cost that correspond to 147 of the initialinvestment cost we hypothesized to be for a PWR of this type (1000 MWe) around 2 billion $
112
Calculation 2 Sensitivities to Material and Geometry
After the calculation of the SM we run a couple of sensitivity analysis to verify some properties ofthe material such as the Young Modulus for the concrete Ec and to verify cost variations as a function of the parameter As
As is responsible of both the strength of the shell element and also of the weight of steel costs over the concrete ones The results are reported in the tables below as a function of costs and cost variation in percentage but this time with regard of the initial value given by ldquoCalculation 1rdquo By varying As above
2its mean value of 000255 m we obtained a maximum 1‐LC equal to 1139 for an As equal to2002707 m corresponding to a overall cost increase equal to 1656 above the base case
SM var and Cost var
000
200
400
600
800
1000
1200
SM
Cost 000 473 903 1295
Fig 10 SM as it varies with cost (capital cost as var )
P a g e | 23
December 7 2006 [ 314J ‐ FINAL PAPER ‐ ] Edoardo Cavalieri drsquoOro
Third calculation we computed is a sensitivity analysis on the parameter Ec or Elastic modulus of the concrete to see how the results are varying depending on the possible initial degradation of thematerial such as small cracks or imperfections [16] Results are reported below
SM var and Es var 02‐1
000
500
1000
1500
2000
SM
Es 1 09 08 07 06 05 04
Fig 11 SM as it varies with the young Modulus of concrete (crack effect)
Final note on other calculations of interest
Also a preliminary calculation has not been included in the tables but we cite it here as an interesting one which is reformulating the same exercise in the case we use a stainless steel containment instead of a concrete pre‐stressed one Calculations are pretty straightforward here and from the basic thin shell theory predict a 40 increase of the thickness Formulas which are reportedin the tables have been used as a reference to validate and compare the results of the calculations performed for the concrete case Evidently the steel containment is more expensive and not able toaccount all the functionalities of the concrete one But if we were going to consider it we should clearlytake into account the strength variation of the material at different temperatures (things about the restrictions given from ASME codes to the 16Cr‐12Ni‐2Mo Plate SA‐240 type 316 of which IP3rsquos liner is made of) thus forcing to take into incorporate temperature loads into the margins on the capacity side (which could be a good example of one of the mechanism we referred into Section 34 where the upper boundary of the system is varying with time in other words C=C(t) )
P a g e | 24
December 7 2006 [ 314J ‐ FINAL PAPER ‐ ] Edoardo Cavalieri drsquoOro
42 Comments and Final Remarks
In this paper an overall methodology to calculate the SM for a pre‐stressed concrete containment was given By referring to a specific plant with has been particularly studied by the literature the basisto compute probabilistic calculations of the safety margins were provided The analyses tries to put emphasis a wide discussion that has been both in class and during the writing of the paper withdifferent Professor of the departments of Civil and Nuclear Engineering here at MIT regarding thecurrent methodology to address safety margins The basic conclusions I would like to concentrate on here are even if not always clearly and explicitly addressed or still to be accomplished in possible futureworks are summarized the below
The current methodology used to address safety margins can be interpreted in respect of the following sentence that appears at the end of the safety report of the Surryrsquos containment ldquoFor Surrythere were no intersections of the load distributions with the containment strength distribution and thus the DHC issue for Surry can be resolved on containments loads alonerdquo
So current containments are adequately safe and as partially but quantitatively presented in thispaper is opinion of the author that thanks to developed state of the art of probabilistic criteria thecurrent regulation that looks obsolete and redundant in many parts could be replaced with appropriate ad hoc SM evaluations
Future part of the work should consider all the basic factors composing load factors and runs thesame optimization used here along all the possible beyond DBA scenarios (we here in fact just selected one and we limited the factors in the load factor formula to 3) comprehending all the loads involved inthe factorized formula of the L
A clearer framework would help to feel the gap that the hyper conservativism intrinsic to theregulation and caused by the overlapping of different standards as ASME and ACI especially in view ofthe imminent development of future nuclear technologies with innovative (and thus costly)containments (See IRIS ESBWR and also ITER) The NISTI report entitled ldquoStructures Division Prediction of Cracking in Reinforced Concrete Structuresrdquo [16] is giving good clarifications in this sense and provides a set of different model which takes into account the different misinterpretations we cited
P a g e | 25
December 7 2006 [ 314J ‐ FINAL PAPER ‐ ] Edoardo Cavalieri drsquoOro
Table 2 Spacing at different elevations and divided by layers for the IP3 PWR Cont [11]
elevation
(m)
hoop meridional diagonal (dmnldmnlcm) primary secondary
layer bar pitch layer bar pitch layer bar pitch layer bar pitch
76 2 18 355 1 18 305 1 18 305 1 18 762
138 2 18 355 1 11 305 1 11 305 1 18 762
153 2 18 355 1 18 305 1 11 915 1 18 762
164 2 18 355 1 11 305 1 11 915 1 18 762
337 2 18 355 1 18 305 1 18 305 1 18 762
451 2 18 355 1 11 305 1 11 305 1 18 1524
Table 3 Mean duration of the combined load acting on the containment (IP3) [11] Load combo Occurrence rate Cumulative occur
[combined occurrencesyear] [ occurrences]
mean duration
[sec]
D+P D+E
D+P+E
216E‐03 864E‐02 164E‐02 656E‐01
136E‐09 546E‐08
1200 15
1481
Table 4 The Indian Point 3 Unit Features of the Containment and of the Plant [11]
LOADS
D=dead load=150 lbsft3= 2226586 kgm3
P=accidental pressure=(ms)=N(0288 0034) E=earthquake loads T=accidental temperature corresponding to P
GEOMETRY MATERIAL
R+L=H m Concrete REACTOR FEATURES
R= 20574 m Ec=21373 GPa Reactor type PWR
H= 667512 m vc=02 24 MI N of New York City NY
L= 461772 m frsquoc=frsquoc(ms)=N(3375 432) [MPa] Docket Number 05000286 Operating License Issued ‐ 04051976 Expires ‐
Ss= 10668 m frsquocmin=2068 MPa 12152015
Sc=13716 m Reinforced bars Operator Entergy Nuclear Operations Inc
Es= 200 GPa Electrical Output 979 MWe
vs=02 Reactor VendorType Westinghouse Four‐Loop fy=fy(ms)=lognormal(495 3571) Containment Type Dry Ambient Pressure
P a g e | 26
December 7 2006 [ 314J ‐ FINAL PAPER ‐ ] Edoardo Cavalieri drsquoOro
Table 5 Final Results of the IP3 Calculation for Safety Margins of a Concrete Containment GEOMETRY INPUT STRUCTURAL CALCULATIONS
t=Sc 1371 m
R 206 m
d 0057 m
de 0165 m
PL 0165 m
PH 02 m
X ‐06855 m
Xs 05205 m
L 461772 m
R+L=H 667512 m
Ss 10668 m
εLcmax 669286E‐05
Wp=Wmax 0004671207
W
εhcmax 0000226758
εbL(z)
εbLmax(z=0) 0
σLcmax 243100313
σHcmax 5277691233
σLspreS 1053239714
σHspreS 1365012879
Pa
Pa
Pa
Pa
LOADS AN CAP mean [MPa]
MATERIAL INPUT nominal
distribution γ 125
Paγ 1421888416
D 218205428
F 1365012879
T 1279699574
L=tot 4284806298
φ 09
C=φfy 4455
SM 8509685116
dmnl
MPa
MPa
MPa
MPa
MPa
dmnl
MPa
MPa
Es 2E+11 Pa
Ec 2137E+10 Pa
Pi 450000 Pa
vc=vs 02 dmnl
frsquoc=frsquoc(ms) 33750000 Pa
fy=fy(ms) 495000000 Pa
fuc Pa
OTHER QUANTITIES nominal distribution
σr ‐275000 Pa
As 00025518 m2
Xls 00225605 dmnl
D 6644E+09 Pam3
Xhs 00372248 dmnl
NL 3605000 Pam
EL 2176E+10 Pa
Eh 2143E+10 Pa
E 2627E+10 Pa
α 1875E+09 Pa
γ 51250367
β 0241911
VOLUMES mean [ m^3]
Volume (free) 6140658409
Vcil 8456642372
Vsbar 0117833069
bars 484
Vs=Vsbar bars 11406
Vc=Vcil‐Vs 8342579961
m^3
m^3
m^3
dmnl
m^3
m^3
COSTS mean value
Unit Cost concrete 2685646061
Unit Cost steel 25
ρs (steel density) 7850
Unit Costs 0000318471
Tot Costc=VcUcc 2240521701
Tot Costs=VsUcs 2851560264
Tot Cost= Cs+Cc)tot 2873965481
$m^3
$kg
kgm^3
$m^3
Million $
Million $
Million $
OPTIMIZATION ON COSTS
max F max P max L‐S given fc fy
Total invest costs 2 Billion $
Cost fraction 1437
P a g e | 27
December 7 2006 [ 314J ‐ FINAL PAPER ‐ ] Edoardo Cavalieri drsquoOro
6 References
[1] ABWR CostScheduleCOL Project at TVAs Bellefonte Site August 2005 Tennessee Valley Authority New
Nuclear Power Plant Licensing Demonstration Project DE‐AI07‐04ID14620 Prepared by Toshiba
Corporation GE Company USEC Bechtel Power Corporation Global Nuclear Fuel ndashUS August 2005 [2] Ellingwood Bruce et al RrdquoNuclear Power Plant Containment Pressure Boundary Aging Research (D8‐
A1‐US) ORNLCP‐l02338rdquo Department of Civil Engineering at the Johns Hopkins University Baltimore MD 21218‐2682 (USA) May 1999
[3] NUREG‐0800 (Formerly NUREG‐75087) US Nuclear Regulatory Commission ‐Standard Review Plan‐ Office of Nuclear Reactor Regulation Section 381 Concrete Containment draft review 2 April 1996
[4] NUREG‐0800 US Nuclear Regulatory Commission ‐Standard Review Plan‐ Office Of Nuclear Reactor
Regulation Section 382 Steel Containment draft review 2 April 1996[5] NUREG‐0800 US Nuclear Regulatory Commission ‐Standard Review Plan‐ Office of Nuclear Reactor
Regulation Section 383 Concrete and Steel Internal Structures of Steel or Concrete Containments draftreview 2 April 1996
[6] NRC Information Notice 2004‐09 Corrosion of Steel Containment and Containment Liner Office ofNuclear Reactor Regulation Washington DC 20555‐000‐ April 27 2004
[7] NUREG‐1150 Volume 1 Reactor Risk Reference Document MIT Nuclear Eng Dept Internal Copy 1996[8] DC Williams JJ Gregory SR Tieszen JL TillisrdquoContainment Loads Scoping Calculations for Severe
Nuclear Reactor Accidentsrdquo Sandia Report SAND92‐2774 UC‐940 NPRW‐SA90‐5 Unlimited Release
Printed February 2003[9] Shinozuka MH Hwang and M Reich ldquoReliability assessment of reinforced concrete containment
structuresrdquo Nucle Eng amp Des 80 (1984) pp 247‐267[10] Kawakami H Hwang MTChang and M Reich ldquoReliability assessment of Indian point unit 3 containment
structuresrdquo BNL‐NUREGCR‐3641 January 1984[11] Power Authority of the state of New York ldquoIndian Point NPP unit 3 final safety analysis reportrdquo Docket
250286 1994[12] Mirela Gavrilas ldquoA framework for Integrating Risk and Safety Marginsrdquo RESDSARPNRCA August
2006[13] Wen YK ldquoMethods for reliability in structures under multiple time varying loadsrdquo Nucl Eng ampDes 60[14] John D Stevenson ldquoCompanion Guide Book A guide to the ASME CODE Code for Concrete Reactor
vessels and Containmentsrdquo Edited by KR Rao and published in 2006 [15] Levin Howard Alan ldquoPrestressed concrete containments for nuclear power plantsrdquo Institute Archives ndash
Non‐circulating Collection 3 MS Thesis 1976 [16] Nicholas J and Carino ldquoStructures Division Prediction of Cracking in Reinforced Concrete Structuresrdquo
NISTI report 5634 Gaithersburg MD 20899 April 1995[17] Crystall Ball a risk analysis simulation and optimization Software distributed from Decision
Engineering Ver 72 August 2006
P a g e | 28
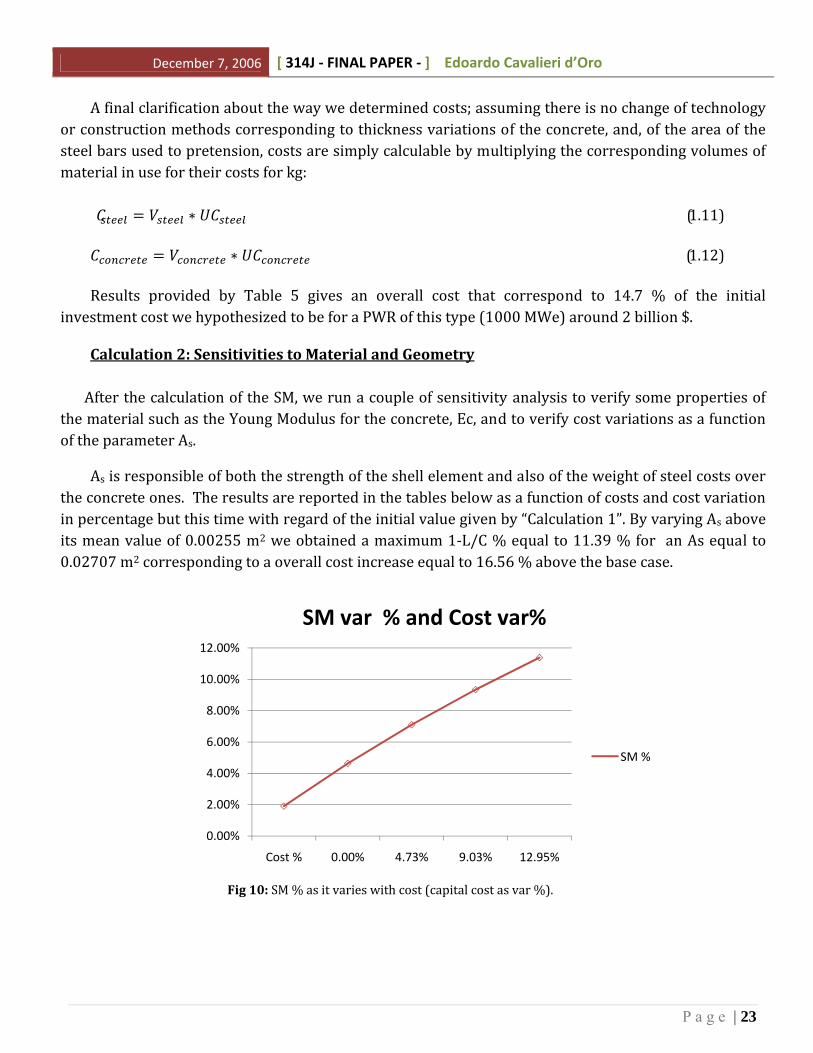
December 7 2006 [ 314J ‐ FINAL PAPER ‐ ] Edoardo Cavalieri drsquoOro
Table 2 Spacing at different elevations and divided by layers for the IP3 PWR Cont [11]
elevation
(m)
hoop meridional diagonal (dmnldmnlcm) primary secondary
layer bar pitch layer bar pitch layer bar pitch layer bar pitch
76 2 18 355 1 18 305 1 18 305 1 18 762
138 2 18 355 1 11 305 1 11 305 1 18 762
153 2 18 355 1 18 305 1 11 915 1 18 762
164 2 18 355 1 11 305 1 11 915 1 18 762
337 2 18 355 1 18 305 1 18 305 1 18 762
451 2 18 355 1 11 305 1 11 305 1 18 1524
Table 3 Mean duration of the combined load acting on the containment (IP3) [11] Load combo Occurrence rate Cumulative occur
[combined occurrencesyear] [ occurrences]
mean duration
[sec]
D+P D+E
D+P+E
216E‐03 864E‐02 164E‐02 656E‐01
136E‐09 546E‐08
1200 15
1481
Table 4 The Indian Point 3 Unit Features of the Containment and of the Plant [11]
LOADS
D=dead load=150 lbsft3= 2226586 kgm3
P=accidental pressure=(ms)=N(0288 0034) E=earthquake loads T=accidental temperature corresponding to P
GEOMETRY MATERIAL
R+L=H m Concrete REACTOR FEATURES
R= 20574 m Ec=21373 GPa Reactor type PWR
H= 667512 m vc=02 24 MI N of New York City NY
L= 461772 m frsquoc=frsquoc(ms)=N(3375 432) [MPa] Docket Number 05000286 Operating License Issued ‐ 04051976 Expires ‐
Ss= 10668 m frsquocmin=2068 MPa 12152015
Sc=13716 m Reinforced bars Operator Entergy Nuclear Operations Inc
Es= 200 GPa Electrical Output 979 MWe
vs=02 Reactor VendorType Westinghouse Four‐Loop fy=fy(ms)=lognormal(495 3571) Containment Type Dry Ambient Pressure
P a g e | 26
December 7 2006 [ 314J ‐ FINAL PAPER ‐ ] Edoardo Cavalieri drsquoOro
Table 5 Final Results of the IP3 Calculation for Safety Margins of a Concrete Containment GEOMETRY INPUT STRUCTURAL CALCULATIONS
t=Sc 1371 m
R 206 m
d 0057 m
de 0165 m
PL 0165 m
PH 02 m
X ‐06855 m
Xs 05205 m
L 461772 m
R+L=H 667512 m
Ss 10668 m
εLcmax 669286E‐05
Wp=Wmax 0004671207
W
εhcmax 0000226758
εbL(z)
εbLmax(z=0) 0
σLcmax 243100313
σHcmax 5277691233
σLspreS 1053239714
σHspreS 1365012879
Pa
Pa
Pa
Pa
LOADS AN CAP mean [MPa]
MATERIAL INPUT nominal
distribution γ 125
Paγ 1421888416
D 218205428
F 1365012879
T 1279699574
L=tot 4284806298
φ 09
C=φfy 4455
SM 8509685116
dmnl
MPa
MPa
MPa
MPa
MPa
dmnl
MPa
MPa
Es 2E+11 Pa
Ec 2137E+10 Pa
Pi 450000 Pa
vc=vs 02 dmnl
frsquoc=frsquoc(ms) 33750000 Pa
fy=fy(ms) 495000000 Pa
fuc Pa
OTHER QUANTITIES nominal distribution
σr ‐275000 Pa
As 00025518 m2
Xls 00225605 dmnl
D 6644E+09 Pam3
Xhs 00372248 dmnl
NL 3605000 Pam
EL 2176E+10 Pa
Eh 2143E+10 Pa
E 2627E+10 Pa
α 1875E+09 Pa
γ 51250367
β 0241911
VOLUMES mean [ m^3]
Volume (free) 6140658409
Vcil 8456642372
Vsbar 0117833069
bars 484
Vs=Vsbar bars 11406
Vc=Vcil‐Vs 8342579961
m^3
m^3
m^3
dmnl
m^3
m^3
COSTS mean value
Unit Cost concrete 2685646061
Unit Cost steel 25
ρs (steel density) 7850
Unit Costs 0000318471
Tot Costc=VcUcc 2240521701
Tot Costs=VsUcs 2851560264
Tot Cost= Cs+Cc)tot 2873965481
$m^3
$kg
kgm^3
$m^3
Million $
Million $
Million $
OPTIMIZATION ON COSTS
max F max P max L‐S given fc fy
Total invest costs 2 Billion $
Cost fraction 1437
P a g e | 27
December 7 2006 [ 314J ‐ FINAL PAPER ‐ ] Edoardo Cavalieri drsquoOro
6 References
[1] ABWR CostScheduleCOL Project at TVAs Bellefonte Site August 2005 Tennessee Valley Authority New
Nuclear Power Plant Licensing Demonstration Project DE‐AI07‐04ID14620 Prepared by Toshiba
Corporation GE Company USEC Bechtel Power Corporation Global Nuclear Fuel ndashUS August 2005 [2] Ellingwood Bruce et al RrdquoNuclear Power Plant Containment Pressure Boundary Aging Research (D8‐
A1‐US) ORNLCP‐l02338rdquo Department of Civil Engineering at the Johns Hopkins University Baltimore MD 21218‐2682 (USA) May 1999
[3] NUREG‐0800 (Formerly NUREG‐75087) US Nuclear Regulatory Commission ‐Standard Review Plan‐ Office of Nuclear Reactor Regulation Section 381 Concrete Containment draft review 2 April 1996
[4] NUREG‐0800 US Nuclear Regulatory Commission ‐Standard Review Plan‐ Office Of Nuclear Reactor
Regulation Section 382 Steel Containment draft review 2 April 1996[5] NUREG‐0800 US Nuclear Regulatory Commission ‐Standard Review Plan‐ Office of Nuclear Reactor
Regulation Section 383 Concrete and Steel Internal Structures of Steel or Concrete Containments draftreview 2 April 1996
[6] NRC Information Notice 2004‐09 Corrosion of Steel Containment and Containment Liner Office ofNuclear Reactor Regulation Washington DC 20555‐000‐ April 27 2004
[7] NUREG‐1150 Volume 1 Reactor Risk Reference Document MIT Nuclear Eng Dept Internal Copy 1996[8] DC Williams JJ Gregory SR Tieszen JL TillisrdquoContainment Loads Scoping Calculations for Severe
Nuclear Reactor Accidentsrdquo Sandia Report SAND92‐2774 UC‐940 NPRW‐SA90‐5 Unlimited Release
Printed February 2003[9] Shinozuka MH Hwang and M Reich ldquoReliability assessment of reinforced concrete containment
structuresrdquo Nucle Eng amp Des 80 (1984) pp 247‐267[10] Kawakami H Hwang MTChang and M Reich ldquoReliability assessment of Indian point unit 3 containment
structuresrdquo BNL‐NUREGCR‐3641 January 1984[11] Power Authority of the state of New York ldquoIndian Point NPP unit 3 final safety analysis reportrdquo Docket
250286 1994[12] Mirela Gavrilas ldquoA framework for Integrating Risk and Safety Marginsrdquo RESDSARPNRCA August
2006[13] Wen YK ldquoMethods for reliability in structures under multiple time varying loadsrdquo Nucl Eng ampDes 60[14] John D Stevenson ldquoCompanion Guide Book A guide to the ASME CODE Code for Concrete Reactor
vessels and Containmentsrdquo Edited by KR Rao and published in 2006 [15] Levin Howard Alan ldquoPrestressed concrete containments for nuclear power plantsrdquo Institute Archives ndash
Non‐circulating Collection 3 MS Thesis 1976 [16] Nicholas J and Carino ldquoStructures Division Prediction of Cracking in Reinforced Concrete Structuresrdquo
NISTI report 5634 Gaithersburg MD 20899 April 1995[17] Crystall Ball a risk analysis simulation and optimization Software distributed from Decision
Engineering Ver 72 August 2006
P a g e | 28
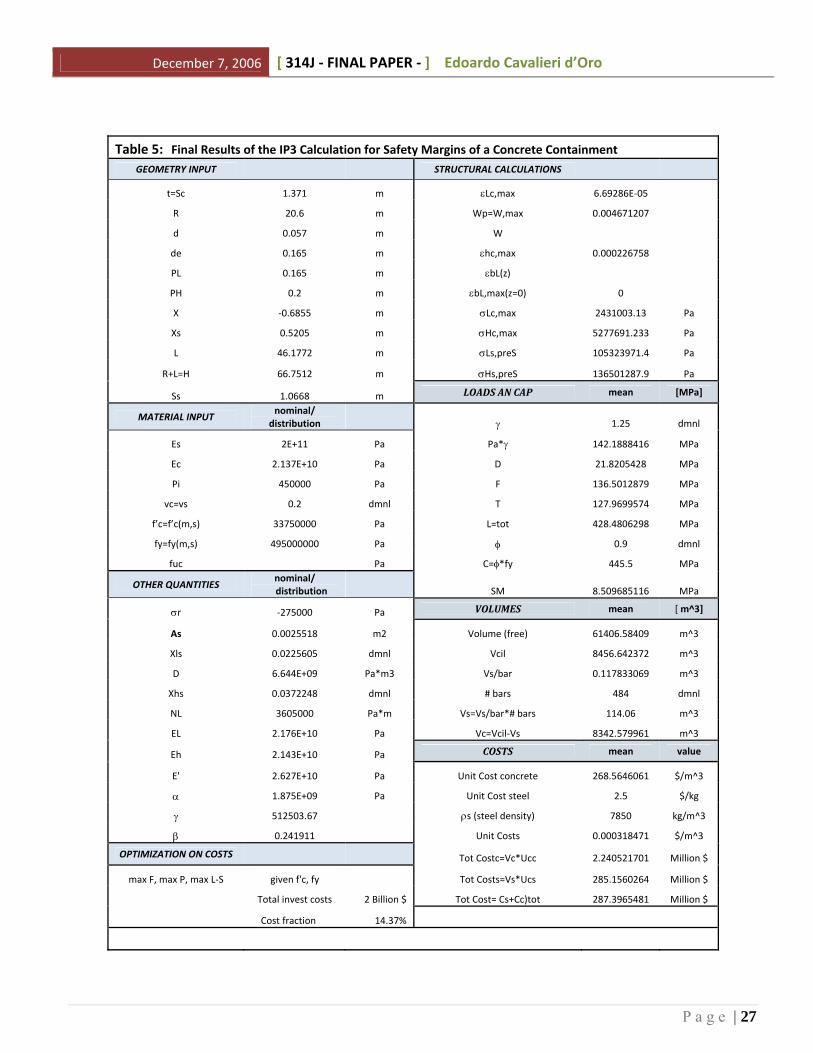
December 7 2006 [ 314J ‐ FINAL PAPER ‐ ] Edoardo Cavalieri drsquoOro
6 References
[1] ABWR CostScheduleCOL Project at TVAs Bellefonte Site August 2005 Tennessee Valley Authority New
Nuclear Power Plant Licensing Demonstration Project DE‐AI07‐04ID14620 Prepared by Toshiba
Corporation GE Company USEC Bechtel Power Corporation Global Nuclear Fuel ndashUS August 2005 [2] Ellingwood Bruce et al RrdquoNuclear Power Plant Containment Pressure Boundary Aging Research (D8‐
A1‐US) ORNLCP‐l02338rdquo Department of Civil Engineering at the Johns Hopkins University Baltimore MD 21218‐2682 (USA) May 1999
[3] NUREG‐0800 (Formerly NUREG‐75087) US Nuclear Regulatory Commission ‐Standard Review Plan‐ Office of Nuclear Reactor Regulation Section 381 Concrete Containment draft review 2 April 1996
[4] NUREG‐0800 US Nuclear Regulatory Commission ‐Standard Review Plan‐ Office Of Nuclear Reactor
Regulation Section 382 Steel Containment draft review 2 April 1996[5] NUREG‐0800 US Nuclear Regulatory Commission ‐Standard Review Plan‐ Office of Nuclear Reactor
Regulation Section 383 Concrete and Steel Internal Structures of Steel or Concrete Containments draftreview 2 April 1996
[6] NRC Information Notice 2004‐09 Corrosion of Steel Containment and Containment Liner Office ofNuclear Reactor Regulation Washington DC 20555‐000‐ April 27 2004
[7] NUREG‐1150 Volume 1 Reactor Risk Reference Document MIT Nuclear Eng Dept Internal Copy 1996[8] DC Williams JJ Gregory SR Tieszen JL TillisrdquoContainment Loads Scoping Calculations for Severe
Nuclear Reactor Accidentsrdquo Sandia Report SAND92‐2774 UC‐940 NPRW‐SA90‐5 Unlimited Release
Printed February 2003[9] Shinozuka MH Hwang and M Reich ldquoReliability assessment of reinforced concrete containment
structuresrdquo Nucle Eng amp Des 80 (1984) pp 247‐267[10] Kawakami H Hwang MTChang and M Reich ldquoReliability assessment of Indian point unit 3 containment
structuresrdquo BNL‐NUREGCR‐3641 January 1984[11] Power Authority of the state of New York ldquoIndian Point NPP unit 3 final safety analysis reportrdquo Docket
250286 1994[12] Mirela Gavrilas ldquoA framework for Integrating Risk and Safety Marginsrdquo RESDSARPNRCA August
2006[13] Wen YK ldquoMethods for reliability in structures under multiple time varying loadsrdquo Nucl Eng ampDes 60[14] John D Stevenson ldquoCompanion Guide Book A guide to the ASME CODE Code for Concrete Reactor
vessels and Containmentsrdquo Edited by KR Rao and published in 2006 [15] Levin Howard Alan ldquoPrestressed concrete containments for nuclear power plantsrdquo Institute Archives ndash
Non‐circulating Collection 3 MS Thesis 1976 [16] Nicholas J and Carino ldquoStructures Division Prediction of Cracking in Reinforced Concrete Structuresrdquo
NISTI report 5634 Gaithersburg MD 20899 April 1995[17] Crystall Ball a risk analysis simulation and optimization Software distributed from Decision
Engineering Ver 72 August 2006
P a g e | 28