ESTIMATION OF THE MECHANICAL PROPERTIES OF THE …
163
ESTIMATION OF THE MECHANICAL PROPERTIES OF THE AIRWAYS AND RESPIRATORY TISSUES IN INFANTS BY LOW-FREQUENCY FORCED OSCILLATIONS Graham Langley Hall, BAppSci. This thesis is presented for the degree of Doctor of Philosophy of the University of Western Australia Department of Paediatrics 2000
Transcript of ESTIMATION OF THE MECHANICAL PROPERTIES OF THE …

ESTIMATION OF THE MECHANICAL
PROPERTIES OF THE AIRWAYS AND
RESPIRATORY TISSUES IN INFANTS
BY LOW-FREQUENCY FORCED
OSCILLATIONS
Graham Langley Hall, BAppSci.
This thesis is presented for the degree of Doctor of Philosophy of the
University of Western Australia
Department of Paediatrics
2000

3
ABSTRACT: Infant lung function tests commonly assess forced expiratory flows and/or volumes. These
techniques are unable to provide information on the site of changes in lung mechanics.
Preliminary studies using the low-frequency forced oscillation technique (FOT) have shown
the technique able to determine the low-frequency impedance spectra (Zrs). A model,
containing frequency independent airway and constant-phase tissue compartments can be
fitted to Zrs and provide an assessment of both the airway and respiratory tissue mechanics.
Aims: The aims were: (1) use the low-frequency F O T to partition Zrs into lung (Zl) and
chest wall (Zw) impedances and subsequently into nasal (Zn) and lower respiratory system
impedances (Zlrs); (2) characterise the relationship between the airway and respiratory
tissue mechanics and length in normal infants; (3) compare the airway and respiratory tissue
mechanics in wheezy infants with those of normal infants; and (4) assess the methacholine
responsiveness in infants using the low-frequency FOT. Results: Longitudinal
measurements of the airway and lung tissue mechanics over a period of 14 days were
carried out in a Brown Norway (BN) rat model allowing animals to act as their o w n
controls. A n esophageal catheter was used to non-invasively partition Zrs into Zl and Z w
and the airway and tissue mechanics of Zl and Z w described. In five mechanically ventilated
patients Zrs was non-invasively partitioned into Zl and Zw. The chest wall was found to
contribute a negligible amount to the respiratory system resistance (Rrs) and inertance (Irs),
but to contribute a significant amount to the respiratory tissue damping (Grs) and elastance
(Hrs) (38.5±7.3% and 34.4±7.4%; mean±SEM, respectively). In spontaneously breathing
infants Zn influenced only the airway properties of the respiratory system, contributing
44.6±4.9% of the Rrs and a majority of the Irs (71.7±3.5%). Forced expiratory volumes
(FEV0.5) and low-frequency F O T mechanical parameters were determined in a cross-section
study of healthy infants and the relationship between the lung function parameters and
length investigated. Both airway and tissue parameters demonstrated a decreasing quadratic
relationship with increasing length, while FEV0.5 showed an increasing cubic relationship
with length. A family history of asthma was found to have a negative effect on airway
resistance (Raw), Hrs and FEV0.5, whereas gender did not have any effect. A similar study
carried out in 22 asymptomatic infants with a history of recurrent or persistent wheeze and
standardised variants (Z scores) were used to compare the wheezy population to the
previously described normal population. Abnormal mechanics of the airways and respiratory

4
tissues were found in infants with recurrent wheeze persisting beyond 1 year of age,
suggesting that infantile wheeze is not merely related to airway function, but rather an
alteration in mechanical characteristics of both the airways and the respiratory tissues. The
responsiveness to inhaled methacholine (Mch) in 17 infants was assessed, by comparing the
concentration of M c h causing an increase in Raw, equivalent to twice that of the baseline
variability (TCRaw) with the concentration of M c h causing a 1 5 % decrease in FEV0.5
(PC15FEV0.5). T C R a w was significantly lower than PC15FEV0.5, with the difference being
attributed to the relative changes required to reach the respective responses. A n increase
in R a w of 3 0 % was found to equate to the same relative change required to cause a
decrease in FEV0.5 of 15%. The concentration causing an increase in R a w of 3 0 %
(PCsoRaw) and PC15FEV0.5 were subsequently found to be equal (1.5; 0.5-2 m g / m L and
1.5; 1-4 mg/mL (median;25-75% CI), respectively). Significant changes in Irs, G and
hysteresivity were also recorded. Conclusions: The low-frequency F O T is able to assess
both the airway and respiratory tissue mechanics in sedated infants. The mechanical
properties of the airways and respiratory tissues in infants with no respiratory disease were
characterised, both airway and respiratory tissue mechanics were significantly abnormal in
infants with recurrent wheeze. The technique was found to be useful in assessing the
responsiveness to inhaled M c h in infants. Future studies should consider the use of either
a nasal or esophageal catheter to detect changes in airway or parenchymal mechanics,
respectively.

5
TABLE OF CONTENTS: ABSTRACT: 3
ACKNOWLEDGEMENTS: 11
ABBREVIATIONS: 13
NOTATIONS: 15
STATEMENT OF CONTRIBUTION: 17
CHAPTER 1: REVTEW OF THE CURRENT LITERATURE 19
1.1 Overview of respiratory physiology 19
1.1.1 Basic function and mechanics of the airways 19
1.1.2 Basic function and mechanics of the lung parenchyma 20
1.1.3 Modelling the respiratory system 21
1.1.3.1 Resistance 22
1.1.3.2 Elastance ..- 23
1.1.3.3 Inertance 24
1.1.3.4 Models of the respiratory system 24
1.2 Measurement of respiratory mechanics in infants 31
1.2.1 Measures of forced expiratory flow 32
1.2.2 Measures of compliance and resistance 34
1.2.2.1 Dynamic techniques 34
1.2.2.2 Occlusion techniques 36
1.2.3 Measures of lung volume 37
1.3 The forced oscillation technique 39
1.3.1 The forced oscillation technique in older children and adults 42
1.3.1.1 Input impedance 43
1.3.1.2 Transfer impedance 45
1.3.2 The use of the forced oscillation technique in infants 46
1.3.2.1 Input impedance 46
1.3.2.2 Transfer impedance 47
1.5 The low-frequency forced oscillation technique in infants 48
1.6 Aims 48
CHAPTER 2: METHODS AND MATERIALS 51
2.1 Introduction 51

6
2.2 Measurement techniques for detenriining respiratory impedance 51
2.2.1 Wave-tube device 51
2.2.1.1 Validity of the wave-tube device
51
2.2.1.2 Measurement apparatus 52
2.2.2 Pneumotachograph device 54
2.2.2.1 Spontaneously breathing patients 54
2.2.2.2 Mechanically ventilated patients 57
2.3 Forcing signals 59
2.4 Constant-phase model 61
2.5 Raised volume rapid thoracic compression technique 64
C H A P T E R 3: R E P E A T E D M E A S U R E M E N T S O F A I R W A Y A N D L U N G TISSUE
M E C H A N I C S IN R A T S 67
3.1 Summary 67
3.2 Introduction 68
3.3 Methods 69
3.3.1 Animal preparations 69
3.3.2 Measurement apparatus 70
3.3.3 Study protocol 70
3.3.4 Parameter estimation 71
3.3.5 Statistics ...71
3.4 Results 71
3.4.1 Non-invasive partitioning of Zrs 71
3.4.2 Repeated measurements in individual animals 72
3.4.3 Comparison of the lung mechanics obtained in closed and open
chest conditions 73
3.4.4 Sample numbers for non-invasive, repeated and for single invasive
studies 76
3.4.5 Mch responses detected non-invasively 77
3.5 Discussion 78
3.5.1 Validity of Pes measurement 79
3.5.2 Lung parameters 80

7
3.5.3 Lung and chest wall contributions 81
3.5.4 Comparison of in situ and open chest conditions 81
3.5.5 Conclusion 82
CHAPTER 4: CHEST W A L L A N D NASAL CONTRIBUTIONS TO LOW-
FREQUENCY RESPIRATORY IMPEDANCE IN INFANTS 83
4.1 Summary 83
4.2 Introduction 84
4.3 Methods 85
4.3.1 Subjects 85
4.3.1.1 Determination of Zl and Zw 85
4.3.1.2 Characterization of Zn 86
4.3.2Measurement apparatus 86
4.3.2.1 Determination of Zl and Zw 86
4.3.2.2 Characterization of Zn 87
4.3.3Study protocol and analysis 88
4.3.3.1 Determination of Zl and Zw 88
4.3.3.2 Characterization of Zn 88
4.4 Results 88
4.4.1 Determination of Zl and Z w 88
4.5 Discussion 93
4.5.1 Partitioning of Zrs into Zl and Zw 94
4.5.1.1 Total respiratory impedances 94
4.5.1.2 Lung impedances 95
4.5.1.3 Contribution ofZl and Zw to Zrs 96
4.5.2 Partitioning of Zrs into Zn and Zlrs 97
4.5.2.1 Contribution ofRn to Rrs 97
4.5.2.2 Contribution of Xn to Xrs 98
4.5.3 Conclusions 99
CHAPTER 5: DEVELOPMENT OF AIRWAY A N D RESPIRATORY TISSUE
MECHANICS IN H E A L T H Y INF ANTS 101
5.1 Summary 101
5.2 Introduction 102

8
5.3 Methods 1°3
5.3.1 Subjects 103
5.3.2 Measurement apparatus 103
5.3.2.1 Forced oscillation technique 103
5.3.2.2 Raised volume rapid thoracic compression technique.. 104
5.3.3 Study protocol and analysis 105
5.4 RESULTS 106
5.4.1 Low-frequency respiratory system mechanics 106
5.4.2 R V R T C 107
5.4.3 Comparison between F O T and R V R T C 109
5.4.4 Factors influencing lung function parameters 109
5.5 Discussion 110
5.5.1 FOT 110
5.5.2 R V R T C :'. 112
5.5.3 Factors influencing lung function parameters 112
5.5.4 Dysanaptic growth 113
5.5.5 Comparison between FOT and R V R T C 114
5.5.6 Conclusions 114
CHAPTER 6: RESPIRATORY S Y S T E M I M P E D A N C E IN W H E E Z Y INFANTS. 115
6.1 Summary 115
6.2 Introduction 116
6.3 Methods 117
6.3.1 Subjects 117
6.3.2 Measurement apparatus 117
6.3.3 Study Protocol and Analysis 118
6.4 Results 120
6.5 Discussion 120
6.5.2 Conclusions 124
CHAPTER 7: M E T H A C H O L I N E RESPONSIVENESS IN INFANTS 125
7.1 Summary 125
7.2 Introduction 126
7.3 Methods 127

9
7.3.1 Subjects 127
7.3.2 Measurement apparatus 127
7.3.2.1 Raised volume rapid thoracic compression technique.. 127
7.3.2.2 Low-frequency forced oscillation technique 128
7.3.3 Study protocol 129
7.3.4 Analysis 129
7.4 Results 129
7.4.1 Forced expiration 129
7.4.2 Low-frequency forced oscillation technique 130
7.5 Discussion 133
7.5.1 Comparison between low-frequency F O T and R V R T C 133
7.5.2 M c h responsiveness in normal compared to wheezy infants 134
7.5.3 Airway versus parenchymal responsiveness 134
7.5.4 Conclusions 136
C H A P T E R 8: G E N E R A L DISCUSSION 139
8.1 Methodological issues 139
8.1.1 Measurement of Zrs 139
8.1.2 Application of the constant-phase model to Zin 141
8.2 Findings of this thesis in context to the existing literature 143
8.3 Future directions 148
8.4 Conclusions
R E F E R E N C E S 151

11
ACKNOWLEDGEMENTS: This thesis would not of been possible without the support and help of many people and it
really reflects the work of a dedicated group, without w h o m I could never have succeeded
in this endeavour. In particular I would like to thank the following:
The three musketeers of infant physiology; Peter Le Souei; Steve Stick and especially Peter
Sly whose knowledge I have tried to absorb and to w h o m I extend m y profound gratitude.
The respiratory fellows; Hannes Wildhaber, Mark Hayden and Nigel Dore, your mask
holding and sedation skills enabled the collection of all the data contained in this thesis.
Your friendships I will retain always.
Feri Petak and Zoltan Hantos to whom I am forever in debt. Without your expertise none
of this would have been possible.
Shane Carson; your skills as a biomedical engineer are peerless.
Celia Lanteri and Debbie Turner, whose footsteps I have had to follow, thanks for showing
m e the way.
Belaroma coffee shop; for providing the best coffee in Perth. May you long prosper.
To the endless volleyball teams I have played with, to the numerous golf partners, to the
countless drinking buddies and especially Tigger. The hours out of work made the hours
in work bearable and kept everything in perspective.
To Karen Willet for her friendship, thoughts and opinions, support and so much more. This
thesis would be a hollow shell without you.

13
ABBREVIATIONS: The following abbreviations are used throughout this thesis and are usually shown in upper
case letters:
u, fluid viscosity
A cross-sectional area
C compliance
C F cystic fibrosis
C L D chronic lung disease
E elastance
FEV t forced expiratory volume (in t seconds)
FFT fast Fourier transform
F O T forced oscillation technique
F R C functional residual capacity
F V C forced vital capacity
G coefficient of tissue damping
H coefficient of tissue elastance
H G T head generator oscillation technique
I inertance
IBP infant whole-body plethysmography
ICU intensive care unit
I M integer multiple oscillation signal
Lt length
M c h methacholine
M E F V maximal expiratory flow volume
M E F maximal expiratory flows
N T M non-integer multiple oscillation signal
N S N D non-sum non-difference oscillation signal
O V W optimum ventilator waveform
P pressure
P E F V partial expiratory flow volume
R resistance
R T C rapid thoracoabdominal compression technique

14
R V residual volume
S/N signal-to-noise ratio
T G V thoracic gas volume
T L C total lung capacity
V volume
V flow
V'maxFRC the maximal flow and functional residual capacity
X reactance
Z impedance

15
NOTATIONS: The following notations are used in conjunction with the above abbreviations where the
abbreviation may be referred to by one or more specific regional and anatomical location
(e.g. Raw). The notations are usually shown in lower case or subscripted letters or numbers.
ao
alv
aw
aww
g
in
1
Irs
n
pl
rs
ti
(t)
tp
tr
w
airway o p e m n g
alveolar
airway
airway wall
gas compression
input
lung
lower respiratory system
nasal
pleural a
respiratory system
tissue
time (in seconds)
transpulmonary
transfer
chest wall

17
STATEMENT OF CONTRIBUTION: The work contained within this thesis could not have been completed without the help of
a number of people. The author had a significant input into the design of the protocols and
methodologies and the analysis and interpretation of the data contained within this thesis.
The author was responsible for the writing of this thesis, with P.D. Sly providing
supervisory assistance on interpretation and content. The following also contributed to
sections of this thesis:
Chapter 3: This work was presented at the 1998 Thoracic Society of Australia and New
Zealand (TSANZ) and the 1997 American Thoracic Society annual scientific meetings. The
work has been published as "Repeated Measurements of Airway and Parenchymal
Mechanics in Rats B y Using Low-Frequency Oscillations' in the Journal of Applied
Physiology (1998; 85(4), 1680-1686) by Petak F., Hall G.L. and Sly P.D.. The author
contributed significantly to the design of the protocol, the analysis and interpretation of the
data and co-wrote the first and subsequent drafts of the manuscript. Other contributors are
F. Petak and P.D. Sly.
Chapter 4: The data presented in mechanically ventilated patients was part of a larger study
examining the changes in mechanics prior to- and following thoractomy. The non-invasive
pulmonary data was collected in the intact chest condition, the author was solely responsible
for the collection of this data. The author significantly contributed to the analysis and
interpretation of the data. The data describing the influence of the nasal impedance on
respiratory system impedance was presented at the 1999 Thoracic Society of Australia and
N e w Zealand ( T S A N Z ) and American Thoracic Society annual scientific meetings. The
author was responsible for the collection and analysis of the data and significantly
contributed to the interpretation of the data. F. Petak, Z. Hantos, J.H. Wildhaber and P.D.
Sly also contributed.
Chapter 5: The data in healthy infants and the relationships between oscillatory mechanical
parameters and length has been presented at the 1998 European Respiratory Society (ERS)
and 1999 T S A N Z scientific meetings. The author contributed significantly to the collection,
analysis and interpretation of the data. The multivariate analysis described in the chapter

18
was carried out by K. Tiller and P. Burton of the Biostatistics department at the Institute
for Child Health Research. Z. Hantos and P.D. Sly also provided assistance in the
interpretation of the data.
Chapter 6: The author was solely responsible for the collection and analysis of the data in
asymptomatic, infants with recurrent wheeze. P.D. Sly contributed to interpretation of the
data.
Chapter 7: This data was presented in it's initial form at the 1998 TSANZ annual scientific
meeting. The author contributed significantly to the design of the protocol with assistance
from F. Petak and P.D. Sly, and was solely responsible for the analysis of the data. P.D. Sly
and Z. Hantos contributed to the interpretation of the data.

19
CHAPTER 1: REVIEW OF THE CURRENT LITERATURE
1.1 Overview of respiratory physiology
The physiology of the respiratory system has been investigated, dissected and disputed.
Scientists from biochemistry, pathology, molecular biology, immunology and
pharmacology have all had input into the current understanding of the respiratory system.
The biggest advances in recent times have resulted from rapid advances in biomedical
engineering. Experiments previously never considered are n o w carried out on a daily basis.
This section outlines the basic mechanics and physiology of the respiratory airways and
tissues and the models of the respiratory system used to garner this information.
1.1.1 Basic function and mechanics of the airways
The upper airways consist of the mouth, nose, pharynx and larynx and are designed to filter
and humidify, with the larynx acting as a valve separating the upper and lower airways. The
nasopharynx represents a major source of resistance within the respiratory system [1]
particularly within young infants which are preferential nasal breathers. The main airway of
the lung, the trachea, branches into left and right main bronchi. This branching continues
down to the alveolar sacs, with the total cross-sectional area increasing with each
generation. The initial 16 generations (trachea to terminal bronchioles) are known as the
conducting zone, the subsequent 3 (respiratory bronchioles) generations are the transitional
zone, with the final 3 (alveolar ducts and sacs) termed the respiratory zone. The large
trachea and main bronchi are supported by U-shaped cartilage which are joined posteriorly
by smooth muscle bands. Further down the airway tree (generation 2-11) this cartilaginous
support changes to irregularly shaped, helical plates. Beyond this point the airways are
directly embedded within the pulmonary parenchyma and there is no cartilage within the
airway walls. Instead, the caliber of the airway is maintained by the elastic recoil of the lung
and hence lung volume.
Within the conducting airways, gas flows by bulk flow. The resistance of these airways is
determined by the geometry of the airway and the flow of the gas passing through the

20
airways. In the transition and respiratory zones the bulk movement of the gas ceases, with
movement of the respiratory gases (0 2 and C 0 2 ) occurring by diffusion. The resistance of
these airways is also determined by the geometry and the flow of the gas. The geometry of
the intra-parenchymal airways is related to the localised elastic recoil pressure which is in
turn proportional to lung volume. In addition, flow is determined by diffusion and hence is
relatively small. Thus within the conducting and respiratory zones the predominant influence
on the resistance of the airways is lung volume. Most of the flow resistance in the intra
thoracic airways occurs in these lower regions due to the proportionally high total cross-
sectional area of these generations [1].
The inertance of the airways can be considered to be negligible during quiet breathing, but
at higher frequencies (>10 Hz) plays an important role. As inertance is directly proportional
to the acceleration of the gas (see Section 1.1.3.3 below) and as the intra-parenchymal
airways conduct flow by difilision, inertance will be primarily determined by the central and
upper airways.
The resistive and inertive mechanical properties of the conducting airways are independent
of frequency, as shown in a number of studies, in dogs [2,3], cats [4], rats [5] and in
humans [6,7].
1.1.2 Basic function and mechanics of the lung parenchyma
The lung can be grossly divided into two major functional components: lung parenchyma
containing the gas exchange tissue of the respiratory zone and the non-parenchyma
comprising the conduction structures, airways, blood vessels and the coarser connective
tissue components. The mechanical properties of the lung parenchyma are in part defined
by the connective tissues that are embedded within the lung tissues. This network of
connective tissue arises from a number of sources: 1) peripheral fibres originating from the
pleura and penetrating into the inter-segmental and interlobular septa; 2) axial fibres,
consisting of tissue sheaths extending out from the airway tree into the acini region,
becoming the fibrous network surrounding the alveolar ducts and; 3) the alveolar septal
fibers which join axial and peripheral fibre networks and interlaces with the capillaries [8,9].
The other major factor affecting the parenchymal mechanics is the large air-liquid interface

21
lined with surfactant controlling surface tension [9]. These two factors can be loosely
described as the tissue and surface mechanical factors. The manner in which they interact
defines the mechanical properties of the lung parenchyma.
The elements of the peripheral fibre network increase with the cube root of lung volume,
while at a fixed lung volume this system is relatively independent of increasing surface
tension [8]. The axial fibre network consists of force-bearing elements forming the helical
structure of the alveolar ducts, while the septal tissue network of the alveolar walls links
these force-bearing elements and the rims of the adjacent alveolar ducts. This network is
extended by the surface tension acting on the alveolar walls, as surface tension increases,
the ducts widen and the alveolar walls shorten by rearrangement of the septal tissues [8].
The alveolar surface lining layer (surfactant) regulates the mechanical forces that arise at
the air-liquid interface. The surfactant layer reduces the acting surface tension of the alveoli,
hence increasing the elasticity of the lung and reducing the work of breathing. In addition
the surfactant layer also tends to increase the stability of the alveoli and keep the alveoli dry.
The interaction between surface and tissue forces depends on the volume history of the
lung, for instance at functional residual capacity (FRC) following an inflation to total lung
capacity (TLC) the surface tension approaches zero and hence the elastic recoil of the lung
is dominated by the tissue forces [10]. However, following prolonged tidal breathing,
surface tension increases and volume decreases causing surface forces to contribute
increasingly to the elastic recoil.
The mechanical properties of the respiratory tissues are highly dependent upon the
frequency at which the measurements are made. This frequency dependence of the
respiratory tissue mechanics is well established with work in both animal [11-15] and
human studies [7,16-21].
1.1.3 Modelling the respiratory system
In order to study respiratory mechanics the system under investigation must first be defined,
allowing the behaviour of the system to be investigated under a number of conditions. The
advancement of mathematics, physics and engineering has allowed the behaviour of gas,
liquid and solid substances under a variety of physical conditions to be defined. These

22
definitions have been used by physiologists to further characterize the behaviour of the
respiratory system. The use of mechanical and electrical modelling has allowed the naturally
dynamic state of the respiratory system to be investigated in further detail. Any system can
be described as a collection of elements, whether the system be the upper airway, lung
parenchyma, chest wall or the complete respiratory system. These elements are described
according to their use or storage of energy and are called resistances, elastances and
inertances. Respectively these three elements handle energy in a unique way: dissipation of
energy by way of friction (viscous), storage of energy using potential energy (gravitation
or elastic) and storage of energy by means of kinetic energy [22].
In respiratory mechanics these elements are characterized in terms of pressure changes
across an element (AP) and the corresponding flow ( V ) passing through the element. The
relationship depends on the element's geometry and physical characteristics and is called
the constitutive relation and is defined as:
P = f ( V ) -(1)
1.1.3.1 Resistance
A n ideal fluid resistor exhibits a decrease in pressure directly proportional to flow such that:
P = RV(t) -(2)
where: R=resistance and t=time
The simplest version assumes a low flow-pressure relationship, with a steady laminar flow
at a low Reynolds number (exhibits a parabolic velocity profile) in a straight tube of length
(L) and cross-sectional area (A) containing a fluid of known viscosity (|i) and hence
resistance of the tube, of radius (r) is given by Poiseuille's formulae [22]:
R = 8 |iL /TC r4 -(3)
In the presence of bias flows or at higher frequencies the resistance may become dependent
on other factors such as frequency (f) or density (p). In this case resistance can be
approximated as:
R « R D C + L(V2 u / TC r4)(r2 co /v)1/2 -(4)
where: R D C is the resistance calculated from the steady state flow-pressure relationship, v
is the kinematic viscosity (u/p), © is the angular velocity (27if).

23
If the flow is passing through an orifice then the pressure drop across the orifice is
proportional to the square of flow and hence resistance may be given as [22]:
R = |V|p/(2Cd2Ao 2) -(5)
where: Cd is the discharge coefficient and A o is the orifice area.
Thus resistance is a complex relationship between flow and pressure, the nature of which
will be defined by the length and radius of the tube and the viscosity and density of the fluid
passing through it. In the case of a distensible cavity with viscous walls (such as found in
the parenchyma), resistance may be described as a function of the geometry of the unit
involved and its visco-elastic moduli. Resistive elements dissipate heat proportional to the
friction or viscance of the fluid within the tube [22].
1.1.3.2 Elastance
A n ideal fluid elastance (E) exhibits pressure changes in proportion to volume (V). The rate
at which volume changes is the volumetric flow rate and so:
P(t) = EV(t) -(6)
Within the respiratory system the most important source of fluid elasticity is gas
compressibility. This represents a major source of elastance at higher frequencies which
tend towards an adiabatic condition [22]. In this case elastance is a linear function expressed
as:
E = pPo/V0 -(7)
where: P is unity if gas compression is isothermic and is the ratio of specific heats if it is
adiabatic, V 0 is an ideal gas volume at an absolute mean pressure Po.
The behaviour of a solid elastance is dependent on the geometry of the object and its elastic
moduli. Within the respiratory system solid elastic elements tend to be dependent on volume
history and are profoundly non-linear. Solid elastances may be linearized to a reference
volume. Hence the tangent slope at a particular point on the pressure-volume curve is the
elastance at that volume and is termed the incremental modulus [22]. Within the respiratory
system airway walls, chest wall and lung parenchyma are examples of solid elastances.

24
1.1.3.3 Inertance
In the absence of viscosity, the pressure or force (F) applied across a tube of area A and
length L is proportional to the acceleration (du/dt) and the mass (pLA) of the fluid in
accordance with Newton's law.
F = /2PLA (du/dt) -(8)
where: n = 1 if the velocity profile is blunt and 4/3 if parabolic, p is the fluid density, u is
the fluid velocity and d/dt represents a rate of change with respect to time t.
At higher frequencies and in large ducts (or airways) the velocity profile will tend towards
a blunted aspect. The ideal elemental equation for inertance (I) relating flow to pressure is:
P(t) = I(d/dt)V(t) -(9)
where: I = «pL/A -(10)
It can be seen from the ideal elemental equation that inertance is largest during rapid flow
changes and zero during periods of constant flow. For a solid object of mass M and area
A, the solid inertance can be given as: I = M / A 2 -(11)
In this instance flow represents the rate of volume passing around the surface of the solid
object. Within the respiratory system the motion of the chest wall or airway dilations are
examples of solid inertances [22].
1.1.3.4 Models of the respiratory system
The elements described above can be combined to produce a model that will attempt to
explain the behaviour of the respiratory mechanics under certain defined conditions. The
remainder of this section outlines some of the more common models of the lung, their
advantages and limitations.
A mechanical model of the lung was initially introduced by Otis etal [23]. It allowed for
a single compartment of constant elastance attached to a constant flow resistor. It assumed
that lung volume and flow did not affect the mechanical properties of the respiratory system
and that inertial properties were negligible and was represented as:
P(t) = EV(t) + RV(t) -(12)

25
While these assumptions are an oversimplification of the respiratory system, it is a
reasonable assumption for quiet breathing with small tidal volumes. Initial techniques
utilizing this or similar models were restricted by the available technology but recent
advances in computer technology have allowed the multiple regression analysis technique
to be applied to the model described above. Under dynamic conditions, the inertial
properties of the respiratory system should be allowed for and hence the lung can be
modelled as:
P(t) = EV(t) + RV(t) + IV"(t) -(13)
All models of the lung assume linearity. That is, the resistive, elastic and inertive
components do not alter under different measurement conditions. In nature the respiratory
system is dependent on volume history, volume and flow. Similarly the volume-pressure
relationship of the respiratory system in not linear, but rather sigmoid. If the limitations of
the models used are understood and the conditions under which measurements are made
kept within certain, known boundaries, then linear models of the lung can provide valuable
information.
If overdistention occurs, for example in ventilated patients with lung disease, then the model
used to track respiratory mechanics may require a volume-dependent elastic component
[24]. This volume dependence of the respiratory system can be accounted for by including
an extra component in the above equation such that:
P(t) = (El + E2V)V(t) + RV'(t) + IV"(t) -(14)
where: El and E 2 are the non-volume and volume dependent components, respectively.
The use of this model may improve the interpretation of pressure-volume data even if there
is no evidence of over-distention [25].
A time-varying sinusoidal signal (such as tidal breathing) can be written as a function of
frequency rather than time. If w e examine an idealized tidal breathing trace (represented as
a sinusoid in Figure 1.1 below), the time taken to complete a single breath is called the
period (T) of the signal. The number of breaths per second is termed the frequency (f) and

26
is the reciprocal of the period (T = 1/f). The breathing frequency can also be given as:
(D=27rf - 0 5 )
where co is the angular frequency.
Any periodic signal can be written as a vector with a corresponding phase angle (9).
Giving an equation: X = Bcos(cot), Y = Bsin(cot) -(16)
and cos(oot) = sin(cot + 7t/2)
where: X and Y represent the real and imaginary components, respectively; B is the
magnitude of the signal at a given point and (cot) represents the angle 0 at that point.
Figure 1.1: Idealized tidal breathing trace. A m p , amplitude; T, period; oo, angular frequency.
If the real component (X) represents that portion in phase in flow, then the imaginary
component (Y) represents that portion out of phase with flow, where the phase difference
is 90°. If w e then equate this to a point in the complex plane, w e could replace these two
equations with a single equation of motion such that:
W = X + jY = A m p (cos(oot) + j sin(ot)) -(17)
= A m p eJ<at
where: W is a complex number and j = V-l
Hence if equation 17 is rewritten in terms of the variation in flow at the airway opening can
be written as:
V(t) = V(oo) cos(cot) = V'(co) e""* -(18)
Similarly, pressure can be written as:
Pao(t) =Pao(co) cos(cot+0rs) = Pao(oo)ej(<Bt + 0is) -(19)
where Grs accounts for the phase shift of the pressure wave relative to the flow.

27
The impedance (Z) can hence be written as the complex relationship between flow and
pressure and is represented as:
Zrs = Pao(oo) <P*+** / V(a>) e*01
= (Pao(oo)/V(a)))eie,B
= |Zrs|eiere -(20)
where |Zrs| is the magnitude of the pressure difference relative to the flow and a phase angle
9rs indicating the phase angle of the pressure difference relative to flow [22].
Thus a signal of any kind can be represented as an amplitude and a phase angle or
frequency. This can be extended to a signal that is a combination of a number of individual
frequencies as represented below
f(x) = Bi * > " + B 2 e^24 + B 3 J*
31 + .... -(21)
This form of representation is termed a Fourier series. By breaking a complex signal into
its composite frequencies it can be analyzed more efficiently, producing a graph that plots
magnitude on the y axis and frequency on the x axis. So by using a Fourier transform, a time
varying signal applied at the airway opening can be decomposed into its constitutive
frequencies and the flows and pressures at those frequencies analyzed to produce a
respiratory system impedance.
The mechanics of the respiratory tissues are frequency dependent. The ratio of pressure to
flow at a frequency oo is the respiratory impedance (Z), such that:
Z = P ( ( D ) / V ( G ) ) -(22)
Impedance is a generalization of resistance, but whereas resistance describes only resistive
(or frictional) induced pressure differences, impedance describes pressure differences across
resistive, elastic or inertive elements [22]. The respiratory system impedance (Zrs) can be
divided into its real (resistive, Rrs) and imaginary (reactive, Xrs) components:
Zrs = Rrs+jXrs -(23)
The real component is that portion of the impedance in which the pressure changes are in

28
phase with the changes in flow, whereas the imaginary component is the part of the
impedance which is out of phase with flow. If this approach is applied to the R-I-C models
described above then impedance can be given as:
Z = R + j © I - l / © C -(24)
This model can be applied to each of the components of the respiratory system, providing
their pressures and flows can be determined [22]. As described above the mechanics of the
respiratory system are frequency dependent, however this frequency dependence differs for
Z = R Z=j©I Z = -j(E/G>)
Figure 1.2 Resistance-Inertance-Compliance model.
the various components of the respiratory system (airways versus parenchyma) (See Section
1.1.1 & 1.1.2). At low frequencies ( < 2-4 Hz) the respiratory tissues dominate the
resistance and reactance of Zrs, but with increasing frequency this contribution decreases.
At frequencies above 10 H z the mechanical properties of the airways account for the
majority of Zrs. It is possible to separately determine the airway and tissue mechanical
properties of the respiratory system by the use of a model that includes both airway and
tissue compartments. One such model is the constant-phase model of the lung which has
an airway compartment containing a resistance and inertance, and a viscoelastic tissue
compartment that exhibits a stress relaxation response with a pressure decay described as
a power-law in time. [3,4,26]. This constant-phase model (CPM) of the lung has two tissue
properties: tissue damping (G) and tissue elastance (H) and these relate to Rt and Et as
shown:
Rt = G/©a, Et = H(©/©a) -(25)
where: a = (2/7t)tan"1(H/G)
Hence the constant-phase model of the lung can be given as:

29
Z = R + j©I + (G - jH)/©a -(26)
The CPM of the lung allows the simultaneous assessment of the airway and tissue
components without the use of more invasive techniques, such as alveolar capsules. T o do
this the model must make certain assumptions. The lung is assumed to be a linear system
with a single airway resistance and inertance and a homogeneous tissue compartment. The
assumptions of the model will only remain valid under these conditions. Should peripheral
airway inhomogeneities or regional tissue changes occurs then the model may no longer
produce a valid separation of the airway and tissue compartments. Lutchen etal.[27] used
a model to investigate the role of airway inhomogeneities, airway wall shunting and tissue
viscoelasticity on the frequency dependence of the respiratory tissues, in addition the
authors examine the role of lung inhomogeneities and airway wall shunting to the estimated
airway and tissue parameters derived from Zrs. The authors simulated various levels of
airway constriction and showed that under conditions of severe constriction the frequency
dependence of the tissues increased and that the C P M produced an overestimation of the
tissue damping and hysteretic properties of the respiratory tissues [27]. These results have
been confirmed in animal studies [5,28]. Using alveolar capsules Lutchen et al [28] showed
that separation of airway and tissue properties using the C P M were reasonably consistent
with those values derived from alveolar capsules, even under conditions of moderate
constriction. A further study by Petak and coworkers [5] used an inert gas to demonstrate
that the C P M was able to accurately separate the airway and tissue compartments of the
lung under normal and moderately constricted conditions. Under severe constriction the
authors showed an increase in tissue damping not mirrored by changes in H, a decrease in
inertance and large increases in hysteresivity. These changes were attributed to peripheral
airway inhomogeneities [5]. Thus the constant-phase model allows the non-invasive
separation of Zrs into airway and tissue mechanical properties. Under normal conditions and
during moderate constriction the model has been shown to reliably partition Zrs. However,
if airway inhomogeneities occur, such as following severe constriction then the model may
not longer accurately represent the mechanical properties of the respiratory system.
The first model put forward taking into account the frequency dependence of the
respiratory system was that of DuBois [29] (Figure 1.3). This model can be applied to either

30
input or transfer impedance data (see Section 1.3.1) and as data from Ztr techniques are
influenced by gas compressibility it is the most appropriate model for this method [29].
The models described above assume a single airway resistance and are termed lumped
parameter models. Inherent in their assumptions are that the airways are rigid, and that
ventilatory patterns are homogeneous to all regions of the lung. Lumped parameter models
are limited if the distribution of flows and pressures in the upper and lower airways is of
interest. If the physical properties of the airway tree (such as airway geometry, wall
properties or branching) are to be investigated or if the oscillatory frequencies are high
enough that standing wave phenomena occur in the airways. In these cases a distributed
model of the lung should be used [22].
Z a w Zti
Vao Vbs
— Pb = 0
Figure 1.3: Electrical equivalent of the DuBois model. Zaw, Zt and Zg represent the impedances of the airways,
tissues and alveolar gas compartments, respectively. The forcing signal may be applied at the airway opening
(Pao) or at the body surface (Pbs).

31
A distributed model of the lung takes into account the spatial dimensions and branching
topology of the airway tree. Pressures and flows are calculated not at access points such
as the airway opening or at the alveoli but at every airway position between the two. In
addition, the parenchyma is not considered one compartment, but rather a widespread organ
with possible differing pressures and volumes throughout [22]. The mechanics of a section
of airway, of length dx, can be described by a series impedance of resistance and inertance
in parallel with a gas compliance, such as due to compression (Cg), gas thermal
conductance and airway wall distensions (Iaww, R a w w and E a w w ) and includes the
mechanical support of the surrounding lung parenchyma.
The distributed model of airway mechanics requires certain assumptions to be valid: the
pressures at the junctions between airways must be equal and net flow into an airway
bifurcation must be zero. Both conditions can be met if low-amplitude flow oscillatory
signals are used [22]. Once the impedance in a segment is calculated, recursive analysis is
used to calculate the mechanics of the whole airway tree and by using a distributed model
the mechanics at a given airway generation can be determined. These models however,
assume constant mechanical properties of all airways within a generation. A stochastic
model allows for a range of airway diameters and lengths within an airway generation [30].
A n extension of this model which allows for varying airway wall thickness has been used
to demonstrate that the variability in airway responsiveness can be replicated when the
distribution of airway properties within the lung are taken into account [30]. A distributed
model has also been applied to the non-linear stress-strain characteristics of the lung
parenchyma by Maksym and Bates [31]. The authors introduced a model accounting for the
mechanical properties of elastin and collagen fibres within a canine lung tissue strip and for
pressure-volume curves obtained from normal, emphysematous and fibrotic lungs.
1.2 Measurement of respiratory mechanics in infants
During the first two years of life the respiratory system undergoes profound developmental
changes, which until recently were not clearly understood. Over the past ten years the
number of techniques available to monitor respiratory mechanics in infants has greatly
improved, increasing the knowledge of both normal developmental changes and progression
of disease in this age group.

32
The joint committee of the A T S assembly on Paediatrics and the E R S Paediatric assembly
categorized these infant pulmonary function tests into the following areas: measures of
forced expiratory flow, measures of compliance and resistance, measures of lung volume
and other tests (including measures of tidal volume, respiratory patterns, chest wall motion
and gas mixing)[32]. This thesis concentrates upon the developmental aspects of the low-
frequency forced oscillation technique (FOT) as it pertains to infant lung function. Those
techniques currently available will be briefly reviewed, followed by a detailed account of the
F O T , its use in older children and adults, the basic underlying assumptions, interpretations
and applications surrounding its use.
1.2.1 Measures of forced expiratory flow
The maximal expiratory flow-volume relationship ( M E F V ) has played a central role in the
evaluation of the function of the intra-thoracic airways [32]. Within older children and
adults, the measurement of M E F V via spirometry is the standard lung function test.
The investigation of flow-volume relationships in infants has lead to the development of a
number of techniques. While these tools have contributed much in the way of valuable
information about the developing respiratory system there exists a number of controversies
surrounding the techniques and their interpretation [33,34].
The forced deflation technique was initially carried out in 1977 by Motoyama [35] and
involves inflating the lungs to a raised volume followed by the application of a negative
pressure. The negative pressure is applied until residual volume (RV) is reached or to a
maximum of 3 seconds and results in increased flows over the whole volume range. The
procedure is repeated until 3 identical M E F V curves are acquired and from these,
measurements of forced vital capacity (FVC) and forced expiratory volumes (FEVt)can be
obtained. Maximal expiratory flows (MEF) at volumes equating to 1 0 % (MEFio) and 2 5 %
(MEF2 5) of F V C from R V are determined and the ratios MEF10/FVC and M E F 2 5 / F V C
calculated which are thought to represent an index of the upstream airway segment [36].
While published data from the technique are limited, the results appear to be highly
reproducible. This technique is limited to intubated patients and thus its widespread

33
application as a diagnostic tool in infant lung function is doubtful.
The rapid thoracic compression technique (RTC) [37] is a common technique for assessing
lung function in infants. Baseline studies have been conducted in healthy infants [38], infants
with acute and chronic lung disease [39] and infants with cystic fibrosis (CF) [40]. In
addition, airway reactivity using dilator and constrictor agents has been examined [41-43].
For the R T C technique infants are sedated and a sudden pressure is applied to the thorax
at end-tidal inspiration using a positive pressure source attached to an inflatable jacket [44].
The resultant forced expiratory flows are plotted to produce partial expiratory flow-volume
(PEFV) curves. Prior to the R T C manoeuvre, F R C is determined as an identifiable end-
expiratory point and maximal flow at F R C (VmaxFRC) is then reported. The R T C
technique is surrounded in controversy centred around the active control of end-expiratory
lung volume in infants and the question of whether or not flow limitation has been achieved
during the R T C manoeuvre [32]. F R C is known to vary with dead space, sleep state and
disease state [45] and this variation may be responsible for the high variability of V m a x F R C
in normal infants [44]. Further variability in V m a x F R C may result from the possible lack
of flow limitation during the R T C manoeuvre [32]. While flow limitation has been achieved
in infants with bronchopulmonary dysplasia (BPD) or severe airway obstruction [32],
information regarding flow limitation in normal infants is lacking.
The flow-volume relationship obtained with the RTC technique is contained solely within
the tidal volume range. In adults and older children, the use of an extended volume range
has been shown to produce more useful measures of forced expiration than those produced
from the tidal volume range. This principle has been applied to infants using the raised
volume adaptation of the R T C method ( R V R T C ) [46,47], thus allowing measurements of
FEV t to be determined. The infant's lungs are raised to a standard inflation pressure (20
c m H 2 0 ) , with the jacket compression force also standardized to transmit a further increase
of 20 cirdHfeO to the airway opening [48]. This standardization of transmission pressure
results in pressure-independent forced expiratory flows and ensures that comparisons
between individual infants and laboratories can be made [48]. While this technique avoids
many of the limitations associated with the R T C method it does not ensure that flow
limitation occurs. It could be argued that as the volume to which the infants lungs are raised

34
and the applied compressive pressure is standardized, then it is not necessary to produce
flow limitation. Further work into this question is still needed. While little data exists on the
ability of the R V R T C method to determine the difference between normal and diseased
groups it appears that the technique will provide better assessments of airway function that
the R T C method.
The RTC and RVRTC methods allow non-invasive measurement of lung function in infants
and as such have a wider application than the forced deflation technique. Overall, these tests
can only provide information on limited changes within the lung. Information is not
available on the behaviour of the airways or the tissues separately and as such these
techniques can only provide a finite amount of information on the development of
parenchymal disease or the relative growth patterns of the airways and pulmonary tissues
in normal development.
1.2.2 Measures of compliance and resistance
The number of techniques developed to measure compliance and resistance has grown
rapidly. These techniques can be split into two approaches: firstly, measurement of lung
mechanics during a number of complete cycles of spontaneous breathing or mechanical
ventilation and secondly, the determination of respiratory system resistance (Rrs) and
compliance (Crs) during controlled flow conditions, such as relaxed expiration or zero flow.
These are termed dynamic and occlusion techniques, respectively. While the application of
techniques and interpretation of results differ, a number of important clinical and
physiological investigations have been carried out. The underlying assumptions and
limitations of the main techniques are reviewed, as well as the information that can be
obtained:
1.2.2.1 Dynamic techniques
The dynamic mechanics of the respiratory system describe the mechanical behaviour of the
chest wall, lungs and airways throughout the breathing cycle or, less commonly, during
mechanical ventilation. The assessment of dynamic mechanics relies on the measurement
of pressure cycles and changes in flow and volume that these pressures produce [49].
Dynamic mechanics have been assessed through a variety of models or in combination with

35
other methods, such as plethysmography, forced oscillation and the interrupter technique.
The background, underlying assumptions and limitations of the various analytical models
used in this technique have been outlined previously (Section 1.1.3.4) and the forced
oscillation technique is described in detail in Section 1.3.
Whole-body plethysmography was first described in adults in 1956 [50] and was rapidly
customized for use in an infant population [51]. Infant whole-body plethysmography (IBP)
is an important tool for the simultaneous assessment of lung volume and airway resistance.
For this technique the infant is placed inside a closed chamber and breathes through a
pneumotachograph, allowing tidal flow and hence tidal volume to be determined. Following
a brief occlusion of the airway opening, changes in airway pressure (Pao) and hence
alveolar pressure (Palv) can be assessed. These changes allow thoracic gas volume ( T G V )
to be calculated. Airway resistance is determined by keeping the respired gas saturated at
body temperature and pressure (BTPS conditions), and relating changes in Palv to
concurrent changes in flow. Regression equations for R a w have been reported in infants up
to two years of age [32,52]. The values have been found to vary with race, gestational age
and the flow at which the measurements are determined. Disadvantages of the IBF
technique is that it requires complex equipment and considerable training is needed in order
to produce reliable results. In addition a number of assumptions must be made, most of
which apply to the measurement of T G V and have hence been detailed in Section 1.2.3.
Overall, the use of the IBP technique has been limited and while useful information has been
produced, it is not suitable for bedside investigations and is unlikely to obtain widespread
use as a clinically acceptable technique for infant lung function [32].
The interrupter technique is a useful method for partitioning the respiratory resistance into
airway and tissue components. W h e n the airway is occluded during expiration there is an
abrupt increase in pressure (Pinit) followed by a slower, secondary rise in pressure to a
plateau. The difference between the total change in pressure and Pinit is Pdiff and represents
the tissue visco-elastic component [53]. If the correct equipment and analysis is used, then
reproducible and reliable estimates of airway and lung tissue mechanics can be
determined. [54]. However, investigators have shown that errors can be introduced by
unsupported upper airways [54], volume history [55,56] and by ventilation inequality that

36
may be present in infants with parenchymal disease [57]. While studies have been conducted
in dogs [56], cats [55,58] and rodents [59], in humans most studies have been conducted
within the intensive care environment [60,61]. Recently the technique has been applied to
awake healthy children [62-64]. However the technique has been limited to that of a
research tool and is unsuitable for use in healthy infants.
1.2.2.2 Occlusion techniques
While dynamic techniques have supplied a wealth of information regarding the mechanical
behaviour of the airways, lung and chest wall in patients with respiratory disease, those
studies examining the properties of healthy infants have only been able to recruit small
numbers. Less invasive occlusion techniques have shown themselves to be useful in
obtaining data in healthy infants. The measurements however, reflect the entire respiratory
system. In young infants, the chest wall is highly compliant relative to the normal lung [65].
This changes as the infant grows, with the relative contribution of the chest wall increasing.
B y two years of age, the contributions of the chest wall and lung to the respiratory system
compliance are approximately equal [65]. The underlying assumption for all occlusion
techniques is the complete relaxation of the respiratory muscles. In most cases this is done
by invoking the Hering-Breuer reflex [66]: the infant's lungs are held above F R C causing
a stimulation of stretch receptors and an inhibition of inspiratory effort, thus prolonging the
expiratory pause and relaxing the respiratory muscles [67]. During these periods of
relaxation, Pao will reflect the elastic recoil pressure of the respiratory system allowing Rrs
and Crs to be calculated [32]. The most c o m m o n occlusion techniques are the occlusion
technique itself and passive flow-volume and weighted spirometers. The occlusion
technique also has a number of adaptations. These are the multiple occlusion, single-breath,
multiple interruption and expiratory volume clamping techniques.
Occlusion techniques rely on the assumption that during airway occlusion Pao reflects
elastic recoil. This may not be the case if the respiratory muscles are not completely relaxed,
or pressure throughout the respiratory system has not equilibrated [32,67]. Equilibration
may be a problem in infants with severe airway obstruction [68]. Results may also be
influenced by a change in the state of the patient or the measurement conditions. These may
include sleep state, health of the infant, changing position or addition of pharmacological

37
agents that cause changes in the respiratory system (such as constrictors, bronchodilators
or sedatives). Currently, the techniques used have not been standardized and as such
comparison of results is difficult. Passive respiratory mechanics are non-invasive, simple to
use and well tolerated by most infants. The techniques have been used to assess the
influences of smoking, growth and gender in a population of healthy infants [69]. Crs has
been examined in healthy preterm infants [70] and in ventilated infants [71,72] as well as
a variety of other investigations [73-75]. The technique can be applied to both
spontaneously breathing and mechanically ventilated subjects. The major limitation is that
the techniques cannot separately determine the properties of the airways and lung tissues.
In neonates and young infants where the majority of disease is parenchymal in origin this
may play a major role in a decision on which technique should be used.
1.2.3 Measures of lung volume
The volume dependence of the respiratory mechanics is well established [76-79]. Hence it
is important to have a volume landmark with which to compare the mechanical
characteristics of the respiratory system. In infants the most commonly measured lung
volume is F R C [32]. This section outlines the three most widely used techniques to
determine FRC: whole-body plethysmography, helium dilution and nitrogen washout.
Infant whole-body plethysmography has allowed investigators to simultaneously determine
R a w and thoracic gas volume ( T G V ) (as discussed in Section 1.2.2.1). The technique has
the advantage that it determines all gas within the respiratory system, thus allowing an
assessment of the amount of gas trapping in obstructive lung disease [80]. Four major
assumptions must be made in using IBP to determine T G V [81]. These are: 1) there is no
flow in the airway during occlusion, 2) pressure changes applied to the lung are
homogeneous within the pleural space, 3) pressure-volume changes are limited to the
volume of gas within the thorax, and 4) changes in pressure and volume are isothermal.
If the upper airway acts as a shunt during airway occlusion, then flow may occur hence
leading to an overestimation of T G V [82,83]. Eber et al [84] have shown that unequal
alveolar pressures occurring due to significant airway obstruction may cause an
overestimation of T G V in wheezy infants. If the occlusion is activated at end-inspiration,

38
and thus higher lung volumes, then the pressure equalization time between areas of the lung
will decrease, hence minimizing the potential overestimation [85]. During disease, regions
of the lung with high resistance and elastance may act as rigid spheres and gas trapped
within these spaces may not be subjected to rarefaction or compression. Under- or
overestimation of T G V in infants recovering from bronchiolitis [86] or airway obstruction
[87] has been reported. The volume of gas located within the gastrointestinal tract would
be included in an estimate of T G V , however, this volume is thought to be insignificant.
While this has been confirmed in adults [88] and in healthy and sick infants [68] it may be
possible that under conditions of increased abdominal gas such as in patients with cystic
fibrosis (CF) there is potential for the introduction of errors to the measurement of T G V
[81]. The construction of the plethysmographic chamber will influence transmission of heat
across the walls of the chamber. If the chamber is calibrated to the approximate rate of
respiratory efforts and size of the chamber chosen carefully then introduced errors can be
compensated for [32]. However, the highly variable respiratory rate in infants that may
occur during a test, or following the administration of inhaled agonists will continue to
provide a source of error. While reference values have been derived for F R C in infants, IBP
is limited due to the expense of equipment and the considerable operator training required.
The most common method for measuring FRC in infants is the helium dilution technique
[89]. The technique has been applied to infants with bronchiolitis, C F and respiratory
distress syndrome and uses the gas equilibration principle occurring between an unknown
gas volume and a known gas volume in communication with each other [32]. The
equipment used is relatively inexpensive and can be applied in outpatient and I C U settings.
The determination of F R C assumes that equilibrium occurs between all lung units and the
airway opening. If gas trapping is present due to severe obstructive airway disease then the
measured F R C may be underestimated. Underestimation may also occur if the inspired
oxygen is high [32].
The nitrogen washout technique measures the volume of nitrogen washed out of the lung
during a period of time as the infant re-breathes from a nitrogen free gas source. The
required equipment is less complex than that required for plethysmographic or helium
dilution techniques. If a mass spectrometer is used, then an open circuit system without a

39
collection bag can be used [32]. Errors can be introduced due to analyzer response time,
lag time between flow and gas concentration and sampling rate [32]. In addition,
corrections must be made for nitrogen originating from the tissues and blood, which
typically can be up to 5 % [90], but may be larger in infants with lung disease. The technique
has been used to provide information on infants with chronic lung disease (CLD) [91],
respiratory failure [92] and in mechanically ventilated infants [93].
1.3 The forced oscillation technique
The use of the forced oscillation technique (FOT) to predict the mechanical properties of
the respiratory system was first carried out by DuBois et al. in 1956 [29]. The authors
concluded the airways could be characterized as a resistance-capacitance system, leading
to the chest wall and diaphragm which was suggested to be represented as visco-elastic
massive surfaces. This technique has gone from the gross clinical tool described by DuBois
to one able to provide specific insight into the physiology and mechanical behaviour of the
respiratory system [94]. In its most basic form, the F O T uses small time-varying forces to
perturb the respiratory system. The responses deduced from these perturbations give
information about the structural and mechanical properties of the respiratory system [22].
Due to the flow and volume dependence of the respiratory airways and tissues (see Section
1.1.1 and 1.1.2 above), the construction of the oscillatory signal is of crucial importance.
The simplest way of determining the frequency dependence of the respiratory system
mechanics is the successive application of sinusoids of different frequencies. However, this
is a time-consuming procedure susceptible to changes in patient condition. The use of
known signals and appropriate signal processing allows simultaneous determination of the
Zrs across a defined frequency range. These signals can take three forms: 1) random noise;
2) a train of impulses and; 3) composite signals. Random noise is disadvantaged due to the
'noise' of the respiratory system (e.g. spontaneous breathing or inadequate respiratory
muscle relaxation) hence resulting in a low signal to noise (S/N) ratio. The use of composite
signals allows the total signal energy to be maximized for a given amplitude limit and for
the S/N ratio to be optimal across the whole frequency range [95]. This can be carried out
by weighting the amplitude of the signal towards the lower frequencies and assigning the
phase of each frequency component such that the peak-to-peak amplitude of the signal is

40
minimized [95]. This optimized signal can then be applied to spontaneously breathing
patients without discomfort [95], or if an apnoeic period is induced, the low-frequency Zrs
spectra determined [96]. Another approach is to create the signal such that it delivers
sufficient volume to maintain gas exchange, while minimizing the peak-to-peak Pao, termed
optimal ventilation waveforms ( O V W ) [97] (See Section 1.3.1 below).
The second consideration in signal construction is the frequency components to use. As the
parenchymal mechanics exhibit nonlinear behaviour (e.g. volume dependent behaviour) the
respiratory impedance will be a function of both the linear (frequency dependence) and
nonlinear (volume dependence) behaviour of the lung tissue mechanics [98]. It is thus
desirable to minimize the influence of these non-linearities. One approach is to construct a
signal where the S/N ratio is maximized and the peak-to-peak pressure amplitude and flow
minimized [99]. Properly constructed, small amplitude oscillations should not affect the
respiratory mechanics. Peslin et al. [100] demonstrated that in ventilated rabbits the
oscillatory signal did not affect either baseline lung mechanics or the lung response to
histamine. If the measured system is nonlinear, then output harmonics can be produced that
match the periodicity of the input signal and thus the measured impedance will be a function
of the spectral characteristics of the input signal used [98]. The presence of non-linearities
may not be detected by the coherence function (y2) when using composite signals, as y2 will
only differ from unity in the presence of extraneous noise [99]. A second approach to
reduce the effects of distortion is the use of periodic signals with a selection of frequency
components that are not multiples of the fundamental harmonic [99]. This introduction of
non-integer multiple signals (NTM) reduces the effects of harmonic distortion within the
system as the nonlinear harmonics produced by the system will not interfere with frequency
components in the forcing signal. Using a nonlinear model of the lung, Daroczy et al [99]
demonstrated that the N T M signal leads to a significant improvement in impedance
estimation when compared to a standard composite signal. However, M M signals are still
subject to nonlinear distortions associated with inter-modulation between frequency
components of the input (termed 'cross-talk') [98]. Cross-talk occurs when some of the
energy component at a frequency is folded back onto a lower frequency, so as to cause the
energy magnitude at that lower frequency to contain some proportion of the higher
frequency (i.e. the input signal of amplitude A at frequency f2, corrupts the output at fi)[98].

41
The influence of cross-talk on the Zrs obtained using N T M signals has been confirmed by
Suki and Bates [101]. Using a nonlinear viscoelastic model, the authors demonstrated that
under conditions of increased ventilation amplitude and distortion the nonlinear cross-talk
increased such that it could no longer be regarded as negligible [101]. Furthermore, these
distortions will not be reflected in the y2 [98]. Non-sum non-difference pseudorandom
signals ( N S N D ) were recently introduced to minimize non-linear cross-talk [98]. However,
the authors demonstrated that if the non-linearities exceeded that of a second order system,
then it was necessary to use a 4th order N S N D signal (NSND-4) to completely eliminate
non-linear cross-talk from the impedance spectra estimated from a simulation study. The
investigators repeated this experiment in a single anaesthetized, tracheotomized and
paralyzed dog showing that the N S N D - 4 signal produced smooth estimates of Ers and Rrs
at all frequencies, while a N T M signal produced an impedance with smooth estimates of Rrs
and biased Ers estimates, whereas the composite signal produced Rrs and Ers values that
were clearly biased, particularly at low frequencies [98]. A further advantage of N S N D
signals is the reduced number of frequency components within the signal, allowing higher
energies to be assigned to the individual components within the signal. The disadvantage
of N S N D signals is the reduced resolution of the Zrs resulting from the smaller number of
frequency components and the longer recording times required for data acquisition. Indeed,
while N S N D signals may be appropriate for animal or human adults studies within an I C U
setting, the longer recording times required may preclude their use in spontaneously
breathing infants.
Inherent in any technique are assumptions. The forced oscillation technique assumes that
the measuring system and the mechanical properties of the respiratory system are linear
during the measurement. This implies that Zrs is independent of the amplitude of the
oscillatory signal. In intubated rabbits Peslin et al. showed that the application of small
amplitude pressure oscillations ( 2 - 4 c m H 2 0 ) at 10, 20 and 30 H z did not influence Rrs
or Ers. In addition the investigators demonstrated that the oscillatory signal did not
influence the lung response to histamine [100]. A second assumption is that Zrs values at
individual frequency components are equal to those obtained via single sinusoidal
oscillations. Desager et al. [102] showed matching Zrs measurements made using either
pseudorandom or sinusoidal signals at 12 and 32 Hz. A final assumption is that measured

42
flows and/or pressures are representative of the actual flows and pressures. If the upper
airway acts as a parallel shunt impedance then Zrs may be underestimated. Several studies
have sought to address this issue [21,103,104] and a detailed explanation is given below
(Section 1.3.1.1)
Although the work from animal studies can provide a rich source of technical and
methodological information, for ethical reasons a number of the techniques are unable to
be used in human subjects (e.g. alveolar capsules). As such the remainder of this section will
focus on those methods that have been successfully adapted for human use.
1.3.1 The forced oscillation technique in older children and adults
The impedance of the respiratory system can be determined in two ways, either using input
impedance (Zin) or transfer impedance (Ztr) systems. If the input and output signals are
applied and measured only at the airway opening, then the respiratory system can be
represented as a single node system (Zin). A two node system considers the airway opening
and body surface as separate nodes. In this case the forcing signal is applied at one node and
the resulting flows and pressures measured at the second node (Ztr) (Figure 1.2). With Zin
the oscillations are applied at the airway opening and the impedance determined from the
relationship of the pressure and flow measured at the airway opening (Zin = Pao/V). To
obtain the Ztr, oscillations are applied to the body surface and the impedance calculated
from the pressure surrounding the chest wall (Pbs) and airway opening flows (Ztr = Pbs/V).
In either case, the impedance spectra are plotted versus frequency and thus the frequency
characteristics of the respiratory system and its components (lung, chest wall, upper airways
and cheeks) can be determined. The advantages of the F O T are that the technique provides
a non-invasive way to measure the respiratory system, and that the ability to apply either
a single frequency or band of frequencies can provide useful information about the
pulmonary parenchyma. The disadvantages are that information is provided about all of the
respiratory structures, of which only the lung and chest wall are of primary interest and that
interpretation of the information is frequency dependent [94]. The use of selected
frequencies can overcome some problems as can the selective use of a model of the
respiratory system to partition the respiratory structures allowing those of interest to be

43
further studied. The advantages and disadvantages of the individual methods for
determining Zrs are outlined below.
/. 3.1.1 Input impedance
Initial studies measuring the input impedance of the respiratory system recorded data above
3 H z to avoid interference from the spontaneous breathing of the subject. Technical
advances have allowed the frequency range to be increased with current studies starting at
or around 2 Hz. These studies can provide general information about the mechanical
properties of the respiratory system, but are unable to characterize the frequency-dependent
lung tissues. Zin can be represented as a simple series model comprised of resistance,
inertance and compliance in these situations. Investigators have shown that by extending
the frequency at which Zin was determined out beyond 160 H z the first acoustic anti-
resonance of the airway system can be determined [105]. This extension of the frequency
being applied to the respiratory system requires a model accounting for tissue compliance
(Ct) and gas compression compliance (Cg) as suggested by DuBois [29]. This then allows
separate estimates of Raw, Rt and C g (see Figure 1.2) [106].
Only by extending the frequency range below the spontaneous breathing frequency can
information about the pulmonary parenchyma be obtained [3,16,96,107-109]. Recently, a
number of investigators have determined Zrs using frequencies below 2 H z [7,17,76,96,97].
Hantos et al. [96] investigated the frequency dependence of the human respiratory system,
lung and chest wall. In this study five adult subjects had their Zin measured in the 0.25-5
H z frequency range, with an esophageal catheter in place. The subject was required to
exhale and maintain an open glottis for 32s, enabling the characteristics of Zrs, Zl and Z w
to be determined. A negative frequency dependence was seen at low frequencies (< 2 Hz)
in both the resistance and the reactance for the respiratory system, lungs and chest wall
demonstrating that the respiratory system could be partitioned into lung and chest wall
components in healthy patients. This technique is limited by the effort and training required
to maintain an open glottis and would be unsuitable for younger children and infants.
Lutchen et al. [97] have successfully applied a waveform comprised of an oscillatory signal
superimposed on a tidal volume waveform. Termed the optimum ventilator waveform
technique ( O V W ) , it allows the measurement of low-frequency impedance data without the

44
need for an apnoeic period. This technique involves training the subjects to sit quietly while
relaxing to allow the application of the waveform. Lutchen et al. [97] have shown the
technique can reliably measure low-frequency input impedance spectra in healthy subjects
and in a single asthmatic showed the reversal of bronchoconstriction with the use of
bronchodilators. This technique requires less training than that required by the method of
Hantos et al. [96], but may be more suited to adults than to younger children, and would
be unsuitable in infants.
The application of the oscillatory signal at the airway opening may induce motion of the
upper airway walls and cheeks. The movement is responsible for some loss of measured
flow, leading to an underestimation of the respiratory impedance. Initial efforts to account
for this error involved the measurement of the upper airway wall impedance during Valsalva
manoeuvres [110], or by the use of a head plethysmograph to directly evaluate airway wall
motion during the Zin measurements [111]. These initial efforts have been improved upon
by the introduction of the head generator technique [21]. This technique involves applying
the oscillatory signal around the head rather than the mouth and thus minimizes the
transmural pressure across the extrathoracic airway walls during the respiratory impedance
measurement [21]. The authors found that the technique was almost as accurate as the more
cumbersome head plethysmographic technique and much simpler to implement. Since the
initial introduction of the head generator technique (HGT), several authors have made
direct comparisons between the standard input impedance technique and the head generator
technique in adults [103,104] and in children [104,112,113]. Cauberghs etal [104] found
no significant difference in Rrs between the H G T and standard techniques (cheeks
supported) in healthy adults, but the values of Rrs generated with the H G T were
significantly higher than that of the standard technique (cheeks unsupported), indicating a
mimmization of the upper airway shunt using the H G T . However, in adults with moderate
airway obstruction, the Rrs determined by the H G T was significantly higher than the
standard technique with a reduced frequency dependence. In addition, the resonant
frequency was significantly lower. In contrast, patients with severe airway obstruction
exhibited a negative frequency dependence with both techniques [104]. The authors
suggested that while the H G T did not completely suppress the upper airway shunt, it did
reduce the error when compared to the standard technique. These results have been

45
confirmed in a subsequent study, also in adults, that applied a frequency spectra of 8-256
H z and demonstrated that the H G T produced improved estimates of Zrs when compared
to the standard input impedance technique [114]. Habib and Jackson [103], using a
frequency spectra of 4-256 H z in 5 healthy adults measured Zrs using the standard, head
generator and water-filled head generator techniques to determine the input impedance (Zst,
Zhg and Zwa, respectively). The authors assumed that a water-filled head chamber would
eliminate upper airway wall movement due to the ̂ compressibility of water. Below 20 Hz,
the H G T provided nearly shunt-free estimates of Zrs, while above 32 H z the standard
cheek-supported technique resulted in a more accurate assessment of Zrs. Between these
frequencies the authors concluded that as both Zhg and Zst were different from Z w a it was
unclear which technique would provide the best shunt-free estimate of Zrs [103].
The error associated with the standard technique depends on the Zuaw/Zrs ratio, whereas
with the H G T the error is related to the ratio of impedance of the pneumotach (Zp) and
Zuaw (Zp/Zuaw). Marchal et al. [112] suggested that the H G T would provide better
estimates of Zrs than the standard technique with careful pneumotach matching and it was
subsequently shown in a group of normal children (3.5-13 years) that this was case. In a
further study, it was suggested that the H G T had a greater degree of sensitivity to detect
changes in lung function due to constrictor or bronchodilator agents in children (2.5-13
years) with a history of asthma [113].
1.3.1.2 Transfer impedance
To measure the Ztr of the human respiratory system, an oscillatory signal is applied to the
thorax of the subject while enclosed in a chamber and the resultant flow at the mouth
measured [94,115,116]. The description of the Ztr requires a more complex model than the
resistance-inertance-compliance (R-I-C) model (see Figure 1.1) used for input impedance
measurements. Ztr is usually analyzed using the six element model described by DuBois
[29] (Figure 1.2).
If the Cg is known, then the mechanics of the respiratory tissues can be determined. The
frequency range over which Ztr is measured greatly influences the reliability of the airway-
tissue separation [117]. Recent studies have suggested that the frequency range needs to

46
be extended at least to 50-64 H z [6,118]. If frequencies of 4-64 H z are used, then Ztr can
provide several advantages over Zin [117], as the latter cannot provide specific information
relating to the airways and tissues (see Section 1.3.1.1). In addition, measurements of Ztr
should be less sensitive to the errors associated with upper airway shunting [116]. However,
the ability of Ztr to accurately determine the behaviour of the pulmonary parenchyma has
been recently questioned by Lutchen et al [116]. The authors found that in a group of
adults with various forms of lung disease that the bronchodilator-induced changes in Rt
were uncorrelated with changes in spirometric values. However, when compared to
normals, the authors found that this indicator (Rt) was sensitive to disease [116]. These
results question the ability of Ztr to provide a reliable clinical tool to assess changes in lung
tissue mechanics, leading to the conclusion that Ztr m a y only be suitable as a non-invasive
method for assessing changes in airway function [94].
1.3.2 The use of the forced oscillation technique in infants
The translation of the Zin and Ztr techniques to an infant population has provided a number
of obstacles, the largest of which is that the population is inherently uncooperative. While
a few studies have been carried out in unsedated infants [119], the majority of studies have
been carried out in infants either within the intensive care setting or under sedation.
1.3.2.1 Input impedance
The two forms of input impedance described above (standard and H G T ) have both been
adapted for use in infants. The studies within each of these areas can be split into the signal
frequencies that have been applied with the majority of studies using the standard technique
carried out in the 4-64 H z range [102,120]. Desager et al [102] adapted the standard input
impedance technique for use in infants and demonstrated that reliable estimates of Zrs could
be obtained between 16 and 52 Hz. The authors evaluated the linearity of the measurement
apparatus and of the infant respiratory system and found them to be linear within the range
of measurement. In addition inter- and intrasubject variabilities were acceptable ( 6 % and
5.7%, respectively). The authors also showed that after spontaneous turning of the head,
and subsequent repositioning that there was no significant difference in impedance values.
In a further study, the nasal impedance was evaluated [120] from 4 - 52 Hz, showing R n
contributed up to 4 8 % of Rrs at 24 H z . Jackson et al [106] have investigated the high-

47
frequency behaviour of the respiratory impedance in 9 healthy infants, characterizing the
input impedance from 4 - 1 6 0 Hz. The authors found that below 20 H z the coherence
functions were poor and hence only applied the DuBois model between 20 and 160 Hz. The
authors found that using the DuBois 6 element model and a subsequent 10 element model,
while the resultant respiratory parameters were unduly influenced by the shunt impedance
of the face mask, Rrs estimates were related to airway resistance [106]. Frey et al. [121]
determined baseline high-frequency Zrs measurements in 13 wheezy infants and assessed
the changes due to methacholine constriction in 9 infants. The authors found that the first
anti-resonance could be reliably determined in all infants and that it increased significantly
following constriction and concluded that these measurements may offer insight into
changes in airway wall compliance during constriction. The mechanical behaviour of the
respiratory tissues are frequency-dependent and dominate Rrs and Xrs below the
spontaneous breathing frequency. It would be useful therefore to characterize the behaviour
of the pulmonary parenchyma below 2 - 4 Hz.
Marchal et al. [122] have adapted the HGT to determine Zrs in infants. In this investigation,
the authors compared the resistance and compliance obtained using the H G T and the
standard technique. The authors found that if nasal impedance is accounted for, the error
in the resistance determined by the H G T was small compared to the standard technique.
Estimates of compliance were not significantly different. Normally the standard technique
will underestimate Rrs, while the H G T will overestimate Rrs. In nasal breathers (e.g.
infants) this overestimation of Rrs may be exaggerated [122].
Clinical studies examining changes in low-frequency Zrs with inflation pressure [76] and
following bronchodilators in healthy and wheezy infants have been conducted [123]. Zrs
has also been determined in infants within an I C U setting [124-126].
1.3.2.2 Transfer impedance
The first use of Ztr in infants was carried out by Wohl et al. [127] in 1969. The authors
applied a forcing signal between 3-7 H z around the body and demonstrated inspiratory
resistance to be lower than expiratory resistance. Marchal et al. [128] measured Ztr and
thoracic gas volume (TGV) in 22 asymptomatic infants. In 12 infants the impedance data

48
was fitted to the DuBois six element model, providing estimates of specific Raw, Rt, law
and Ct. Using simulation studies, the authors showed that the poor fit in the remaining
infants could be attributed to an upper airway shunt during nasal breathing [128]. More
recent work by Jackson and co-workers [129], however has shown that the frequency range
used to obtain Ztr was crucial in the DuBois model was to be utilized to estimate the airway
and respiratory tissue properties in infants. The investigators demonstrated than Ztr may
be measured over a frequency range of 4-140 Hz, and that this frequency range allowed
reliable estimates of R a w and Rti, using the DuBois model, in spontaneously breathing
infants.
1.5 The low-frequency forced oscillation technique in infants
In adults and older children the detailed investigation of spirometric techniques and large
study numbers have enabled the development of predictive equations allowing disease
severity to be quantified. Numerous techniques have been developed to ascertain lung
function in younger children and infants, but the current literature demonstrates that most
methods of determining lung function are unable to provide separate estimates of the airway
and lung tissue mechanical properties. One technique able to determine airway and
mechanical properties simultaneously is the low-frequency forced oscillation technique [7].
This technique applies small-amplitude pseudorandom pressure oscillations to the airway
opening and input impedance is determined and the constant-phase model subsequently
fitted [4]. Previous studies have characterized the volume dependence of the airway and
lung tissue mechanics [76], and assessed the effect of bronchodilators on healthy and
wheezy infants [123]. These studies have not addressed such issues as the effect of the nasal
impedance on the input impedance of the respiratory system or the contribution of the chest
wall to Zrs. Factors affecting measurement conditions need to be standardized, including
the most appropriate signal type (EvI vs. N T M or N S N D ) , measurement time and signal
analysis, head position and neck extension or flexion, the ability of the low-frequency F O T
to provide diagnostic information and changes associated with normal growth in infants.
1.6 Aims
The aims of this thesis were to:

49
1) establish the ability of the low-frequency F O T to non-invasively partition the respiratory
system into lung and chest wall components and to use a linear model of the lung to
characterize the airway and parenchymal mechanics. This was initially carried out in an
animal model before being translated into children and infants.
2) determine the type of oscillatory signal required (IM vs. NIM) in terms of model fitting
criteria and the success rate of obtaining technically acceptable Zrs data.
3) characterize the contribution of the nasal and chest wall impedances on the respiratory
system impedance in infants.
4) measure airway and lung tissue mechanics in healthy infants over the first two years of
life and hence model the relationship between mechanical behaviour of the respiratory
airways and tissues and length using the low-frequency FOT.
5) compare the airway and pulmonary tissue mechanics of wheezy infants with those of
normal infants and hence determine the ̂ criminatory power of the technique.
6) determine the effectiveness of the low-frequency FOT to detect methacholine
responsiveness in infants.

50

51
CHAPTER 2: METHODS AND MATERIALS
2.1 Introduction
This chapter outlines the equipment, techniques and protocols used in the remainder of this
thesis. There are a number of adaptations of the forced oscillation technique (FOT), many
of which have been described in the review of the literature. All of the work within this
thesis has been determined by obtaining the input impedance (Zin). Either a wave-tube or
a pneumotachograph have been used to measure Zin. The first allows Zin to be obtained
without the need to measure flow, the use of a wave-tube is more suitable in small animal
models where the respiratory flows are low. The second measures the flow and pressure at
the airway opening and hence Zin. In addition, two set-ups, utilizing pneumotachographs,
have been used, the first in spontaneously breathing infants and the second in anaesthetized,
paralyzed and mechanically ventilated patients. The mechanical properties of the airways
and tissues have been characterized using the constant-phase model of the lung, the
background, limitations and advantages of the model are outlined.
2.2 Measurement techniques for determining respiratory
impedance
2.2.1 Wave-tube device
The measurement setup used to collect the low-frequency impedance data was an
adaptation of that used by Petak et al [5] and is shown in Figure 2.1.
2.2.1.1 Validity of the wave-tube device
The wave tube device does not measure flow and as such the input impedance is determined
from the transfer function of the loudspeaker pressure and the airway opening pressure. In
an open system the transfer function will be negligible, while in a closed system the transfer
function will approach unity. As described in further detail in Section 2.3 the forcing signal
is constructed so as to provide the best possible signal to noise ratio. The physical
characteristics of the wave tube are determined to maximise the sensitivity of the wave-tube
to detect changes in the load impedance while minimising the possible influences of
artefacts. The diameter and length of the wave tube are chosen based on the following:

52
Diameter is adjusted to the tracheal or cannula ID. This is a strong constraint as resistance
is extremely sensitive to the diameter (~dA(-4)). Length is determined by the expected load
impedance and the wavelength. For example if L is too short then P2/P1 approaches 1 at
the lowest frequency, and the computation becomes too sensitive to calibration and
temporal stability. Alternatively, if L is too long, P2 becomes very small and may be subject
to quantisation and other noises. A compromise in L has to be found. The other determinant
is the L vs. wavelength. L is kept below the quarter of the wavelength in order to avoid
standing waves and reflections. Here the highest-frequency component matters. For
example for a 25 H z maximum frequency the wavelength is 330 m/s (sound velocity in air)
over 25/s = 13.2 m, hence the quarter wavelength is 3.3 m. The 114 cm wave-tube used is
well below this upper limit.
2.2.1.2 Measurement apparatus
The measurement circuit consisted of the animal, the ventilator and the measurement
system, the components were joined at a 3-way tap that could be switched between the
measurement system and ventilator. The measurement system included the loudspeaker-in-
box: used to generate the oscillatory signals, a 114 cm long 2 m m ID polyethylene wave-
tube of known characteristics and 2 identical miniature pressure transducers (ICS model
33NA002D) to determine the lateral pressures at the loudspeaker (Pi) and the tracheal end
(P2) of the tubing. Esophageal pressure (Pes) was measured with respect to atmosphere to
separate Zrs into Z w and Zl via positioning a 3-french single-sensor catheter-tip
micromanometer ( M T C 3F Drager Medical Electronics, Best, Netherlands) into the
oesophagus. The pressure drop across the chest wall was monitored during mechanical
ventilation, and the catheter was positioned to obtain a smooth respiratory curve with
minimal cardiac noise. The position of the catheter was finalized by performing the 'positive
pressure' occlusion test described by Lanteri etal [130]. The animal was placed inside a
plethysmograph and the loudspeaker connected (Figure 2.1), the airway was occluded at
the 3-way tap and the oscillatory signal applied to the body surface. The resultant changes
in P2 and Pes were examined to confirm catheter placement. To obtain impedance
measurements the E T tube was switched to the loudspeaker-in-box system at end-
expiration. The loudspeaker generated a small-amplitude pseudorandom signal containing
15 non-integer multiple (NTM) components in the frequency range of 0.5-21 H z through

53
the wave-tube.
P, P-1 ' 2 Figure 2.1 Set-up for the wave-tube technique. The dotted lines show the setup for the positive-pressure
occlusion test.
The Pi, P2, and Pes signals were low-pass filtered, and digitized by an analog-digital board
of an IBM-compatible computer at a sampling rate of 128 Hz. The pressure transfer
functions Pi/P2 and Pes/P2 were computed by fast Fourier transformations (FFT) from the
6-s long recordings, by using 4 s time window and 9 5 % overlapping. Zrs was calculated as
the load impedance of the wave-tube [5]:
Zrs = Zo sinh(vL)/{(Pi /P2 -cosh(yL)} -(27)
where: L is the length of the tube. The characteristic impedance (Zo) and the complex
propagation wave number (y) were determined by the geometrical data and the material
constants of the tube and air.
Since tracheal flow was not measured, Z w was calculated assuming no flow loss to airway
wall or alveolar gas compression as Z w = Zrs (Pes/P2) and Zl was obtained by subtraction
(Zl = Zrs-Zw). The load impedance of the E T tube and the connecting tubing was also
determined.

54
2.2.2 Pneumotachograph device
This setup involves the measurement of central flow and pressures (transrespiratory and/or
transpulmonary) to determine Zrs, Zl and Zw. Zin was obtained in spontaneously breathing
or mechanically ventilated patients and the methods used are detailed below.
iii
Figure 2.2: Setup for the technique used for spontaneously breathing infants. During forced inspirations the
valve between the loudspeaker and reference chamber was open, allowing equalization between the loudspeaker,
the infant and the reference chamber. Following the final inflation, the balloon valve and valve was closed, hence
occluding the airway and isolating the loudspeaker from the reference chamber.
2.2.2.1 Spontaneously breathing patients
Respiratory input impedance spectra (Zrs) were measured by using the low-frequency F O T
during an apnoeic pause induced by the Hering Breuer reflex as described by Sly et al. [7].
The measurement setup is shown in Figure 2.2 and included the loudspeaker-in-box system,
a reference chamber and the computer controlled pump and balloon valve, the two
components were connected to a soft-rimmed face mask using a T-shaped connector. The
oscillatory forcing signal was generated by a loudspeaker-in-box system and was introduced
to the infant, via a soft-rimmed face mask fitted to ensure a leak-free seal around the nose

55
and mouth. The Hering Breuer reflex was induced by introducing inspiratory flows
generated by a computer controlled pump, in series with the balloon valve. Prior to
obtaining the oscillatory measurements, three deep forced inspirations were applied (Figure
2.3): the balloon valve was opened and the inspiratory flow was maintained by a pump
(Inflate-all; Coleman Co. Inc., Wicket, K S ) until the transrespiratory pressure (Pao) reached
20 c m H 2 0 , each inflation was followed by a pause of 0.75 s to allow passive expiration,
before the successive forced inspiration was applied. At the end of the third inflation, the
balloon valve was closed, occluding the airway at a transrespiratory pressure of 20 c m H 2 0
and hence inducing the. If three successive inflations were insufficient to induce the Hering
Breuer reflex the number of inflations was increased to a maximum of eight inflations. In
the resulting short apnoeic period, the valve between the loudspeaker box and the reference
box was closed and the low-frequency pseudorandom signal was driven into the infant's
respiratory system by the loudspeaker. The two chambers of the loudspeaker box,
pressurized during the inflation maneuvers to keep the membrane in the midposition, were
connected to each other and to the reference box through a T-tubing. This allowed for rapid
equilibration of static pressures, but did not attenuate the amplitude delivered at oscillation
frequencies. Measurements were 6s in length and the Pao recording examined for leak or
respiratory efforts, with corrupted recordings being excluded.
The oscillatory signal contained 16 frequency components in the 0.5-20 Hz range. The
relative amplitudes of the lower frequency components were elevated to maintain sufficient
signal-to-noise ratios at all frequencies and the signal optimized to keep the peak-to-peak
amplitude of the signal to a minimum. V was measured with a screen pneumotachograph
(28 m m ID) connected to an ICS 3 3 N A 0 0 2 D differential pressure transducer (ICSensors
Inc., Milpitas, CA). A n identical pressure transducer was used to sense respiratory pressure
(Prs) as the pressure difference between the mask and the reference box. The latter was
used to eliminate the 20 c m H 2 0 static pressure and hence, increase the resolution. Nasal
pressure (Pn) (if measured: See Chapter 6) was determined using a solid state miniature
tipped catheter ( M T C 5F; Drager, Best Netherlands) placed 4-5 cm into the nasal cavity,
slightly above the nasopharynx. The signals of Pn, Prs and V were low-pass filtered at 25
Hz, sampled at 128 H z with a 12-bit analog-digital converter and stored on an IBM-
compatible computer for later analysis.

56
O 20 CN
0 5 10 15
Time (s) Figure 2.3: Time domain trace of mouth pressure depicting the 3 inflations and the airway occlusion.
20
Three to ten measurements of the uncorrected input impedance (Z*) were collected in each
infant. Following each measurement the mask was lifted and the infant allowed to breathe
spontaneously. Following each series of measurements the impedance of the apparatus dead
space (Zds) was determined. Z* and Zds were computed from the cross-power spectra
between the measured V and Prs signals and the stored driving signal using the L U N G
software (SZOTE University, Szeged, Hungary [96]. The spectra were obtained by fast
Fourier transformation (FFT) from 3 s time windows and 9 5 % overlapping. Zds was
considered as a lumped shunt impedance in parallel with the respiratory system, and the
corrected respiratory impedance (Zrs) was calculated as Zrs = (ZdsZrs*) / (Zds - Zrs*). A
linear model of the respiratory system [26] was then fitted to the corrected individual
respiratory impedance spectra, in the 0.5-15 H z range (see Section 2.4). The same
procedure was followed when determining the lower respiratory system impedance (Zlrs).

57
2.2.2.2 Mechanically ventilated patients
The measurement set-up used to collect Zrs data on spontaneously breathing infants [7] was
modified to measure impedance in the intubated children (Figure 2.4). Hand operated valves
were used to switch the ET-tube from the respirator to the measurement apparatus as
follows. Valves A and C were open and B closed during mechanical ventilation. Preceding
oscillatory measurements the lungs were inflated to a pressure of about 30 c m H 2 0 to
standardize the volume history. The valve B was opened for a few ventilatory cycles before
data collection to equilibrate the pressures between the children and the measurement set
up. The valve A was then closed at end-expiration, and the communication between the
loudspeaker chamber and the reference box was suspended by closing valve C. In the
resulting apnoeic period, small-amplitude (<2 c m H 2 0 peak-to-peak pressures) pseudo
random pressure excitations were introduced into the trachea. The forcing signal contained
thirty integer-multiple components of the fundamental frequency 0.4 Hz, resulting in a
frequency range of 0.4-12 Hz. The energies of the low-frequency components were
enhanced to provide a sufficient signal-to-noise ratio over the whole frequency range. The
phases of the components were optimized to give a minimal peak-to-peak pressure
excursion at the airway opening. 4-6 recordings were collected in intact-chest condition.
Periods of at least 2 min of mechanical ventilation were interposed between the successive
measurements.
Tracheal flow (V) was measured with a 28-mm-id screen pneumotachograph connected
to a differential pressure transducer (ICS 33NA002D). To avoid the inclusion of the E T -
tube impedance into the measurements, intratracheal pressure (Ptr) was measured with an
identical pressure transducer through a 1.5-mm-OD polyethylene catheter positioned 1.5-2
c m distal to the ET-tube. The reference port of this transducer was connected to a reference
box to eliminate the D C offset. Airway opening pressure (Pao) with reference to the
atmosphere was also detected with a third ICS sensor to monitor absolute tracheal
pressures. To separate Zrs into Zl and chest wall (Zw) components in the intact-chest, the
esophageal pressure (Pes) with reference to the atmosphere was measured by introducing
a 3 french catheter-tip micro-manometer ( M T C 3F Drager Medical Electronics, Best, The
Netherlands) into the lower third of the esophagus.

58
loudspeaker
Figure 2.4: Pneumotach setup used in mechanicahy ventilated patients. During normal ventilation valves A and
C are open, with valve B clamped shut At end expiration valves A and C were shut and valve B opened allowing
the forcing signal to be applied. Tracheal pressure (Ptr) was determined distal to the ETT.
The pressure drop across the chest wall was monitored during mechanical ventilation, and
the catheter was positioned to obtain a smooth respiratory curve with minimal cardiac
noise. The electrical signals of the transducers were low-pass filtered at 25 Hz, and digitized
at a rate of 256 H z by an analog-to-digital board of an IBM-compatible personal computer.
The correction spectra for each transducer pair were determined by exposing the sensors
together with their connecting tubing to the same oscillatory pressure fluctuation. The
differences in the frequency response of the pressure transducers and their tubing measuring
Ptr, Pes, and V were recorded, and the impedances were corrected accordingly.
The mechanical impedance of the respiratory system was calculated from the Ptr and V
signals (Zrs = Ptr/V1). The chest wall impedance was computed directly from the Pes and
V signals (Zw = Pes/V), while Zl spectra were obtained by subtraction (Zl = Zrs-Zw). The

59
impedance spectra were calculated by fast Fourier transformation from the 7.5 s long
recordings using 2.5 s time window and 9 5 % overlapping.
2.3 Forcing signals
The selection of forcing signal is crucial to ensure a maximization of the signal to noise ratio
(S/N). Studies conducted in mechanically ventilated, paralyzed patients have sufficiently
long apnoeic periods for the longer N T M or N S N D signals to be used. Within spontaneously
breathing infants the apnoeic period is elicited using the Hering-Breuer reflex. Apnoeic
periods longer than 6 seconds cannot always be obtained, hence restricting the signal type
that may be utilized. In order to determine the optimum forcing signal to use a pilot study
was conducted in 6 spontaneously breathing infants and children. In each patient 2 signals
were applied in random order. Signal 1 was an I M signal and contained 16 frequency
components, with a fundamental frequency of 0.5 H z (T=2s and T = signal period), in the
0.5-20 H z range. Signal 2 contained 23 non-integer multiple (NTM) components, with a
fundamental frequency of 0.25 H z (T=4s), in the frequency range of 0.5-21 H z (Table 2.1).
4-6 Zrs measurements were obtained in each patient (as described above). If the
measurement period is greater than or equal to 3 times the signal period, then a fast Fourier
transform (FFT), with a window of twice that of the signal period may be used to convert
the time-domain signal into the frequency domain (double FFT). The resolution of the
resulting frequency domain signal will be 1/2T (e.g. if T = 2, then the resolution will be 0.25
' Hz). Measurement times less than 3T only allow for the use of a FFT, with a window of T
seconds and hence a resolution of 1/T (single FFT). The better the resolution the lower the
chance that noise or artifact will be included in the frequency estimate (i.e. improved S/N
ratio). In addition FFTs were 9 5 % overlapped with the successive FFT. Overlapping
describes the overlap between one Fourier transform window and the next. This indicates
that the second transform overlaps the first by 95%. The effect of large overlapping is to
improve the signal to noise ratio of the data, as noise will be averaged to zero, while the
data will remain unchanged. Signal 1 was analyzed in the following way. If no breath
occurred during the measurement, then a double FFT was used. If a breath occurred during
the measurement between t =3-6s, then the portion of signal containing the breath was
excluded and a single FFT performed on the remaining signal. If the breath occurred prior
to 3 seconds then the measurement was excluded.

60
Signal 2 was analyzed using a single FFT. Individual Zrs spectra were fitted to the constant-
phase model of the lung (see Section 2.4). In addition the success rate was calculated for
each infant. Paired students t-tests were applied to the mean respiratory parameters, the
variability (SD), the fitting error (F%) and the success rate.
Measurements for each signal were obtained in all children. There was no significant
difference in any respiratory parameter or the variability in any parameter. The fitting error
obtained from the constant phase model when using signal 1 (7.6±0.6%) was significantly
lower (p<0.01) than that obtained when using signal 2 (8.6±0.5%). This lower fitting error
may be due to the use of the double F F T possible with the shorter I M signal. The shorter
measurement time also resulted in a non-significant increase in success rate when signal 1
was used (79±3% and 65±6%, for signal 1 and 2, respectively)
The use of NTM and NSND signals ensure decreased artifact due to cross-talk and non-
linearities [98], however the increased measurement times required introduce practical
difficulties. In adults and ventilated patients the potential to induce a pause in breathing, of
sufficient length to obtain the measurement times required for N T M or N S N D signals is
increased. In uncooperative infants the pause in breathing must be induced by invoking the
Hering-Breuer reflex. As this reflex decreases with age, the ability to obtain the minimum
pause needed for a signal, such as Signal 2 (above) is decreased. In infants with an increased
respiratory drive, such as during an acute exacerbation of wheeze, or during a methacholine
challenge test the length of the pause in breathing will be reduced. The use of the shorter
EvI signal will allow for a higher success rate in all patients groups, the additional use of a
double F F T ensure high S/N ratios. The subsequent studies contained within this thesis use
I M signals.

61
Table 2.1: Frequency components of I M and N I M signals
IM(Hz)
0.5
1.0
1.5
2.0
3.0
4.0
5.0
6.0
7.5
9.0
10.5
12.0
14.0
16.0
18.0
20.0
N I M (Hz)
0.50
0.75
1.25
1.75
2.75
3.25
4.25
4.75
5.75
7.25
7.75
9.25
10.25
10.75
11.75
13.25
14.75
15.25
16.75
17.75
18.25
19.75
20.75
2.4 Constant-phase model
Impedance spectra were evaluated in terms of model parameters. The model contained a
frequency independent resistance (R) and inertance (I) connected in series with a constant-
phase tissue compartment [26] representing tissue damping (G) and elastance (H):
Z = R + jcol + (G - jH)/oa -(28)
where j is the imaginary unit, © is the angular frequency, and a is expressed as a = 2/n
arctan (H/G).

62
Figure 2.5 shows a schematic representation of the mechanical behaviour of the airways and
the respiratory tissues and their contribution to the frequency dependent behaviour of the
respiratory system as described by the constant-phase model. The inverse frequency
dependence of the respiratory tissues can be seen at low frequencies (< 2 Hz). The
resistance of the airways are frequency independent and contribute a majority of the
respiratory resistance at higher frequencies (>10 Hz), while the inertance of the airways
make a negligible contribution to the respiratory system reactance (Xrs) at low frequencies
and dominate Xrs above 10 Hz.
When the model is fitted to the Zrs, Zl or Zw spectra, the tissue parameters characterize the
damping and elastic properties of the corresponding tissue compartment. For the pulmonary
impedances, the R and I reflect primarily the airway resistance (Raw) and inertance (law).
In the case of the Z w , the R and I represent the Newtonian resistive and inertive
components of the chest wall. W h e n the model is fitted to Zrs spectra, the estimated R and
I contain R a w and law and the resistive and inertive contribution of the chest wall. The
model parameters were obtained by using a fitting criteria by minimizing the following
objective function:
F = f(I/m)j^f\ 2(ayi)-Z'(coi)V\ Kto,)?]?2
where F is a measure of the 'goodness-of-fit' of the model.

30 -,
15 -
0 -
63
Frequency (Hz)
Figure 2.5: Schematic representation of the airway (dotted line) and tissue (dashed line) contributions to the
frequency dependent behavior of the respiratory system (solid line).

64
2.5 Raised volume rapid thoracic compression technique
Forced expiratory data were obtained over an extended volume range using the technique
described by Hayden et al [131]. This technique uses a pump (Inflate-all; Coleman Co. Inc.,
Wicket, K S ) to raise the infant's lung volume above the tidal range. The pump draws room
air through a pneumotachograph (No. 3719; Hans Rudolf Inc, Kansas City, M O ) and into
the infant via a soft-rimmed face mask (King System, Noblesville, IN). Flow (V) and airway
opening pressure (Pao) were measured, amplified (SC14C; RHT-INFODAT, Montreal, PQ,
Canada) and recorded on a computer using B R A T L A B data acquisition and analysis
software (RHT-INFODAT). A series of computer controlled solenoid valves were used to
inflate the infant's lungs 3 times to a transrespiratory pressure of 20 cmH 2 0 with passive
deflations between each inflation. Using a jacket connected to a positive pressure reservoir,
a compression force was applied to the thorax and abdomen after the third and final
inflation. The compression force was standardized to transmit a pressure of 20 c m H 2 0 to
the airway at end-inflation resulting in an airway opening pressure of 40 cmH 2 0 [131]
(Figure 2.6).
Forced expiratory flow was measured and volume calculated. FEV0.5, FEV0.75 and FEVi
were calculated from the forced expiratory volume-time curves. Three to ten technically
correct measurements were obtained from each infant.

65
pneumotachograph
400 kPa air supply
Hand operated valve
Pressure I
pressure guage
valve (2)
To jacket
Pressure reservoir
Figure 2.6: Schematic of R V R T C measurement set up. R o o m air is drawn through the pneumotachograph by
the pump via valve 4 and forced into the infant's lungs via valve 3. Valves 3, 4 and the balloon valve act in
concert to allow the forced inflations and passive deflations. The jacket is inflated from the pressure reservoir
via valve 2, following forced expiration the jacket empties through valve 1.

66

67
CHAPTER 3: REPEATED MEASUREMENTS OF AIRWAY AND LUNG TISSUE MECHANICS
IN RATS
3.1 Summary
For studies investigating the mechanisms underlying the development of allergic conditions
such as asthma, non-invasive methodologies for separating airway and parenchymal
mechanics in animal models are required. To develop such a method, seven Brown Norway
rats were studied on three occasions over a 14-day period. Following the third intact chest
baseline measurement inhaled methacholine was adniinistered. Once lung function returned
to the baseline level, a thoracotomy was performed to compare the lung mechanics in the
intact and open chest conditions. O n each occasion, the rats were anesthetized, paralyzed
and intubated. Small amplitude pseudorandom oscillations between 0.5-21 H z were applied
through a wave tube to obtain respiratory impedance (Zrs). Esophageal pressure was
measured to separate Zrs into pulmonary (Zl) and chest wall (Zw) components. A model
containing a frequency independent resistance and inertance, and a tissue component
including a tissue damping and elastance was fitted to Zrs, Zl, and Z w spectra. N o
statistically significant change was found in any Zrs, Zl, or Z w parameters between tests.
The number of animals required to show group changes in lung mechanics was significantly
less when measured non-invasively than when calculated from open chest parameters. In
conclusion, the current method can be used to separate airway and lung tissue mechanics
non-invasively over a series of tests and can detect pulmonary constrictor responses for the
airways and the parenchyma separately.

68
3.2 Introduction
Recent studies in both animals and humans have established that the pulmonary parenchyma
plays an important role in determining lung function and in determining the mechanical
response to various insults. Total lung resistance (Rl) comprises two components, the flow
resistance of the bronchial airway tree against the flow (Raw) and the resistance of the
pulmonary parenchyma (Rti) manifested as a viscoelastic pressure loss across the lung
tissues. Animal models have demonstrated that changes in lung function can be produced
by changes occurring predominantly in the airways, in the parenchyma, or in both
compartments.
The major problem limiting wider application of these findings to fundamental research
questions in animals and humans is the invasive nature of the methods used to date. Studies
performed in animals have required direct measurement of alveolar pressure using pressure
capsules glued to the lung surface, usually in open-chested animals, or in-vitro methods.
These methods preclude repeat studies in a single animal which would be desirable for many
of the studies likely to be required for the successful development of a realistic animal
model of asthma. Thus the development of a non-invasive method for partitioning lung
mechanics into airway and parenchymal components would represent a major advance.
Allowing the detailed study of lung function required to understand the pathogenesis of
lung diseases such as asthma.
Clinical longitudinal studies on the effect of aging [132,133] or to explore the long-term
development of a disease process [134] are frequently performed to follow changes in the
mechanical properties of the respiratory system. For the same purpose in animal studies,
independent groups are used and long-term changes in the lung function are detected from
unpaired comparisons. Nevertheless, due to the baseline variability and/or the apparent
scatter in the lung responsiveness, changes occurring long-term in the lung mechanics may
remain undetectable or require large number of animals in the independent groups.
The primary aim of the present study was to develop and test a modified forced oscillatory
technique that allows the partitioning of airway and parenchymal mechanics non-invasively,
and which would be suitable for performing long-term follow-up studies in rats. The rats'
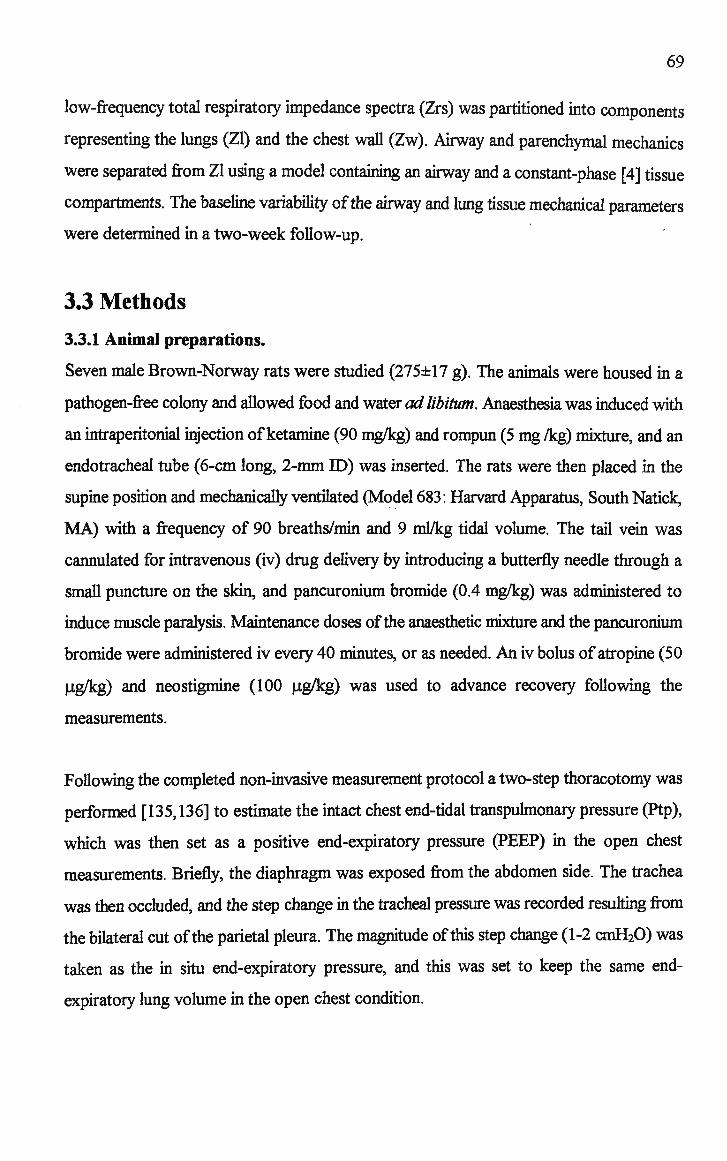
69
low-frequency total respiratory impedance spectra (Zrs) was partitioned into components
representing the lungs (Zl) and the chest wall (Zw). Airway and parenchymal mechanics
were separated from Zl using a model containing an airway and a constant-phase [4] tissue
compartments. The baseline variability of the airway and lung tissue mechanical parameters
were determined in a two-week follow-up.
3.3 Methods
3.3.1 Animal preparations.
Seven male Brown-Norway rats were studied (275±17 g). The animals were housed in a
pathogen-free colony and allowed food and water ad libitum. Anaesthesia was induced with
an intraperitonial injection of ketamine (90 mg/kg) and rompun (5 m g /kg) mixture, and an
endotracheal tube (6-cm long, 2-mm ID) was inserted. The rats were then placed in the
supine position and mechanically ventilated (Model 683: Harvard Apparatus, South Natick,
M A ) with a frequency of 90 breaths/min and 9 ml/kg tidal volume. The tail vein was
cannulated for intravenous (iv) drug delivery by introducing a butterfly needle through a
small puncture on the skin, and pancuronium bromide (0.4 mg/kg) was administered to
induce muscle paralysis. Maintenance doses of the anaesthetic mixture and the pancuronium
bromide were administered iv every 40 minutes, or as needed. A n iv bolus of atropine (50
ug/kg) and neostigmine (100 Mg/kg) was used to advance recovery following the
measurements.
Following the completed non-invasive measurement protocol a two-step thoracotomy was
performed [135,136] to estimate the intact chest end-tidal transpulmonary pressure (Ptp),
which was then set as a positive end-expiratory pressure (PEEP) in the open chest
measurements. Briefly, the diaphragm was exposed from the abdomen side. The trachea
was then occluded, and the step change in the tracheal pressure was recorded resulting from
the bilateral cut of the parietal pleura. The magnitude of this step change (1-2 c m H 2 0 ) was
taken as the in situ end-expiratory pressure, and this was set to keep the same end-
expiratory lung volume in the open chest condition.

70
3.3.2 Measurement apparatus
See Section 2.1.1 for full details.
The measurement setup used to collect Zl data was described in detail previously [5].
Briefly, the E T tube was switched to a loudspeaker-in-box system at end-expiration. The
loudspeaker generated a small-amplitude pseudorandom signal through a polyethylene
wave-tube. Esophageal pressure (Pes) was measured with respect to atmosphere to separate
Zrs into Z w and Zl. Zrs was calculated as the load impedance of the wave-tube [5]. Z w
was calculated assuming no flow loss to airway wall or alveolar gas compression as Z w =
Zrs(Pes/Ptr) and Zl was obtained by subtraction (Zl = Zrs-Zw). The load impedance of the
E T tube and the connecting tubing was also determined.
3.3.3 Study protocol
Respiratory mechanics were measured on days 0, 7, and 14. O n each occasion, 6-8 data
epochs were collected, and the Zrs^ Z w , and Zl spectra were ensemble-averaged. O n day
14, after the baseline measurements were collected, aerosolized M c h (2 mg/ml) was
administered with a jet nebuliser (LC PLUS, Pari-Werk, G m b H , Germany) driven by 51/min
air attached to the inspiratory port of the ventilator for 60 seconds. Data collection was
started 1 min after completion of M c h challenge and successive recording were taken every
minute thereafter. Individual Zl and Z w curves were calculated and parameter values at the
peak response in Zl were reported.
Following the Mch challenge, lung mechanics were allowed to return to the baseline. The
chest was then opened, and PEEP was applied to maintain the end-expiratory lung volume
as close as possible to that occurring with the chest intact (see above). The pressure in the
loudspeaker box was adjusted to the P E E P level during these measurements to keep Ptp
unchanged. The open-chest pulmonary impedance spectra (Zlo) was determined as the load
impedance of the wave-tube.
One rat failed to recover following the second test, six rats completed the two-week follow-
up and form the basis of the present report.

71
3.3.4 Parameter estimation
See Section 2.2 for full details.
A linear model containing a frequency independent resistance (R) and inertance (I) and a
tissue damping (G) and elastance (H) of a constant-phase tissue compartment [4] was fitted
to the Zrs, Z w , Zl, and Zlo spectra by minimizing the absolute difference between the
measured and the modelled impedance data. Tissue hysteresivity (r|) [137] values were
calculated as G/H. Impedance data coinciding with the heart rate or its harmonics had poor
reproducibility and were excluded from the model fit.
3.3.5 Statistics
Scatters in the parameters were expressed in SE values. Repeated measures of one-way
analysis of variances with the Student-Neumann-Keuls multiple comparison procedure was
used to compare the parameter values in the different states of the study. Sample size
calculations were performed as follows. For the intact chest lung data, w e assumed that the
changes will be detected within an individual rat. Therefore, the minimum sample sizes were
determined by using the standard procedure of the paired t-test. In this case, the expected
variability of the changes in the intact chest Zl data was estimated from the 14 day follow-
up of the intact chest lung parameters. The assessment of the sample sizes for the open
chest protocol assumed two separate groups of animals. Accordingly, the standard
deviation values of the lung parameters were determined from the open chest lung
impedance data, and the minimum sample sizes were calculated from an unpaired t-test. In
both cases, changes of 1 0 % , 2 0 % , and 5 0 % were expected in Raw, G, and H. The power
of the tests was 0.8 and the coefficient of variation was kept constant. For sample size
calculation, the resistance of the E T tube and the connecting tubing ( R E T = 98 cmH20.s/L)
was subtracted from the R a w values.
3.4 Results
3.4.1 Non-invasive partitioning of Zrs
Representative Zrs, Zl, and Z w curves with the corresponding model fits are demonstrated
in Figure 3.1. All impedance curves exhibit similar frequency dependence. The low

72
variability seen across all frequencies, except those coinciding with the heart rate or its
harmonics, indicate highly reproducible impedance measurements. Zl contributes the
majority of the high frequency real part of Zrs suggesting that the lung dominates the
Newtonian resistive properties of the respiratory system. Z w comprises most of the increase
in the real part of Zrs at low-frequencies indicating that the chest wall has a major
contribution to G. In contrast, the low-frequency imaginary parts demonstrate a higher
percentage of parenchymal contribution to the respiratory elastance. Negligible chest wall
contribution to the inertive properties of the respiratory system is evident in the high-
frequency imaginary parts of the impedance spectra. Apart from the data points corrupted
by cardiac artifacts the model fitted all impedance data well with only a slight systematic
fitting error at the low-frequency real parts.
3.4.2 Repeated measurements in individual animals
The results of the repeated tests are summarized in Figure 3.2. Repeated measures of
respiratory, chest wall, and lung mechanics were highly reproducible with none of the
parameters showing statistically significant differences. Since repeated tests did not reveal
any significant change, w e used the results of the three tests to calculate the lung and chest
wall contributions to the total respiratory parameters. Figure 3.3 demonstrates these ratios
for the airway and tissue parameters. The frequency independent resistive and inertive
components of Zrs are fundamentally determined by Zl (90±0.8% and 100±1.6% for R and
I, respectively). The lung contributed a slightly higher part (58±1.5%) to the respiratory
system H, while it comprised a minority of the respiratory system G (33±1.0%).

73
o 3C?
a o o
750 -i
500
250 -
0
-500 -
-1000 -
-1500
Frequency (Hz)
Figure 3.1: Real (R) and imaginary (X) parts of a representative Zrs (•), Z w (•), and Z1(A) spectra (mean ±
SD) in intact chest condition. Hollow symbols represent data points corrupted by the cardiac noise and are
excluded from the model fit. The solid lines denote the corresponding model fits.
3.4.3 Comparison of the lung mechanics obtained in closed and open chest conditions
Figure 3.2 demonstrates that we found statistically significant differences in the airway
parameters when they were determined in situ and in the open chest. Open chest Raw was
13% lower (p<0.005) while law exhibited a 1 4 % increase (p<0.01). G showed good

74
agreement between the in situ and open chest condition with a slight and not statistically
significant increase of 9%. Chest opening caused a statistically significant 4 0 % decrease in
H (p<0.05). This decrease in H with a constant G resulted in a significant 3 4 % increase in
ri (pO.OOl).
Table 1. Sample size predictions from the values obtained in intact chest condition
Raw
G
H
MeaniSD
68±10 cmH20.s/L
401±72 cmH20/L
2665±363 cmH20/L
Expected SD of
change
12.5 cmH20.s/L
77.4 cmH20/L
578 cmH20.s/L
Sample no. required for change of
10%
35
38
47
20%
12
13
16
50%
5
5
6
Table 1. Sample size predictions to estimate 10%, 2 0 % , and 5 0 % change in Raw, G, and H. Mean and S D
values were obtained from the intact chest parameters. Expected S D of change was calculated from the repeated
Zl measurements. Mean R a w was corrected for the resistance of the E T tube and connecting tubing.

75
&
zuu -
100 -
9 9
• '""
. . B 9
i "*
. 1 1
l.O-i
d 0.5-
0.0
i I i i : i i i i i
1500 -i
^ 1000 o
o O 500
0.50 -i
p- 0.25
0.00 " T " 1st
— r — 2nd
~T~ 3rd
5000 -i
S &f 2500 -
1st 2nd 3rd
Figure 3.2: Respiratory (•), lung (•), and chest wall (A) parameters for the successive intact chest
measurements. Open chest parameters (mean±SEM dashed and dotted lines respectively) are also shown. *
p<0.05, #p<0.01, § p<0.005 and J pO.OOl.

76
Raw Rw law Iw Gl Gw HI Hw
Figure 3.3: Lung (hatched bars) and chest wall (white bars) contributions to the airway and tissue
parameters of Zrs.
3.4.4 Sample numbers for non-invasive, repeated and for single invasive studies
Based on the variability of the intact and open chest Zl data, w e calculated the required
number of rats to detect a 10%, 2 0 % , and 5 0 % change in Raw, G, and H. Tables 1. and 2.
show these sample size predictions for the intact and open chest, respectively. In all
parameters, the open chest condition required significantly greater (approximately 2-fold)
group numbers to show 1 0 % and 2 0 % change. This difference in the required number of
rats between groups is more pronounced (5-fold) if the primary variable of interest is G.

77
Table 2. Sample size predictions from the values obtained in open chest rats
Raw
G
H
Mean±SD
46±9.3 cmH20.s/L
439±146 cmH20/L
2899±465 cmH20/L
Sample no. required for change of
10%
83
212
50
20%
25
64
16
50%
7
17
5
Table 2. Sample size predictions to estimate 10%, 20%, and 5 0 % change in Raw, G, and H. Mean and S D
values were obtained from the open chest parameters. Mean Raw was corrected for the resistance of the ET tube
and connecting tubing.
3.4.5 M c h responses detected non-invasively
To examine the suitability of the present non-invasive method to detect constrictor
responses, aerosolized M c h was administered. Table 3 demonstrates these responses.
Parenchymal parameters exhibited statistically significant increases with percentage changes
from baseline of 393±109%, 111±27%, and 120±25% for G, H, and rj, respectively. N o
statistically significant changes in airway parameters occurred, however there was a
tendency in R a w to increase (56±27%, p<0.1), while law tended to decrease (-24±24%).
Chest wall parameters showed no statistically significant change following Mch-induced
constriction with percentage changes from baseline of-29±29%, 14±18%, -2.6±5.7%,
7.6±13.7%, and 3.1±10.4% for R, I, G, H, and T| of the chest wall, respectively.

78
Table 3. Effect of aerosolized Mch on in situ airway and parenchymal parameters.
Rat#
1
2
3
4
5
6
Mean
±SEM
Raw
cmH20.s/L
C
78
72
65
76
53
72
69.3
±3.7
MCh
250
333
206
44
90
61
164
±48
law
cmH20
C
0.57
0.68
0.73
0.68
0.78
0.63
0.68
±0.03
.s2/L
MCh
0.35
-0.19
0.54
0.85
0.66
0.87
0.51
±0.16
G
cmH20/L
C
437
261
439
369
435
451
398
±30
MCh
1800
2256
3297
1734
702
1344
1856
±358*
H
cmH20/L
C
2804
2367
2827
2264
2700
3035
2666
±120
MCh
5122
6967
7909
5153
3780
4330
5544
±646§
*1
C
0.16
0.11
0.16
0.16
0.16
0.15
0.15
±0.01
MCh
0.35
0.32
0.42
0.34
0.19
0.31
0.32
±0.03#
Table 3. Peak responses to inhaled M c h in individual rats. Statistically significant differences from baseline: *
p<0.005, § pO.0001, # p<0.0005.
3.5 Discussion
In the present study the low-frequency forced oscillation technique has been modified
[5,26,28,135,136] to characterize airway and parenchymal mechanics in rats non-invasively.
As the current method allows long-term investigations, in which individual rats can be used
as their own controls to study the development (or resolution) of a disease process, w e
studied the individual and group variability of lung mechanics over a two-week period. The
results of this study demonstrated that our technique requires significantly smaller group
sizes to detect small, but clinically significant (10-50%) changes in airway or parenchymal
mechanics when using the rats as their own controls than to detect the same change from
independent groups. To assess the potential of our method to observe changes in the airway
and parenchymal mechanics, we determined the lung response to inhaled Mch. In agreement
with previous findings we found a significant parenchymal contribution to the overall lung
constriction [5,138,139]. W e should note, however, that enhanced inhomogeneity of the
peripheral airways during constriction may add a significant virtual (not tissue origin)
component to the pulmonary G, and hence r\ [5,28]. Previous work by Petak et al. [5] has
demonstrated that even in the presence of moderate, methacholine induced constriction that

79
the changes seen in H are unaffected by peripheral airway inhomogeneities. Thus, the
marked and statistically significant increase in H may indicate a real alteration in the
mechanical properties of the parenchymal constriction. In contrast, the substantially greater
lung responses in G and r\ is likely to be influenced by peripheral airway inhomogeneities
r, [5,28].
Rats are commonly used to characterize the development of allergic respiratory diseases,
such as asthma, since the response of the lung to exogenous constrictor agents and allergic
inflammation in this animal model is well documented. Furthermore, recent studies on
different animal species have demonstrated the importance of the tissue resistance in
detennining baseline lung mechanics and the lung responses to various stimuli
[5,26,28,135,136,138-143]. Most of the previous techniques to measure parenchymal
resistance (e.g. alveolar capsule) in rats are invasive [138,140-142]. Although these
techniques provide details of the parenchymal mechanics, they are not suitable for repeated
measurements on the same animal. Therefore, either large number of animals were needed
or the statistics were not convincing to detect slight long-term changes in lung mechanics
that were present. Indeed, w e statistically calculated in the present study that the baseline
variability in parenchymal mechanics leads to a study using impracticably high numbers of
rats (N=64) to detect 2 0 % change in G. Recently, Oostveen et al developed a technique
to collect Zrs data in conscious rats non-invasively, using a two-compartment whole body
box [144]: Using their method, Hessel et al. examined the long-term reproducibility of Zrs
data in unanaesthetized mice [145]. The frequency range used in this technique (16-208
Hz), however, is unable to provide information about the resistive properties of the
respiratory tissues.
3.5.1 Validity of Pes measurement
A critical factor in measurement of lung mechanics in the intact chest is the ability of the
esophageal catheter system to accurately represent pleural pressure (Ppl). Generally, the
occlusion test is used to assess the validity of this hypothesis, in which the Pes/Ptr ratio is
recorded during spontaneous respiratory efforts or as a result of an externally applied force
on the chest [130] while the trachea is occluded. D u e to the absence of airflow during these
maneuvers, the Ptr is expected to be equal the alveolar pressure (Palv). Since changes in Pes

80
are also reflected in Palv, the slope of Pes/Ptr is expected to be one. In this study the
esophageal catheter was positioned based on the criteria of a smooth Pes trace with minimal
cardiac artifact and a good agreement between Ptr and Pes during airway occlusion. Indeed,
w e found a Pes/Ptr ratio of 0.97±0.02 indicating an accurate estimation of the average Ppl
in the rats during control condition.
While it is generally accepted that Pes can be used to estimate Ppl in control state, the
relevance of this conclusion during induced constriction is not evident. Suki et al. measured
MCh-induced responses in intact and open chest dogs [143]. while they found a
significantly greater lung response in the open chest, they also concluded following a
detailed analysis of the Z w spectra in control and constricted states that Pes measurement
can be used to partition Zrs to Zl and Z w even during induced constriction. In the present
study, analysis of the Z w parameters revealed good agreement in control condition and
following M C h challenge, confirming that Zrs partitioning is likely to be correct via Pes
measurements in rats even during MCh-induced constriction.
3.5.2 Lung parameters
The R a w values obtained in the present study from the intact chest Zl data were in all cases
significantly higher than those reported previously in tracheotomized rats
[5,28,135,138,140,141]. The fact that a significant part of our R a w values are attributed
to the flow resistance of the E T tube (98 of 166 cmH20.s/L) explains the majority of the
discrepancy between our present results and previously reported R a w values. Indeed if the
contribution of the E T tube to R a w is taken into account, our results are in good agreement
with those obtained using a similar measurement technique [5,28,135]. The systematically
lower R a w values derived by Nagase et al [138,140,141] with alveolar capsules during
tidal breathing (ranging from 24 to 35 cmH20.s/L) can be explained by the higher average
lung volume present during their measurements.
Lutchen etal. [28] and Petak et al. [5] determined G and H by modelling the low-frequency
Zlo spectra in open chest rats, and found 30-50% lower values than those obtained in the
present study. This can be attributed to body weight and strain differences. Our Rti values
calculated from the intact chest Zl data at the ventilation frequency (ranging from 32 to 70

81
cmH20.s/L) are comparable to those reported in the literature previously by Nagase et al
(38-43 cmH20.s/L) [138,140,141] and Navajas et al. (35 cmH20.s/L)[142]. Calculating El
from the intact chest XI data at 1.5 H z revealed significantly higher values (2400 to 4057
cmH 20/L) than those in previous studies performed in open chest rats (1233 to 1530
cmH 20/L) [28,138,140,141,146]. Beside body weight and strain differences, this
discrepancy can be attributed to methodological differences as in the latter studies El was
determined in thoracotomized rats during tidal ventilation.
3.5.3 Lung and chest wall contributions
Hantos et al [135] measured low-frequency Zrs and Zl spectra in intact and open chest
rats, and found a minor chest wall contribution to the Newtonian resistive properties of the
respiratory system, whereas the chest wall conferred the majority of the frequency
dependence of Rl (analogous to G ) . These findings are in qualitative agreement with the
results of the present study. Previous studies examining lung and chest wall components of
the total respiratory elastance in rats reported a relatively low (32-35%) chest wall
contribution [135,147]. The results of the present study with H w contributing 4 2 % to Hrs
is consistent with these previous findings.
3.5.4 Comparison of in situ and open chest conditions
Although w e kept the lung configuration in the open chest as close as possible to that of the
intact chest, significant differences were found in the pulmonary mechanics. While no
change was observed in G, significant differences were seen in Raw, law, H, and r| between
the intact and open chest conditions. Suki etal. [136] investigated the differences in airway
and lung tissue mechanical properties in dogs when they measured in situ and open chest
conditions, and found small but significantly different airway and parenchymal properties.
In their study no change was found in G, while R a w and TJ tended to increase following
chest opening. They also found a statistically significantly higher law and lower H in the
open chest condition. The present study demonstrated a similar pattern with the only
exception of Raw, which decreased. The matching of lung mechanics between the intact and
open chest conditions is critically dependent on matching the respective lung volumes. If
the Ptp was overestimated resulting in an increased lung volume in the open chest condition
a decreased R a w may be expected. The fact that our P E E P levels were relatively low (1-2

82
c m H 2 0 ) makes this argument unlikely, however species difference may play a role:
relatively small absolute errors in the P E E P would lead to a larger relative error in the rat
than in dogs, because the Ptp in the latter is higher. Alternatively the differences seen could
be due to alterations in the ventilation distribution. With the chest-wall intact, the increase
in lung volume will occur in a more-or-less even fashion. However, without the resttaining
influence of the chest wall, most of the increase in volume may occur anteriorly, with little
increase in the volume of the posterior lung units. The resulting distortion of the lungs could
have variable and unpredictable effects on lung mechanics.
3.5.5 Conclusion
In conclusion, w e have adopted a method to characterize airway and parenchymal
mechanics in rats non-invasively. W e demonstrated that this measurement technique is
suitable for studying the progression of disease or long-term treatment effects with
relatively small group size. The chest wall has been shown to contribute significantly to the
overall tissue mechanics of the respiratory system, while it has a negligible effect on airway
mechanics. Therefore, the present technique can be used to estimate long-term changes in
airway mechanics without Pes measurement, whereas estimation of the transpulmonary
pressure (either in an open chest animal or Pes) is advocated to study long-term responses
in Rti.

83
CHAPTER 4: CHEST WALL AND NASAL
CONTRIBUTIONS TO LOW-FREQUENCY
RESPIRATORY IMPEDANCE IN INFANTS
4.1 Summary
In 2 separate populations the low-frequency respiratory system impedance (Zrs) was
partitioned into lung (Zl) and chest wall (Zw) compartments (Study 1: n=5, mechanically
ventilated patients undergoing cardiac surgery) or nasal (Zn) and lower respiratory system
(Zlrs) (Study 2: n=l 1, spontaneously breathing infants) compartments using an esophageal
or nasal catheter, respectively. In both populations an oscillatory signal (Study 1: 0.5 - 12
Hz, and Study 2: 0.5 - 21 Hz) was applied during a pause in breathing to obtain the
respective impedance spectra. In both studies the Zrs spectra could be reliably partitioning
into either Zl and Zw, or Zn and Zlrs components. A model of the lung containing an airway
and tissue compartment was then fitted to the spectra. The airway compartment consisted
of a frequency-independent resistance (R) and inertance (I), while the tissue compartment
was described by a constant-phase tissue damping (G) and elastance (H). The nose was
found to contribute approximately half of the airway resistance (44.6±4.9%; m e a n ± S E M )
and a majority of the respiratory system inertance (71.7±3.5%), while exhibiting negligible
influence on the frequency dependent tissue mechanics. The chest wall made no appreciable
contribution to the frequency independent properties of the respiratory system, but made
a significant contribution to the Grs and Hrs (38.5 ± 7.3% and 34.4 ± 7.4%, respectively).
In conclusion the infant low-frequency respiratory system impedance can be represented as
a series element containing Zn, Zl and Zrs compartments. Future studies investigating
changes in tissue or airway mechanics should use esophageal or nasal catheters, respectively
to increase the sensitivity of the tests.

84
4.2 Introduction
Current methodologies for ascertaining lung function in infants involve measuring flows and
pressure via the nose in sedated patients [7,38,47]. These tests include the nose and extra-
thoracic airways, the chest wall as well as the pulmonary airways and tissues and it is the
pulmonary component that is of primary interest.
The frequency dependence of the mechanical properties of the respiratory tissues is well
established [7,18,148]. The low-frequency forced oscillation technique has been shown to
simultaneously provide information on airway mechanics as well as characterize the elastic
and resistive tissue properties in animal [4,149] and human studies [7,96,116]. Numerous
studies have reported estimates of resistance and compliance of the respiratory system,
chest wall and the lungs during mechanical ventilation. However, despite the fact, that the
short apnoeic periods required for low-frequency impedance measurements can be easily
achieved in anaesthetized, paralyzed patients, only a few Zrs [150] data below 2 H z have
been reported in adults and no such data is available in infants or young children. Petak et
al [12] have demonstrated that non-invasive longitudinal measures of Zrs, Zl and Z w can
be obtained through the use of an esophageal pressure catheter and the low-frequency
forced oscillation technique in anaesthetized, paralyzed Brown Norway rats.
In infants undergoing lung function tests the nasal resistance (Rn) may account for a
significant proportion of the overall respiratory system resistance [120,151,152]. As infants
are preferential nose breathers in the first few months of life it is important to measure the
active respiratory circuit. Nasal resistance (Rn) [153,154] and impedance (Zn) [155] have
been well characterized in older children and adults, while relatively few studies have been
conducted in infants [120,151,152,156]. These studies have used a number of adaptations
of the existing rhinometric [151], esophageal [152,156] or forced oscillation techniques
(FOT)[120] to characterize the nasal resistance or impedance.
The aims of the present study were: 1) to adapt the technique developed by Petak et al. [12]
and to determine the airway and tissue properties from low-frequency Zrs, Zl and Z w
spectra in anaesthetized, paralyzed infants and young children; 2) to characterize the
frequency dependence, resistive and inertive properties of the nasal impedance; and 3) to

85
determine the relative contributions of the nose, chest wall and lung to low-frequency
respiratory system mechanics.
4.3 Methods
The study was conducted in 16 subjects separated into 2 populations. The partitioning of
the respiratory system into pulmonary and chest wall components was carried out in
patients undergoing cardiac surgery (n=5). The second part of the study to investigate the
nasal impedance characteristics was carried out in sedated infants (n=l 1).
4.3.1 Subjects
4.3.1.1 Determination ofZl and Zw
Five children undergoing cardiac surgery were studied. Anthropometric data are presented
in Table 4.1. None of the children had acute respiratory symptoms at the time of the
measurement and none had history of chronic respiratory disease. T w o children were
operated on for atrial septal defect (ASD), one for ventricular septal defect (VSD) and two
for transposition of the great arteries (TGA-VSD). The protocol was approved by the
institutional H u m a n Ethics Committee and written parental consent obtained.
Following oral midazolam premedication (0.75 mg/kg), the children were anaesthetized by
intravenous (iv) administration of fentanyl (5-15 ug/kg) and midazolam (0.1-0.2 mg/kg).
Muscle paralysis was accomplished by an iv bolus of pipecuronium bromide (0.1 mg/kg).
Maintenance doses of the anaesthetic and muscle relaxants were administered as needed.
The patient was intubated with an uncuffed endotracheal tube (3.5-6 m m ID) and the
children were mechanically ventilated with a Siemens Servo Ventilator 900C in constant
flow mode by setting the inspiratory/expiratory ratio (I:E) to 1:3. The ventilator frequency
was set to 18-28/min and a tidal volume (VT) of 8-12 mL/kg was applied. The children
were in the supine position throughout the study.
Respiratory pressure, end-tidal C02, the fraction of inspired oxygen (Fi02), and the dynamic
respiratory compliance (Crs) were monitored by a Siemens Servo Computer Module (Type
990) attached to the respirator. Arterial blood gases were analyzed (Radiometer A B L ™
505) and the percutaneous 0 2 saturation was continuously followed (Datex Satlite).
Electrocardiogram, arterial, central venous, pulmonary arterial and left atrial pressures were

86
displayed on a monitor of a data acquisition system (Hewlett Packard M996).
4.3.1.2 Characterization ofZn
This study involved 11 infants ranging from 8 months to 2 years recruited from the general
population. Respiratory history was determined from a parental questionnaire.
Anthropometric data on the infants are outlined in Table 4.2. At the time of testing all
infants had been free of respiratory infections for a period of at least four weeks. The infants
were sedated with an oral dose of choral hydrate (70-100 mg/kg) and were laid in the
supine position with the head supported in the midline with the neck slightly extended. The
experimental protocol was approved by the H u m a n Ethics Committee of the Princess
Margaret Hospital for Children. Parents gave written informed consent and were generally
present during the study.
Table 4.1. Physical and clinical data on the cardiac patients
Patient
1
2
3
4
5
Age (mths)
72
48
84
90
36
Weight (kg)
16
16
30.5
17.7
15.2
Height (cm)
114
106
133
124
95
Sex
M
M
M
F
F
Diagnoses
TGA-VSD
VSD
ASD
TGA-VSD
ASD
4.3.2Measurement apparatus
4.3.2.1 Determination ofZl and Zw
See Section 2.2.2.2 for full details.
The measurement set-up used to collect Zrs data on spontaneously breathing infants [7] was
modified to measure impedance in the intubated children. Preceding oscillatory
measurements the lungs were inflated to a pressure of about 30 c m H 2 0 to standardize the
volume history. During the apnoeic period, smaU-amplitude pseudo-random pressure
excitations were introduced into the trachea. The forcing signal contained thirty integer-
multiple components of the fundamental frequency 0.4 Hz, resulting in a frequency range
of 0.4-12 Hz. Four to six recordings were collected in intact-chest condition. Periods of
at least 2 min were interposed between the successive measurements. The impedance curves
were then ensemble-averaged.

87
Table 4.2: Anthropometric data
Patient
6
7
8
9
10
11
12
13
14
15
16
Age (mths)
9.3
14.5
10.9
12.5
18.1
8.4
19.8
18.1
18.3
21.0
25.2
Weight (Kg)
10
10
8.7
9.2
10.5
11.2
10.5
11
12.8
14.9
11
Length (cm)
67
70
71
71.5
75
76
79
80
80.5
87
90
History
Healthy
Healthy
Healthy
Healthy
Wheezy
Healthy
Wheezy
Healthy
Healthy
Healthy
Cough
To separate Zrs into Z L and chest wall (Zw) components in the intact-chest, the esophageal
pressure (Pes) with reference to the atmosphere was measured. The pressure drop across
the chest wall was monitored during mechanical ventilation, and the catheter was positioned
to obtain a smooth respiratory curve with ininimal cardiac noise. The mechanical impedance
of the respiratory system was calculated from the Ptr and V signals (Zrs = Ptr/V'). The
chest wall impedance was computed directly from the Pes and V signals (Zw = Pes/V1),
while Zl spectra were obtained by subtraction (Zl = Zrs-Zw).
4.3.2.2 Characterization ofZn
See Section 2.2.2.1 for full details
Respiratory system input impedance (Zrs) were measured using the low-frequency forced
oscillation technique during a pause in breathing induced by the Hering-Breuer reflex as
described by Sly et al. [7]. Nasal pressure (Pn) was determined using a solid state miniature
tipped catheter ( M T C 5F; Drager, Best Netherlands) placed 4-5 cm into the nasal cavity,
slightly above the nasopharynx. The infant, loudspeaker and a pressure reference chamber
was inflated three times to a transrespiratory pressure of 20 cmH20 with passive deflations
between each inflation. Following the third inflation, the airway was occluded inducing the

88
Hering-Breuer reflex. In the apnoeic period, a low-frequency pseudo-random signal,
between 0.5 and 21 H z was driven into the infant's respiratory system by the loudspeaker.
Five to ten measurements of the respiratory system (Zrs) and the lower respiratory system
(Zlrs) were collected in each infant.
The corrected individual respiratory impedance spectra were then fitted to a linear model,
in the 0.5-15 H z range [26] including: R and I equating to the frequency-independent
resistance and inertance of the airways, respectively and G and H representing the
constant-phase tissue damping and elastance, respectively. The impedance of the nose (Zn)
was calculated from the respiratory parameters of Zrs and Zlrs (e.g. Rn=Rrs-Rlrs). Tissue
hysteresivity (r|) was calculated as G/H [137].
4.3.3Study protocol and analysis
4.3.3.1 Determination ofZl and Zw
Baseline oscillatory parameters were averaged for each patient (mean±SD) and the
individual contributions of Zl and Z w mechanics to Zrs mechanics calculated.
4.3.3.2 Characterization ofZn
Lung function for each infant was expressed as the mean ± S D of the individual respiratory
parameters. In a sub-group of patients (n=4) the effect of introducing the nasal pressure
catheter was assessed. Linear regressions were used to quantify the frequency dependence
(Fd) of the nasal resistance and reactance. Group means and standard errors of the
mean(SEM) are reported for R n and Xn. Pearson Product Moment correlation was used
to examine the relative contribution of the nasal impedance to Zrs and its association with
growth. Significance was accepted at p<0.05.
4.4 Results
4.4.1 Determination of Zl and Z w
Representative Zrs, Zl and Z w impedance data (child #4 ) and the corresponding model fits
are demonstrated in Figure 4.1. The plateau evident at higher frequencies represents the
resistance of the airways and the chest wall. The domination of Zrs by Zl at these higher
frequencies indicates the major contribution of R a w to Rrs, with the chest wall playing a

89
negligible role. The negative frequency dependence of Rrs and Xrs at lower frequencies
represents the frequency dependant mechanical properties of the respiratory tissues and
chest wall. Negligible chest wall contribution to the inertive properties of the respiratory
system is evident in the high-frequency imaginary parts of the impedance spectra. Data
points corrupted by cardiac artifacts were ignored. The model fitted all impedance data well
with only a slight systematic fitting error at the low-frequency real parts. Individual
pulmonary and chest wall components of the total respiratory mechanical parameters are
shown in Figure 4.2.
20 -,
w
E o 5 CO
S. E o CD
15
10
5
0
50
40
30
20
10
0
0.6 n
0.4
0.2 -
0.0
Zrs
Zrs
ZL
•
v
o S
ZL
"fl" ~
Zw
Zw
a, E o CO
40
20
-20
250
200 -
g.,150 E 3. 100 X
50 -(
0
9
Zrs
Zrs
ZL
I o
ZL
Zw
Zw
Zrs ZL Zw
Figure 4.1: Representative Zrs (•), Zl (•) and Zw (•) spectra from child #4. Baseline spectra were averaged
(mean±SD). The corresponding model fits are shown as solid lines. Frequencies affected by cardiac noise or
it's harmonics have been excluded from the fit and are not shown.
While w e found a great scatter in the individual parameter values, which mainly reflect the

90
differences in body size, the relative contributions of the lungs and the chest wall to the
mechanical properties of the total respiratory system were uniform. The lungs determined
primarily the R and I parameters of the total respiratory system (90.8±4.3% and
109.3±16.4% for R and L respectively) while contributing a majority of the total respiratory
G (61.5±7.3%) and H (65.6*7.4%). The -q was highest for the chest wall (0.30±0.06), while
it was the lowest for the pulmonary system (0.20±0.03).
4.4.1 Characterization of Zn
Figure 4.3 illustrates an averaged impedance measurement and its corresponding model fit
for Zrs and Zlrs. Zn is also shown. The negative frequency dependence of Zrs and Zlrs
within both the resistive (Rrs) and reactive (Xrs) components represents the frequency
dependence of the respiratory tissues. The resistive plateau observed at higher frequencies
is associated with the frequency independent properties of the airways and nasal pathways.
The zero crossing point in Xrs represents the resonant frequency of the respiratory system
and is predominantly influenced by the inertance of the nasal cavity. The frequency
dependence (Fd) of the nasal resistance (Rn) and reactance (Xn) was assessed by
deterrnining the slope of the regression line across the frequency range (0.5-15 Hz) for each
child. The resistive properties of Zn are predominately frequency independent, with a Fd
of-0.03±0.03 (mean±SEM; range: 0.14-0.22). The reactive component exhibits a strong
linear frequency dependence across the whole spectra and predominantly represents the
inertive properties of the nasal cavity, with a Fd of 0.91±0.17 (range: 0.44-2.46).

91
40
b
20
*
~i »i»* **» * • « »
Frequency (Hz) 10
Figure 4.2: Individual respiratory, lung and chest wall mechanics (shown as symbols). Group mean data are also
shown (solid lines). The chest wall contributed a negligible amount to the Rrs and Irs and significantly influences
the tissue visco-elastic properties of the respiratory system.
Nasal impedance was found to contribute significantly to the airway properties of the
respiratory system, but to have a negligible effect on the tissue mechanics (Figure 4.4). The
lung and nasal pathways had approximately equal contributions to the airway resistance of
Zrs (55.4±4.9% and 44.6±4.9%; mean±SEM, respectively), while the nasal cavity
dominated the overall inertance of Zrs (71.7±3.5%). The lower respiratory system
contributed exclusively to the tissue mechanics of the respiratory system (93.4±2.1% and
95.3±2.1% for G and H respectively). The relative contribution of the airway and
parenchymal mechanics of both the lower respiratory system and nasal cavity to the overall
respiratory system mechanics was found to have no systematic variation with body length.
In a subgroup of 4 infants the effect of the nasal catheter placement on Zrs was assessed.
N o significant effect was found in any parameter (Table 4.3)

92
60 -,
40
•a 20-
20
W 1 -20
s o
-40 -
-60
-80 J
Frequency (Hz) 10
Figure 4.3: Representative spectra from an individual infant. Average Zrs (•), Zlrs (A) and Zn (•) spectra
(mean±SD) are shown and their corresponding model fits (solid line). Open symbols represent data points
corrupted by cardiac noise and are excluded from the model fit.

93
Table 4.3: Effect of nasal catheter placement of airway and respiratory tissue mechanics
Patient
2
4
6
10
Mean
(SEM)
Raw (cmH20.s/L)
Pre
18.29
(3.27)
8.99
(1.09)
14.04
(0.61)
19.91
(1.63)
15.16
(2.36)
Post
16.14
(0.54)
11.27
(1.20)
17.03
(0.50)
22.59
(1.71)
17.16
(2.66)
law (cmH20.s2/L)
Pre
0.12
(0.01)
0.07
(0.03)
0.11
(0.01)
0.16
(0.02)
0.11
(0.02)
Post
0.11
(0.003)
0.07
(0.01)
0.14
(0.01)
0.18
(0.02)
0.13
(0.02).
Grs (cmH20/L)
Pre
25.6
(2.18)
23.6
(5.82)
26.7
(2.77)
58.4
(8.19)
34.5
(9.2)
Post
31.3
(0.27)
22.3
(10.09)
26.1
(7.29)
48.8
(13.06)
32.4
(6.1)
Hrs (cmH20/L)
Pre
118.9
(1.8)
105.1
(5.3)
145.9
(4.0)
158.2
(8.60)
132.7
(12.7)
Post
122.3
(6.0)
102.1
(9.1)
134.6
(3.1)
140.4
(17.8)
128.8
(11.3)
Table 4.3: Individual and group infant data for pre- and post nasal catheter placement (Individual data;
mean(SD) and group data; mean(SEM)). N o significant difference was seen following catheter placement.
4.5 Discussion
The purpose of the present study was to: firstly, determine the low-frequency impedance
spectra of the nose, chest wall and pulmonary components of the respiratory system and
secondly, to calculate the contribution of these components to the constant-phase model
parameters of the Zrs. Respiratory system, chest wall and lung impedance data were
determined in five children, prior to the chest being opened for cardiac surgery, at
frequencies encompassing the spontaneous breathing rate during short apnoeic periods
introduced into the mechanical ventilation. Zrs and Zlrs spectra were determined in 11
spontaneously breathing infants, during a pause in breathing, induced by the Hering-Breuer
reflex, at a transrespiratory pressure of 20 cmH20. Furthermore these impedance spectra
were fitted to the constant-phase model [4] allowing simultaneous assessment of the airway
and tissue mechanics of the respiratory system and lung, the mechanical properties of the
chest wall, and the resistive and inertive properties of the nose. The overall contributions
of the nose, chest wall and the lung to the respiratory system were also quantified.

94
to
d.
f o
20
10-
0.2
0
50
25-
f 0.1
»:§:§sSj
f
0.0
150
100 -
50-
-
I T
J888HHfa«.
Zrs Zlrs Zn Zrs Zlrs Zn
Figure 4.4: Partitioning of respiratory system mechanics (open bar) into lower respiratory (diagonal bar) and
nasal Oiatched bar) mechanics. Group mean data (±SEM) are shown. The lower respiratory system contributed
approximately half of the resistance, but had a minor influence on the inertance of the respiratory system.
Respiratory system tissue damping and elastance were exclusively located in the lower respiratory system with
the nasal pathways having a negligible contribution to the tissue mechanics.
4.5.1 Partitioning of Zrs into Zl and Z w
4.5.1.1 Total respiratory impedances
It was demonstrated that, in agreement with spontaneously breathing infants [7,76] and
various animal species [4,5,149], the marked frequency dependence of the Zrs can be
described by a model containing a frequency independent airway and a constant-phase
tissue compartment. The constant-phase model of the lung has been shown to reliably
describe the mechanical properties of the respiratory airways and tissues [5], Lutchen et al
[27] demonstrated that in the presence of peripheral airway inhomogeneities, resulting from
severe constriction or inhomogeneous ventilatory distribution patterns, that a non-tissue
related component may be present in the model estimation of tissue damping (G).

95
Peripheral ventilation inhomogeneities may be present due to partial airway closures in our
supine sleeping children. To minimize this phenomenon in the present measurements of Zrs
a deep inflation before successive Zrs measurements was performed to ensure recruitment
of possibly atelectatic lung regions. Furthermore, the presence of a virtual G component
would be reflected in an unusually high respiratory system ri values, however this was not
the case in the present study (n,rs: 0.17-0.27). Therefore while the possibility of peripheral
inhomogeneities cannot be excluded it is likely that any component of G that is non-tissue
related would be negligible, thus it can be concluded that the airway parameters derived
from the low-frequency Zrs spectra represent the flow resistance of the bronchial tree while
the model parameters of the tissue compartment characterize reliably the viscoelastic
properties of the respiratory tissues.
The Crs values calculated in the present study at 0.4 Hz (Crs = {Hrs co/©"}"1: 8.42±3.63
mL/cmH 2 0 ) were almost identical with values derived from the height-matched values of
Hantos et al (8.34±3.74) [157]. In contrast the mean value of Ers in the present study
(141.1±68.6 cmH 20/L) were approximately three times those found by Lanteri et al.
[158](51.1±17.9 cmH 20/L) using the multiple linear regression ( M L R ) technique during
mechanical ventilation in cardiac patients of similar heights. In the present study lung
mechanics were determined at F R C , while in the study by Lanteri et al. [158] lung
mechanics were estimated from 20 second epochs of V and Pao during mechanical
ventilation. Since Ers has been shown to decrease with increasing lung volume the higher
values of Ers in the present study are expected [107,148,159].
Despite differences in methodologies the derived Rrs values from the present study compare
well to those reported in the literature. The Rrs data in the present study (Rrs=Raw+Rt:
20.3±10.5 cmH20.s/L ; Rti=G/coa) compares well to that of cardiac patients of similar
height (25.2±9.6 cmH20.s/L) [158] and to those derived from regression equations
determined from normal children (27.4±6.9 cmH20/L/s) [61].
4.5.1.2 Lung impedances
Numerous studies have examined lung mechanics in adults both before and after chest
opening [148,160]. Lanteri et al. [158] determined the lung mechanics of 9 children
undergoing cardiopulmonary bypass surgery, 3 of which fall within the age range of the

96
present study. The mean height matched El of 24.4±10.9 cmH 20/L was lower than the
mean El in the present study (86.5±31.5 cmH20/L) and can be attributed to the lower mean
lung volumes used in the present study, with lung elastance reported to decrease
proportionally with increasing lung volume. [2].
4.5.1.3 Contribution qfZlandZw to Zrs
Reported contributions of the chest wall to respiratory system mechanics have been varied.
Barnas et al. [108] reported approximately equal contributions of the lung and chest wall
to the respiratory system elastance, independent of frequency, with the chest wall
contribution increasing slightly with decreasing tidal volume. The investigators also
reported chest wall contributions in excess of the pulmonary resistance at low frequencies.
Studies in adult humans have shown the frequency dependent characteristics of Zrs to be
predominantly due to the chest wall particularly at low frequencies [96]. Approximately
equal contributions of pulmonary and chest wall elastance obtained by small amplitude
oscillations at F R C were reported by Hantos et al [96]. Barnas et al. [148,160] reported
slightly lower chest wall contributions of approximately 40- 4 5 % and 17-23% of respiratory
system elastance and resistance, respectively at a Vt of 250mL. The differences between
these studies most likely relate to the lung volumes at which measurements were made
[148,160]. In the present study the chest wall contribution to the respiratory system tissue
damping and elastance was 38.5±7.3% and 34.4±7.4% respectively. Papastamelos et al
[65] demonstrated increasing chest wall contribution up to 3.5 years of age. In infants
underl year of age the chest wall comprised approximately 2 5 % of the total respiratory
system elastance, this increased to 4 5 % in infants older than 1 year of age. Sharp et al
[161] reported chest wall elastance approximating 4 0 % of Ers. This contribution was found
to be constant in children between 3 and 18 years of age. In a group of five infants Nicolai
et a/. [18] reported that the chest wall elastance was frequency dependent, but that the
contribution of the chest wall to the respiratory system elastance did not change with
frequency. The contribution reported by the investigators (19±6%) is lower than that in the
present study and is most likely related to the older patients in the present study and the
increased E w resulting from small amplitude oscillations. Lanteri et al. [158] determined
lung mechanics in 9 children undergoing cardiopulmonary bypass surgery with the chest
wall contributing approximately 3 0 % of Ers, of these 9, 3 are within the age range of the

97
present study with the chest wall contributing 37.3±19.9% to Ers and these values are
comparable with those of the present study.
4.5.2 Partitioning of Zrs into Zn and Zlrs
The present study has demonstrated that the low-frequency forced oscillation technique can
be adapted to obtain reliable estimates of nasal impedance, that the C P M can be applied to
Zrs and Zlrs and the resultant mechanics of the infant nose determined. Measurements of
nasal resistance using rhinometry are well established in adults and older children [153,162-
164]. The forced oscillation technique has also been applied in the adult patient group using
measurements at the mouth and nares [165], utilizing the Valsalva manoeuvre [166] or by
measuring impedance at the mouth with the nose open and closed [155]. These techniques
have proved difficult to translate into an infant population. Stocks and Godfrey have
described an adaptation of the posterior rhinometry technique for use in infants [151], while
Desager et al. [120] used an adaptation of the F O T to quantify the frequency dependence
of the nasal impedance above 8 Hz. The present study is the first to characterize the low-
frequency characteristics of the nasal impedance and its influence on the total respiratory
input impedance in infants.
The acute affects of the nasal catheter were examined in a sub-group of patients. No
significant effect was seen in any respiratory parameter (Table 4.3). This is in contrast with
the results previously reported by Stocks et al. [167]. In a group of 4 Caucasian and 3
black preterm infants the author reported a mean increase of 1 0 1 % and 5 0 % respectively
when a nasogastric feeding tube (NGT) was passed through the larger nostril. The change
was more pronounced if the N G T was passed through the smaller nostril. In both studies
the catheter size was identical (FG5). The differences can be attributed to the size of the
infants at the time of testing. In the previous study [167] all of the infants were preterm and
were studied in the first 4 weeks of postnatal life, whereas the current study was carried
out in term infants ranging from 8 months to 2 years postnatal age. Hence the cross-section
area of the nose in the present would be considerably larger and the effects of the catheter
accordingly reduced.
4.5.2.1 Contribution ofRn to Rrs
In the present study R n was found to contribute 44.6±4.9% (mean±SEM) to Rrs. This

98
compares well to previously reported data of 4 9 % using posterior rhinometry [151] or 2-
4 9 % with oscillations above 8 H z [120] The influence of the nasal pathways to the total
respiratory damping (Gn/Grs) was negligible (6.6±2.1%). Desager et al [120] reported
minimal resistive frequency dependence in both normal and asthmatic children with a slight
negative dependence in children with a higher Rn. The authors however only examined
frequency dependence at 24 and 48 Hz. Using a lower frequency range of 3-15 H z Fullton
et al. [165] found the frequency dependance of the nostrils in parallel to be miiiimal in
normal adults. In the present study there was no significant resistive frequency dependance
regardless of symptomatic history although the numbers are small (healthy n=8,
symptomatic history n=3). The frequency dependance of the respiratory system resistance
predominantly results from the mechanical behaviour of the pulmonary tissues [7,26]. The
lack of frequency dependance, in R n indicates that the resistive properties of the nose can
be attributed solely to the nasal airway and that any frequency dependant resistive
component are negligible.
4.5.2.2 Contribution ofXn to Xrs
The nasal cavity provided the dominant contribution to the inertive properties of the
respiratory system (In/Irs = 71.7±3.5%; mean±SEM) while having a negligible influence on
the elastance of Zrs (Hn/Hrs = 4.7±2.1%). Previous studies have not attempted to
determine the influence of X n on Xrs. Desager et al [120] reported a positive frequency
dependance of X n with mean values of 0.9±3.7 cmH20.s/L at 24 H z and -0.1±1.9
cmH20.s/L at 48 Hz. While a direct comparison cannot be made, these results are
qualitatively similar to those reported in the present study.
In a cross-sectional study Stocks and Godfrey [151] found that the absolute values of Rn
decreased monotonically from birth to the end of the first year of postnatal life when plotted
against thoracic gas volume (TGV). However the percentage contribution of R n to R a w
remained relatively constant against T G V . This later result was reflected in the present
study. The percentage contribution of R n to R a w in the present population was relatively
constant with length in the population studied. Similarly the contribution of In to Irs was
also constant with length. This indicates that as in infant grows, the rates of change of the
respiratory system, lower respiratory system and the nose are approximately equal.

4.5.3 Conclusions
In conclusion, the results of the present study demonstrate that low-frequency mechanical
impedance spectra of the respiratory system, lung and chest wall can be reliably collected
in anaesthetized, paralyzed children prior to cardiac surgery. In addition the low-frequency
F O T can be used to partition the Zrs into nasal and lower respiratory components.
Partitioning of the lung and chest wall mechanics in the intact chest via Pes measurement
revealed the dominance of the lungs in the total respiratory mechanics in children. The
application the Zrs, Zl and Z w spectra to the constant-phase model allowed the
simultaneous assessment of the airway and lung parenchymal mechanics during surgery,
thus allowing any changes in the mechanical state of the lung to be monitored. The
quantification of the nasal impedance demonstrated the significant contribution of R n to
Rrs, with the nasal inertance dominating the respiratory system reactance. The ability to
partition the respiratory system into either lung and chest wall compartments or nasal and
lower respiratory system compartments will provide a greater degree of sensitivity to
diagnostic tests that wish to assess changes in respiratory system mechanics.

100

101
CHAPTER 5: DEVELOPMENT OF AIRWAY
AND RESPIRATORY TISSUE MECHANICS IN
HEALTHY INFANTS
5.1 Summary
Low-frequency respiratory impedance (Zrs) was measured by applying a forcing signal,
between 0.5 and 21 H z at a transrespiratory pressure of 20 c m H 2 0 , in a cross-sectional
study of 37 normal infants. A lumped parameter model containing airway (resistance (Raw)
and inertance (law)) and a respiratory tissue (tissue damping (G) and elastance (H))
compartments was fitted to the individual Zrs. Forced expiratory volume in 0.5 seconds
(FEV0.5) was determined using the raised volume rapid thoracic compression technique.
Multivariate regression analysis was used to analyze the relationships between the
mechanical properties of the airways and respiratory tissues and length. W h e n plotted as a
function of length, both airway and tissue parameters showed a decreasing quadratic
relationship with increasing length. FEV0.5 showed an increasing cubic relationship with
length. A family history of asthma was found to have a negative effect on Raw, H and
FEV0.5. The rate of change in airway mechanics was slower than the tissue mechanics
supporting the concept of dysanaptic growth within this population.

102
5.2 Introduction
The anatomical makeup of the respiratory system changes dramatically during the first years
of life. Developmental changes in the airways, chest wall and parenchyma occur, leading
to rapid transformations of the respiratory system mechanical properties. Previous studies
have shown consistent increases in spirometric indices until early adulthood, followed by
a slow decline in lung function with increasing age [168,169]. Standard spirometry is not
suitable for children younger than 6-7 years of age and hence cannot be used to describe
mechanical changes in the respiratory system of infants or young children. The rapid
thoracic compression technique (RTC) and more recently the raised volume rapid thoracic
compression ( R V R T C ) technique have been used to describe the changes in FEVi, F V C
and forced flows in sedated infants with respect to age, following administration of
broncho-active agents and in disease [38,47,131,170,171]. The interrupter technique has
been used to partition the respiratory system resistance (Rrs) into airway resistance (Raw)
and a visco-elastic tissue component and also to calculate quasi-static compliance [61]. The
R T C and R V R T C techniques, are limited to providing information on spirometric changes
in the age groups studied. Techniques that measure pressure and flow at the airway
opening, are limited to the inspiratory phase of respiration or in intubated patients under
general anaesthesia [61] and provide limited information.
A number of investigators have used the FOT to determine the mechanical properties of the
respiratory system in spontaneously breathing children using frequencies well above the rate
of spontaneous breathing (2-6 Hz) [102,157]. T o adequately describe the mechanical
properties of both the airways and the tissues, the oscillatory signal must incorporate
frequencies below that of the spontaneous breathing rate, the frequency dependence of the
resistive and elastic properties of the lung at low frequencies has been well established
[96,172]. Sly et al [7] recently described a technique that used the Hering-Breuer reflex
to induce a pause in breathing in sedated infants allowing reliable low-frequency respiratory
impedance spectra (Zrs) to be collected and partitioned into airway and tissue parameters.
The present study was performed to measure airway and lung tissue mechanics in healthy
infants in the first two years of life. Since both the R V R T C and low frequency forced
oscillation techniques were used in this study, w e were able to determine h o w oscillatory
and forced expiratory parameters reflected the changes in mechanics with growth.

103
5.3 Methods
5.3.1 Subjects
This was a cross-sectional study involving 36 infants (15 male, 22 female) of ages ranging
from 7 weeks to 2 years, recruited from the general population. Information regarding
parental smoking status (maternal, paternal and both parents: n=3,5 and 5, respectively) and
history of asthma in immediate family members (negative, positive and unknown: n=21,14
and 2 , respectively) were obtained. Twelve infants had their lung function measured on two
separate occasions. Forced expiratory data were obtained on 28 infants, 8 of w h o m had
repeated lung function measurements (total observations=36), while F O T data were
collected on 28 infants, with 6 having repeated lung function (total observations=34). In 23
infants both FEV0.5 and F O T were obtained. Infants were free of history of asthma,
bronchiolitis or bronchitis and had fewer than 3 occurrences of lower respiratory illnesses
per year of life. Anthropometric data on the infants are outlined in Table 5.1. The infants
were sedated with an oral dose of choral hydrate (70-100 mg/kg) and were laid in the
supine position with the head supported in the midline and the neck slightly extended. The
experimental protocol was approved by the Human Ethics Committee of the Princess
Margaret Hospital for Children. Parents gave written informed consent and were generally
present during the study.
5.3.2 Measurement apparatus
5.3.2.1 Forced oscillation technique
See Section 2.2.2.1 for full details
Respiratory input impedance spectra (Zrs) were measured by using the low-frequency
forced oscillation technique during an apnoeic pause induced by the Hering-Breuer reflex
as described by Sly et al. [7]. Three inflations were applied to a circuit containing the infant,
the loudspeaker and a pressure reference chamber. At the end of the third inflation, the
airway was occluded at a transrespiratory pressure (Ptr) of 20 c m H 2 0 to induce the Hering-
Breuer reflex. In the resulting short apnoeic period, a low-frequency pseudorandom signal,
containing 16 frequency components in the 0.5-20 H z range, was driven into the infant's
respiratory system by the loudspeaker. Measurements were 6 s in length and examined for
leak or respiratory efforts, with corrupted recordings being excluded. Three to ten

104
measurements of the uncorrected input impedance of the respiratory system were collected
in each infant. The impedance of the dead space was considered as a lumped shunt
impedance in parallel with the respiratory system, and the corrected respiratory impedance
(Zrs) was calculated as described previously [7]. A linear model of the respiratory system
consisting of an airway and tissue compartment [26] was then fitted to the Zrs data, in the
0.5-15 H z range. The airway compartment contained a frequency-independent resistance
(Raw) and inertance (law), while the tissue compartment included a constant-phase tissue
damping (G) and elastance (H). Tissue hysteresivity (T|) was calculated as G/H [137].
Scatters in the anthropometrical data and the respiratory mechanical parameters were
expressed in S D values.
5.3.2.2 Raised volume rapid thoracic compression technique
See Section 2.5 for full details.
Forced expiratory data were obtained over an extended volume range using the technique
described by Hayden et al. [131]. The infants were inflated three times to a transrespiratory
pressure of 20 cmH 2 0 with passive deflations between each inflation. Utilizing a jacket
connected to a positive pressure reservoir, a compression force was applied to the thorax
and abdomen after the third inflation. The compression force was standardized to transmit
a pressure of 20 cmH 2 0 to the airway at end-inflation resulting in an airway opening
pressure of 40 cmH 2 0 [131]. Forced expiratory flow was determined, integrated and
volume-time curves were produced. FEV0.5, FEV0.75 and FEVi were calculated from the
forced expiratory volume-time curves. Three to ten technically correct measurements were
obtained from each infant.

105
Table 5.1: Anthropometric data
Patient #
1 2
2 Visit 2
3 4
4 Visit 2
5 6
6 Visit 2
7 7 Visit 2
8 8 Visit 2
9 10
10 Visit 2
11 12 13
13 Visit 2 14 15 17
17 Visit 2
18 19
19 Visit 2 20
20 Visit 2 21 22 23 24 25 26
26 Visit 2 27
| 28 ! 29
30 31 32 33 34 35 36
36 Visit 2
Gender
F M M F F F F M M F F F M M M F M M M F M M M M F F F F F F F F M F F F M F F F F M F F M M M
Age (weeks)
26.7
9.4 27.6
13.7
48.7
79.9 37.0
16.6
46.0
13.3 33.4
12.6 25.6 84.0 18.0 35.0
13.9 31.7 12.6
33.7 16.3 17.6 22.4
54.6 67.0 30.3 50.6 52.6 79.6 58.1 50.1 41.7 28.9 41.6 65.9 89.1 44.9 50.7
53.9 59.1 69.3 92.7
84.9 86.0
68.3
94.3 35.1
Height (cm)
70.0
58.0 68.0
58.0
70.0
81.0 67.0
60.0 71.0
61.0
74.0
55.0 62.0 87.0 64.0 67.0 64.5 65.0 65.5 76.0 66.0 66.0 67.5
80.5 80.9 68.5 72.8 77.0 86.0 70.0 71.5 72.0 73.0 73.0 74.0 79.0 76.0 76.5 77.0 78.0 78.9 81.0 81.7 82.4 82.5 83.0
70.0
Weight (kg)
8.9 6.3 9.6 6.1 7.9 10.4 10.0 6.4 8.7 6.0 10.0 4.2 6.7 14.9 6.9 8.3 7.5 7.4 7.6 11.3 8.9 7.9 8.3 11.8 12.5 8.2 9.8 10.8 13.2 10.0 9.2 9.6 10.0 8.4 10.2 11.5 10.5 10.9
8.2 12.0 11.4 11.2
11.2 11.3 14.4 12.5 10.8
RVRTC/FOT
y/y y/y y/y y/n n/y n/y y/y y/y n/y y/y y/y y/n y/y n/y yfy y/n y/y y/y n/y y/y y/n y/y y/n y/n y/y n/y y/y y/n y/n y/y y/y ym n/y n/y y/y y/n y/y y/n y/y y/n n/y y/y n/y y/y n/y y/y y/n
5.3.3 Study protocol and analysis
Baseline measurements using the low-frequency F O T and R V R T C techniques were
obtained from each infant. Multilevel models were used to examine the relationships
between lung function (natural logarithms of G, H, R a w and FEV0.5) and length (Lt). These

106
models accounted for the non-independence of the data due to the repeated measurements
for each child and repeated visits for some children. Initially, models with three levels
(individual observations, within separate visits and within children) were fitted, but variation
at the second level (that is, covariation between visits for the same child) was not
statistically significantly different from 0 after accounting for differences in Lt, so the model
was collapsed into a two level model. Lt (centred about the mean), Lt2 and Lt (after
centring) were potential covariates in all models. This allows a wide range of potential
functional relationships between Lt and response, varying from a straight line (coefficients
for Lt2 and Lt3 both 0) to a cubic curve with two turning points. Although a wide range of
other functional forms could have been considered, it is very unlikely that in a data set of
this size that a useful discrimination could have been made. Gender and family history of
asthma were considered as covariates to examine their influence. Smoking status was not
included due to small numbers. Family history of asthma was treated as a binary variable. To
examine the relationships between oscillatory parameters and FEV0.5 linear regression
models were used. As the oscillatory parameters are volume dependent and FEV0.5 is a
measure of volume, the oscillatory data were corrected for volume (using Lt as a substitute)
by multiplying oscillatory parameters by length. Four separate models were fitted, each
potentially including one oscillatory parameter and its square. Multiple regression models
including all oscillatory parameters and their squares were also fitted. A s the interactions
HZRaw and G/Raw were of interest, the inverse of R a w (length-corrected) was used rather
than Raw*Lt. The hysteresivity (rj) was also included as a potential predictor.
5.4 RESULTS
5.4.1 Low-frequency respiratory system mechanics
The relationship between natural log (Ln) of the oscillatory parameters and length was best
described by a quadratic equation (Table 5.2). M e a n individual values for Raw, G and H,
the fitted regression lines and 9 5 % confidence intervals are plotted in Figure 5.1. The mean
coefficients of variation within subjects were similar for all oscillatory respiratory
parameters (11.3±0.8%, 22.4±2.6%, 13.9±1.2% and 9.5±0.7%, for Raw, law, G & H
respectively: mean±SEM, Table 3). r| was found to have no significant systematic variation
with length (0.27±0.01) and was not modelled. As law is primarily influenced by the
extrathoracic airway it was not examined further. T o examine the concept of dysanaptic

107
growth in this population the rate of change in airway and tissue mechanics was examined
[61], by regressing Ln(Raw) against Ln(G) and Ln(H). Figure 5.2 demonstrates the
relationship between Ln(Raw) and Ln(G). The slopes of the regression equations were
comparable (0.47 and 0.49 for G and H, respectively).
5.4.2 RVRTC
The relationship between the Ln(FEV0.s) and length was best described by a cubic equation
(Table 5.2). Figure 5.3 shows mean individual FEV0.5 values against length, the fitted
regression line and 9 5 % confidence intervals. The mean intra subject coefficient of
variation (CV) was 7.6±0.7%. (Table 5.3).
Table 5.2: Regression Equations for the natural log respiratory mechanics
Equation
Ln(FEV0.5)=-27.718+1.329*Lt-0.0184*Lt2+(8.699*10-5)*Lt3
Ln(Raw)= 1.98 - 0.0513*Lt + (5.137*10-4)*Lt2
Ln(Iaw)= 0.0388 - 0.0293*Lt
Ln(G)= 9.723 - 0.1074*Lt + (iJS^W4)*^
Ln(H)= - 4.127 + 0.0859*Lt - (9.93*10"4)*Lt2
Variance
Within Child Between Children
0.01307
0.01718
0.14280
0.02854
0.01155
0.03866
0.05678
0.19830
0.05115
0.05399

108
^ 45-
30 -
15 -
80 90
Length (cm) Figure 5.1: Airway resistance (Raw), tissue damping (G) and tissue elastance (H) against length. Oscillatory
lung function parameters were fitted to a quadratic equation of length (solid line) , the long dashed line
represents the 9 5 % confidence intervals for the individual data. Mean measurements for each child are also
shown (•).

109
5.4.3 Comparison between F O T and R V R T C
All length corrected oscillatory parameters were well correlated with FEV0.5 (Regression
analysis R2: 26.8%, 16.5%, 62.9% and 72.8% for Raw, law, G and H, respectively).
FEV0.5 was best predicted by length-corrected elastance (H*Lt) and airway resistance
(Raw*Lt) and their squares ((H*Lt)2 and (Raw*Lt)2, respectively) (FEV0.5 = 865.4-
0.066(H*Lt)+1.9*10-6(H*Lt)2 -0.25(Raw*Lt) + 8.25*10"5(Raw*Lt)2; R2=79.3%,
p<0.0001). The addition of further parameters or interactions between parameters did not
significantly improve the model fit.
6 1
4 -
I 3
4
L n G (cmFfcO/L) Figure 5.2: Ln (Raw) vs. Ln (G). Solid dots (•) represent the mean Raw and G data in each child; solid line,
model best fitting these data (slope = 0.47).
5.4.4 Factors influencing lung function parameters
Gender was not a significant covariate within the present study. Family history of asthma
was a significant covariate for Raw, H and FEV0.5 (Raw: p<0.02, H: p<0.01 and
FEV0.5:p<0.005) and caused a worsening of lung function.

110
1 r
50 60 70 80 90
Length (cm) Figure 5.3: FEV0.5 vs. length. The relationship between FEV0.5 and Lt was best described by a cubic equation
(solid line), the long dashed line shows the 9 5 % confidence intervals for the individual data Mean measurements
for each child are also shown (•).
5.5 Discussion
The results of the present study show the mechanical properties of the respiratory system
over the first two years of life. The information obtained has been utilized to produce cross-
sectional reference values for the mechanical properties of the airways and the respiratory
tissues separately in sedated infants.
5.5.1 FOT
Previous data examining the changes with age in respiratory compliance (Crs) and R a w
have been determined using passive flow-volume manoeuvres, multiple occlusion technique,
multiple linear regression during mechanical ventilation and plethysmography
[32,61,69,74,173]. Table 5.4 shows Crs, Rrs and R a w values obtained from these
investigations in comparison with our values of Crs and Rrs calculated from the 0.5 H z
J
>*~i
>
qou -
300 -
150 -

Ill
impedance data, and the R a w determined by the model fitting.
Table 5.3: Coefficients of variation for respiratory mechanics
Study
Current Study
Turner [47]
Hayden [131]
Consensus Statement [32]
FEV0.5
7.6 ± 0 . 7 %
5.3 ±0.5
5.3 ±1.3
Raw G
11.3 ±0.8% 13.9 ± 1 . 2 %
11-15% (Rrs)
H
9.5 ± 0.7 %
10-13% (Crs)
In all cases the values for Crs reported by previous investigators for a similar study
population were higher than those ascertained in the present study. One possible
explanation for these differences could be the higher average lung volume applied in our
current measurements. Indeed Petak et al [76] reported a significant decrease in the
respiratory elastance (H) when the lung volume decreased from a Ptr of 20 c m H 2 0 to a
level of 10 c m H 2 0 . Further decrease in Ptr, however, caused significant elevations in H.
Therefore, it is more likely that the differences in techniques used in the current study and
those applied previously may explain these differences, since small-amplitude oscillations
result in a significantly smaller Crs, particularly of its chest wall component [4,107].
The Rrs data reported in the present study are comparable with those reported by previous
investigators (Table 5.4). The slight differences can be explained primarily by the higher
lung volume applied in the present study, which causes a marked decrease in the airway
component of Rrs [76].
The values for Raw reported in the literature vary greatly depending on the technique used
(Table 5.4). Lanteri et al. [61] reported values of R a w at 25, 50 and 7 5 % of expired
volume in intubated, mechanically ventilated children using the occlusion technique. The
R a w reported in the present study is higher than that of the R a w at 2 5 % of expired volume
reported by Lanteri et al. (Table 5.4) [61]. The current values for R a w include the upper
airway and nasal resistance while these components were excluded in their study due to the
subtraction of the resistance of the E T T from their estimate of Raw. Plethysmographic R a w
data reported in a consensus statement [32] are 1.5-2 times greater than those obtained in
the present study. Besides the obvious effects of the elevated lung volume on R a w [76], the

112
presence of a flow-dependent component in the plethysmographic R a w due to the higher
respiratory flows may also explain these differences. The mean coefficients of variation
reported in the present study are comparable to those described in the ATS/ERS consensus
statement [32].
Table 5.4: Comparison of respiratory mechanical parameters in healthy infants
Study
Length (cm)
Current Study
Turner [47]
Hanrahan [69]
Lanteri [61]
Masters [74]
FEV0.5 (ml)
60 80
95.0 212.1
121.2 228.6
Raw (cmH20.s/L)
60 80
24.8 16.4
31.0 16.9
Rrs (cmH20.s/L)
60 80
59.7 26.6
60.8 32.8
70.2 19.6
39.2 28.6
Crs (L/cmH20)
60 80
0.0027 0.0080
0.0074 0.0147
0.0070 0.0183
0.0066 0.0143
5.5.2 RVRTC
The number of previous studies detailing forced expiratory parameter values in normal
infants are limited. A small number of studies have reported predictive values for maximal
flow at F R C (VmaxFRC) generated by the R T C [38,44,69]. A previous study from our
laboratory generated predictive values of FEV t for normal infants [47], using a prototype
of the current equipment. The predictive equation for FEV0.5 determined in the present
study is comparable with that published by Turner et al. [47](Table 5.4). The group mean
intra subject C V obtained for FEV0.5 were comparable with those described previously
[47,131](Table5.3).
5.5.3 Factors influencing lung function parameters
Gender was found to have no effect of lung mechanics in the present study, while family
history of asthma was a significant covariate having a detrimental effect on Raw, H and
FEV0.5. Recently Hanrahan and coworkers [69] reported mixed gender effects in a
longitudinal study. Female infants were found to have significantly lower initial levels of Rrs
than males, however the decrease in Rrs with increasing length was slower in female infants.
In contrast, while females had lower initial levels of Crs and a slower decline in Crs than

113
males, these changes were not significant. Indeed, the study of Hanrahan et al. [69]
reported longitudinal data in 541 infants and demonstrated inconsistent gender effects in Crs
compared with Rrs. In addition, Tepper and Reister [38] reported higher forced expiratory
flows in females than males, however the difference was not significant. Overall, the smaller
numbers in this cross-sectional study would account for finding the non significant effect
of gender.
Family history of asthma had a significant detrimental effect on all lung function parameters,
with the exception of Grs and law. This is in marked contrast to the study of Tepper and
Reister [38], w h o found no effect of family history on V m a x F R C or FRC. Young and
coworkers [174] demonstrated an increased level of airway responsiveness to histamine in
infants with a family history of asthma, however baseline lung function levels were not
different between infants with or without a family history of asthma. The Tucson study
[175] reported an effect of maternal history of asthma of infants with late-onset wheezing
(>3) when compared to infants with no wheeze up to the age of 6. In addition, there was
a non significant trend for those children with late-onset wheeze to have lower V m a x F R C
at age < 1 year. The present study only examines lung function up to the age of 2 years and
hence cannot differentiate between those children who will be free of wheeze later in life
and those who may develop late-onset wheeze. It is possible that the infants in the present
study with a family history of asthma and decreased lung function may represent the group
described by Martinez et al [175] as late-onset wheezers.
5.5.4 Dysanaptic growth
Several investigators have reported differing rates of growth of the airways and lung tissues
from infancy through to adolescence [61,176,177]. Mead [176] studied the association
between maximal expiratory flow and vital capacity, while Lanteri et al. [61] examined the
relative changes in R a w and Crs with growth. Hibbert et al [177] studied longitudinal lung
volumes and flows and suggested that as lung function parameters 'tracked' with age then
the rate of growth of the differing lung structures would remain constant relative to each
other. To examine this issue in the present population w e compared the rate of change in
airway and tissue mechanics as previously suggested by Lanteri and Sly [61]. This was
carried out by relating the changes in Ln(Raw) to those in Ln(G) and Ln(H). The slopes of

114
the regression equations (0.47 and 0.49 for G and H, respectively) show the tissue
parameters decreasing faster with length than Raw. The findings from the present study
therefore provide further confirmation of the concept of dysanaptic growth during infancy.
5.5.5 Comparison between FOT and RVRTC
To ascertain the role of the individual oscillatory parameters in predicting FEV0.5 w e
modelled the influence of the airway and parenchymal mechanics on the forced expiratory
volumes within this patient group (n=23). W e found that FEV0.5 was best described by a
model including H and R a w and their squares, the addition of multiplicative interactions
(e.g. HZRaw) did not improve the predictive value of the model. One infant was an outlier
and strongly influenced the model, if this infant is excluded then FEV0.5 was best predicted
by elastance and it's square only (FEV0.5=667.3-0.063(H*Lt)+1.7*10-6(H*Lt)2; R2=78.5%,
pO.0001). This result indicates that, when airway and parenchymal mechanics are used to
predict forced expiratory volumes, airway caliber and elastic properties of the parenchyma
are crucial factors, while inertance and tissue damping are secondary contributors. The
small numbers used in the present study do not allow definite conclusions to be reached,
studies with larger numbers are required to minimize the effect of outliers.
5.5.6 Conclusions
The present study describes changes in oscillatory and forced expiratory mechanics with
growth in normal infants using the techniques of low-frequency forced oscillation and
R V R T C in the first two years of life. This information has been used to establish the
relationship between values of respiratory mechanics and length in sedated normal infants.
Evidence supporting the concept of dysanaptic growth between the airways and pulmonary
parenchyma is detailed with the respiratory tissues found to decrease more rapidly with
growth than the airways. The relationships between airway and parenchymal mechanics and
measures of forced expiratory volume were also explored. FEV0.5 was strongly predicted
by elastance and airway resistance confirming that airway caliber and elastance have clinical
implications within both forced expiratory and oscillatory mechanics.

115
CHAPTER 6: RESPIRATORY SYSTEM IMPEDANCE IN WHEEZY INFANTS
6.1 Summary
The low-frequency forced oscillation technique (FOT) was used to measure the mechanical
properties of the airways and respiratory tissues in 22 infants with a history of recurrent
wheeze. All infants were asymptomatic at the time of testing and had been free of upper
respiratory tract infections for at least 4 weeks. The Hering-Breuer reflex was used to
induce a pause in breathing, allowing low-frequency respiratory impedance spectra (Zrs)
between 0.5 and 21 H z to be obtained. A model containing an airway (resistance; R a w and
inertance; law) and a constant-phase tissue (tissue damping; G and tissue elastance; H )
compartment was fitted to the respiratory impedance spectra. Standardized variants (Z
scores) were calculated to compare the infants to a normal population. Infants with a
history of recurrent wheeze had increased respiratory tissue (Z scores: 0.54±0.23 and
0.22±0.01; p<0.05 and p<0.01, for G and H, respectively), but not airway mechanics ( 0.18
±0.23) when compared to regression equations derived from a normal infant population.
Infants under the age of 1 were not significantly different from normals in any oscillatory
parameter (-0.29±1.36, 0.02±0.24 and 0.15±0.23, for R, G and H respectively) while those
infants > 1 year had elevated airway and respiratory tissue mechanics (0.57±0.18,
0.97±0.32 and 1.31±0.28; p<0.01 for R and G, and pO.OOl forH, respectively). These
results indicate that the low-frequency F O T is able to discriminate recurrently wheezy
infants from normal infants as a group, that infants with recurrent wheeze that persisted
beyond 1 year may represent those infants w h o go on to develop asthma and that the
mechanics of both the airways and respiratory tissues are abnormal in infantile wheeze.

116
6.2 Introduction
In early infancy rapid changes occur in the physiological, immunological and anatomical
development of the respiratory system. Until recently the available knowledge regarding the
normal physiological development of the lung was limited and as a result, the understanding
of the development of disease and responses to treatments has suffered. Wheeze in infants
may result from a number of anatomical, physiological or immunological processes not all
of which may contribute to asthma in later life. Recent epidemiological data has identified
3 distinct groups in the development of respiratory disease [175]. Those infants w h o
wheeze, with a lower respiratory tract infection (LRI) in the first 3 years of life but do not
wheeze or have asthma at 6 years of age (early wheeze). Late-onset wheezers, including
those infants with no wheeze early in life, but w h o develop wheeze between the ages of 3
and 6 years of age, and those infants who wheeze early in life and still have wheeze by the
age of 6 (persistent wheeze). Different risk factors have been associate with each of these
groups. Those infants with transient wheeze had diminished premorbid V m a x F R C and may
represent those infants with congenitally smaller airways, hence predisposing them to LRI
and wheeze in early life. [175]. Infants with persistent wheeze had initial lung function
values similar to those infants without wheeze, but decreased V m a x F R C at age six,
suggesting other mechanisms for infantile wheeze than small airways. These infants also had
more frequent symptoms and were more likely to have had rhinitis, eczema, maternal
asthma and elevated serum IgE at 9 months than the group of transient wheezers [175].
While it is now possible to surmise which group an infant may fall into, w e are currently
unable to classify with any degree of certainty those infants who may go on to develop
asthma and those infants w h o may grow out of their wheeze.
Recent advances in lung function measurements have allowed a number of investigations
to be carried out in normal infants and those infants with acute and recurrent wheeze. In
older children and adults the incidence of asthma is associated with decreased lung function,
increased responsiveness to bronchoactive agents and elevated levels of serum IgE. Yet
while decreased levels of premorbid lung function have been observed in infants with early-
onset wheeze [175,178,179], increased bronchial responsiveness has not been shown to be
correlated to a history of wheeze in infancy [178]. A number of lung function parameters
have shown differences between those infants with a history of wheeze and normal infants.

117
These include length and F R C corrected V m a x F R C , but not F R C [179] and specific airway
conductance (sGaw) [180]. A further study comparing the single-breath (SBT) and
plethysmographic techniques have shown differences between Rrs and Crs [181]. A study
combining the single-breath method and the forced oscillation technique has not shown
differences between normal infants and those with a history of airway obstruction (including
bronchiolitis, chronic lung disease and cystic fibrosis) in any measured parameter [182]. The
techniques described above are limited as they are unable to provide a separate assessment
of the airway and lung tissue mechanics and cannot definitively identify the site of changes
in lung function. The low-frequency F O T allows the measurement of the Zrs below the
spontaneous breathing frequency and thus the simultaneous determination of airway and
tissue mechanics. W e hypothesized that by examining the airway and lung tissue mechanics
in infants with a history of recurrent wheeze and comparing the results with previously
determined regression equations for normal infants (See Chapter 5), that the mechanical
properties of both the airways and tissues would contribute to respiratory disease in infancy.
6.3 Methods
6.3.1 Subjects
Twenty-two infants with a history of recurrent or persistent wheeze were examined, all
infants were asymptomatic and had been free of symptoms for a period of at least 4 weeks
prior to testing. Recurrent wheeze was define as 3 or more episodes of wheeze in the past
12 months of life, persistent wheeze was a period of consistent wheezing exceeding 1
month. Anthropometric data on the infants are outlined in Table 6.1. The infants were
sedated with an oral dose of choral hydrate (70-100 mg/kg) and were laid in the supine
position with the head supported in the midline and the neck slightly extended. The
experimental protocol was approved by the H u m a n Ethics Committee of the Princess
Margaret Hospital for Children. Parents gave written informed consent and were generally
present during the study.
6.3.2 Measurement apparatus
See Section 2.2.2.1 for complete details.
The input impedance of the respiratory system (Zrs) was measured as described previously
[7]. Briefly the infants lungs are raised to a transrespiratory pressure of 20 c m H 2 0 three

118
times and the airway occluded inducing the Hering-Breuer reflex. During the resulting
pause in breathing a forcing signal between 0.5 and 20 H z was applied to the airway
opening, via a soft-rimmed face mask by a loudspeaker. A lumped parameter model of the
respiratory system was fitted to the individual Zrs data [26]. The model contained a
frequency independent airway resistance (Raw) and inertance (law) and a tissue
compartment including tissue damping (G) and elastance (H) terms that alter in phase with
each other.
6.3.3 Study Protocol and Analysis
Baseline Zrs data were collected on those infants with a history of recurrent or persistent
wheeze, previously enrolled in other protocols. Individual airway and respiratory tissue
mechanics were obtained and averaged. Baseline mechanics were then compared to the
regression equations derived in Chapter 5. Standard variants, Z scores, were calculated as
the difference between the measured and predicted pulmonary function, divided by the
residual standard deviation derived from the regression equations. A t-test was carried out
to test the null hypothesis of the z scores. As the definition of recurrent wheeze was 3 or
more episodes of wheeze in the last 12 months of life and a number of infants were under
the age of 1 year (n=10) a separate analysis comparing infants < 1 year with those infants
>1 year of age was carried out using a two-tailed t-test. Significance was accepted at the
0.05 level.

119
Table 6.1: Anthropometric data and lung function data
Patient
1
2
3
4
5
6
7
8
9
10
11
12
13
14
15
16
17
18
19
20
21
22
Mean(SEM)
Age
0.48
0.50
0.90
0.66
0.82
0.95
1.20
1.39
0.99
0.90
0.84
1.52
1.64
1.41
1.53
0.99
1.31
1.92
1.61
1.89
2.06
1.63
1.23(0.1)
Length
67.0
68.5
70.0
72.0
74.0
74.0
74.0
75.0
75.8
77.5
78.0
79.0
80.0
80.5
81.0
82.0
82.0
82.0
87.0
87.0
87.5
89.0
78.3(1.3)
Raw
21.5
28.5
13.3
22.0
11.7
30.8
22.2
18.4
12.9
13.7
14.3
23.5
17.6
22.7
23.4
20.9
18.9
14.1
13.3
14.0
16.7
12.0
18.5(1.2)
law
0.12
0.09
0.09
0.18
0.07
0.24
0.08
0.20
0.08
0.05
0.12
0.25
0.10
0.21
0.19
0.09
0.17
0.04
0.10
0.07
0.11
0.03
0.12(0.01)
G
69.7
62.0
41.2
43.7
32.3
40.8
26.3
55.1
25.7
24.1
32.4
41.1
28.5
35.0
32.4
30.6
30.6
29.3
28.7
18.4
21.9
37.4
35.8(2.7)
H
222.4
214.1
172.3
169.1
153.9
152.8
132.6
196.7
116.1
131.3
146.4
134.3
117.3
123.7
150.2
141.2
124.2
128.0
105.0
72.9
93.5
114.4
141.5(7.8)
T|
0.32
0.29
0.24
0.26
0.21
0.27
0.20
0.28
0.22
0.18
0.22
0.31
0.24
0.28
0.23
0.22
0.25
0.23
0.27
0.25
0.22
0.33
0.25(0.01)
Table 6.1: Anthropometric and baseline lung function data. Age (years); Length (cm); Raw (cmH20.s/L); law
(cmH20.s2/L); G (cmH20/L) and H (cmH20/L)

120
6.4 Results
Figure 6.1 shows the mean lung function measurements for each infant. Infants below the
age of 1 are scattered evenly around the regression line, while those infants older than 1
year of age tend to skew above the regression line indicating a worsening of lung function
when compared to healthy infants. The testing of the null hypothesis of the Z scores
revealed that only the respiratory tissue mechanical parameters were significantly different
(Table 6.2). There were no significant differences in recurrently wheezy infants below 1
year of age when to compared to healthy infants, while significant differences were noted
in all lung function parameters in those infants older than 1 year (Table 6.2).
Table 6.2: Z score data for wheezy infants
Z score
(mean±SEM)
R a w
G
H
<1 year
-0.29(1.36)
0.02 (0.24)
0.15(0.23)
> 1 year
0.57 (0.18) §
0.97 (0.32) §
1.31(0.28)U
Total population
0.18(0.23)
0.54 (0.23) *
0.22 (0.01) §
Table 6.2: * ; p< 0.05, § ; p< 0.01 and ̂ ; pO.OOl.
6.5 Discussion
The data in the present study indicate that recurrently wheezy infants have abnormal airway
and parenchymal mechanics when compared to a normal population. Previously published
data have demonstrated altered lung function in wheezy infants when compared to normal
infants [178,181]. In addition Tager et al [179] reported decreased length- and F R C
corrected-VmaxFRC values, while Dezateux et al. [180] reported decreased specific
conductance (sGaw) in infants, tested at an early age, who then subsequently develop
wheeze. Dundas and coworkers [181] demonstrated increased Rrs and decreased Crs, in
wheezy compared to normal infants, while Stick etal. [178] reported decreased V m a x F R C
values. In contrast a number of lung function parameters have been shown to be unaltered
in wheezy infants including; tidal volume, Crs and respiratory system conductance [178],
F R C [181] and Raw, thoracic gas volume (TGV) and specific R a w [183]. Longitudinal

121
studies have demonstrated lower baseline lung function prior to wheeze when compared to
infants w h o do not subsequently develop wheeze [175,179,180]. While methodological
differences may account for some of the reported differences in the previous studies, it is
not clear from the previous reports which infants with wheeze have diminished lung
function. The ability to detect those infants w h o wheeze due to anatomically, small for age
airways may increase the sensitivity of infants pulmonary lung function tests to accurately
identify wheezy infants w h o will go on to develop asthma.
The current study demonstrated abnormal airway and respiratory tissue mechanics in
wheezy infants older than 1 year of age, but not in infants younger than this. In infants less
than 1 year of age, this may represent a single winter season and be the result of repeated
acute viral wheeze, rather than ongoing chronic wheeze. The diagnosis of recurrent wheeze
in the older infants may better represent chronic wheeze and more accurately identify those
infants w h o may go on to develop asthma. Respiratory system resistance measurements
include both the upper- and lower airways and the tissue properties of the lung and chest
wall. Specific airway conductance can provide a measure of airway calibre corrected for
lung volume and is thought to be a sensitive index of airway function [184]. The advantage
of the low-frequency F O T is it's ability to simultaneously provide separate information on
the airways and respiratory tissues. Our estimates of R a w will include the resistance of the
nose and the extra-thoracic airways. Data reported elsewhere in this thesis (Chapter 4)
demonstrates that the nasal impedance contributes approximately 4 5 % to R a w and that this
contribution is constant with length. The presence of an upper respiratory tract infection
(URI) is likely to influence upper airway mechanics and infants were excluded from the
analysis if an U R I had occurred in the previous 4 weeks. The addition of a nasal catheter
would increase the sensitivity of the low-frequency F O T to detect changes in peripheral
airway function and may help identify those infants with anatomically small for age airways.

122
^40
1
o
20 w rt
.5
Length (cm) 80 90
Figure 6.1: Mean individual data for Raw, G and H in wheezy infants. The hollow points are those infants < 1
year of age, while the solid points represent those infants > 1 year. The solid line represent the regression
equation presented in Chapter 5. The variation in data representing standard variants of 1 (long dash) and 2
(short dash) are also shown.
The contribution of the chest wall to respiratory system resistance and elastance, increases
with age as the chest wall becomes stiffer (See Chapter 4 for full details). The estimates of
G and H in the present study will include the contribution of the chest wall. Changes in

123
chest wall motion have been reported with pulmonary disease, with the chest wall and
abdominal movements being asynchronous, this asynchrony then decreases with improved
lung mechanics [32]. However it is unlikely that chest wall damping and elastance would
be abnormal in recurrently wheezy infants. Wheeze in infancy and subsequently asthma is
characterized by abnormal expiratory flows and implies flow limitation [185]. A s lung
volume decreases the flow limiting segment shifts peripherally and hence flows at F R C are
more likely to be influenced by the mechanical properties of the small airways and the
mechanical interdependence of the airways and parenchyma [186]. Changes in the
mechanical properties of both the airways and respiratory tissues, that may occur with
wheeze in infancy have not been systematically addressed. The majority of infant lung
function studies utilize forced expiratory flows and/or volumes to assess lung mechanics in
spontaneously breathing infants. While airway obstruction will effect expiratory flow
limitation, the mechanical properties of the parenchyma will also play a role. Direct
conclusions as to any alterations in lung tissue mechanical properties cannot be made from
measurements of forced expiratory flows. The parenchyma may effect the expiratory flow
limitation in a number of ways; general lung elastic recoil, localised (peribronchial) recoil
and airway-parenchymal interdependence [187]. A change in any of these factors will
increase or decrease the effect which the pulmonary parenchyma has on the flow limitation,
and hence wheeze. The lung elastic recoil forces determine the driving pressure within the
lung, while the peribronchial recoil forces and airway-parenchymal interdependence will
apply distending pressure to the outer surface of the airways and hence influence airway
calibre to some extent. The elastic recoil of the lung is created by the connective tissues of
the lung and by the gas-liquid interface. Increased dynamic elastance has been reported in
asthmatic subjects during quiet breathing [188], in addition elastic recoil is reduced in adult
asthmatics [189]. In the small intraparenchymal airways the connective tissues of the
parenchyma are directly connected to the connective tissues of the airways, this connection
will alter airway-parenchymal function if one component is changing disproportionally
compared to the other (e.g. with airway constriction) [187]. Airway-parenchymal
interactive forces play a significant role at high lung volumes where elastic forces acting on
the connective tissues are greatest and may be changed by localised changes to the
parenchyma (e.g. edema or inflammation), while elastic recoil and peribronchial recoil will
be susceptible to increased tensions in the force-bearing elements surrounding the airways

124
[187]. Kraft et al [190] have demonstrated while inflammation is present in the proximal
airways and alveolar tissues in asthmatics, that it was alveolar eosinophil and macrophage
infiltration, rather than airway infiltration, that was responsible for nocturnal decreases in
lung function associated with episodes of nocturnal asthma. This infiltration may be acting
to alter the localised and general recoil forces within the lung parenchyma, hence altering
the expiratory flow limitation. The abnormally high levels of tissue damping and elastance
seen in the infants with ongoing wheeze at 12 months may represent the beginnings of
chronic tissue inflammation and may represent those infants w h o will go on to develop
asthma later in life, confirming that the pulmonary parenchyma play an important role in
respiratory disease and that conditions such as asthma may reflect alterations in both the
airways and respiratory tissues.
6.5.2 Conclusions
W e have shown that the low-frequency forced oscillation technique determined at a
transrespiratory pressure of 2 0 c m H 2 O is able to detect abnormal lung function in infants
with a history of recurrent wheeze. The mechanical properties of the airways and
respiratory tissues were found to be abnormal in infants older than a year, but not younger
than this age. Respiratory tissue mechanics were also abnormal for the population as a
whole. The finding of this study indicates that the airways and pulmonary tissues play a role
in infantile wheeze. Further studies investigating the role of passive smoke exposure, family
history of asthma and the possible effect of anatomically small for age airways are needed
to better understand the importance of factors, such as the physiological, anatomical and
immunological development of the respiratory system, in the first years of life to the
subsequent development of asthma.

125
CHAPTER 7: METHACHOLINE
RESPONSIVENESS IN INFANTS
7.1 Summary
The usefulness of the low-frequency forced oscillation technique (FOT) to detect the
response to inhaled methacholine (Mch) was examined in 7 infants with no history of
respiratory disease, 8 with recurrent wheeze and 2 with recurrent cough without wheeze,
all infants were asymptomatic at the time of testing. The respiratory system impedance (Zrs)
between 0.5 and 21 H z was determined during a pause in breathing induced by the Hering-
Breuer reflex. Zrs were fitted to a model containing a frequency independent airway
resistance (Raw) and inertance (Taw) and a constant-phase tissue damping (G) and elastance
(H). Hysteresivity (n.) was calculated (G/H). The raised volume rapid thoracic compression
technique (RVRTC) was used to generate forced expiratory volume in 0.5s (FEVo.s). Lung
function was determined at baseline and following inhaled Mch, in doubling doses from 0.25
to 16 mg/mL, until the maximal dose was reached or a drop of 1 5 % in FEV0.5 was achieved
(PC15FEV0.5). The concentration required to cause an increase in R a w twice that of the
baseline variability (1.1±0.4 mg/mL Men; mean±SEM; TCRaw) was significantly lower than
PC15FEV0.5 (4.7±1.7 mg/mL Mch). At the T C R a w a response in Raw, law, G and rj, but
not H was detected (34.2±6.3%, 67.2±14.1%, 33±3.7%, 31.9±12.9% and -2.3±3.7%,
respectively). The changes required to cause an increase in R a w of 3 0 % and a decrease of
1 5 % in FEV0.5 are approximately equal multiples of the respective baseline variabilities
(-2.5-3 time the coefficient of variation). Furthermore it was found that PC3oRaw and
PC15FEV0.5 were not significantly different. The low-frequency F O T is able to detect
changes in airway and respiratory tissue mechanics following inhaled Mch. A n increase of
3 0 % in R a w would be a suitable outcome variable for further studies.

126
7.2 Introduction
Responsiveness to an acmiinistered drug or compound remains the most useful physiologic
test in the assessment of asthma in adults and older children. A number of investigators have
adapted the protocols used in adults and older children for use in infants [41,131,174].
Airway responsiveness has been shown to be increased in infants with a family history of
asthma [174], in infants with cystic fibrosis [191] and to correlate to baseline lung function
(VmaxFRC%pred) in normal infants and those infants with cystic fibrosis [191]. While the
presence of reversible hyperresponsiveness is well known in asthmatic adults, the role of
airway responsiveness in whee-zy infants is unclear. Stick et al [178] demonstrated that
while infants with a history of recurrent wheeze had significantly lower baseline lung
function when compared to normals, that the responsiveness of the two groups to inhaled
Wstamine were equal, in contrast Clark et al[192] reported an increased responsiveness in
female neonates w h o subsequently went on to develop lower respiratory tract infection
(LRI) in the first year of life.
Several techniques have been used to assess the bronchial responsiveness in infants, these
include the raised volume rapid thoracic compression technique ( R V R T C ) [131], the rapid
thoracic compression technique (RTC) [43], the forced deflation technique [193] and the
high-frequency forced oscillation technique [121]. These techniques are unable to provide
separate information on the behaviour of the respiratory tissues. A number of investigations
in animals have demonstrated that the pulmonary tissues do indeed respond to inhaled
bronchoconstrictors [5,139,194-196]. The low-frequency forced oscillation technique
(FOT) allows the mechanical behaviour of the respiratory system airways and tissues to be
characterized. The impedance spectra of the respiratory system (Zrs) has been well
characterized between ~2 H z and 48 H z [102,122,182,197] and at higher frequencies (>48
Hz) [106,121]. Recently Sly et al. [7] demonstrated that by utilizing the Hering-Breuer
reflex, a pause in breathing could be induced that allowed the reliable measurement of Zrs
at low frequencies (<2 Hz). Using this method Hayden and coworkers [123] demonstrated
a significant fall in airway resistance (Raw) and a decrease in tissue damping (G) following
the administration of a bronchodilator, concluding that low-frequency F O T was suitable for
studying the bronchodilator response in the airways and respiratory tissues in infants.

127
The aim of this study was to assess the effectiveness of the low-frequency F O T to
characterize the response to inhaled methacholine (Mch) in sedated infants. W e compared
the response to inhaled M c h in infants using the R V R T C and the low-frequency forced
oscillation techniques using an adaptation of the methodology used by Hayden et al. [131].
7.3 Methods
7.3.1 Subjects
Seventeen infants were enrolled in the study. Eight infants had a history of 3 or more
episodes of wheeze in the last 12 months of life (recurrent wheeze), two infants had 3 or
more episodes of cough without wheeze (recurrent cough), the remaining 7 infants had no
history of respiratory disease (normal). All infants had been free of symptoms or illness for
a period of at least 4 weeks. Anthropometric data are presented in Table 7.1. The infants
were recruited from the general public. Parents gave written informed consents and were
generally present during the study. The study was approved by the relevant Institutional
Human Ethics Committee. Infants were sedated with an oral dose of choral hydrate (70-100
mg/kg), heart rate (HR) and oxygen saturation (Sa02) were monitored throughout the
study. Infants were studied in the supine position with the head supported in the midline and
slightly extended.
7.3.2 Measurement apparatus
7.3.2.1 Raised volume rapid thoracic compression technique
See Section 2.5 for full details.
Briefly, the method of Hayden et al. [131] was used to determine forced expiratory volume
at 0.5s (FEV0.5). This technique uses a pump to raise the infant's lung volume above the
tidal range. The pump draws room air through a pneumotachograph and into the infant,
using a series of solenoid valves the infants were inflated three times to a transrespiratory
pressure of 20 cmH 20 with passive deflations between each inflation. A jacket is connected
to a positive pressure reservoir and a compression force was applied to the thorax and
abdomen after the third and final inflation. Forced expiratory flow was determined,
integrated and volume-time curves were produced. FEV0.5 was calculated from the forced
expiratory volume-time curves.

128
Table 7.1 Anthropometric data
Patient
1
2
3
4
5
6
7
8
9
10
11
12
13
14
15
16
17
Age (weeks)
19.6
48.7
47.0
26.1
42.7
24.1
51.6
67.9
100.3
92.7
84.9
66.7
68.1
86.0
97.9
102.6
99.3
Height (cm)
67.5
70.0
70.0
70.0
74.0
74.0
75.8
80.0
80.8
81.0
81.7
81.8
82.0
82.4
82.6
85.0
86.0
Weight (kg)
8.3
7.9
8.2
8.9
9.5
8.9
11.6
10.6
11.6
11.2
11.2
13.5
10.8
11.3
12.6
14.0
12.0
Gender
M
F
F
F
M
F
M
F
F
M
F
M
M
F
F
F
M
Classification
Normal
Cough
Wheeze
Normal
Wheeze
Wheeze
Wheeze
Normal
wheeze
Normal
Normal
Wheeze
Wheeze
Normal
Cough
Normal
Wheeze
7.3.2.2 Low-frequency forced oscillation technique
See Section 2.2.2.1 for full details.
Respiratory input impedance spectra (Zrs) were measured by using the low-frequency
forced oscillation technique as described by Sly et al [7]. Three inflations were applied to
a circuit containing the infant, the loudspeaker and a pressure reference chamber. Following
the third inflation, the airway was occluded at a transrespiratory pressure (Ptr) of 20 cmH 20
and in the resulting pause in breathing, the oscillatory signal was driven into the infant's
respiratory system by the loudspeaker. Following each measurement the mask was lifted
and the infant allowed to breathe spontaneously. A linear model of the respiratory system
[26] was fitted to the individual respiratory impedance spectra in the 0.5 -15 Hz range (see
Section 2.4).

129
7.3.3 Study protocol
The protocol used was a modified version of Hayden and coworkers [131]. Lung function
was assessed firstly using forced oscillation and then R V R T C techniques at baseline and
following inhaled nebulisations of saline and Mch. Nebulisations were given for 1 min, of
tidal breathing at 5 min intervals. M c h nebulisations started at a concentration of 0.25
mg/mL and increased in doubling doses until a positive response was recorded or to a
maximum of 16 mg/mL (0.25, 0.5, 1, 2, 4, 8,16 mg/mL). The test was discontinued if the
Sa0 2 dropped below 8 5 % at any time throughout the test. Each set of raised volume and
forced oscillation data was analyzed to produce outcomes for FEV0.5 and oscillatory
parameters (Raw, law, G, H and r|), respectively. Mean values of FEV0.5 were calculated
for each dose of Men, with a fall in FEV0.5 of 1 5 % from control considered a positive
response to M c h [131]. 200 u.g of salbutamol was administered, via a pressurized metered
dose inhaler (MDI) and small-volume metal spacer (Nebuchamber, Astra Pharmaceuticals,
Sweden) following the completed M c h protocol.
7.3.4 Analysis
Baseline and control measurements of FEV0.5 and oscillatory parameters were averaged
(mean±SD). As detailed above, a 1 5 % fall in FEV0.5 from the control measurement
(PCisFEVo.5)was considered a positive response to M c h and the test was stopped.
Respiratory impedance spectra (Zrs) were examined and the peak measurement for each
M c h dose analyzed (see Section 2.2) and reported. Oscillatory parameters were analyzed
as the percentage increase from control. The infant was considered to have had a positive
response to Mch, as determined by the low-frequency FOT, if the R a w percentage increase
from control exceeded 2 times the coefficient of variation (i.e. the threshold concentration)
and remained above that level for the remainder of the study (TCRaw). The relative
sensitivities of the two tests were compared using a Wilcoxon rank test. Differences in
baseline lung function and M c h responses in the patient subgroups were also carried out
using one-way A N O V A . Significance was accepted at the p<0.05 level.
7.4 Results
7.4.1 Forced expiration

130
The mean baseline values for FEV0.5 were 201.9 ± 12.4 m L (mean ± S E M ) (Table 7.2).
There were no differences between the subgroups of patients. Fourteen of the 17 infants
had a 1 5 % fall in FEV0.5 before waking up. Of the remaining 3 infants, 1 woke due to cough
and/or wheeze during nebulisation, with the remainder waking spontaneously without
obvious cause. Table 7.3 shows the concentration of Mch causing a 15% decrease in FEV0.5
(PC15 FEVo.5).
•7.4.2 Low-frequency forced oscillation technique
Figure 7.1 shows the dose response curves for patient #14. The mean control data includes
an error bar indicating the increase required to exceed 2 times the COV. Individual peak
measurements following inhaled Mch are also shown. Baseline values for the oscillatory
parameters are shown in Table 7.2. The z-score values for the lung function parameters
were calculated using the predictive equations reported in Chapter 5. There were no
differences in baseline data or z-score data between any subgroup of the infants. Z-score
data for H was significantly different from the normal population described in Chapter 5 (§;
p<0.01). The fitting error was calculated under baseline and maximally constrictive
conditions. The model was found to fit the Zrs well following inhaled Men, with no
significant differences seen in fitting error from control conditions (7.6+ 0.3% and
8.1+0.4%, control and Men, respectively).
Table 7.2: Baseline lung function data
Lung Function Parameter
FEVo.5 (mL)
Raw (cmH20.s/L)
law (cmH20.s2/L)
G (cmH20/L)
H (cmH20/L)
n
Mean (SEM)
201.9 (12.4)
18.3 (1.2)
0.11(0.01)
29.4 (3.0)
145.8 (10.2)
0.21 (0.01)
Z score (SEM)
-0.28 (0.23)
0.10(0.25)
-0.41 (0.22)
0.77 (0.23)§
COV(SEM)%
3.8(0.7)
8.3 (1.3)
11.5(1.7)
14.4 (1.9)
8.7(1.4)
18.1(2.1)

131
100
a 75
I 1 0 s
50
25
0-
Airway Resistance 50
25
0 -
Airway Inertance
i — i — i r
I 1
150
125
100
75
50-
25
Tissue Damping
16
20
10-
-10 -
Tissue Elastance
u.
T — I — i r-
SI 2 4 16 M c h (mg/mL) Mch (mg/mL)
Figure 7.1 Representative cumulative dose response curve to inhaled Mch (patient 14#). The percentage
increase from saline are shown. The error bar indicates the increase needed to exceed twice the baseline
variability. A positive response to Raw, law and G can be seen, no reponses in tissue elastance was elicited.
Three of the 17 infants woke before completion of the test (administration of 16 mg/mL
M c h or 1 5 % decrease in FEV0.5), of the 3, one had already had a positive response to M c h
in airway resistance. In the 14 infants w h o remained asleep for the duration of the study,
9 had an increase in R a w greater than 2 times the C O V . In 5 of the 17 infants the apnoeic
pause in breathing was insufficient to allow the reliable measurement of Zrs. In all cases this
occurred at the M c h concentration that the FEV0.5 decreased by 15%, this represents an
ongoing difficulty with the cumulative dose response challenge test as carried out in this
investigation. Table 7.3 shows the threshold concentration of M c h causing an increase in

132
R a w greater than 2 times the C O V (TCRaw) and the corresponding percentage increases
from control for the remaining oscillation parameters at the TCRaw, those data marked
with * indicates a positive response in that parameter to M c h at the TCRaw.
A Wilcoxon signed rank sum test was carried out to determine the differences between the
M c h concentrations required to elicit a positive response in FEV0.5 and Raw. The threshold
concentration for R a w was significantly lower than the PC15FEV0.5 (Table 7.3; p<0.05). N o
differences in PC15FEV0.5 or T C R a w were seen between normal infants and those infants
with wheeze or cough.
Table 7.3: Provocation and lung function data
Patient
1
2
3
4
5
6
7
8
9
10
11
12
13
14
15
16
17
Mean(SEM)
PCi5FEVo.5
1.0
1.0
1.0
16.0
0.5
4.0
1.0
0.25
Aw
16.0
Aw
Aw
2.0
16.0
4.0
2.0
1.0
4.7(1.7)
TCRaw
Br
0.25
1.0
2.0
0.5
1.0
0.5
0.25
Aw
Br
1.0
Aw
Br
4.0
Br
0.25
Br
1.1(0.4)
%Raw
—
11.22
56.82
34.17
44.53
20.49
22.42
76.09
—
~
27.16
—
~
32.75
~
16.08
~
34.2(6.3)
% law
—
15.61
95.76*
55.99*
48.95*
68.36*
105.60*
164.47*
--
—
18.98
—
~
44.86*
«
59.05*
~
67.8(14.1)
%G
«
10.08*
18.03
5.21
20.86*
23.81*
116.29*
62.57*
--
—
8.22*
--
—
26.75
—
38.60*
—
33.0(0.7)
%H
~
2.67
-19.95
-8.93
9.77
-0.09
-7.77
-17.17
—
~
18.66*
~
—
-1.76
--
1.75
—
-2.3(3.7)
%r]
—
8.70
46.30
13.65
23.70
22.60
139.70
13.96
—
—
-9.31
—
—
24.10
—
36.04
—
31.9(12.9)
Table 7.3: The provocation concentration causing a 15% decrease in FEV0.5 (PQ5FEV0.5) and an increase in
R a w at least twice the C O V (TCRaw). 'Br1: those infants in w h o m a pause in breathing could not be induced,
Aw': those infants w h o m awoke at that concentration of Mch. The percentage increase from baseline for the
oscillatory mechanical parameters at T C R a w are also shown * indicates a response at the TCRaw.

133
7.5 Discussion
Current methodologies to test the responsiveness to bronchoconstrictors in infants,
commonly assesses changes in V m a x F R C or FEVi [185] and are unable to determine the
site of changes in lung function. The low-frequency forced oscillation technique has been
shown to reliably measure the airway and lung tissue mechanics in infants [7]. The aim of
the current study was to assess the ability of the low-frequency F O T to detect changes in
airway and/or pulmonary tissue mechanics following the administration of inhaled Mch.
The results demonstrate that the technique is able to track changes in lung function due to
inhaled M c h and that the threshold concentration of M c h required to cause an increase in
Raw, twice that of the intrasubject C O V , can be determined. However in 5 of the 17
infants (29.4%) a response in R a w could not be determined, as a pause in breathing of
sufficient length was not able to be induced. In all 5 of these cases this occurred at the
concentration of M c h at which the response in FEV0.5 was subsequently determined.
7.5.1 Comparison between low-frequency FOT and RVRTC
While the success rate of the low-frequency F O T was lower than that of the R V R T C
technique, the median dose required to reach the threshold concentration for R a w was
significantly lower than that required to reach the PC15FEV0.5 (0.75 vs. 1.5 mg/mL Mch;
p<0.05). This result may be due to the relative changes required to reach the T C R a w and
PC15FEV0.5. The intrasubject variability in FEV0.5 in the present study was 3.8±0.7%, thus
a decrease in FEV0.5 of 1 5 % represents a change approximately 4 times that of the baseline
variability. This variability is lower than that reported previously in this thesis (7.6±0.7 %;
See Chapter 5, Table 5.3), and in previous studies (-5%) [47,131], thus a decrease of 1 5 %
would represent a change of 2-3 times the previously reported baseline variability in FEV0.5.
The threshold concentration, is by definition, the concentration required to cause a change
twice that of the baseline variability, thus the differences between T C R a w and PC15FEV0.5
are not unexpected. Using the mean intrasubject variability in R a w reported previously in
this thesis (11.3±0.8 %; See Chapter 5, Table 5.3) a change of 23-34% would be required
to represent changes of 2-3 times that of the baseline variability in Raw. A provocation
concentration leading to a 3 0 % increase in R a w (PC3oRaw) would denote a change of 2.7
times that of the baseline variability and would represent a similar proportional change as
a decrease in FEV0.5 of 15%. Indeed if w e compare the PC3oRaw and PC15FEV0.5 in each

134
infant there are no significant differences (1.5; 0.5-2.0 (median; 25-75% confidence
intervals) vs. 1.5; 1.0-4.0 for PC 3 0 R aw and PC15FEV0.5, respectively).
7.5.2 Mch responsiveness in normal compared to wheezy infants
N o differences between subgroups of patients either in baseline lung function or bronchial
responsiveness was seen with either technique. This result concurs with previous studies
[131,178]. The reasons for the lack of increased responsiveness in infants with a history of
recurrent wheeze are not yet completely clear and could be due to a number of factors. A
Perth based longitudinal study demonstrated increased responsiveness to histamine in
infants, at 4 weeks of age, with a family history of asthma or exposure to environmental
tobacco smoke [174]. The Tucson study [175] demonstrated an increased risk of asthma
at age 6 in those infants with both a family history of asthma and a history of wheeze in the
first years of life. However infants may wheeze due to viral illness and/or due to
anatomically small airways and thus infantile wheeze may not be related to subsequent
development of asthma in childhood [175]. The numbers in the present study are too small
to draw conclusions and further studies with larger numbers, taking into account family
history of asthma and passive tobacco smoke exposure would be required to accurately
determine any differences between infants with a history of wheeze and normals.
7.5.3 Airway versus parenchymal responsiveness
The present study demonstrates a response to inhaled M c h in both the airways and
pulmonary tissues in infants, regardless of respiratory history. The mean increase in law at
T C R a w was 67.8 ± 14.4%, indicating a constriction in the nasal- and/or upper airways. The
inertance of the nasal passages contributes about 7 2 % of the total Irs (See Chapter 4),
making this parameter highly sensitive to changes in the properties of the extrathoracic
airways. Tepper and Steffan [170] demonstrated a decrease in peak expiratory flow (PEF),
but not V m a x F R C following the administration of nasally instilled Mch, concluding that
the topical application of M c h into the nose, resulted in changes in nasal- but not lower
airway resistance. In the same study inhaled M c h resulted in decreases in P E F and
V m a x F R C and was attributed to constriction of the lower airways. Using a catheter-tipped
manometer lodged in the right lower lobe bronchus, Yanai and coworkers [198] have
quantified the relative proportion of the peripheral airway resistance to total pulmonary

135
resistance in adults. Using this technique in asymptomatic asthmatic adults Ohrui et al
[199] demonstrated that inhaled M c h acted on both the central and peripheral airways.
Similar results are reported in the present study, with the increases in R a w and law
suggesting that inhaled M c h in infants acts both in the central and peripheral airways.
Conflicting responses within the pulmonary tissues were seen, with an increase in tissue
damping (33.0±0.7%) and ri (31.9±12.8%), but not in H (-2.3*3.7%) at TCRaw. If the lung
tissue responses are further examined, 9 infants reached the threshold concentration for G
without recording a response in tissue elastance, in addition a further 3 infants exhibited a
response in H without reaching a response in G. The contribution of the chest wall on Zrs
will result in decreased sensitivity of the low-frequency F O T to detect changes in the
viscoelastic properties of the pulmonary tissues (Chapter 4). However the responses
detected in G in a majority of infants makes this explanation for a lack of response in H
unlikely. Lutchen et al. [28] has speculated that peripheral inhomogeneity of airways due
to constriction may cause increases in tissue damping unrelated to actual tissue constriction.
In support of this Petak et al. [5] demonstrated that during severe constriction due to M c h
that increases in tissue damping, not mirrored by increases in H were related to peripheral
inhomogeneity. Peripheral inhomogeneity is unlikely to be the cause of the tissue responses
demonstrated in these results, as the high lung volume at which the Zrs spectra are
determined would act to split the peripheral airways open and hence reduce the possibility
of peripheral airway inhomogeneity. Using the optimal ventilation waveform technique,
between 0.156-8.1 Hz, Kaczka and coworkers [200] reported that mild constriction,
induced by inhaled M c h caused increases in R a w that accounted for the majority of the
increase in Rrs. These investigators also showed that during bronchoconstriction associated
with a decrease in FEVi of 2 0 % , R a w and G increased but that there was little or no
response in H [200]. The authors fitted Zrs to 2 models of the lung that allowed for, firstly
peripheral airway inhomogeneity and secondly, airway wall compliance to account for
airway wall shunting. Using these models the investigators were able to show that the
majority of the response in Rrs during severe constriction was due to changes in R a w not
G, and that the airway wall shunting occurred causing artifactual increases in G. The O V W
technique used by Kaczka and coworkers [200] allows estimation of the frequency response
of the lung while delivery a waveform sufficient to maintain gas exchange and thus can

136
provide low-frequency Zrs without a pause in breathing. The higher transrespiratory
pressures used in the current study to obtain Zrs may reduce the effects of airway wall
shunting, by the process of splinting the central airways open. So while it is possible that
airway wall shunting may have occurred in current study, causing an artifactual increase in
G, the technique used should act to minimize the influence of airway wall shunting. A
mechanism of disassociated parenchymal response has been suggested by Fredberg and
coworkers [201] w h o showed in isolated lung tissue strips that the time to peak response,
following administration of an agonist, was significantly shorter in rj than in elastance, with
the response in tissue resistance (R) being governed by the product rjE. Using an open-
chest rat preparation Salerno et al [202] demonstrated that the response in Rti could be
attributed to either El or TJ, depending upon the stimulus used. Following inhaled M c h and
changes in lung volume, El wholly accounted for changes in Rti, whereas intravenous M c h
resulted in increases in Rti predominantly attributed to TJ. The early response in r\ has been
attributed to activity in the rapidly cycling cross bridges in the parenchyma, while the
changes in elastance are regulated by the slower cycling cross bridges [201]. This
disassociation between the hysteresivity and elastance of the lung tissues may be responsible
for the changes seen in G within the present study and may be related to increases in r|. It
was not the aim of this study to characterize the time course of the respiratory mechanics
and further studies characterizing this phenomena in infants are required.
The role of deep inhalations (DI) on induced bronchoconstriction has been investigated in
both normal and asthmatic adults [203,204]. Airway hyperresponsiveness was found to be
reduce in normal adults following DI, but was unaffected in mild asthmatic patients [203].
A n effect of DI on M c h responsiveness in infants has yet to be shown, either in normal
[131] or wheezy infants [205]. If a DI effect on the Mch-induced constriction was expected
w e would have expected both FEV0.5 and the oscillatory mechanical parameters to decrease
with successive measurements. This was not the case in the current study, either within all
subjects or within the subgroups of patients. A s the low-frequency F O T requires high lung
volumes to induce a pause in breathing there may be an effect of lung volume on the Mch-
induced constriction.
7.5.4 Conclusions

137
The present study design was similar to that used by Hayden and coworkers [131] to
compare the R T C and R V R T C techniques, however neither of these techniques are affected
by the lack of apnoeic pause required to determine Zrs. A change in methodological design
is required to further assess the usefulness of the low-frequency F O T to detect differences
between patient groups. In conclusion, the present study demonstrated that the low-
frequency F O T is able to detect a response to inhaled methacholine in sedated infants. This
response was attributed predominately to the airways. The provocation concentration
required to cause a 3 0 % increase in R a w is similar to that causing a decrease in FEV0.5 of
1 5 % and would be a suitable outcome variable in further investigations.

138
fi

139
CHAPTER 8: GENERAL DISCUSSION
This thesis has presented the findings of a series of experiments designed to assess the role
of the low-frequency forced oscillation technique (FOT) in measuring infant lung function.
The aims of the thesis were to determine the ability of the low-frequency F O T to non-
invasively partition the respiratory system into lung and chest wall components. This was
initially completed in a rodent model before being translated into a clinical setting. Various
methodological issues were examined in spontaneously breathing infants. Zrs was
partitioned into nasal and lower respiratory impedances. Studies were conducted to establish
which form of forcing signal allowed the optimal balance between maximising signal-to-
noise ratios (S/N) and success rate, while rninimising errors due to cross-talk and harmonic
noise. The relationship between the mechanical properties of the airways and respiratory
tissues and length was determined in a cross-sectional study of normal infants. The airway
and respiratory tissue mechanics in wheezy infants were compared with those of normal
infants and the physiological site of recurrent wheeze in infants determined and lastly the
methacholine responsiveness in infants was assessed using the low-frequency F O T .
8.1 Methodological issues
8.1.1 Measurement of Zrs
The low-frequency F O T has been utilised to obtain Zin from sedated infants during a pause
in breathing. In order to induce this pause in breathing the Hering-Breuer reflex has been
invoked using a computer controlled pump to inflate the infant's lungs three successive
times, after which the airway was occluded at Prs of 20 c m H 2 0 . During the pause in
breathing a forcing signal could be applied to the airway opening and the Zrs obtained (see
Section 2.2.2.1 for full details). The respiratory mechanics presented in this thesis need to
be examined in context of the higher lung volume at which they are obtained. Measurements
at F R C , or perhaps moderate inflation would better represent the conditions governing
spontaneous breathing and facilitate comparisons between the data presented in this thesis
and from other investigators. Petak et al. [76], however demonstrated that in order to
reliably and repeatedly induced a Hering-Breuer reflex, that allowed a pause in breathing of
sufficient length (i.e. > 6 s) occlusion at 20 c m H 2 0 was more practical. The other major
consideration in comparison of the data in this thesis with other studies reporting oscillatory

140
mechanics in infants is the almost distinct frequency ranges used. The studies within this
thesis have uniformly used forcing signals ranging from 0.5-20 Hz, while the majority of
investigators use a frequency range of 4-32 Hz, or in the case of high-frequency oscillations
2-256 Hz. Indeed, current recommendations issued by the European Respiratory Society,
are a frequency range of at least 4-32 H z or if possible 2-48 H z be used [206]. These
frequencies however can only provide information on the mechanical properties of the
airways, and in general investigators using these frequencies report resistance and reactance
values at specific frequency components, or the mean of the components. The differences
in measured frequency ranges make direct comparisons of data obtained in this thesis with
previous investigations difficult. Measurements obtained by superimposing the oscillatory
signal on the spontaneous breathing, at the airway opening, have exhibited a negative
frequency dependence in Rrs [182,197]. This is in direct contrast to studies conducted
within the same frequency range in intubated neonates [126] or in Rrs measurements
determined using the head generator technique [122], indicating a significant influence of
an upper airway shunt in measurements at the airway opening in spontaneously breathing
patients. Numerous studies have been conducted comparing Zrs measured by applying
oscillations directly to the airway opening or using the head generator technique
[112,113,122]. These studies have uniformly shown that in the 6 - 20 H z range the negative
frequency dependence of Rrs is a result of the Zua acting in parallel to Zrs. This frequency
dependence increases in the presence of airway obstruction or ventilatory inhomogeneity
[21,122]. This negative frequency dependence seen in Rrs in the above mentioned studies
is unrelated to the negative frequency dependence exhibited by the respiratory tissues. This
can be clearly seen in the schematic representation of the relative contributions of the
airways and respiratory tissues to Zrs seen in Figure 2.6. The relative contributions of Grs
and Hrs to Zrs is negligible by approximately 5 Hz, whereas model simulations of the effect
of Zua on the measured Zrs clearly shown an influence of the upper airway shunt to
frequencies as high as 20 H z [21,122]. The technique used in this thesis to determine Zrs
should act to minimise the effects of an upper airway shunt. The low-frequency F O T applies
the forcing signal during a pause in breathing and hence the respiratory system is not
undergoing large, rapid changes during the measurement period. In addition the Prs at which
the measurements are made should act to split the central and upper airways open, hence
reducing the possibility of loss of flow and hence the underestimation of Zrs. Studies in
infants using similar frequencies ranges [7,76,123] as those presented in this thesis, have

141
demonstrated the same characteristic low-frequency negative frequency dependence
exhibited in intubated animal studies [4,5,26] and studies in adults [17,96,200].
8.1.2 Application of the constant-phase model to Zin
The constant-phase model ( C P M ) was first used to separate the pulmonary airway and tissue
mechanical properties by Hantos et al. [26]. The investigators showed in open-chested dogs
that the C P M accurately separated the airway and tissue mechanical properties under
baseline and constricted conditions. The validity of this model has been confirmed in both
open-chested and isolated dog lungs [207] and in open-chested rats [5]. Peripheral airway
inhomogeneities resulting from severe constriction, or ventilation mismatching have been
demonstrated to cause increases in G, not related to actual changes in tissue mechanics,
these changes were also shown to be accompanied by a rapid fall in law [5,27,28], similar
artifactual changes have also be shown to result from central airway shunting [27,200]. In
this thesis the C P M has been applied to Zrs, Zl, Z w , and Zlrs and was able to reliably
describe the mechanics properties of these components, additionally the mechanical
characteristics of the nose could be calculated using the derived mechanical properties of Zrs
and Zlrs. The lung impedances measured in Chapter 4 in intubated, mechanically ventilated
infants and young children were found to be accurately described by the C P M , exhibiting
similar frequency dependencies reported in both open- and intact-chest animal studies
[5,149]. The mechanical behaviour of the chest wall tissues was well described by the tissue
compartment of the C P M and contributed approximately a third of the Grs and Hrs
(38.7±7.3% and 34.4±7.4%, respectively). In agreement with studies in cats [4], rats [12]
and human studies [12] the chest wall exhibited a small, but detectable Newtonian resistance
at higher frequencies. In spontaneously breathing sedated infants Zrs was partitioned into
nasal and lower respiratory system components. The C P M could be accurately fitted to Zlrs
and showed similar mechanical properties as seen in the mechanically ventilated patients,
once methodological differences were accounted for (e.g. lung volume and intubation). The
mechanics properties of the nasal pathway were calculated from the derived mechanical
parameters of Zrs and Zlrs (e.g. R n = Rrs - Rlrs). In agreement with previous studies using
posterior rhinometry [151] and forced oscillation above 8 H z [120] R n was found to
constitute a significant proportion of Rrs (-45%). The nasal inertance dominated Irs,
contributing approximately 7 2 % and accounting for the frequency dependent behaviour of
Xrs above 10 Hz. The mechanical behaviour of the respiratory system and it's constitutive

142
components was well described by the parameters of the C P M in all cases.
The input impedance (Zin) in spontaneously breathing infants can be considered as a
combination of series and parallel components as shown in Figure 8.1.
Zin V
Zpnt
Prs
Zn
Zua
Zrs
Patm
Figure 8.1: The input impedance (Zin) of the infant and measurement system during low-frequency oscillation
applied at the nasal opening, via a face mask. The upper airway impedance (Zua) and Zrs are in parallel with each
other and in series with the nasal (Zn) and pneumotachograph (Zpnt) impedances. Flow (V'), oscillatory pressure
(Prs) and atmospheric pressures 0?atm) are also shown.
As previously stated the impedance of the upper airways (Zua) should be minimal in the
measurements of Zin in this thesis due to both the higher lung volumes and the pause in
breathing used in which to obtain Zrs spectra [7,208]. Hence the parallel pathway in Figure
8.1 can be collapsed so that Zin is represented by a series pathway including Zpnt, Zn, and
Zrs. The respiratory system includes the lung and chest wall components in series with each
other and hence can be represented as Figure 8.2.
Zin
Patm
Figure 8.2: Zin represented as a series construction of Zpnt, Zn, Zl and Zw.
If we now include the mechanical behaviour of each component as it has been described by
the CPM, then the low-frequency Zin in infants at a transrespiratory pressure of 20 cmH20
can be portrayed as Figure 8.3.

143
Zin can be represented by a series combination of Zn, Zl and Zw. The frequency independent
resistive properties of the airways are approximately equally split between the nose and the
lung, while the inertive properties of Zin are predominantly determined by the nasal
structures. The majority of the constant-phase description of the respiratory tissues was
attributed to the pulmonary parenchyma. The mechanical behaviour of the respiratory
system, in spontaneously breathing infants can n o w be described in terms of the constant-
phase model as proposed by Hantos et al. [26].
Zin
Rn In Raw law
Gl/
Zn Zl Zw
Figure 8.3: Representation of the partitioning of Zin, into Zn, Zl and Z w compartments. The relative sizes of the
individual mechanical parameters indicates their relative contributions to the overall behaviour of the respiratory
system as a constant-phase model.
8.2 Findings of this thesis in context to the existing literature
Using an esophageal catheter, Zrs was partitioned into lung (Zl) and chest wall (Zw)
impedances, in a Brown Norway (BN) rat model, hence allowing the characterisation of the
airway and parenchymal mechanics and the relative contributions of the chest wall and lung
mechanics to the respiratory system mechanics to be determined [12]. Furthermore, it was
carried out in the context of three longitudinal measurements over a period of 14 days,
allowing animals to act as their own controls. Previously studies investigating the role of the
pulmonary parenchyma have required the use of capsules, glued to the lung surface, to
measure alveolar pressure. More recently the low-frequency F O T has been used in open-
chested animals to obtain the impedance of the lung (Zl), airway and lung tissue mechanics
were subsequently obtained by fitting the C P M to Zl [5,149]. While the use of the low-
frequency F O T has minimised the complexity of the experiment it still requires the thorax
to be opened. Oostveen and co-workers have recently described the use of a two-
compartment whole body plethysmographic technique that allowed the transfer impedance
to be obtained in conscious rats [144], this model was then subsequently adapted for use in

144
mice [145]. The frequency range used in these studies (16 - 208 Hz) does not allow the
mechanical behaviour of the respiratory tissues to be quantified, as was desired in the
present study. The introduction of this methodology into future studies will confer several
advantages. The numbers needed to detect significant changes in lung function will decrease,
as the variability in intact-chest experiments is lower than that reported in open-chest
procedures, studies involving time courses will be able to use a single group of animals
tested at multiple time points, rather than multiple groups tested a single time point. The
development of a technique able to track longitudinal changes in the mechanical properties
of both the airways and lung tissues will allow the long term progression of allergic disease
or novel treatments to be monitored, providing a more realistic model of lung physiology
that will allow a more accurate translation of results from animal studies to human studies.
In a recent development Preuss and co-workers [209] extended the technique presented in
Chapter 3 [12] to allow the measurement of airway and parenchymal mechanics in non-
paralysed rats. .The investigators were able to show that by increasing the ventilation rate
of the animals that reliable estimates of Zl could be obtained and that baseline mechanics
were not altered over a time period of 3 days. In addition the authors demonstrated that the
introduction of both a M c h dose response curve and/or a bronchoalveolar lavage did not
alter baseline mechanics, while the absence of neuromuscular blockade increased the
responsiveness to both inhaled and intravenous M c h [209]. So it can be seen that the
development of a non-invasive technique to monitor the mechanical behaviour of both the
airways and pulmonary tissues has already begun to lead to significant advances in the
development of a more realistic animal model of asthma, or the long-term monitoring of
disease progression or treatment efficacy. This non-invasive methodology was then
translated into a clinical setting in 5 mechanically ventilated patients undergoing cardiac
surgery (Chapter 4). The low-frequency F O T was able to reliably partition the Zrs into Zl
and Z w components. The C P M could then be fitted to these impedance spectra and the
mechanical properties of the airways and tissues described. The chest wall was found to
contribute a negligible amount to the respiratory system resistance (Rrs) and inertance (Irs),
but to contribute a significant amount to the respiratory tissue damping (Grs) and elastance
(Hrs) (38.5±7.3% and 34.4±7.4%; mean±SEM, respectively). Previous studies attempting
to partition respiratory mechanics in infants or children have reported values of lung
resistance and elastance using passive or dynamic techniques, or values of airway resistance
using the interrupter technique. However these techniques are unable to provide

145
simultaneous assessments of both the airway and lung tissue mechanics. In addition pre
existing techniques are frequency dependent making comparisons between age and patient
groups difficult. The introduction of a non-invasive technique that allows the frequency
dependent characteristics of the lung tissue to be determined will allow more detailed
investigations into the development of parenchymal disease in infants and young children.
The initial study, characterising the lung and chest wall mechanics in intubated ventilated
patients was modified and extended to partition Zrs into Zn and Zlrs impedances in sedated,
spontaneously breathing infants (Chapter 4). Z n was found to influence only the airway
properties of the respiratory system, contributing 44.6±4.9% (mean ± S E M ) of the Rrs and
a majority of the Irs (71.7±3.5%). These relative contributions were also found to be
constant with increasing length, indicating that changes in the nasal mechanics track those
of the respiratory system, during the first two years of life. The findings of these studies have
allowed the relative contributions of the anatomical structures of the respiratory system to
the low-frequency respiratory system mechanics to be described for the first time. These
findings and their contributing technical factors have been outlined previously in detail in
Section 8.1.2. Future infant lung function studies using a nasal or esophageal catheter will
be able to improve the sensitivity of the technique depending on whether the airways (nasal
catheter) or pulmonary tissues (esophageal catheter) are the primary site of interest. This
will allow for the first time an accurate characterisation of the development of the low-
frequency mechanics of the lung chest wall and respiratory system in sedated infants. The
use of such techniques in infants with a history of wheeze or chronic lung disease will allow
information on the role of the airways and pulmonary parenchyma on the development of
such diseases and the possible impact of treatments within such patient groups, to be
obtained.
The work presented in this thesis has reported the mean coefficients of variation of the
mechanical parameters of the airways (Raw and law) and respiratory tissues (Grs and Hrs)
(Chapter 5). The intra-subject variability of the mechanical parameters of the airway and
respiratory tissues compared well with values reported previously in the literature (Table
5.3). Forced expiratory volumes (FEV0.5) and low-frequency F O T mechanical parameters
were determined in a cross-sectional study of infants with no history of respiratory disease.
The relationship between the lung function parameters and length was investigated using
multivariate regression analysis. The effects of gender, passive smoke exposure and family

146
history of asthma on the lung function parameters were also investigated. Both airway and
tissue parameters demonstrated a decreasing quadratic relationship with increasing length,
while FEV0.5 showed an increasing cubic relationship with length. A family history of asthma
was found to have a negative effect on Raw, H and FEV0.5, whereas gender did not have any
effect. The numbers of infants exposed to environmental tobacco smoke were too small to
analyse accurately. The establishment of normal ranges are essential if comparisons are to
be made in patient groups with a history respiratory disease. Previous studies using the
forced oscillation technique to report normal values of respiratory mechanics have used a
wide choice of frequency ranges and numerous different techniques and are not suitable for
comparison with results generated using the low-frequency F O T . While some initial studies
have been carried out using the low-frequency F O T [7,76,123] issues such as repeatability
and intra-subject variability have not been addressed. The initial work presented in Chapter
5 of this thesis will allow detailed studies into the physiological processes associated with
the development of respiratory disease to be carried out in the future. Longitudinal studies
are needed if the role of gender, family history of asthma and passive smoking on airway and
tissue mechanics are to be accurately defined. Previous studies have documented effects of
these factors on lung function, but the results are not clear and in many cases inconsistent.
The rate of change in airway mechanics with length was slower than that of the tissue
mechanics (both G and H ) supporting the concept of dysanaptic growth within this
population. Previous studies have both confirmed [61,176] and refuted [177] that the
concept of dysanaptic growth applies to the growth of the respiratory system. Hibbert and
co-workers [177] proposed that as lung volumes, maximal flows and pressures all track with
growth then dysanaptic growth of the airways and respiratory tissues cannot occur. These
investigators however studied an older population (8-12 years of age), by which time it is
certainly feasible that the majority of growth had occurred and that further growth would
be proportional. These previous studies have been hampered by the fact that the mechanical
behaviour of the airways and respiratory tissues have not been assessed directly. Lanteri et
al. [61] did examine the airway and tissue mechanics, however the population studied was
in intubated infants and children undergoing surgery and does not accurately represent a
healthy population. The low-frequency forced oscillation technique offers an opportunity
to characterise the growth of both the airways and the respiratory tissues in a healthy infant
population. Furthermore the technique has the possibility to identify if infants with

147
respiratory disease, such as chronic lung disease or cystic fibrosis, have differing growth
patterns and the site at which such differences may occur.
A further cross sectional study was carried out in 22 asymptomatic infants with a history of
recurrent or persistent wheeze (Chapter 6). Baseline airway and respiratory tissue mechanics
were determined and standardised variants (Z scores) were used to compare the wheezy
population to the previously described normal population, hence ascertaining the role of the
airways and respiratory tissues in the development of chronic wheeze in infancy. The
mechanical properties of the airways and respiratory tissues were found to be significantly
abnormal in wheezy infants older than 1 year of age, when compared to their normal
counterparts. Suggesting that infantile wheeze is not merely related to airway function, but
rather an alteration in mechanical characteristics of both the airways and the respiratory
tissues. Previous studies have not consistently shown differences in lung function parameters
in infants with a history of recurrent wheeze. Studies have shown altered Rrs and Crs [181]
and V m a x F R C [178] in wheezy compared to healthy infants. In contradiction to these
studies tidal volume, Crs and respiratory system conductance [178], F R C [181] and Raw,
specific R a w and thoracic gas volume ( T G V ) [183] have all been shown to be unaltered in
infantile wheeze. The present study demonstrated abnormal respiratory system mechanics
in wheezy infants older than one year indicating that ongoing recurrent wheeze is driven by
underlying alterations in airway and lung tissue physiology. It is possible that the
introduction of an esophageal catheter to allow direct measurement of the lung would show
abnormalities at an earlier age than demonstrated in this thesis. These results reinforce the
importance of determining the mechanical behavior of the respiratory tissues in infant lung
function studies.
The responsiveness to inhaled methacholine (Mch) in 17 infants was assessed using the low-
frequency F O T , by comparing the threshold concentration in R a w with a 1 5 % drop in
FEV0.5 (PC15FEV0.5). Doubling concentrations of inhaled M c h were administered until the
maximal dose (16 mg/mL) was achieved or a response in FEV0.5 recorded. A n increase in
R a w of at least twice the baseline variability (2 times coefficient of variation; T C R a w ) was
considered to be an positive response as determined by the low-frequency F O T . The T C R a w
was found to be significantly lower than that of the PC15FEV0.5. Upon further examination
this was attributed to the relative changes required to reach the respective responses. Using

148
previously determined baseline variability in FEV0.5 of approximately 5-7% [47,131] a
change in FEV0.5 of 1 5 % represents an increase between 2 and 3 times that of baseline
variability, while the change required to achieve T C R a w is by definition, twice that of the
baseline variability. A n increase in R a w of 3 0 % equates to an increase of approximately 2.7
times that of the baseline variability (Chapter 5) and would be equivalent to PC15FEV0.5.
Indeed, PC3oRaw and PC15FEV0.5 were found to be the same (1.5; 0.5-2 m g / m L and 1.5;
1-4 mg/mL (median;25-75% CI), respectively), indicating that the low-frequency F O T is
effective in detecting a response to inhaled M c h in infants. Significant changes in law, G and
rt were also recorded, while no response was noted in H. While central airway shunting may
have contributed to the increase in G and rj, but not H [200], the use of a transrespiratory
pressure of 20 c m H 2 0 should act to splint the central airways open and hence reduce airway
shunting. The disassociation in responses between r| and H has been previously
demonstrated by Fredberg and co-workers [201] and may explain the tissue response to
inhaled M c h seen in the present study. Changes in central airway mechanics were thought
to be responsible for the increase in law, indicating inhaled M c h acts on both the central and
peripheral airways in sedated infants. A number of limitations were identified. Zrs spectra
could not be obtained in some infants undergoing a response to M c h (i.e. FEV0.5 decreased
by 15%) due to increased respiratory rates, wheeze or cough and hence pauses in breathing
of sufficient lengths could not be induced. The chosen challenge protocol exacerbated this
problem. Cumulative M c h inhalations were used with successive doses administered every
5 minutes, during which time both FEV0.5 and Zrs spectra were obtained. In infants with a
strong reaction to a particular M c h concentration, difficulties were experienced in obtaining
both lung function measures. A revised protocol using PC3oRaw as the outcome variable
would allow more time at each inhalation for successful Zrs spectra to be obtained. The
possible disassociation between r\ and H needs to be investigated as does the role of
hyperresponsiveness in infants with a history of wheeze. The use of M c h challenge testing
in infants with a history of recurrent wheeze may provide further information on the role of
the pulmonary tissues in the development of early asthma.
8.3 Future directions
Further studies are needed to determine the full potential of the low-frequency forced
oscillation technique in infant lung function. Longitudinal studies with large numbers are

149
required to examine, in more detail the effect of environmental smoke exposure, gender and
family history on the subsequent development of the airways and respiratory tissues, as well
as which risk factors may be most important in predicting the differences between those
infants with transient and persistent wheeze. The active control of end-expiratory lung
volume in infants may be a major factor in the lack of differences between
hyperresponsiveness in infants with and without wheeze [178]. The combination of the low-
frequency F O T and measurements of lung volume may provide more detailed information
on the mechanical behaviour of both the airways and respiratory tissues in infants, allowing
better discrimination between healthy and diseased infants. The additional inclusion of
catheters to partition Zrs will also increase the sensitivity of the technique to detect changes
in R a w by 1 0 0 % and in Gl and HI by 5 0 % , depending upon the location of the catheter
(nasal and esophageal, respectively). Based on the data presented in this thesis either a nasal
or esophageal catheter should be routinely used, depending upon whether the airways or
respiratory tissues are the primary site of interest. Future investigations into the
responsiveness of infants to inhaled agonists using the low-frequency F O T should use
PC3oRaw as the outcome variable. The redesign of the challenge protocol will increase the
successfulness of the technique and allow more detailed information regarding
hyperresponsiveness in infants. Further information on the mechanical changes in the
pulmonary parenchyma during bronchoconstriction should be obtained, with studies
investigating the disassociation between the mechanical responses in G, H and r| to inhaled
M c h warranted. Additional studies in symptomatic infants are needed, allowing comparisons
with both healthy and asymptomatic patient groups. Such studies may provide valuable
information on the mechanical changes in either the airways or pulmonary parenchymal
accompanying episodes of viral induced wheeze, exacerbations of chronic wheeze or cough
as well as other respiratory problems, such as chronic lung disease.
8.4 Conclusions
This thesis has detailed much of the initial work required to allow the low-frequency forced
oscillation technique to be adopted for investigations into the genesis of respiratory disease
in infants. The anatomical components of the respiratory system were characterised. The
nose was found to contribute in the order of half of the Rrs and a majority of the Irs, the
chest wall significantly influenced the constant-phase tissue mechanics of the respiratory
system contributing approximately a third of the measured Grs and Hrs. Regression

150
equations establishing the relationships between both airway and respiratory tissues
mechanics and length were established. Family history of asthma was found to have a
significant detrimental effect on Raw, H and FEV0.5. These regression equations were then
used to demonstrate that infants older than 12 months of age with ongoing recurrent wheeze
have abnormal airway and respiratory tissue mechanics. The ability of the low-frequency
F O T to detect hyperresponsiveness in infants to inhaled M c h was shown with significant
responses seen in Raw, law, G and r\, but not in H. The adoption of PC 3oRaw as a suitable
outcome variable was recommended for use in future studies.
In conclusion, the observations of Sly and colleagues [7] on the low-frequency forced
oscillation technique in infants have been addressed. The technical factors associated with
use of the technique in future studies have been evaluated, allowing investigations into
clinical issues in patient groups to be carried out.

151
REFERENCES 1. Rodarte JR, Rehder K. Dynamics of Respiration. In: Macklem PT, Mead J, eds.
Handbook of Physiology. The Respiratory System. Mechanics of Breathing. Bethesda,
MD.: American Physiological Society, 1986; 131-44.
2. Brusasco V, Warner D O , Beck KC, Rodarte JR, Rehder K. Partitioning of
pulmonary resistance in dogs: effect of tidal volume and frequency. J. Appl Physiol.
1989;66(3): 1190-6.
3. Hantos Z, Daroczy B, Csendes T, Suki B, Nagy S. Modeling of low-frequency
pulmonary impedance in dogs. J. Appl Physiol. 1990;68(3):849-60.
4. Hantos Z, Adamicza A, Govaerts E, Daroczy B. Mechanical impedances of lungs
and chest wall in the cat. J. Appl Physiol 1992;73(2):427-33.
5. Petak F, Hantos Z, Adamicza A, Astalos T, Sly PD. Methacholine-induced
bronchoconstriction in rats: effects of intravenous vs. aerosol delivery. J. Appl. Physiol.
1997;82(5): 1479-87.
6. Lutchen KR, Everett .JR, Jackson AC. Impact of frequency range and input
impedance on airway-tissue separation implied from transfer impedance. J. Appl. Physiol.
1993;74(3):1089-99.
7. Sly PD, Hayden MJ, Petak F, Hantos Z. Measurement of low-frequency respiratory
impedance in infants. Am. J. Resp. Crit. Care. Med. 1996;154(1): 161-6.
8. Bachofen H, Wilson TA. Micromechanics of the Acinus and Alveolar Walls. In:
Crystal RG, West JB, eds. The Lung: Scientific Foundations. 2 ed. Philadelphia:
Lippincott-Raven Publishers, 1997; 1159-67.
9. Weibel ER. Functional morphology of Lung Parenchyma. In: Macklem PT, Mead
J, eds. Handbook of Physiology. The Respiratory System. Mechanics of Breathing.
Bethesda, MD.: American Physiological Society, 1986; 89-111.
10. Goerke J, Schurch S. Mechanical properties of the Alveolar Surface. In: Crystal
RG, West JB, eds. The Lung: Scientific Foundations. 2 ed. Philadelphia: Lippincott-Raven
Publishers, 1997; 1169-76.
11. Peslin R, Duvivier C, Bekkari H, Reichart E, Gallina C. Stress adaptation and low-
frequency impedance of rat lungs. J. Appl Physiol. 1990;69(3): 1080-6.
12. Petak F, Hall GL, Sly PD. Repeated Measurements of Airway and Parenchymal
Mechanics in Rats By Using Low-Frequency Oscillations. J. Appl Physiol.

152
1998;84(5):1680-6.
13. Shardonofsky FR, Sato J, Eidelman D H . Frequency dependence of pulmonary and
chest wall mechanics in young and adult cats. J. Appl Physiol 1994;76(5):2037-46.
14. Shen X, Gunst SJ, Tepper RS. Effect of tidal volume and frequency on airway
responsiveness in mechanically ventilated rabbits. J. Appl Physiol 1997;83(4): 1202-8.
15. Suki B, Hantos Z, Daroczy B, Alkaysi G, Nagy S. Nonlinearity and harmonic
distortion of dog lungs measured by low-frequency forced oscillations. J. Appl Physiol
1991;71(l):69-75.
16. Barnas G M , Mills PJ, Mackenzie CF, Ashby M , Sexton W L , et al Dependencies
of respiratory system resistance and elastance on amplitude and frequency in the normal
range of breathing. Am. Rev. Respir. Dis. 1991;143(2):240-4.
17. Lutchen KR, Kaczka D W , Suki B, Barnas G, Cevenini G, et al. Low-frequency
respiratory mechanics using ventilator-driven forced oscillations. J. Appl. Physiol.
1993;75(6):2549-60.
18. Nicolai T, Lanteri CJ, Sly PD. Frequency dependence of elastance and resistance
in ventilated children with and without the chest opened. Eur. Respir. J. 1993;6(9): 1340-6.
19. Nicolai T, Lanteri C, Freezer N, Sly PD. Non-invasive determination of alveolar
pressure during mechanical ventilation. Eur. Respir. J. 1991;4(10): 1275-83.
20. Peslin R, Duvivier C. Partitioning Of Airway and Respiratory Tissue Mechanical
Impedances By Body Plethysmography. J. Appl Physiol 1998;84(2):553-61.
21. Peslin R, Duvivier C, Didelon J, Gallina C. Respiratory impedance measured with
head generator to minimize upper airway shunt. J. Appl Physiol 1985;59(6): 1790-5.
22. Peslin R, Fredberg JJ. Oscillation Mechanics of the Respiratory System. In:
Macklem PT, Mead J, eds. Handbook of Physiology. The Respiratory System. Mechanics
of Breathing. Bethesda, MD.: American Physiological Society, 1986; 145-78.
23. Otis A B , Fenn W O , Rahn H. Mechanics of Breathing in Man. J. Appl Physiol.
1950;2:592-607.
24. Lanteri CJ, Kano S, Nicolai T, Sly PD. Measurement of dynamic respiratory
mechanics in neonatal and pediatric intensive care: the multiple linear regression technique.
Pediatr. Pulmonol 1995;19(l):29-45.
25. Kano S, Lanteri CJ, Duncan A W , Sly PD. Influence of nonlinearities on estimates
of respiratory mechanics using multilinear regression analysis [published erratum appears
in J Appl Physiol 1995 Mar;78(3):following table of contents]. J. Appl. Physiol

153
1994;77(3): 1185-97.
26. Hantos Z, Daroczy B, Suki B, Nagy S, Fredberg JJ. Input impedance and peripheral
inhomogeneity of dog lungs. J. Appl. Physiol 1992;72(1): 168-78.
27. Lutchen KR, Greenstein JL, Suki B. H o w inhomogeneities and airway wall affect
frequency dependance and separation of airways and tissue properties. J. Appl. Physiol.
1996;80(5): 1696-707.
28. Lutchen KR, Hantos Z, Petak F, Adamicza A, Suki B. Airway inhomogeneities
contribute to apparent lung tissue mechanics during constriction. J. Appl. Physiol
1996;80(5): 1841-9.
29. DuBois AB, Brody A W , Lewis D H , Burgess BFJ. Oscillation Mechanics of Lungs
and Chest in Man. J. Appl. Physiol 1956;8:587-94.
30. Bates JH. Stochastic model of the pulmonary airway tree and its implications for
bronchial responsiveness. J. Appl. Physiol 1993;75(6):2493-9.
31. Maksym GN, Bates JHT. A distributed nonlinear model of lung tissue elasticity. J.
Appl Physiol. 1997;82(1):32-41.
32. Anonymous. Respiratory mechanics in infants: physiologic evaluation in health and
disease. American Thoracic Society/European Respiratory Society. Am. Rev. Respir. Dis.
1993;147(2):474-96.
33. England SJ. Current techniques for assessing pulmonary function in the newborn
and infant: advantages and limitations. Pediatr. Pulmonol 1988;4(l):48-53.
34. Silverman M , Prendiville A, Green S. Partial expiratory flow-volume curves in
infancy: technical aspects. Bull Eur Physiopath Respir. 1986;22(3):257-62.
35. Motoyama EK. Pulmonary mechanics during early postnatal years. Pediatr. Res.
1977;ll(3Pt2):220-3.
36. Bryan AC, Wohl M E B . Respiratory Mechanics in Children. In: Macklem PT,
Mead J, eds. Handbook of Physiology. The Respiratory System Mechanics of Breathing.
Bethesda, MD.: American Physiological Society, 1986; 179-91.
37. Taussig L M , Landau LI, Godfrey S, Arad I. Determinants of forced expiratory
flows in newborn infants. J Appl Physiol: Respir. Environ. Exercise Physiol.
1982;53(5): 1220-7.
3 8. Tepper RS, Reister T. Forced expiratory flows and lung volumes in normal infants.
Pediatr. Pulmonol 1993;15(6):357-61.
39. Clarke JR, Reese A, Silverman M . Bronchial responsiveness and lung function in

154
infants with lower respiratory tract illness over the first six months of life. Arch. Dis. Child
1992;67(12): 1454-8.
40. Clayton RG, ST., Diaz CE, Bashir NS, Panitch H B , Schidlow DV, et al Pulmonary
function in hospitalized infants and toddlers with cystic fibrosis [see comments]. J. Pediatr.
1998;132(3 Pt l):405-8.
41. Tepper RS. Airway reactivity in infants: a positive response to methacholine and
metaproterenol. J. Appl. Physiol. 1987;62(3): 1155-9.
42. Hiatt P, Eigen H, Yu P, Tepper RS. Bronchodilator responsiveness in infants and
young children with cystic fibrosis. Am. Rev. Respir. Dis. 1988;137(1):119-22.
43. Tepper RS, Rosenberg D, Eigen H. Airway responsiveness in infants following
bronchiolitis [see comments]. Pediatr. Pulmonol. 1992;13(1):6-10.
44. Tepper RS, Morgan WJ, Cota K, Wright A, Taussig LM. Physiologic growth and
development of the lung during the first year of life [published erratum appears in A m Rev
Respir Dis I987;136(3):800], Am. Rev. Respir. Dis. 1986; 134(3):513-9.
45. Le Souef PN, Hughes D M , Landau LI. Shape of forced expiratory flow-volume
curves in infants. Am. Rev. Respir. Dis. 1988;138(3):590-7.
46. Turner DJ, Lanteri CJ, LeSouef PN, Sly PD. Improved detection of abnormal
respiratory function using forced expiration from raised lung volume in infants with cystic
fibrosis. Eur. Respir. J. 1994;7(11): 1995-9.
47. Turner DJ, Stick SM, Lesouef KL, Sly PD, Lesouef PN. A new technique to
generate and assess forced expiration from raised lung volume in infants. Am. J. Resp. Crit.
Care. Med. 1995;151(5):1441-50.
48. Hayden MJ, Sly PD, Devadason SG, Gurrin LC, Wildhaber JH, et al Influence of
driving pressure on raised-volume forced expiration in infants. Am. J. Resp. Crit. Care.
Med. 1997; 156(6): 1876-83.
49. Davis G M , Stocks J, Gerhardt T, Abbasi S, Gappa M. Measurement of Dynamic
Lung Mechanics in Infants. In: Stocks J, Sly PD, Tepper RS, Morgan WJ, eds. Infant
Respiratory Function Testing. N e w York: John Wiley & Sons, 1996; 259-81.
50. DuBois AB, Botelho SY, Bedell G N , Marshall R, Comroe JH. A rapid
plethysmographic method for measuring TGV. J Clin Invest. 1956;35:322-6.
51. Klaus M , Tooley W H , Weaver K H , Clements JA. Functional residual capacity in
newborn infants measured by a rapid physical method. Am. J. Dis. Child. 1960;100:482-4.
52. Quanjer PH, Stocks J, Polgar G, Wise M , Karlberg J, et al Compilation of

155
reference values for lung function measurements in children. Eur Respir J. 1989;4:184S-
261S.
53. Sly PD, Brown K A , Bates JH, Spier S, Milic-Emili J. Noninvasive determination
of respiratory mechanics during mechanical ventilation of neonates: a review of current and
future techniques. Pediatr. Pulmonol. I988;4(l):39-47.
54. Sly PD, Bates JH. Computer analysis of physical factors affecting the use of the
interrupter technique in infants. Pediatr. Pulmonol 1988;4(4):219-24.
55. Sly PD, Brown K A , Bates JH, Macklem PT, Milic-Emili J, et al Effect of lung
volume on interrupter resistance in cats challenged with methacholine. J. Appl. Physiol
1988;64(l):360-6.
56. Similowski T, Levy P, Corbeil C, Albala M , Pariente R, et al Viscoelastic behavior
of lung and chest wall in dogs determined by flow interruption. J. Appl. Physiol
1989;67(6):2219-29.
57. Bates JH, Baconnier P, Milic-Emili J. A theoretical analysis of interrupter technique
for measuring respiratory mechanics. J. Appl. Physiol. 1988;64(5):2204-14.
58. Kochi T, Bates JH, Okubo S, Petersen ES, Milic-Emili J. Respiratory mechanics
determined by flow interruption during passive expiration in cats. Respir. Physiol
1989;78(2):243-52.
59. Saldiva PH, Zin W A , Santos RL, Eidelman D H , Milic-Emili J. Alveolar pressure
measurement in open-chest rats. J. Appl. Physiol 1992;72(l):302-6.
60, Freezer NJ, Sly PD. Predictive value of measurements of respiratory mechanics in
preterm infants with H M D . Pediatr. Pulmonol 1993;16(2):116-23.
61. Lanteri CJ, Sly PD. Changes in respiratory mechanics with age. J. Appl. Physiol
1993;74(l):369-78.
62. Bisgaard H, Klug B. Lung function measurement in awake young children. Eur.
Respir. J. 1995;8(12):2067-75.
63. Phagoo SB, Wilson N M , Silverman M . Evaluation of a new interrupter device for
measuring bronchial responsiveness and the response to bronchodilator in 3 year old
children [see comments]. Eur. Respir. J. 1996;9(7): 1374-80.
64. Klug B, Bisgaard H. Specific airway resistance, interrupter resistance, and
respiratory impedance in healthy children aged 2-7 years. Pediatr. Pulmonol.
1998;25(5):322-31.
65. Papastamelos C, Panitch H P , England SE, Allen JL. Developmental changes in

156
chest wall compliance in infancy and early childhood. J. Appl. Physiol 1995;78(1): 179-84.
66. Rabbette PS, Fletcher M E , Dezateux CA, Soriano-Brucher H, Stocks J. Hering-
Breuer reflex and respiratory system compliance in the first year of life: a longitudinal study.
J. Appl Physiol 1994;76(2):650-6.
67. Fletcher M E , Baraldi E, Steinbrugger B. Passive Respiratory Mechanics. In: Stocks
J, Sly PD, Tepper RS, Morgan WJ, eds. Infant Respiratory Function Testing. N e w York:
John Wiley & Sons, 1996; 259-81.
68. Helms P. Problems with plethysmographic estimation of lung volume in infants and
young children. J Appl Physiol: Respir. Environ. Exercise Physiol. 1982;53(3):698-702.
69. Hanrahan JP, Brown R W , Carey VJ, Castile RG, Speizer FE, et al. Passive
respiratory mechanics in healthy infants. Effects of growth, gender, and smoking [see
comments]. Am. J. Resp. Crit. Care. Med. 1996;154(3 Pt l):670-80.
70. Gappa M , Rabbette PS, Costeloe KL, Stocks J. Assessment of passive respiratory
compliance in healthy preterm infants: a critical evaluation. Pediatr. Pulmonol
1993;15(5):304-11.
71. Storme L, Riou Y, Leclerc F, Kacet N, Dubos JP, et al Respiratory mechanics in
mechanically ventilated newborns: a comparison between passive inflation and occlusion
methods. Pediatr. Pulmonol. 1992;12(4):203-12.
72. Kugelman A, Keens TG, deLemos R, Durand M . Comparison of dynamic and
passive measurements of respiratory mechanics in ventilated newborn infants [see
comments]. Pediatr. Pulmonol 1995;20(4):258-64.
73. Turner DJ, Morgan SE, Landau LI, LeSouef PN. Methodological aspects of flow-
volume studies in infants. Pediatr. Pulmonol. 1990;8(4):289-93.
74. Masters IB, Seidenberg J, Hudson I, Phelan PD, Olinsky A. Longitudinal study of
lung mechanics in normal infants. Pediatr. Pulmonol 1987;3(l):3-7.
75. Seidenberg J, Masters IB, Hudson I, Olinsky A, Phelan PD. Disturbance in
respiratory mechanics in infants with bronchiolitis [see comments]. Thorax.
1989;44(8):660-7.
76. Petak F, Hayden MJ, Hantos Z, Sly PD. Volume dependence of respiratory
impedance in infants. Am. J. Resp. Crit. Care. Med. 1997;156(4 Pt 1): 1172-7.
77. Freezer NJ, Nicolai T, Sly PD. Effect of volume history on measurements of
respiratory mechanics using the interrupter technique [published erratum appears in Pediatr
Res 1993 May;33(5):451]. Pediatr. Res. 1993;33(3):261-6.

157
78. Barnas G M , Sprung J. Effects of mean airway pressure and tidal volume on lung
and chest wall mechanics in the dog. J. Appl Physiol. 1993;74(5):2286-93.
79. Nagase T, Matsui H, Sudo E, Matsuse T, Ludwig M S , et al Effects of lung volume
on airway resistance during induced constriction in papain-treated rabbits. J. Appl. Physiol
1996;80(6): 1872-9.
80. Kraemer R, Frey U, Sommer C W , Russi E. Short-term effect of albuterol, delivered
via a new auxiliary device, in wheezy infants. Am. Rev. Respir. Dis. 1991;144(2):347-51.
81. Stocks J, Marchal F, Kraemer R, Gutowski P, Bar Yishay E, et al. Plethymographic
Assessment of Function Residual Capacity and Airway Resistance. In: Stocks J, Sly PD,
Tepper RS, Morgan WJ, eds. Infant Respiratory Function Testing. 1 ed. N e w York: Wiley-
Lisslnc, 1996; 191-239.
82. Shore SA, Huk O, Mannix S, Martin JG. Effect of panting frequency on the
plethysmographic determination of thoracic gas volume in chronic obstructive pulmonary
disease. Am. Rev. Respir. Dis. 1983;128(l):54-9.
83. Stanescu D C , Rodenstein D, Cauberghs M , Van de Woestijne KP. Failure of body
plethysmography in bronchial asthma. J Appl Physiol: Respir. Environ. Exercise Physiol.
1982;52(4):939-48.
84. Eber E, Steinbrugger B, Modi M , Weinhandl E, Zach M S . Lung volume
measurements in wheezy infants: comparison of plethysmography and gas dilution. Eur.
Respir. J. 1994;7(11): 1988-94.
85. Beardsmore CS, Stocks J, Silverman M . Problems in measurement of thoracic gas
volume in infancy. J Appl Physiol: Respir. Environ. Exercise Physiol. 1982;52(4):995-9.
86. Godfrey S. T G V or not T G V in W B ? That is the question [editorial] [see
comments]. Pediatr. Pulmonol 1991;10(2):73-7; discussion 7-8.
87. Godfrey S, Beardsmore CS, Maayan C, Bar-Yishay E. Can thoracic gas volume be
measured in infants with airways obstruction? Am. Rev. Respir. Dis. 1986;133(2):245-51.
88. Brown R, Slutsky AS. Frequency dependence of plethysmographic measurement
of thoracic gas volume. J Appl Physiol: Respir. Environ. Exercise Physiol.
1984;57(6): 1865-71.
89. Tepper RS, Merth IT, Newth CJL, Gerhardt T. Measurement of Functional
Residual Capacity in Infants by Helium Dilution and Nitrogen Washout techniques. In:
Stocks J, Sly PD, Tepper RS, Morgan WJ, eds. Infant Respiratory Function Testing. 1 ed.
N e w York: Wiley-Liss Inc., 1996; 165-89.

158
90. Gerhardt T, Reifenberg L, Hehre D, Feller R, Bancalari E. Functional residual
capacity in normal neonates and children up to 5 years of age determined by a N 2 washout
method. Pediatr. Res. 1986;20(7):668-71.
91. Shao H Q , Sandberg K, Hjalmarson O. Impaired Gas Mixing and L o w Lung
Volume in Preterm Infants With Mild Chronic Lung Disease. Pediatr. Res. 1998;43(4):536-
41.
92. Hammer J, Numa A, Newth CJ. Albuterol responsiveness in infants with respiratory
failure caused by respiratory syncytial virus infection. J. Pediatr. 1995;127(3):485-90.
93. Sivan Y, Deakers T W , Newth CJ. Functional residual capacity in ventilated infants
and children. Pediatr. Res. 1990;28(5):451-4.
94. Lutchen KR, Suki B. Understanding Pulmonary mechanics using the Forced
Oscillation Technique. In: Khoo, ed. Bioengineering Approaches to Pulmonary Physiology
and Medicine. N e w York: Plenum Press, 1996; 227-53.
95. Daroczy B, Hantos Z. Generation of optimum pseudorandom signals for respiratory
impedance measurements. Int JBioMed Comput. 1990;25(1 ):21-31.
96. Hantos Z, Daroczy B, Suki B, Galgoczy G, Csendes T. Forced oscillatory
impedance of the respiratory system at low frequencies. J. Appl. Physiol 1986;60(1):123-
32.
97. Lutchen KR, Yang K, Kaczka D W , Suki B. Optimal ventilation waveforms for
estimating low-frequency respiratory impedance. J. Appl. Physiol 1993;75(l):478-88.
98. Suki B, Lutchen KR. Pseudorandom signals to estimate apparent transfer and
coherence functions of nonlinear systems: applications to respiratory mechanics. IEEE
Trans BiomedEng. 1992;39(11): 1142-51.
99. Daroczy B, Fabula A, Hanos Z. Use of noninteger-multiple pseudorandom
excitation to minimize nonlinear effects on impedance estimation. Eur Respir Rev.
1991;l(3):183-7.
100. Peslin R, Saunier C, Gallina C, Duvivier C. Small-ampUtude pressure oscillations
do not modify respiratory mechanics in rabbits. J. Appl. Physiol 1994;76(3):1011-3.
101. Suki B, Bates JH. A nonlinear viscoelastic model of lung tissue mechanics. J. Appl.
Physiol. 1991;71(3):826-33.
102. Desager K N , Buhr W , Willemen M , van Bever HP, de Backer W , et al
Measurement of total respiratory impedance in infants by the forced oscillation technique.
J. Appl. Physiol 1991;71(2): 770-6.

159
103. Habib RH, Jackson AC. Total respiratory input impedance with the upper airway
wall shunt minimized. J. Appl Physiol 1993;74(3): 1045-55.
104. Cauberghs M , Van de Woestijne KP. Effect of upper airway shunt and series
properties on respiratory impedance measurements. J. Appl. Physiol 1989;66(5):2274-9.
105. Jackson A C , Giurdanella CA, Dorkin HL. Density dependence of respiratory
system impedances between 5 and 320 H z in humans. J. Appl. Physiol 1989;67(6):2323-
30.
106. Jackson AC, NeffKM, Dorkin HL, Lutchen KR. Interpretation of respiratory input
impedance in healthy infants. Pediatr. Pulmonol 1996;22(6):364-75.
107. Barnas G M , Campbell D N , Mackenzie CF, Mendham JE, Fahy BG, et al. Lung,
chest wall, and total respiratory system resistances and elastances in the normal range of
breathing. Am. Rev. Respir. Dis. 1992;145(1): 110-3.
108. Barnas G M , Stamenovic D, Lutchen KR, Mackenzie CF. Lung and chest wall
impedances in the dog: effects of frequency and tidal volume. J. Appl. Physiol.
1992;72(l):87-93.
109. Bates ,JH, Shardonofsky F, Stewart DE. The low-frequency dependence of
respiratory system resistance and elastance in normal dogs. Respir. Physiol.
1989;78(3):369-82.
110. Michaelson ED, Grassman ED, Peters W R . Pulmonary mechanics by spectral
analysis of forced random noise. J. Clin. Invest. 1975;56(5): 1210-30.
111. Peslin R, Duvivier C, Jardin P. Upper airway walls impedance measured with head
plethysmograph. J Appl Physiol: Respir. Environ. Exercise Physiol. 1984;57(2):596-600.
112. Marchal F, Haouzi P, Peslin R, Duvivier C, Gallina C. Mechanical properties of the
upper airway wall in children and their influence on respiratory impedance measurements.
Pediatr. Pulmonol 1992;13(l):28-33.
113. Marchal F, Mazurek H, Habib M , Duvivier C, Derelle J, et al Input respiratory
impedance to estimate airway hyperreactivity in children: standard method versus head
generator. Eur. Respir. J. 1994;7(3):601-7.
114. Farre R, Peslin R, Oostveen E, Suki B, Duvivier C, et al. Human respiratory
impedance from 8 to 256 H z corrected for upper airway shunt. J. Appl Physiol
1989;67(5): 1973-81.
115. Peslin R, Duvivier C, Gallina C. Total respiratory input and transfer impedances in
humans. J. Appl. Physiol. 1985;59(2):492-501.

160
116. Lutchen KR, Sullivan A, Arbogast FT, Celli BR, Jackson A C . Use Of Transfer
Impedance Measurements For Clinical Assessment Of Lung Mechanics. Am. J. Resp. Crit.
Care. Med. 1998; 157(2):43 5-46.
117. Lutchen KR, Jackson AC. Confidence bounds on respiratory mechanical properties
estimated from transfer versus input impedance in humans versus dogs. IEEE Trans Biomed
Eng. 1992;39(6):644-51.
118. Tomalak W , Peslin R, Duvivier C, Gallina C. Optimal frequency range to analyze
respiratory transfer impedance with six-element model. J. Appl Physiol. 1993;75(6):2656-
64.
119. Konig P, Hordvik N L , Pimmel RL. Forced random noise resistance determination
in childhood asthma. Chest. 1984;86(6):884-90.
120. Desager K N , Wfflemen M , Van Bever HP, D e Backer W , Vermeire PA. Evaluation
of nasal impedance using the forced oscillation technique in infants [published erratum
appears in Pediatr Pulmonol 1992 Jan;12(l):67]. Pediatr. Pulmonol 1991;ll(l):l-7.
121. Frey U, Silverman M , Kraemer R, Jackson AC. High-frequency respiratory
impedance measured by forced-oscillation technique in infants. Am. J. Resp. Crit. Care.
Med. 1998;158(2):363-70.
122. Marchal F, Peslin R, Duvivier C, Gallina C, Crance JP. Measurement of ventilatory
mechanical impedance in infants using a head pressure generator. Pediatr. Pulmonol.
1989;7(4):209-16.
123. Hayden MJ, Petak F, Hantos Z, Hall G, Sly PD. Using Low-Frequency Oscillation
to Detect Bronchodilator Responsiveness in Infants. Am. J. Resp. Crit. Care. Med.
1998;157(2):574-9.
124. Gauthier R, Beyaert C, Feillet F, Peslin R, Monin P, et al. Respiratory Oscillation
Mechanics in Infants With Bronchiolitis During Mechanical Ventilation. Pediatr. Pulmonol.
1998;25(1):18-31.
125. Sullivan KJ, Durand M , Chang H K . A forced perturbation method of assessing
pulmonary mechanical function in intubated infants. Pediatr. Res. 1991;29(l):82-8.
126. Dorkin HL, Stark AR, Werthammer JW, Strieder DJ, Fredberg JJ, et al Respiratory
system impedance from 4 to 40 H z in paralyzed intubated infants with respiratory disease.
J. Clin. Invest. 1983;72(3):903-10.
127. Wohl M E B , Stigol LC, Mead J. Resistance of the total respiratory system in healthy
infants and infants with bronchiolitis. Pediatrics. 1969;43:495-509.

161
128. Marchal F, Colin G, Chalon B, Duviver C, Crance JP, et al. Transfer respiratory
impedance and thoracic gas volume to estimate airway and tissue impedance in infants. Eur
Respir Rev. 1994;4(19):159-64.
129. Jackson AC, Tennhoff W , Kraemer R, Frey U. Airway and tissue resistance in
wheezy infants: Effects of albuterol. Am. J. Resp. Crit. Care. Med. 1999;160:557-63.
130. Lanteri CJ, Kano S, Sly PD. Validation of esophageal pressure occlusion test after
paralysis. Pediatr. Pulmonol 1994;17(l):56-62.
131. Hayden MJ, Devadason SG, Sly PD, Wildhaber JH, LeSouef PN. Methacholine
responsiveness using the raised volume forced expiration technique in infants. Am. J. Resp.
Crit. Care. Med. 1997;155(5): 1670-5.
132. Beardsmore CS. Lung function from infancy to school age in cystic fibrosis. Arch.
Dis. Child 1995;73(6):519-23.
133. Parker DR, O'Connor G T , Sparrow D, Segal M R , Weiss ST. The relationship of
nonspecific airway responsiveness and atopy to the rate of decline of lung function. The
Normative Aging Study. Am. Rev. Respir. Dis. 1990;141(3):589-94.
134. Young S, Arnott J, Le Souef PN, Landau LI. Flow limitation during tidal expiration
in symptom-free infants and the subsequent development of asthma. J. Pediatr. 1994; 124(5
Pt l):681-8.
135. Hantos Z, Daroczy B, Suki B, Nagy S. Low-frequency respiratory mechanical
impedance in the rat. J. Appl Physiol 1987;63(l):36-43.
136. Suki B, Petak F, Adamicza A, Hantos Z, Lutchen KR. Partitioning of airway and
lung tissue properties: comparison of in situ and open-chest conditions. J. Appl Physiol.
1995;79(3):861-9.
137. Fredberg JJ, Stamenovic D. O n the imperfect elasticity of lung tissue. J. Appl
Physiol 1989;67(6):2408-19.
138. Nagase T, Moretto A, Ludwig M S . Airway and tissue behavior during induced
constriction in rats: intravenous vs. aerosol administration. J. Appl Physiol
1994;76(2):830-8.
139. Sly PD, Lanteri CJ. Partitioning of pulmonary responses to inhaled methacholine
in puppies. J. Appl Physiol. 1991;71(3):886-91.
140. Nagase T, Dallaire MJ, Ludwig M S . Airway and tissue behaviour during early
response in senstised rats: role of 5-HT and LTD4. J. Appl Physiol 1996;80(2):583-90.
141. Nagase T, Fukuchi Y, Matsuse T, Sudo E, Matsui H, et al. Antagonism of ICAM-1

162
attenuates airway and tissue responses to antigen in sensitized rats. Am. J. Resp. Crit Care.
Med. 1995;151(4):1244-9.
142. Navajas D, Moretto A, Rotger M , Nagase T, Dallaire MJ, et al Dynamic elastance
and tissue resistance of isolated liquid-filled rat lungs. J. Appl Physiol 1995;79(5):1595-
600.
143. Suki B, Petak F, Adamicza A, Daroczy B, Lutchen KR, et al. Airway and tissue
constrictions are greater in closed than in open-chest conditions. Respir. Physiol
1997;108(2): 129-41.
144. Oostveen E, Zwart A, Peslin R, Duvivier C. Respiratory transfer impedance and
derived mechanical properties of conscious rats. J. Appl Physiol 1992;73(4): 1598-607.
145. Hessel E M , Zwart A, Oostveen E, Van Oosterhout AJ, Blyth D L et al. Repeated
measurement of respiratory function and bronchoconstriction in unanesthetized mice. J.
Appl. Physiol 1995;79(5):1711-6.
146. Nagase T, Moretto A, Dallaire MJ, Eidelman D H , Martin JG, et al. Airway and
tissue responses to antigen challenge in sensitized brown Norway rats. Am. J. Resp. Crit.
Care. Med. 1994;150(l):218-26.
147. Diamond L, CDonnell M . Pulmonary mechanics in normal rats. J. Appl. Physiol.
1977;43:942-8.
148. Barnas G M , Watson RJ, Green M D , Sequeira AJ, Gilbert TB, et al Lung and chest
wall mechanical properties before and after cardiac surgery with cardiopulmonary bypass.
J. Appl. Physiol 1994;76(1): 166-75.
149. Hall GL, Petak F, McMenamin C, Sly PD. The route of antigen delivery determines
the airway and lung tissue mechanical responses in allergic rats. Clin Exp Allergy.
1999;29(4):562-8.
150. Navajas D, Farre R, Canet J, Rotger M , Sanchis J. Respiratory input impedance in
anesthetized paralyzed patients. J. Appl Physiol. 1990;69(4): 1372-9.
151. Stocks J, Godfrey S. Nasal resistance during infancy. Respir. Physiol.
1978;34(2):233-46.
152. Polgar G, Kong GP. The nasal resistance of newborn infants. J Pediatr. 1965;67
(4):557-67.
153. Canbay EI, Bhatia SN. A Comparison of Nasal Resistance in White Caucasians and
Blacks. American Journal ofRhinology. 1997; 11 (1): 73 -5.
154. Saito A, Nishihata S. Nasal airway resistance in children. Rhinology.

163
1981; 19(3): 149-54.
155. Tawfik B, Sullivan KJ, Chang HK. A new method to measure nasal impedance in
spontaneously breathing adults. J. Appl. Physiol 1991;71(1):9-15.
156. Lacourt G, Polgar G. Interaction between nasal and pulmonary resistance in
newborn infants. J. Appl Physiol. 1971;30(6):870-3.
157. Hantos Z, Daroczy B, Gyurkovits K. Total respiratory impedance in healthy
children. Pediatr. Pulmonol 1985;l(2):91-8.
158. Lanteri CJ, Kano S, Duncan A W , Sly PD. Changes in respiratory mechanics in
children undergoing cardiopulmonary bypass. Am. J. Resp. Crit. Care. Med. 1995; 152(6
Pt 1): 1893-900.
159. Barnas G M , Sprung J, Craft T M , Williams JE, Ryder IG, et al. Effect of lung
volume on lung resistance and elastance in awake subjects measured during sinusoidal
forcing [see comments]. Anesthesiology. 1993;78(6): 1082-90.
160. Barnas G M , Gilbert TB, Watson RJ, Sequeira AJ, Roitman K, et al Respiratory
mechanics in the open chest: effects of parietal pleurae. Respir. Physiol. 1996;104(l):63-70.
161. Sharp JT, Druz W S , R.C. B, Bandelin VR, Danon J. Total respiratory system
compliance in infants and children. J. Appl Physiol 1970;29:775-9.
162. Szucs E, Kaufman L, Clement PAR. Nasal Resistance - a Reliable Assessment of
Nasal Patency. Clinical Otolaryngology. 1995;20(5):390-5.
163. Lorino A M , Lofaso F, Drogou I, Abinader F, Dahan E, et al Effects of Different
Mechanical Treatments O n Nasal Resistance Assessed By Rhinometry. Chest.
1998;114(l):166-70.
164. Lorino A M , Lofaso F, Abinader F, Drogou I, Dahan E, et al. Nasal Airflow
Resistance Measurement - Forced Oscillation Technique Versus Posterior
Rhinomanometry. Eur. Respir. J. 1998;11(3):720-5.
165. Fullton JM, Drake AF, Fischer N D , Bromberg PA. Frequency dependence of
effective nasal resistance. Annals of Otology, Rhinology & Laryngology. 1984;93(2 Pt
1): 140-5.
166. Sullivan KJ, Chang H K . Flow dynamics of the nasal passage. In: Farrell-Epstein
M A , Ligas JR, eds. Respiratory Biomechanics. N e w York: Springer-Verlag, 1990.
167. Stocks J. Effect of nasogastric tubes on nasal resistance during infancy. Arch. Dis.
Child. 1980;55(1): 17-21.
168. Rode A, Shephard RJ. The ageing of lung function: cross-sectional and longitudinal

164
studies of an Inuit community. Eur. Respir. J. 1994;7(9): 1653-9.
169. Sherrill DL, Lebowitz M D , Knudson RJ, Burrows B. Continuous longitudinal
regression equations for pulmonary function measures. Eur. Respir. J. 1992;5(4):452-62.
170. Tepper RS, Steffan M. Airway responsiveness in infants: comparison of inhaled and
nasally instilled methacholine. Pediatr. Pulmonol 1993;16(l):54-8.
171. Tepper RS, Montgomery GL, Ackerman V, Eigen H. Longitudinal evaluation of
pulmonary function in infants and very young children with cystic fibrosis. Pediatr.
Pulmonol. 1993;16(2):96-100.
172. Lutchen KR, Jackson AC. Effects of tidal volume and methacholine on low-
frequency total respiratory impedance in dogs. J. Appl Physiol 1990;68(5):2128-38.
173. Marchal F, Crance JP. Measurement of ventilatory system compliance in infants and
young children. Respir. Physiol 1987;68(3):311-8.
174. Young S, Le Souef PN, Geelhoed GC, Stick SM, Turner KJ, et al The influence
of a family history of asthma and parental smoking on airway responsiveness in early infancy
[published erratum appears in N Engl J M e d 1991 Sep 5 ;3 25(10): 747]. N. Engl J. Med
1991;324(17): 1168-73.
175. Martinez FD, Wright AL, Taussig L M , Holberg CJ, Halonen M, et al Asthma and
wheezing in the first six years of life. The Group Health Medical Associates [see
comments]. N. Engl J. Med 1995;332(3): 133-8.
176. Mead J. Dysanapsis in normal lungs assessed by the relationship between maximal
flow, static recoil, and vital capacity. Am. Rev. Respir. Dis. 1980;121(2):339-42.
177. Hibbert M E , Hudson JJL, Lanigan A, Landau LI, Phelan PD. Tracking of lung
function in healthy children and adolescents. Pediatr. Pulmonol. 1990;8(3): 172-7.
178. Stick SM, Arnott J, Turner DJ, Young S, Landau LL et al Bronchial
responsiveness and lung function in recurrently wheezy infants. Am. Rev. Respir. Dis.
1991;144(5):1012-5.
179. Tager IB, Hanrahan JP, Tosteson TD, Castile RG, Brown R W , et al Lung function,
pre- and post-natal smoke exposure, and wheezing in the first year of life. Am. Rev. Respir.
Dis. 1993;147(4):811-7.
180. Dezateux C, Stocks J, Dundas I, Fletcher M E . Impaired airway function and
wheezing in infants. Am. J. Resp. Crit. Care Med. 1999;159:403-10.
181. Dundas I, Dezateux CA, Fletcher M E , Jackson EA, Stocks J. Comparison of
single-breath and plethysmographic measurements of resistance in infancy. Am. J. Resp.

165
Crit. Care. Med. 1995;151(5):1451-8.
182. Marchal F, Peslin R, Duvivier C, Gallina C, Crance JP. Mechanics of the ventilatory
system in sedated infants: forced oscillations versus single-breath method. Pediatr.
Pulmonol 1988;5(1): 19-26.
183. Gutkowski P. Airway responsiveness following wheezy bronchitis in infants. Eur.
Respir. J. 1990;3(7):807-11.
184. Stocks J, Godfrey S. Specific airway conductance in relation to postconceptional
age during infancy. J Appl Physiol: Respir. Environ. Exercise Physiology. 1977;43(1):144-
54.
185. Tepper R, Sly P. Physiological outcomes. Eur Respir J. 1996;21:12s-5s.
186. Hyatt RE. Forced Expiration. In: Macklem PT, Mead J, eds. Handbook of
Physiology. The Respiratory System. Mechanics of Breathing. Bethesda, MD.: American
Physiological Society, 1986; 295-314.
187. Hoppin J, F.G. Parenchymal mechanics and asthma. Chest. 1995;107(3 Suppl): 140s-
4s.
188. Officer T M , Pellegrino R, Brusasco V, Rodarte JR. Measurement of pulmonary
resistance and dynamic compliance with airway obstruction. J. Appl. Physiol.
1998;85(5): 1982-8.
189. Finucane KE, Colebatch HJH. Elastic behaviour of the lung in patients with airway
obstruction. J. Appl Physiol 1969;26:330-8.
190. Kraft M , Djukanovic R, Wilson S, Holgate ST, Martin RJ. Alveolar tissue
inflammation in asthma. Am. J. Resp. Crit. Care. Med. 1996;154(5): 1505-10.
191. Ackerman V, Montogomery G, Eigen H, Tepper RS. Assessment of airway
responsiveness in infants with cystic fibrosis. Am. Rev. Respir. Dis. 1991;144(2):344-6.
192. Clarke JR, Salmon B, Silverman M . Bronchial responsiveness in the neonatal period
as a risk factor for wheezing in infancy. Am. J. Resp. Crit. Care. Med. 1995; 151(5): 1434-
40.
193. Motoyama EK, Fort M D , Klesh K W , Mutich RL, Guthrie RD. Early onset of
airway reactivity in premature infants with bronchopulmonary dysplasia. Am. Rev. Respir.
Dis. 1987;136(l):50-7.
194. Nagase T, Martin JG, Ludwig M S . Comparative study of mechanical
interdependence: effect of lung volume on R a w during induced constriction. J. Appl.
Physiol 1993;75(6):2500-5.

166
195. Ludwig M S , Romero PV, Bates JH. A comparison of the dose-response behavior
of canine airways and parenchyma. J. Appl Physiol 1989;67(3): 1220-5.
196. Ludwig M S , Dreshaj I, Solway J, Munoz A, Ingram R H , Jr. Partitioning of
pulmonary resistance during constriction in the dog: effects of volume history. J. Appl
Physiol 1987;62(2):807-15.
197. Desager K N , Van Bever HP, Willemen M , D e Backer W , Vermeire PA. Functional
residual capacity and total respiratory system impedance in wheezing infants. Pediatr.
Pulmonol 1994;17(6):354-8.
198. Yanai M , Sekizawa K, Ohrui T, Sasaki H, Taldshima T. Site of airway obstruction
in pulmonary disease: direct measurement of intrabronchial pressure. J. Appl Physiol
1992;72(3): 1016-23.
199. Ohrui T, Sekizawa K, Yanai M , Morikawa M , Jin Y, et al. Partitioning of
pulmonary responses to inhaled methacholine in subjects with asymptomatic asthma. Am.
Rev. Respir. Dis. 1992;146:1501-5.
200. Kaczka D W , Ingenito EP, Suki B, Lutchen KR. Partitioning airway and lung tissue
resistances in humans: effects of bronchoconstriction. J. Appl Physiol 1997;82(5):1531-
41.
201. Fredberg JJ, Bunk D, Ingenito E, Shore SA. Tissue resistance and the contractile
state of lung parenchyma. J. Appl Physiol 1993;74(3): 1387-97.
202. Salerno FG, Moretto A, Dallaire M , Ludwig M S . H o w mode of stimulus affects
the ralative contribution of elastance and hysteresivity to changes in lung tissue resistance.
J. Appl. Physiol 1995;78(l):282-7.
203. Brusasco V, Crimi E, Barisione G, Spanevello A, Rodarte JR, et al. Airway
responsiveness to methacholine: effects of deep inhalations and airway inflammation. Am.
J. Resp. Crit. Care Med 1999;87(2):567-73.
204. Pellegrino R, Violante B, Brusasco V. Maximal bronchoconstriction in humans.
Relationship to deep inhalation and airway sensitivity. Am. J. Resp. Crit. Care. Med.
1996; 153(1): 115-21.
205. Turner DJ, Sly PD, LeSouef PN. Assessment of forced expiratory volume-time
parameters in detecting histamine-induced bronchoconstriction in wheezy infants. Pediatr.
Pulmonol. 1993; 15(4):220-4.
206. Van de Woestijne KP, Desager K N , Duiverman EJ, Marchal F. Recommendations
for the measurement of respiratory input impedance by means of the forced oscillation

167
technique. European Respiratory Review. 1994;4(19):235-7.
207. Petak F, Hantos Z, Adamicza A, Daroczy B. Partitioning of pulmonary impedance:
modeling vs. alveolar capsule approach. J. Appl Physiol. 1993;75(2):513-21.
208. Barnas G M , Yoshino K, Loring SH, Mead J. Impedance and relative displacements
of relaxed chest wall up to 4 Hz. J. Appl. Physiol. 1987;62(1):71-81.
209. Preuss JMH, Hall GL, P.D. S. Repeat Measurements of respiratory mechanics
using the Forced Oscillation Technique in non-paralysed rats. Pulmonary Pharmacology
and Therapeutics. 1999;12:173-83.