Estimation of the Environmental Flow Regime to Deter- mine ...
10
Palestine Technical University Research Journal, 0202, 8(1), 14-23 (http://www.ptuk.edu.ps) Copyright ©0202 PTUK. PTUKRJ 14 Estimation of the Environmental Flow Regime to Deter- mine the Minimum Flow for Pollution Reduction: Wadi Zomar - Palestine as a Case Study Dr. Saed Khayat, College of Agricultural Sciences and Technology, Palestine Technical University, Ka- doorie-Tulkarm, Palestine [email protected] Received: 29/8/2019, Accepted: 14/10/2019, Published: 20/2/2020 Abstract: Possible factors that play a role in restoring a flow regime that supports a healthy environment were identified for Wadi Zomar, Palestine. The hydrograph shows that threshold discharges for bed drying are less than 0.14 m 3 /s, bar formation is less than 0.4 ms/s and floodplain inundation events are over 3 m 3 /s. The HEC-RAS model suggests a continuous discharge throughout the year that maintains the base flow in the range of 0.5 m 3 /s. The model suggests that the restoration process is controlled by two main factors: role of sufficient flow and flood inundation frequency Keywords: Flow Regime; Wadi Zomar - Palestine; Fecal Coliform; Restoration 1. INTRODUCTION Anthropogenic water pollution (causes serious health problems and an increase in economic costs arising from water treatment, remediation, and water supply relocation (Gasana, et al., 2002). In most cases, restoration of polluted water bodies is a ne- cessity with positive ecological impacts on the landscape, contributions to leisure, quality of life, and tourism (Bar-Or, 2000). Recovery of the envi- ronmental and social functions of polluted water bodies, as in the case of Zomar Stream, has taken an increasingly important place on the Palestinian public agenda. Environmental flows regime haves been increasingly recognized as a central issue in sustainable water resource management (Kashaigili et al., 2007; OP- TIMA, 2007). Low flows, coupled with degradation of water quality, have induced severe environmental degradation, rendering water unusable downstream. Environmental Flow Requirements (EFR) for water resource allocation necessitate that a certain amount of water be purposefully left in or released into an aquatic ecosystem to maintain a condition that will support its direct and indirect use values ( King et al., 2003). Maintenance of EFR has also become a high priority for stream basin management all over the world (Barnett et al., 2006). This ap- proach determines how much of the original stream flow should be sustained to keep the stream eco- system healthy. Moreover, understanding the dy- namics of stream-dependent ecosystems is crucial to restoring efficiency and effectiveness (Puckridge et al., 1998; Pettit et al., 2001) and managing con- centration, growth rate, and transport of microor- ganisms (Schaffter and Parriaux, 2002; Collins and Rutherford, 2004). Process-based hydrological modeling tools will be used in this research based on the principles of conservation destruction, and development. They can be used to simulate these processes for species that are considered indicators of a balanced water- shed (Bauffaut and Benson, 2003; Coffey et al. 2007). Bacterial indicators are usually composed of Coliform bacteria, E. coli, Klebsiella, Pseudomonas, and Enterococci (Townsend, 1992; USEPA, 2001). Relations between bacteria and pathogens in fecal contaminated surface water are complex and varia- ble (Yates, 2007; Payment et al., 2003). The optimal situation is where the modeling tool simulates a state
Transcript of Estimation of the Environmental Flow Regime to Deter- mine ...
Palestine Technical University Research Journal, 0202, 8(1), 14-23
(http://www.ptuk.edu.ps)
Copyright ©0202 PTUK. PTUKRJ 14
Estimation of the Environmental Flow Regime to Deter-mine the Minimum Flow for Pollution Reduction: Wadi Zomar - Palestine as a Case Study
Dr. Saed Khayat, College of Agricultural Sciences and Technology, Palestine Technical University, Ka-
doorie-Tulkarm, Palestine
Received: 29/8/2019, Accepted: 14/10/2019, Published: 20/2/2020
Abstract: Possible factors that play a role in restoring a flow regime that supports a healthy environment were identified for Wadi Zomar, Palestine. The hydrograph shows that threshold discharges for bed drying are less than 0.14 m3/s, bar formation is less than 0.4 ms/s and floodplain inundation events are over 3 m3/s. The HEC-RAS model suggests a continuous discharge throughout the year that maintains the base flow in the range of 0.5 m3/s. The model suggests that the restoration process is controlled by two main factors: role of sufficient flow and flood inundation frequency
Keywords: Flow Regime; Wadi Zomar - Palestine; Fecal Coliform; Restoration
1. INTRODUCTION
Anthropogenic water pollution (causes serious
health problems and an increase in economic costs
arising from water treatment, remediation, and water
supply relocation (Gasana, et al., 2002). In most
cases, restoration of polluted water bodies is a ne-
cessity with positive ecological impacts on the
landscape, contributions to leisure, quality of life,
and tourism (Bar-Or, 2000). Recovery of the envi-
ronmental and social functions of polluted water
bodies, as in the case of Zomar Stream, has taken
an increasingly important place on the Palestinian
public agenda.
Environmental flows regime haves been increasingly
recognized as a central issue in sustainable water
resource management (Kashaigili et al., 2007; OP-
TIMA, 2007). Low flows, coupled with degradation of
water quality, have induced severe environmental
degradation, rendering water unusable downstream.
Environmental Flow Requirements (EFR) for water
resource allocation necessitate that a certain
amount of water be purposefully left in or released
into an aquatic ecosystem to maintain a condition
that will support its direct and indirect use values (
King et al., 2003). Maintenance of EFR has also
become a high priority for stream basin management
all over the world (Barnett et al., 2006). This ap-
proach determines how much of the original stream
flow should be sustained to keep the stream eco-
system healthy. Moreover, understanding the dy-
namics of stream-dependent ecosystems is crucial
to restoring efficiency and effectiveness (Puckridge
et al., 1998; Pettit et al., 2001) and managing con-
centration, growth rate, and transport of microor-
ganisms (Schaffter and Parriaux, 2002; Collins and
Rutherford, 2004).
Process-based hydrological modeling tools will be
used in this research based on the principles of
conservation destruction, and development. They
can be used to simulate these processes for species
that are considered indicators of a balanced water-
shed (Bauffaut and Benson, 2003; Coffey et al.
2007). Bacterial indicators are usually composed of
Coliform bacteria, E. coli, Klebsiella, Pseudomonas,
and Enterococci (Townsend, 1992; USEPA, 2001).
Relations between bacteria and pathogens in fecal
contaminated surface water are complex and varia-
ble (Yates, 2007; Payment et al., 2003). The optimal
situation is where the modeling tool simulates a state

Estimation of the Environmental Flow Regime to Determine the Minimum Flow for Pollution Reduction: Wadi Zomar - Palestine as a Case Study
Copyright © 0202 PTUK. PTUKRJ
15
of balance for the whole system, including the sur-
rounded environment. The computer modeling tool
shows optimal hydrological condition with minimum
flow necessary to maintain non-hazardous bacterial
growth and gives decision support about the best
restoration practices (Abu-Khalaft et al., 2003).
In this study, a tool for analyzing the EFR of a case
study area (Zomar Stream) was developed. The tool
incorporates several methods of assessing hydro-
logical and hydro-biological responses to flow
change and identifies hydrometric factors controlling
the stream and its impacts on the system’s health.
The tool was used to suggest optimal flow conditions
for a healthy system.
2. STUDY AREA
Zomar Stream, as it is known in Palestine, or Alex-
ander, as it is known in Israel, has a total length of 44
km, 17 of which are naturally perennial (Fig. 1). The
western segment of the stream reaches the Medi-
terranean Sea and is relatively wide, holding water
year-round. The basin shows the effects of fifty years
of continuous contamination, associated with the
accelerated development and increase in the sew-
age discharges from the Palestinian cities of Nablus
and Tulkarem as well as several settlements, most
notably the city of Netanya. The quantity of the
effluents discharged into the stream is estimated as
3 MCM/year. The study area has a semi-arid east
Mediterranean climate with annual rainfall of
400-600 mm/year and high evaporation rates that
reach 100 mm/year (OPTIMA, 2007). The effects of
climatic variability and climate change on humans as
well as aquatic resources have played a major role in
the West Bank water crisis. For more than a decade,
it has been recognized that strong links exist be-
tween ecological processes and hydraulic, hydro-
logical, thermal, and sediment logical variables of
the stream and that dynamic flow patterns main-
tained within the natural range of variation will pro-
mote integrity and sustainability of freshwater eco-
systems (Carvajal-Escobar, 2008).
Figure 1. Location of the case study area:
Zomar watershed.
3. MATERIAL AND METHODS
The new combined approach has four main steps. 1. Collecting fecal coliform bacteria samples
and measuring parallel hydrometric condi-tions: Hydrologic and hydrochemical sam-pling and analysis were conducted by Su-liman (2010). Samples were analyzed for various indicators and enteric pathogens by membrane filter technique. Fecal coliform bacteria were used to study the biological response, mainly bacterial removal, to the flow event. Observation and sampling points were taken from the upper part of the main stream near Deir Sharaf and from an ob-servation point near Tulkarem. Stream ve-locity was measured by using a propeller to calculate the amount of discharge at each section. Three sampling locations for the assessment of Zomar Stream were selected based on their characteristics and the sur-rounding pollution sources. Deir Sharaf was selected as the first point that receives a high load of sewage and industrial waste. This sampling point shows a significant ef-fect of continuous waste effluent on natural restoration abilities of the stream with time and distance. The other point near Anabta where less pollution input indicated were selected. It locates further to the west of Deir Sharaf. The third sampling point was se-lected to the west of Tulkarem, near the Separation Wall, where the Palestinian part

Estimation of the Environmental Flow Regime to Determine the Minimum Flow for Pollution Reduction: Wadi Zomar - Palestine as a Case Study
Copyright © 0202 PTUK. PTUKRJ
16
of the stream ends. Cross-sections at each sampling point location were created and measured values were inserted into the surface water model.
2. Studying three hydrometric factors (i.e., flood inundation frequency along hydrologic year, bed exposure in dry periods, and bar formation) that control flow regime and dis-play their effect on the whole system throughout a number of years. The integra-tion of those three factors enhancing the presence of unhealthy conditions and in-crease bacterial and pathogen growth along the stream. Ideally, at least five years of flow events should be traced. However, due to a lack of historical data, these data arethe only source that can reflect the hydrological sit-uation in the stream. The incidence of the mentioned hydrometric factors throughout the years was displayed in cross-sections and along the stream using the HEC-RAS model. HEC-RAS is a computer program that models hydraulics of water flow through natural rivers and other channels. The pro-gram is one-dimensional in that there is no direct modeling of the hydraulic effect of cross-section shape changes, bends, and other two- and three-dimensional aspects of flow (U.S. Army Corps of Engineers, 2001).
3. Modeling a yearly flow regime scenario based on a proposed minimum threshold flow that would overcome the negative flow regime factors mentioned above: In order to display the effect of additional base flow on flow regime factors, we followed the fol-lowing steps:
a) Generate stream boundary conditions by modeling the last hydrological year 2009/2010 using a HEC-HMS hydro-graph. The HEC-HM simulates the pre-cipitation-runoff processes of drainage basins (U.S. Army Corps of Engineers, 2005).
b) The resulting time series flow data, which depend on actual stream base flow, were compared with measured values along the stream for model cali-bration.
c) Depending on the calibrated model, 4 minimum discharge values were trialed as scenarios of increasing the recharge gradually above the threshold dis-charges for bed drying. A new hydro-graph was produced and incorporated into the HEC-RAS model for the same normal model period and flood condi-tions. Scenario figures and cross sec-tions were compared.
The WMS-Watershed modeling system was used as a moderator program for the HEC-RAS/HMS pro-grams. Surface geometry with computed slope curves and cross sections were prepared and ex-ported to other modeling programs. Meteorological parameters such as daily rain event average volume for the period between September 1st, 2009 and August 31 st, 2010, estimated water losses, and SC-Curves were included in the model. Base flows for Zomar Stream were also set in the HEC-HMS program for computation and simulation of storm-flow hydrographs. 4. Determining critical water levels for flushing ponds and floodplain inundation by tracing the last extreme flow event and calculating the associated discharge: From this data, spatial and temporal effects of the event on fecal coliform were identified and an opti-mal condition for a healthy stream with minimum pathogens was determined. The natural ability of the stream to washout pollutants in response to different hydrological conditions was also tested. Fecal Coli-form count (FC) was modeled and used as a pollu-tant wash-out indicator and, consequently, as an indicator of the system’s ability to rejuvenate in the face of modified flow conditions. Resulting simula-tion graphs give an idea of optimal conditions. Lower counts of indicator bacteria are a result of dilution by flood water; these conditions are traced spatially and temporally. For this purpose, HEC-RAS was used. In other habitat model studies, minimum flow is one of the major environmental impacts caused by low hydrological input throughout the year. These stud-ies concentrated on the negative relationship be-tween low flow conditions and habitat availability (which is one of several criteria for the development of ecologically-oriented flow regulations). In this study, Zomar Stream is not self-sustaining and re-ceives rain water seasonally. While there is a con-tinuous discharge of wastewater all year, fecal coli-form bacteria are a negative indicator with its re-moval being a gauge for restoration toward a healthy environment. Available hydrological and hydrobiological data were incorporated into the HEC-RAS model to display

Estimation of the Environmental Flow Regime to Determine the Minimum Flow for Pollution Reduction: Wadi Zomar - Palestine as a Case Study
Copyright © 0202 PTUK. PTUKRJ
17
removal and re-growth of bacterial colonies in re-sponse to various flow conditions. FC was integrated into the flow model. The system’s ability to remove fecal coliform bacteria with flood flush and to in-
crease stream oxygen content by flushing out pol-lutants was displayed using HEC-RAS.
* units are in mg/l.,FC,TC units are cfu/100ml,Q
(m3/sec),Pw(m),EC(µS/cm),Sa(%0) Temp.(˚C)
Figure 2. Digital Elevation model with de-
lineated stream and points of cross sections,
with more focus on the three sampling
points.
Suleiman (2010) used the same cross-sections from sampling points 15920 near Deir Sharaf, 9792 near Anabta, and 961 west of Tulkarem near the end of the stream (Fig2). The Deir Sharaf cross section was taken as an additional wastewater flow boundary with high bacterial concentration and high BOD, Anabta was a goodself-purification point (Suleiman, 2010), and Tulkarem was the accumulation point of all contributions. Data were obtained from observa-tion measurements as described above. Data series tables for flow in m3/s and FC counts were prepared according to periodic measurements by Suleiman (2010) (Table1). The recent extreme flow event on February 22nd, 2010 was redrawn using the HEC-HMS model program.
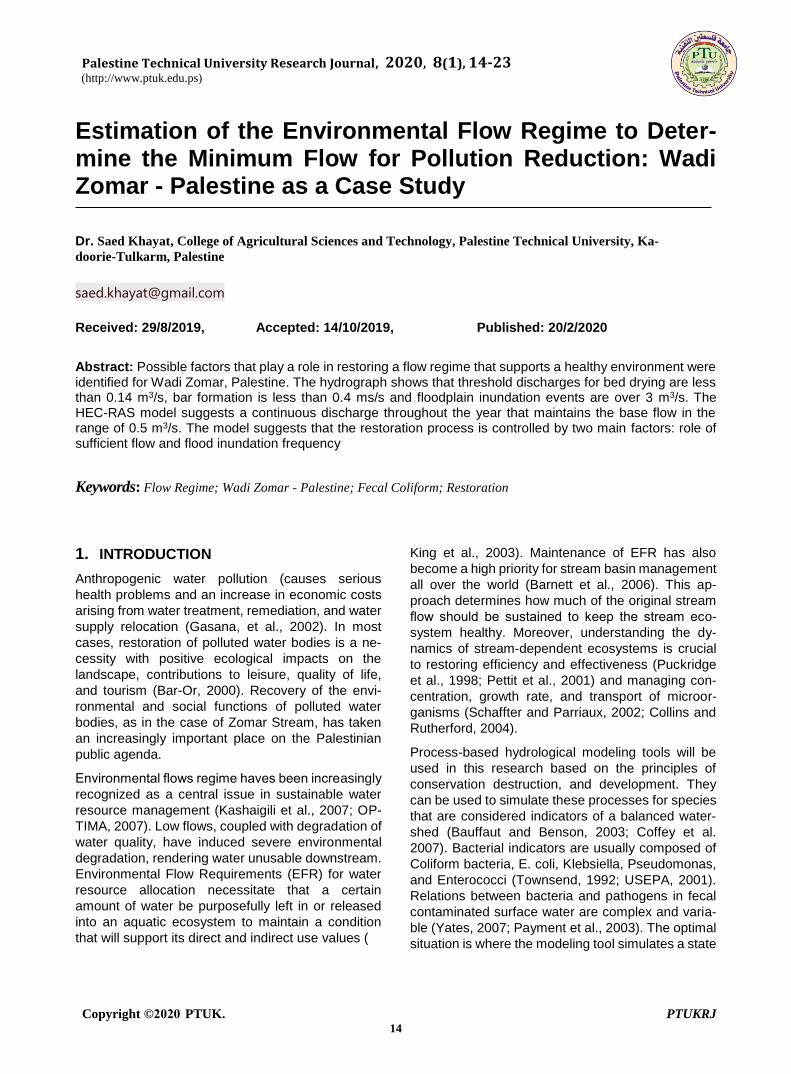
Table 1: The main physical, chemical and common flora for samples from sampling
locations at different times during the hydrological year 2009/2010 (Suleiman, 2011)
Estimation of the Environmental Flow Regime to Determine the Minimum Flow for Pollution Reduction: Wadi Zomar - Palestine as a Case Study
Copyright © 0202 PTUK. PTUKRJ
18
4. SIMULATION RESULTS AND DISCUS-SION
4.1 Flow event analysis
Three current processes in Zomar Stream were considered to assess the effects of flow events on the surrounding environment:
1. The absence of sufficient quality discharge leads to low water surface extension. In this process, large thin wet areas that support the formation of bacterial and pathogen film de-velop near both banks of the channel (Knebel et al., 2005), Moreover, the presence of high amounts of nutrients (mainly phosphorous and nitrogen in organic and inorganic forms) en-hances bacterial enrichment during summer months.
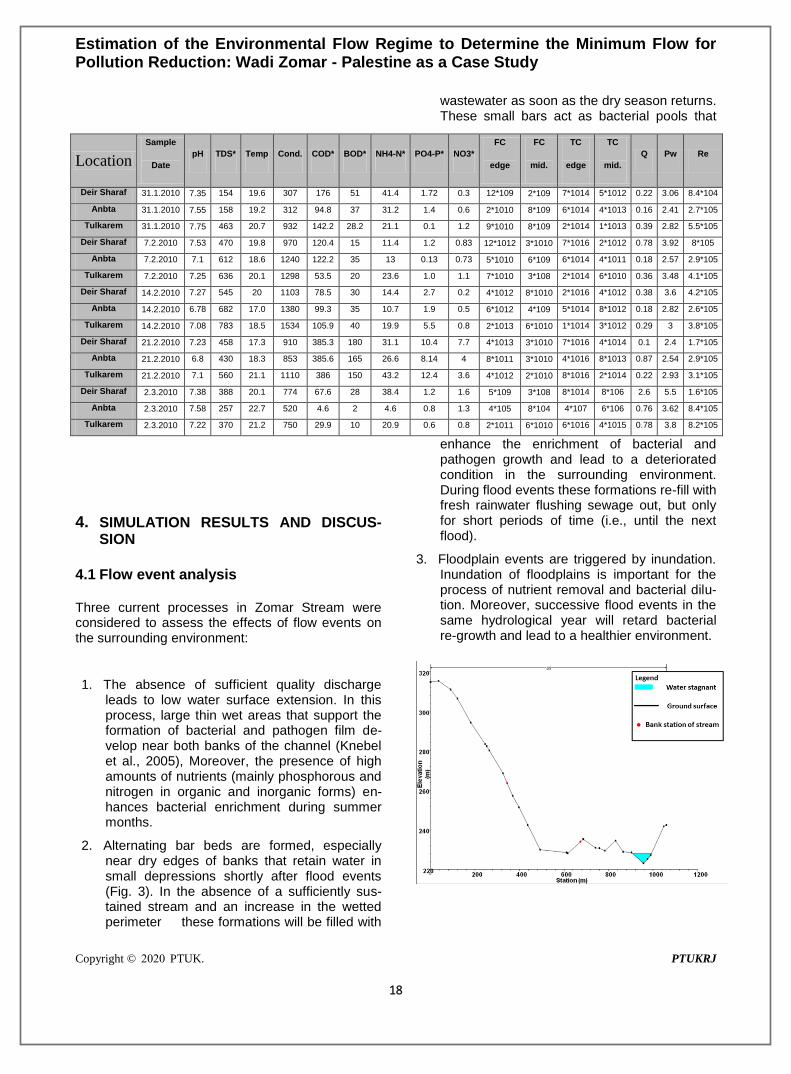
2. Alternating bar beds are formed, especially near dry edges of banks that retain water in small depressions shortly after flood events (Fig. 3). In the absence of a sufficiently sus-tained stream and an increase in the wetted perimeter these formations will be filled with
wastewater as soon as the dry season returns. These small bars act as bacterial pools that
enhance the enrichment of bacterial and pathogen growth and lead to a deteriorated condition in the surrounding environment. During flood events these formations re-fill with fresh rainwater flushing sewage out, but only for short periods of time (i.e., until the next flood).
3. Floodplain events are triggered by inundation. Inundation of floodplains is important for the process of nutrient removal and bacterial dilu-tion. Moreover, successive flood events in the same hydrological year will retard bacterial re-growth and lead to a healthier environment.
Location
Sample
Date
pH TDS* Temp Cond. COD* BOD* NH4-N* PO4-P* NO3*
FC
edge
FC
mid.
TC
edge
TC
mid.
Q Pw Re
Deir Sharaf 31.1.2010 7.35 154 19.6 307 176 51 41.4 1.72 0.3 12*109 2*109 7*1014 5*1012 0.22 3.06 8.4*104
Anbta 31.1.2010 7.55 158 19.2 312 94.8 37 31.2 1.4 0.6 2*1010 8*109 6*1014 4*1013 0.16 2.41 2.7*105
Tulkarem 31.1.2010 7.75 463 20.7 932 142.2 28.2 21.1 0.1 1.2 9*1010 8*109 2*1014 1*1013 0.39 2.82 5.5*105
Deir Sharaf 7.2.2010 7.53 470 19.8 970 120.4 15 11.4 1.2 0.83 12*1012 3*1010 7*1016 2*1012 0.78 3.92 8*105
Anbta 7.2.2010 7.1 612 18.6 1240 122.2 35 13 0.13 0.73 5*1010 6*109 6*1014 4*1011 0.18 2.57 2.9*105
Tulkarem 7.2.2010 7.25 636 20.1 1298 53.5 20 23.6 1.0 1.1 7*1010 3*108 2*1014 6*1010 0.36 3.48 4.1*105
Deir Sharaf 14.2.2010 7.27 545 20 1103 78.5 30 14.4 2.7 0.2 4*1012 8*1010 2*1016 4*1012 0.38 3.6 4.2*105
Anbta 14.2.2010 6.78 682 17.0 1380 99.3 35 10.7 1.9 0.5 6*1012 4*109 5*1014 8*1012 0.18 2.82 2.6*105
Tulkarem 14.2.2010 7.08 783 18.5 1534 105.9 40 19.9 5.5 0.8 2*1013 6*1010 1*1014 3*1012 0.29 3 3.8*105
Deir Sharaf 21.2.2010 7.23 458 17.3 910 385.3 180 31.1 10.4 7.7 4*1013 3*1010 7*1016 4*1014 0.1 2.4 1.7*105
Anbta 21.2.2010 6.8 430 18.3 853 385.6 165 26.6 8.14 4 8*1011 3*1010 4*1016 8*1013 0.87 2.54 2.9*105
Tulkarem 21.2.2010 7.1 560 21.1 1110 386 150 43.2 12.4 3.6 4*1012 2*1010 8*1016 2*1014 0.22 2.93 3.1*105
Deir Sharaf 2.3.2010 7.38 388 20.1 774 67.6 28 38.4 1.2 1.6 5*109 3*108 8*1014 8*106 2.6 5.5 1.6*105
Anbta 2.3.2010 7.58 257 22.7 520 4.6 2 4.6 0.8 1.3 4*105 8*104 4*107 6*106 0.76 3.62 8.4*105
Tulkarem 2.3.2010 7.22 370 21.2 750 29.9 10 20.9 0.6 0.8 2*1011 6*1010 6*1016 4*1015 0.78 3.8 8.2*105
Estimation of the Environmental Flow Regime to Determine the Minimum Flow for Pollution Reduction: Wadi Zomar - Palestine as a Case Study
Copyright © 0202 PTUK. PTUKRJ
19
Figure 3. Cross section 15920 near Deir
Sharaf, Nablus that shows the formations
that retained some flood water for a long pe-
riod.
4.2 Hydrological status during 2008 to 2010
The daily flow events for hydrological years 2008/2009 and 2009/2010 are displayed in Figure 4. The average wetted perimeter is calculated from the model output. The Nash–Sutcliffe efficiency in-dex (Ef) was used to assess the goodness of fit of hydrologic models. The Ef results were varied between 0.54-0.83.
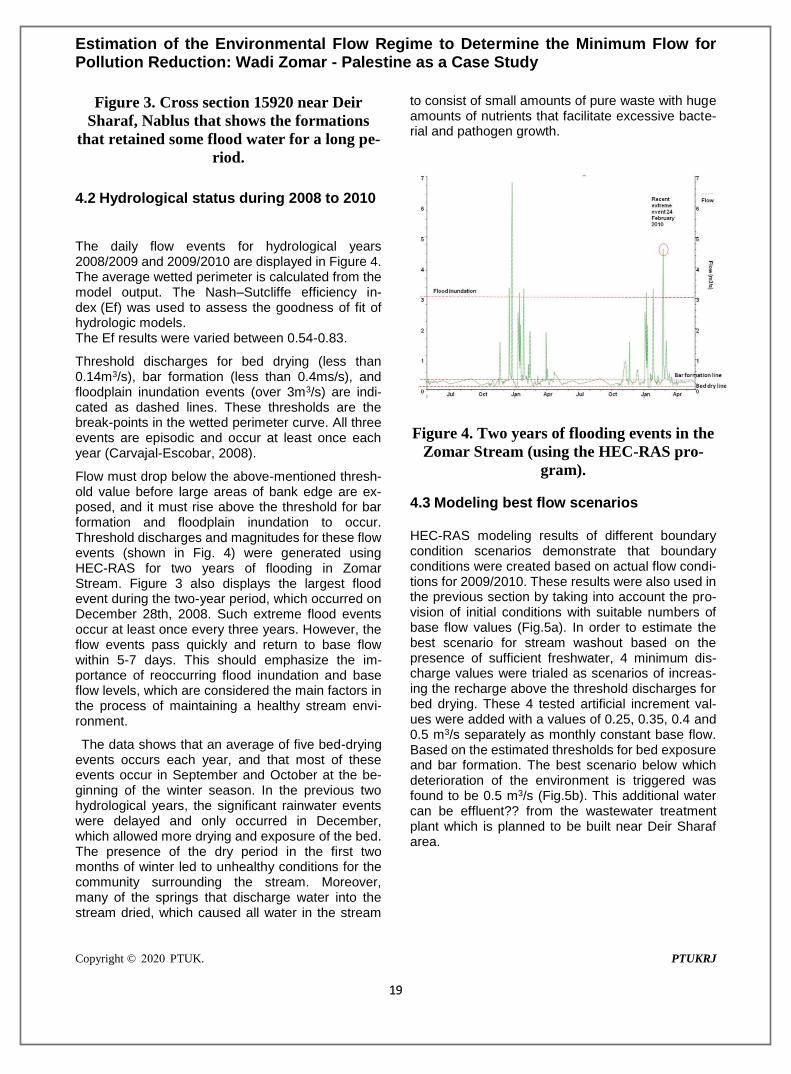
Threshold discharges for bed drying (less than 0.14m3/s), bar formation (less than 0.4ms/s), and floodplain inundation events (over 3m3/s) are indi-cated as dashed lines. These thresholds are the break-points in the wetted perimeter curve. All three events are episodic and occur at least once each year (Carvajal-Escobar, 2008).
Flow must drop below the above-mentioned thresh-old value before large areas of bank edge are ex-posed, and it must rise above the threshold for bar formation and floodplain inundation to occur. Threshold discharges and magnitudes for these flow events (shown in Fig. 4) were generated using HEC-RAS for two years of flooding in Zomar Stream. Figure 3 also displays the largest flood event during the two-year period, which occurred on December 28th, 2008. Such extreme flood events occur at least once every three years. However, the flow events pass quickly and return to base flow within 5-7 days. This should emphasize the im-portance of reoccurring flood inundation and base flow levels, which are considered the main factors in the process of maintaining a healthy stream envi-ronment.
The data shows that an average of five bed-drying events occurs each year, and that most of these events occur in September and October at the be-ginning of the winter season. In the previous two hydrological years, the significant rainwater events were delayed and only occurred in December, which allowed more drying and exposure of the bed. The presence of the dry period in the first two months of winter led to unhealthy conditions for the community surrounding the stream. Moreover, many of the springs that discharge water into the stream dried, which caused all water in the stream
to consist of small amounts of pure waste with huge amounts of nutrients that facilitate excessive bacte-rial and pathogen growth.
Figure 4. Two years of flooding events in the
Zomar Stream (using the HEC-RAS pro-
gram).
4.3 Modeling best flow scenarios
HEC-RAS modeling results of different boundary condition scenarios demonstrate that boundary conditions were created based on actual flow condi-tions for 2009/2010. These results were also used in the previous section by taking into account the pro-vision of initial conditions with suitable numbers of base flow values (Fig.5a). In order to estimate the best scenario for stream washout based on the presence of sufficient freshwater, 4 minimum dis-charge values were trialed as scenarios of increas-ing the recharge above the threshold discharges for bed drying. These 4 tested artificial increment val-ues were added with a values of 0.25, 0.35, 0.4 and 0.5 m3/s separately as monthly constant base flow. Based on the estimated thresholds for bed exposure and bar formation. The best scenario below which deterioration of the environment is triggered was found to be 0.5 m3/s (Fig.5b). This additional water can be effluent?? from the wastewater treatment plant which is planned to be built near Deir Sharaf area.

Estimation of the Environmental Flow Regime to Determine the Minimum Flow for Pollution Reduction: Wadi Zomar - Palestine as a Case Study
Copyright © 0202 PTUK. PTUKRJ
20
Figure 5 a&b. HEC-HMS one-year simula-
tion normal with a monthly constant base
flow (a), and additional base flow artificial of
0.5 m3/s from wastewater inlet (b).
Distribution of such treated water in proper base amounts can keep streams healthier. However, stream-wide distribution of treated water discharge is recommended. To keep surface levels constant many factors should be taken into account, such as channel width, slope, flow velocity, and channel bed formation. Evapotranspiration should be calculated carefully with additional amounts of water being added to deter loss and maintain required water levels. The two previous selected points, the cross-section in the upper stream and another one a short distance from the Deir Sharaf waste point, were used as discharge locations. Another four discharge points were assigned downstream of the reach. The additional amount of water needed to keep the minimum flow varied for the 0.8m3/s rate during summer months and the 0.65m3/s rate during winter months, the latter having lower evapotran-spiration. Both normal and calculated flood bounda-ries are integrated into the model where flow data output from calculated and calibrated values were used in HEC-RAS.
The new hydrograph with overestimated base flow shows values between 0.5m3/s in summer and early winter as a minimum flow below which the regime deteriorates (as explained above). It also shows 0.9 m3/s in winter, which is the peak value in response to storm events, which was increased simultane-ously (Fig. 5b). The new added water will retain a sufficient amount of water that can fill the stream and overcome the stagnant formations near edges even in summer time (Fig. 6).
Figure 6. Cross-section 15920 near Deir
Sharaf, showing a continuous filling of the
stream even in summer
4.4 Modeling bacterial removal with storm
water
The flow model was run for the same period as the bacterial growth measurements. Curves were compared to view hydrological effects on bacterial activity under different spatial conditions (Figs. 7 and 8). The outputs are displayed spatially and temporally. All FC counts were reduced drastically in response to the duration, intensity, and conse-quently the flow rate of the storm event. In Deir Sharaf, near the wastewater source, FC bacteria decreased slowly, and then show a frequent shock a short time after the flood peak (Fig. 7a and Fig. 8c). This shock in bacterial count is a rapidly steep re-duction. The bacterial count then becomes stable, which is due to time dependent variation of wastewater discharge from the nearby facilities.
The Anabta site (Fig. 7b) illustrates the time-dependent removal process where the location is far away from the pollution source near Deir Sharaf, thus allowing for a longer period of self- pu-rification. However, bacterial growth was re-enhanced slightly by the end of the storm.
The Tulkarem site shows the same trend, but with a slightly different mechanism. A bacterial increment shock was re-enhanced shortly after the flood be-gan, which was due to accumulation of washed bacterial colonies from the above stream points that were finally washed out with time (Fig. 8c). FC distribution at the beginning of the storm has a high concentration except in west Anabta, where the

Estimation of the Environmental Flow Regime to Determine the Minimum Flow for Pollution Reduction: Wadi Zomar - Palestine as a Case Study
Copyright © 0202 PTUK. PTUKRJ
21
potential for self-purification is the highest (Fig. 8a) (Knebel et al, 2004). Figure 8b shows spatial bacte-rial removal during peak discharge where most of the coliform count is reduced to the minimum under the flood wash. The bacterial accumulation near Tulkarem, by the end of the stream, is also shown in Figure 8c. By the peak of the recession, most bac-terial colonies are washed away except for the newly formed colonies that are transported by wastewater discharge near Deir Sharaf point (Figure 8c). The sequence and intermittency of peak flows greatly controls the incremental contamination and toxic algal bloom in stagnant ponds (i.e., longer in-terval between floods equals more toxicity, shorter interval equals frequent flushing and cleaning of the channel).
Figure 7. Temporal response of Fecal Col-
iform bacteria in the three cross-sections
along the Zomar Stream.
Figure 8. Temporal response of Fecal Coli-
form bacteria in the three cross sections
along Zomar Stream.
5. CONCLUSIONS In this study factors that complicate a risky flow re-gime and conditions that inhibit restoration of a healthy regime that supports habitation by the sur-rounding population, were identified. Three flow scenarios that complicate the problem were con-sidered: bed drying with less base flow in summer time (mostly waste flow), bar formation, and flood-plain inundation, which correspond to low, medium, and high flow events, respectively. The HEC-RAS model suggests a continuous discharge base flow in the range of 0.5m3/s throughout the year. This flow range is a sufficient minimum flow that prevents the first two flow scenarios from occurring and conse-quently creates a hazardous, unhealthy condition with excessive bacterial and pathogen growth, as well as a high pollution load. The model suggests that the restoration process is controlled by two main factors that depend on the presence of suffi-cient base flow. These are the role of sufficient flow in preventing a bacterially rich environment and the role of flood inundation frequency in keeping the system balanced by increasing the number of bac-teria and nutrients flushed out of the system. The suggested additional amount of base flow can be provided from the planned wastewater treatment plant near Deir Sharaf area. Sufficiently treated wastewater can be released along the stream to maintain a continuous flow that prevents accumula-tion of stagnant water and removes pathogens. In order to choose the best locations and amount of discharge to keep sufficient base flow, further im-provements of the model are needed. These im-provements should depend on practical experi-ments for artificial discharge. The amount of wastewater discharged into the stream must be treated sufficiently and re-discharged as part of the sufficient base flow. The improved model must identify treatment levels and discharge distribution locations that will guarantee an equal distribution for sufficient base flow throughout the stream.
6. RECOMMENDATIONS The technologies and management strategies are certainly available for solving the pollution problems of the study area. The primary obstacles to envi-ronmental progress in recent years have been economic and geopolitical. Without sufficient re-sources for sanitary infrastructure, pre-treatment of

Estimation of the Environmental Flow Regime to Determine the Minimum Flow for Pollution Reduction: Wadi Zomar - Palestine as a Case Study
Copyright © 0202 PTUK. PTUKRJ
22
industrial facilities and best management practices for nonpoint runoff, progress will remain elusive. Without coordinated efforts and real cooperation between Palestinians and Israelis, neither side will succeed in restoring its streams. For successful restoration of the Zomar stream, it will be important to engage the respective Ministries of Agriculture as partners. Establishing parks along the stream is an important stage in enlisting the public and transforming streams from a perceived hazard to an attractive recreational resource. Pollution levels contained in the base flows will prevent the attainment of any of the potential uses in transboundary streams. Wastewater treatment has been the focus of efforts to date. Yet, additional pollution sources, from the Palestinian olive oil and stone cutting industries --Israeli industrial zones, fish ponds and fruit juice plants will sabotage water quality progress unless they are systematically identified and abated. Enforcement efforts are now underway in Israel to address these pollution sources, but compliance remains inadequate. The Palestinian regulatory capacity has been consider-ably weakened in recent years and substantial in-stitutional strengthening will probably be required before results will be seen in improved pollution discharge levels. Facilitating Best Management Practices for nonpoint source controls requires a fundamentally different policy approach than does that involved in control-ling point sources. It is axiomatic in public policy that as the number of actors increases (e.g.??), the dif-ficulty of attaining compliance grows exponentially. Nonpoint source controls therefore constitute an enormous institutional and regulatory challenge.
7. REFERENCES
Abu-Khalaf, N., Khayat, S., & Natsheh, B. (2013). Multivariate data analysis to identify the groundwater pollution sources in Tulkarm area/Palestine. Science and Technology, 3(4), 99-104.
Barnett, J., Webber, M., Wang, M., Finlayson, B., Dickenson, D. (2006). Ten key questions about the management of water in the Yellow Stream Basin. Environ Manage. 38, 179–88.
Bar-Or, Y. (2000). Restoration of the streams in Israel’s Coastal Plain. Water Air Soil Poll. 123, 311–321.
Bauffaut, C., Benson, V.W. (2003). A bacteria TMDL for shoal creek using SWAT modeling and DNA source tracking, in: Saleh, A. (Ed.), Total Maximum Daily Load (TMDL) Environmental Regulations II, Conference Proceedings of the Total Maximum Daily Load Environmental Regulations II, Nov. 8-12, New Mexico, pp. 35-40.
Carvajal-Escobar, Y. (2008). Environmental flow regime in the framework of integrated water resources management strategy. Ecohydr. Hydrol. 8, 307-315.
Coffey, R., Cummins, E., Cormican, M., Flaherty, V.O., Kelly, S. (2007). Microbial exposure assessment of waterborne pathogens. Hum. Ecol. Risk Assess. 13, 1313-1351.
Collins, R., Rutherford, K. (2004). Modelling bacterial water quality in streams draining pastoral Land. Water Res. 38, 700-712.
Gasana, J., Morin, J., Ndikuyeze, A., Kamoso, P. (2002). Impact of water supply and sanitation on diarrhea morbidity among young children in the socio economic and cultural context of Rwanda (Africa). Environ. Res. 90, 76-88.

Estimation of the Environmental Flow Regime to Determine the Minimum Flow for Pollution Reduction: Wadi Zomar - Palestine as a Case Study
Copyright © 0202 PTUK. PTUKRJ
23
Kashaigili, J.J., Mccartney, M., Mahoo, H.F. (2007). Estimation of environmental flows in the Great Ruaha Stream Catchment, Tanzania. Phys. Chem. Earth. 32, 1007-10014.
King, J., Brown, C., Sabet, H. (2003). A scenario-based holistic approach to environmental flow assessments for streams. River Res. Appl., 19, 619-639.
Knebl, M.R., Yang, Z.L., Hutchison, k., Maidment, D.R. (2005). Regional scale flood modeling using NEXRAD rainfall, GIS, and HEC-HMS/RAS: a case study for the San Antonio River Basin Summer 2002 storm event. J Environ Manage. 75, 325–336.
OPTIMA (Optimization for Sustainable Water Resources Management, (2007). The Zomar stream, Ramallah, 43pp.
Payment, P., Waite, M., Dufour, A. (2003). Introducing parameters for the assessment of drinking water quality, in: Dufour, A. (Ed.), Assessing Microbial Safety of Drinking Water: Improving Approaches and Methods, WHO Drinking Water Quality Series, OECD–WHO, Paris, pp. 47–77.
Pettit, N.E., Friend, R.H., Davis, P.M. (2001). Identifying the natural flow regime and the relationship with riparian vegetation for two contrasting western Australian streams, Regulated Streams. Regulated Rivers Res. Manage. 17, 201-215.
Puckridge, J.T., Sheldon, F., Walker, K.F., Boulton, A.J. (1998). Flow variability and the ecology of arid zone streams. Mar. Freshwater Res. 49, 55-72.
Schaffter, N., Parriaux, A. (2002). Pathogenic-bacterial water contamination in mountainous catchments. Water Res. 36, 131-139.
Suleiman S., (2010). Environmental flow regime as a tool for integrated water and basin resource management through Seasonal relationships among indicator bacteria, pathogenic bacteria and hydrological indices: Wadi Zomar a case study, MSc Thesis, Birzeit University
Townsend, S.A., (1992). The relationship between salmonellas and fecal indicator concentrations in two pools in the Australian wet/dry tropics. J App. Microbiol. 73, 182–188.
U.S. Army Corps of Engineers. Hydrologic Engineering Center, (2005). Hydrologic Modeling System HEC-HMS, California, pp. 248.
U.S. Army Corps of Engineers, (2001). HEC-RAS river analysis system user's manual. US Army Corps of Engineers, California, pp. 320.
USEPA, (2001). Protocol for Developing Pathogen TMDLs. U.S. Environmental Protection Agency, Washington, DC., pp. 132.
Yates, M.V., (2007). Classical indicators in the 21st century – far and beyond the Coliform. Water Environ. Res. 79, 279–286.