Estimation of the characteristic of contact line uplift and … · 2014-05-14 · Estimation of the...
10
Estimation of the characteristic of contact line uplift and strain in the neighborhood of a tunnel inlet by computer simulation Y. Sugama 1 , K. Shimizu 1 & S. Amari 2 1 Railway Technical Research Institute, Japan 2 East Japan Railway Company, Japan Abstract In Japan, computer simulation is used to evaluate the characteristic of performance of the current collection between overhead lines and a pantograph. Characteristics of contact wire uplift and strain are important indices to evaluate contact line structure in a high-speed railway. Especially in the case when a train runs into a tunnel at high speed, pantographs are strongly affected by aerodynamic flow. Therefore, it is important to investigate these characteristics within a tunnel. In this study, we carried out measurement of contact wire uplift and strain in the neighborhood of the tunnel inlet. Furthermore, we carried out a simulation and estimated them with consideration of the pantograph lift. By comparing the measurement result and simulation estimation, we examined the validity of simulation. In this way, it is possible to improve the accuracy of prediction of current collection performance of contact line by computer simulation. Keywords: current collection, the aerodynamic upward force of a pantograph, wind velocity, contact wire uplift, contact wire strain. 1 Introduction The flow velocity which acts on a pantograph in case a train runs in a tunnel is known to be larger than that in the open section [1]. With respect to uplift and strain of the contact wire used for evaluation of current collection performance, larger values tend to be observed in a tunnel than in an open section. This can be explained as follows. When a train rushes into a tunnel at high speed, the air in a tunnel is compressed, and the confrontation wind against the pantograph Computers in Railways XIII 147 www.witpress.com, ISSN 1743-3509 (on-line) WIT Transactions on The Built Environment, Vol 127, © 2012 WIT Press doi:10.2495/CR120131
Transcript of Estimation of the characteristic of contact line uplift and … · 2014-05-14 · Estimation of the...
Estimation of the characteristic of contact line uplift and strain in the neighborhood of a tunnel inlet by computer simulation
Y. Sugama1, K. Shimizu1 & S. Amari2 1Railway Technical Research Institute, Japan 2East Japan Railway Company, Japan
Abstract
In Japan, computer simulation is used to evaluate the characteristic of performance of the current collection between overhead lines and a pantograph. Characteristics of contact wire uplift and strain are important indices to evaluate contact line structure in a high-speed railway. Especially in the case when a train runs into a tunnel at high speed, pantographs are strongly affected by aerodynamic flow. Therefore, it is important to investigate these characteristics within a tunnel. In this study, we carried out measurement of contact wire uplift and strain in the neighborhood of the tunnel inlet. Furthermore, we carried out a simulation and estimated them with consideration of the pantograph lift. By comparing the measurement result and simulation estimation, we examined the validity of simulation. In this way, it is possible to improve the accuracy of prediction of current collection performance of contact line by computer simulation. Keywords: current collection, the aerodynamic upward force of a pantograph, wind velocity, contact wire uplift, contact wire strain.
1 Introduction
The flow velocity which acts on a pantograph in case a train runs in a tunnel is known to be larger than that in the open section [1]. With respect to uplift and strain of the contact wire used for evaluation of current collection performance, larger values tend to be observed in a tunnel than in an open section. This can be explained as follows. When a train rushes into a tunnel at high speed, the air in a tunnel is compressed, and the confrontation wind against the pantograph
Computers in Railways XIII 147
www.witpress.com, ISSN 1743-3509 (on-line) WIT Transactions on The Built Environment, Vol 127, © 2012 WIT Press
doi:10.2495/CR120131
becomes stronger, resultant in the increase of aerodynamic upward force of pantograph. When contact wire uplift increases excessively, there is a fear of the fittings damage. The increase in contact wire strain has a risk of occurrence of the fatigue fracture of a contact wire. The increase in contact wire strain has a risk of occurrence of the fatigue fracture of a contact wire. For this reason, it is very important to check the correlation between the aerodynamic upward force of pantograph and the uplift and strain of contact wire. A method of attaching a sensor to pantograph is commonly adopted for measuring the aerodynamic upward force of a pantograph. However by this method only that pantograph of the vehicle is evaluated. For the measurement of the strain of the contact wire, the strain gauge is pasted directly on the contact wire. By this method, however, only that gauge pasted at a point is evaluated. On the other hand, the evaluation method of dynamic characteristics of the overhead contact line unevenness has been developed based on erection conditions of the overhead contact line, such as unevenness of contact wire, the mounting position of suspension clamp like hanger etc [2]. By carrying out the simulation of the dynamic characteristics of the contact wire at the time of pantograph passage with use of this valuation method, it is possible to predict the location where the maximum of the uplift and strain of contact wire will be generated. In this study, in order to clarify the correlation between the aerodynamic upward force of a pantograph in a tunnel, and the uplift and strain of contact wire, simulations measurement of these items was performed. Furthermore, the measured values of the uplift and strain of contact wire in a tunnel were compared with the values estimated by simulation taking into account the aerodynamic upward force, and the validity of simulation was examined.
2 Measurement of the aerodynamic upward force of a pantograph in a tunnel
2.1 Measurement of the aerodynamic upward force of a pantograph by electric and track inspection car
The aerodynamic upward force of a pantograph in a tunnel was measured by using the electric and track inspection car. The upward force was estimated based on load of pan spring of the pantograph. The ratio of the upward force in a tunnel to that in the open section was defined as the lift ratio. The maximum values of lift ratio were investigated for the tunnels not less than 500 m. Measurement results are shown in Figure 1 and 2. Figure 1 shows the relation between the tunnel length and the lift ratio. There is a tendency for a lift ratio to become large with the increase of a tunnel length. For the tunnels more than about 700 m, the lift ratio was about 1.6 to 2.2. The average of measured lift ratios was about 1.71. Generally, it is known that the aerodynamic upward force of pantograph is proportional to the square of the flow velocity. The average flow velocity ratio calculated from the average lift values was about 1.3, almost in agreement with the conventional knowledge [1]. From the result of this field trial, it is thought to be appropriate that the flow velocity in case a train enters
148 Computers in Railways XIII
www.witpress.com, ISSN 1743-3509 (on-line) WIT Transactions on The Built Environment, Vol 127, © 2012 WIT Press
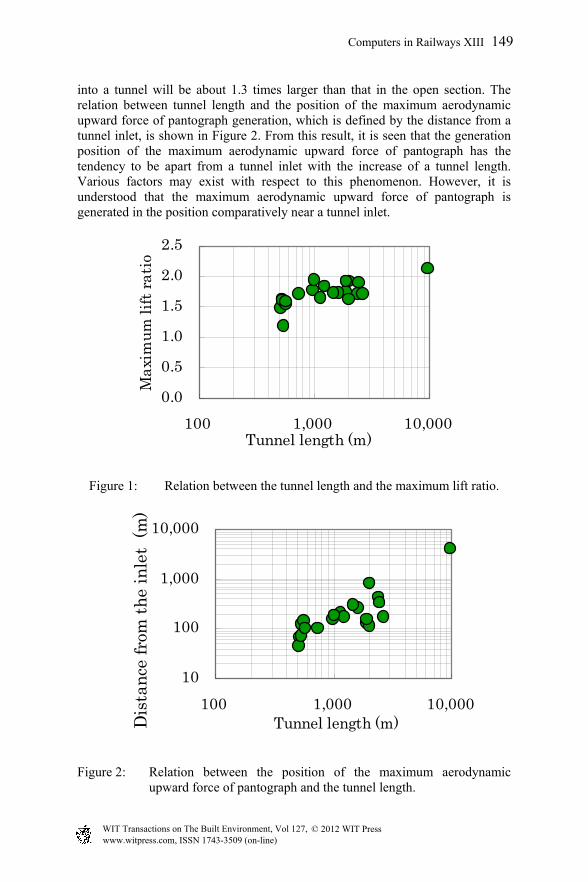
into a tunnel will be about 1.3 times larger than that in the open section. The relation between tunnel length and the position of the maximum aerodynamic upward force of pantograph generation, which is defined by the distance from a tunnel inlet, is shown in Figure 2. From this result, it is seen that the generation position of the maximum aerodynamic upward force of pantograph has the tendency to be apart from a tunnel inlet with the increase of a tunnel length. Various factors may exist with respect to this phenomenon. However, it is understood that the maximum aerodynamic upward force of pantograph is generated in the position comparatively near a tunnel inlet.
0.0
0.5
1.0
1.5
2.0
2.5
100 1,000 10,000Tunnel length (m)
Max
imum
lift
rat
io
Figure 1: Relation between the tunnel length and the maximum lift ratio.
10
100
1,000
10,000
100 1,000 10,000Tunnel length (m)
Figure 2: Relation between the position of the maximum aerodynamic upward force of pantograph and the tunnel length.
Dis
tan
ce fr
om t
he
inle
t (
m)
Computers in Railways XIII 149
www.witpress.com, ISSN 1743-3509 (on-line) WIT Transactions on The Built Environment, Vol 127, © 2012 WIT Press
2.2 Estimation of the aerodynamic upward force of pantograph by the wind measurement in a tunnel
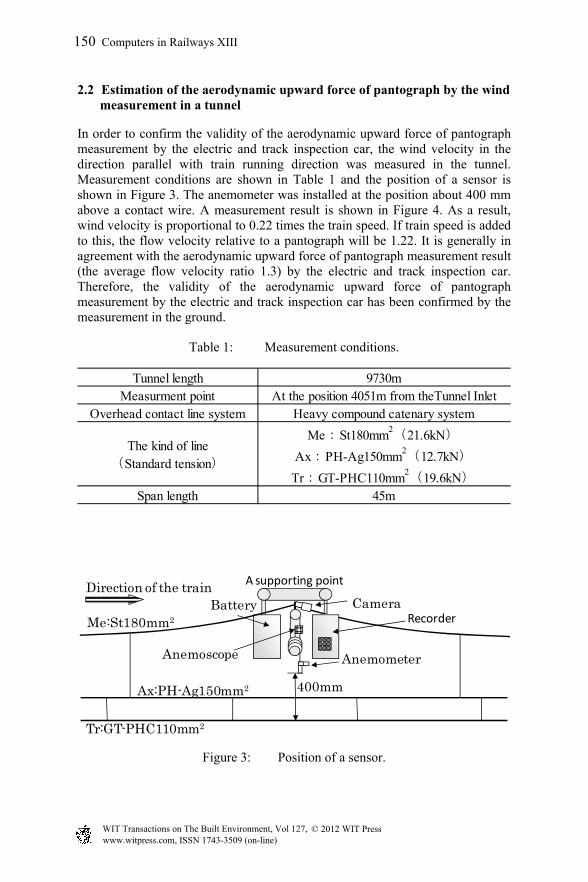
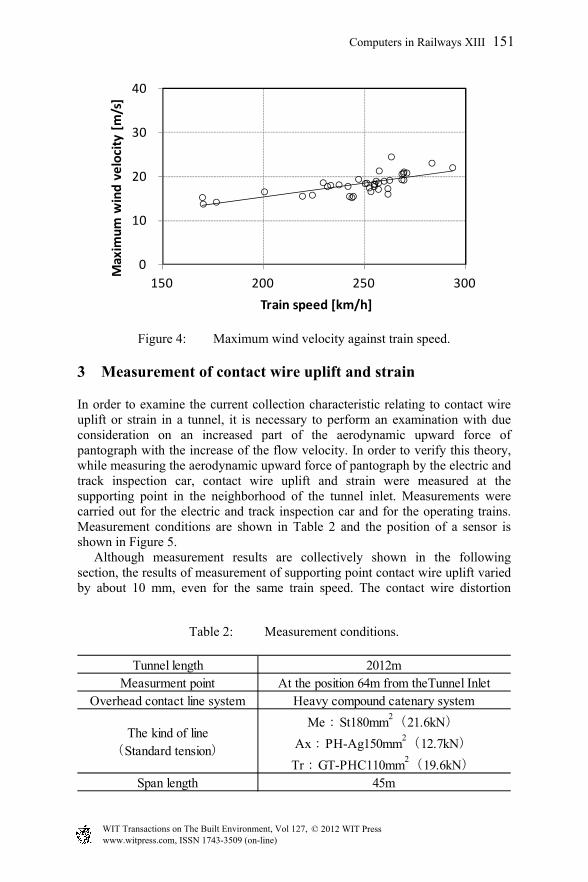
In order to confirm the validity of the aerodynamic upward force of pantograph measurement by the electric and track inspection car, the wind velocity in the direction parallel with train running direction was measured in the tunnel. Measurement conditions are shown in Table 1 and the position of a sensor is shown in Figure 3. The anemometer was installed at the position about 400 mm above a contact wire. A measurement result is shown in Figure 4. As a result, wind velocity is proportional to 0.22 times the train speed. If train speed is added to this, the flow velocity relative to a pantograph will be 1.22. It is generally in agreement with the aerodynamic upward force of pantograph measurement result (the average flow velocity ratio 1.3) by the electric and track inspection car. Therefore, the validity of the aerodynamic upward force of pantograph measurement by the electric and track inspection car has been confirmed by the measurement in the ground.
Table 1: Measurement conditions.
Tunnel length 9730mMeasurment point At the position 4051m from theTunnel Inlet
Overhead contact line system Heavy compound catenary system
The kind of line(Standard tension)
Me:St180mm2(21.6kN)
Ax:PH-Ag150mm2(12.7kN)
Tr:GT-PHC110mm2(19.6kN)
Span length 45m
Direction of the trainBattery Camera
Anemoscope Anemometer
Tr:GT-PHC110mm2
Ax:PH-Ag150mm2
Me:St180mm2
A supporting point
400mm
Recorder
Figure 3: Position of a sensor.
150 Computers in Railways XIII
www.witpress.com, ISSN 1743-3509 (on-line) WIT Transactions on The Built Environment, Vol 127, © 2012 WIT Press
0
10
20
30
40
150 200 250 300
Max
imu
m w
ind v
elo
city [
m/s
]
Train speed [km/h]
Figure 4: Maximum wind velocity against train speed.
3 Measurement of contact wire uplift and strain
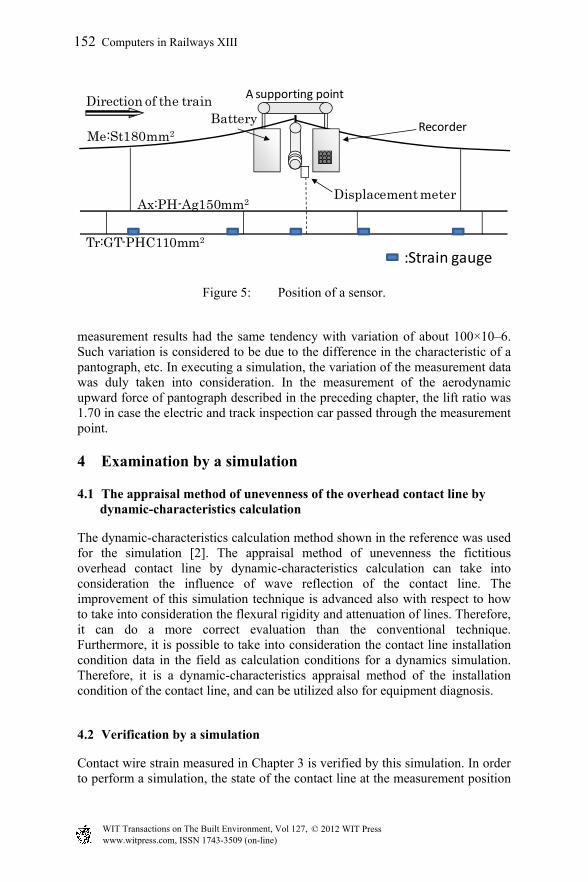
In order to examine the current collection characteristic relating to contact wire uplift or strain in a tunnel, it is necessary to perform an examination with due consideration on an increased part of the aerodynamic upward force of pantograph with the increase of the flow velocity. In order to verify this theory, while measuring the aerodynamic upward force of pantograph by the electric and track inspection car, contact wire uplift and strain were measured at the supporting point in the neighborhood of the tunnel inlet. Measurements were carried out for the electric and track inspection car and for the operating trains. Measurement conditions are shown in Table 2 and the position of a sensor is shown in Figure 5. Although measurement results are collectively shown in the following section, the results of measurement of supporting point contact wire uplift varied by about 10 mm, even for the same train speed. The contact wire distortion
Table 2: Measurement conditions.
Tunnel length 2012mMeasurment point At the position 64m from theTunnel Inlet
Overhead contact line system Heavy compound catenary system
The kind of line(Standard tension)
Me:St180mm2(21.6kN)
Ax:PH-Ag150mm2(12.7kN)
Tr:GT-PHC110mm2(19.6kN)
Span length 45m
Computers in Railways XIII 151
www.witpress.com, ISSN 1743-3509 (on-line) WIT Transactions on The Built Environment, Vol 127, © 2012 WIT Press
Direction of the trainBattery
Displacement meter
Tr:GT-PHC110mm2
Ax:PH-Ag150mm2
Me:St180mm2
A supporting point
Recorder
:Strain gauge
Figure 5: Position of a sensor.
measurement results had the same tendency with variation of about 100×10–6. Such variation is considered to be due to the difference in the characteristic of a pantograph, etc. In executing a simulation, the variation of the measurement data was duly taken into consideration. In the measurement of the aerodynamic upward force of pantograph described in the preceding chapter, the lift ratio was 1.70 in case the electric and track inspection car passed through the measurement point.
4 Examination by a simulation
4.1 The appraisal method of unevenness of the overhead contact line by dynamic-characteristics calculation
The dynamic-characteristics calculation method shown in the reference was used for the simulation [2]. The appraisal method of unevenness the fictitious overhead contact line by dynamic-characteristics calculation can take into consideration the influence of wave reflection of the contact line. The improvement of this simulation technique is advanced also with respect to how to take into consideration the flexural rigidity and attenuation of lines. Therefore, it can do a more correct evaluation than the conventional technique. Furthermore, it is possible to take into consideration the contact line installation condition data in the field as calculation conditions for a dynamics simulation. Therefore, it is a dynamic-characteristics appraisal method of the installation condition of the contact line, and can be utilized also for equipment diagnosis.
4.2 Verification by a simulation
Contact wire strain measured in Chapter 3 is verified by this simulation. In order to perform a simulation, the state of the contact line at the measurement position
152 Computers in Railways XIII
www.witpress.com, ISSN 1743-3509 (on-line) WIT Transactions on The Built Environment, Vol 127, © 2012 WIT Press
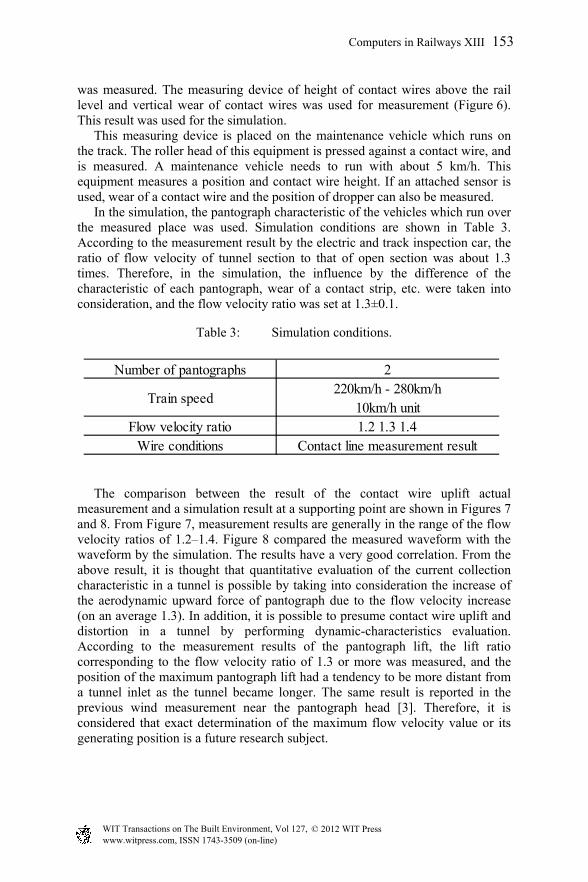
was measured. The measuring device of height of contact wires above the rail level and vertical wear of contact wires was used for measurement (Figure 6). This result was used for the simulation. This measuring device is placed on the maintenance vehicle which runs on the track. The roller head of this equipment is pressed against a contact wire, and is measured. A maintenance vehicle needs to run with about 5 km/h. This equipment measures a position and contact wire height. If an attached sensor is used, wear of a contact wire and the position of dropper can also be measured. In the simulation, the pantograph characteristic of the vehicles which run over the measured place was used. Simulation conditions are shown in Table 3. According to the measurement result by the electric and track inspection car, the ratio of flow velocity of tunnel section to that of open section was about 1.3 times. Therefore, in the simulation, the influence by the difference of the characteristic of each pantograph, wear of a contact strip, etc. were taken into consideration, and the flow velocity ratio was set at 1.3±0.1.
Table 3: Simulation conditions.
Number of pantographs 2
Train speed220km/h - 280km/h
10km/h unitFlow velocity ratio 1.2 1.3 1.4
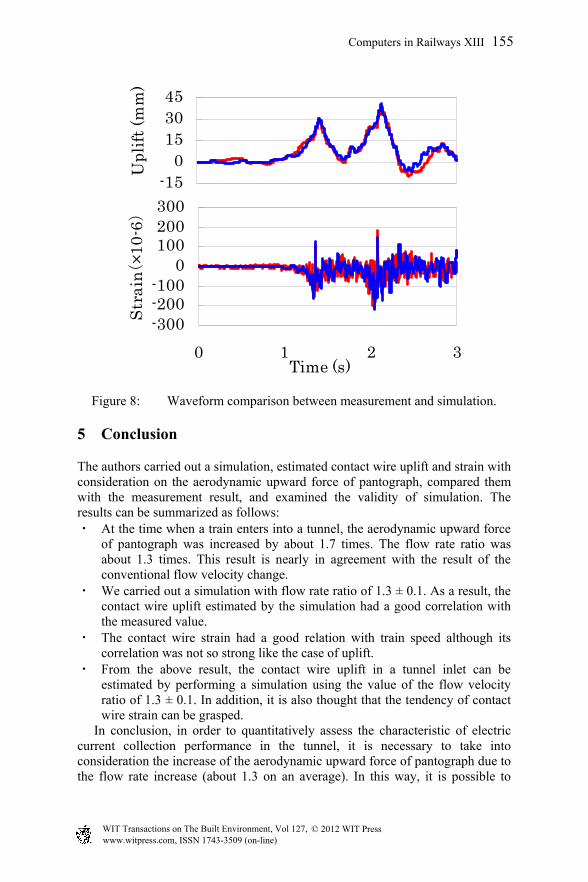
Wire conditions Contact line measurement result The comparison between the result of the contact wire uplift actual measurement and a simulation result at a supporting point are shown in Figures 7 and 8. From Figure 7, measurement results are generally in the range of the flow velocity ratios of 1.2–1.4. Figure 8 compared the measured waveform with the waveform by the simulation. The results have a very good correlation. From the above result, it is thought that quantitative evaluation of the current collection characteristic in a tunnel is possible by taking into consideration the increase of the aerodynamic upward force of pantograph due to the flow velocity increase (on an average 1.3). In addition, it is possible to presume contact wire uplift and distortion in a tunnel by performing dynamic-characteristics evaluation. According to the measurement results of the pantograph lift, the lift ratio corresponding to the flow velocity ratio of 1.3 or more was measured, and the position of the maximum pantograph lift had a tendency to be more distant from a tunnel inlet as the tunnel became longer. The same result is reported in the previous wind measurement near the pantograph head [3]. Therefore, it is considered that exact determination of the maximum flow velocity value or its generating position is a future research subject.
Computers in Railways XIII 153
www.witpress.com, ISSN 1743-3509 (on-line) WIT Transactions on The Built Environment, Vol 127, © 2012 WIT Press
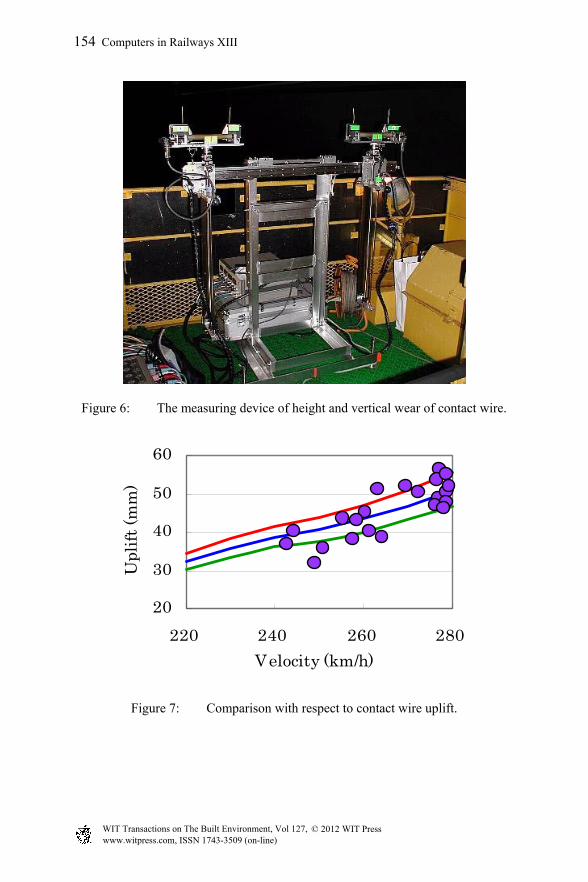
Figure 6: The measuring device of height and vertical wear of contact wire.
20
30
40
50
60
220 240 260 280
Velocity (km/h)
Upl
ift
(mm
)
Figure 7: Comparison with respect to contact wire uplift.
154 Computers in Railways XIII
www.witpress.com, ISSN 1743-3509 (on-line) WIT Transactions on The Built Environment, Vol 127, © 2012 WIT Press
-150
153045
Upl
ift
(mm
)
-300-200-100
0100200300
0 1 2 3Time (s)
Str
ain(
×10-
6)
Figure 8: Waveform comparison between measurement and simulation.
5 Conclusion
The authors carried out a simulation, estimated contact wire uplift and strain with consideration on the aerodynamic upward force of pantograph, compared them with the measurement result, and examined the validity of simulation. The results can be summarized as follows: ・ At the time when a train enters into a tunnel, the aerodynamic upward force
of pantograph was increased by about 1.7 times. The flow rate ratio was about 1.3 times. This result is nearly in agreement with the result of the conventional flow velocity change.
・ We carried out a simulation with flow rate ratio of 1.3 ± 0.1. As a result, the contact wire uplift estimated by the simulation had a good correlation with the measured value.
・ The contact wire strain had a good relation with train speed although its correlation was not so strong like the case of uplift.
・ From the above result, the contact wire uplift in a tunnel inlet can be estimated by performing a simulation using the value of the flow velocity ratio of 1.3 ± 0.1. In addition, it is also thought that the tendency of contact wire strain can be grasped.
In conclusion, in order to quantitatively assess the characteristic of electric current collection performance in the tunnel, it is necessary to take into consideration the increase of the aerodynamic upward force of pantograph due to the flow rate increase (about 1.3 on an average). In this way, it is possible to
Computers in Railways XIII 155
www.witpress.com, ISSN 1743-3509 (on-line) WIT Transactions on The Built Environment, Vol 127, © 2012 WIT Press

improve the accuracy of prediction of current collection performance of contact line by computer simulation.
References
[1] M. Morikawa, A. Iwainaka and S. Iguchi, “Airflow Effect on Current Collection System by High-Speed Shinkansen Train Running in Tunnel”, J-Rail 2000, No.00–50, pp. 251–254 (2000).
[2] M. Aboshi, “Estimation Method of Contact Line Unevenness using Dynamic Simulation”, The transactions of the Institute of Electrical Engineers of Japan. D, A publication of Industry Applications Society, Vol.126, No.7 pp. 983–988 (2006).
[3] M. Ikeda, T. Mitsumodi and Y. Yamashita, “Onboard monitoring of angle and velocity of flow around a panhead of a pantograph”, J-Rail 2009, No.09–65, pp. 701–704 (2009).
156 Computers in Railways XIII
www.witpress.com, ISSN 1743-3509 (on-line) WIT Transactions on The Built Environment, Vol 127, © 2012 WIT Press