Estimation of State-Transition Probability Matrices in ...
7
Estimation of state-transition probability matrices in asynchronous population Markov processes The MIT Faculty has made this article openly available. Please share how this access benefits you. Your story matters. Citation Farahat, Waleed A. & Asada, H. "Estimation of state-transition probability matrices in asynchronous population Markov processes." American Control Conference (ACC) 2010 (2010): 6519-6524. © 2010 IEEE As Published http://ieeexplore.ieee.org/xpls/abs_all.jsp?arnumber=5531431 Publisher Institute of Electrical and Electronics Engineers (IEEE) Version Final published version Citable link http://hdl.handle.net/1721.1/76753 Terms of Use Article is made available in accordance with the publisher's policy and may be subject to US copyright law. Please refer to the publisher's site for terms of use.
Transcript of Estimation of State-Transition Probability Matrices in ...

Estimation of state-transition probability matricesin asynchronous population Markov processes
The MIT Faculty has made this article openly available. Please share how this access benefits you. Your story matters.
Citation Farahat, Waleed A. & Asada, H. "Estimation of state-transitionprobability matrices in asynchronous population Markov processes."American Control Conference (ACC) 2010 (2010): 6519-6524. © 2010IEEE
As Published http://ieeexplore.ieee.org/xpls/abs_all.jsp?arnumber=5531431
Publisher Institute of Electrical and Electronics Engineers (IEEE)
Version Final published version
Citable link http://hdl.handle.net/1721.1/76753
Terms of Use Article is made available in accordance with the publisher'spolicy and may be subject to US copyright law. Please refer to thepublisher's site for terms of use.

Estimation of State-Transition Probability Matrices in AsynchronousPopulation Markov Processes
Waleed A. Farahat and H. Harry Asada
Abstract— We address the problem of estimating the prob-ability transition matrix of an asynchronous vector Markovprocess from aggregate (longitudinal) population observations.This problem is motivated by estimating phenotypic state tran-sitions probabilities in populations of biological cells, but canbe extended to multiple contexts of populations of Markovianagents. We adopt a Bayesian estimation approach, which can becomputationally expensive if exact marginalization is employed.To compute the posterior estimates efficiently, we use MonteCarlo simulations coupled with Gibb’s sampling techniques thatexplicitly incorporate sampling constraints from the desireddistributions. Such sampling techniques can attain significantcomputational advantages. Illustration of the algorithm isprovided via simulation examples.
I. INTRODUCTION
Many dynamic systems consisting of a population ofindependent agents can be described by population Markovprocesses (also known as vector Markov processes [1]). Inthose systems (illustrated in Figure 1), the discrete state ofeach agent evolves according to a Markov process, that ischaracterized by a probability transition matrix P. The objec-tive of this work is to develop algorithms for the estimation ofP from observed data. In particular, we focus our attention tothe problem when such transitions are asynchronous amongthe population members. That is, the individual agents donot share a common clock that dictates when the transitionsoccur. Furthermore, the observations are not necessarily insynch with any particular observation schedule. The distinc-tion between synchronous and asynchronous transitions isillustrated in Figure 2.
This work is directly motivated by the problem of esti-mating phenotypic state transition in living cells. Considera colony of cells or bacteria residing in a petri dish. Thissystem can be described as population Markov process,where each cell in the population undergoes a sequence ofphenotypic transitions over time. These transitions are typi-cally not deterministic, and are best described in stochastic,particularly Markovian, terms. There are numerous exam-ples in biology for such stochastic transitions. Escherichiacoli stochastically switch between highly proliferating andquiescent phenotypes to maintain increased resistance to
This work was supported by NSF EFRI Award number #0735997 andthe Singapore-MIT Alliance for Research and Technology.
W. Farahat is with the Department of Mechanical Engineer-ing, Massachusetts Institute of Technology, Cambridge MA [email protected]
H. Asada is with the Department of Mechanical Engineering,Massachusetts Institute of Technology, Cambridge MA [email protected]
stress conditions induced by antibiotics [2]. Candida al-bicans, Salmonella typhimurium, and other bacterial andfungal organisms exhibit high frequency, reversible pheno-typic switching to enhance anti-fungal resistance [3]. Slimemold (Dictyostelium discoideum) exhibits migration andformation dynamics in the presence of stress signals thatare released at the onset of starvation (cAMP and follicacid), causing the phenotype of the organisms to changefrom independent unicellular organisms, to a formation of amulticellular organism capable of survival and reproduction[4]. Human endothelial cells, stochastically switch amongseveral states (quiescence, proliferation, migration and apop-tosis – programmed cell death) in response to external andinternal signaling molecules [5], [6]. While such transitionscan be synchronized initially in vitro (e.g. via the use ofcell starvation techniques to reset cell cycle clocks), thesynchronicity typically decays within several transitions.Irrespective of the particular context, it is of interest toestimate the probabilities of phenotypic state-transitions fromobservations collected over cell population. The transitionprobability matrix characterizes the dynamics of cell popula-tions succinctly, and enables answering questions pertainingto transition dynamics, steady-state distributions and otheroutcomes of interest.
The estimation algorithms employed depend critically onthe form of observations available. At one extreme, anabundance of data can simplify the estimation problemsignificantly. For example, if panel data is available (i.e.observations of the state of each agent at each observa-tion point), the estimation problem becomes straightforward.However, if only longitudinal data is available (i.e. aggregatedata summarizing the total number of agents in each state),the state-transition probability matrix estimation problembecomes more involved.
In [7], we developed Bayesian estimation schemes for ad-dressing both estimation problems (using panel and longitu-dinal data). A tacit assumption was that, in both formulations,the state transitions are synchronous among the populationmembers, and are also synchronous with the observations.In this work, we relax these assumptions, and allow forasynchronicity of state transitions among population mem-bers, and with respect to the observations. Thus, here wegeneralized the algorithms to a wider class of problems.
We adopt a Bayesian estimation approach to this prob-lem for three reasons. First, Bayesian estimates can givemore representative results when computing expectations ofnonlinear functions over random variables. This is desirablewhen using the model to predict future output of the system
2010 American Control ConferenceMarriott Waterfront, Baltimore, MD, USAJune 30-July 02, 2010
FrC07.6
978-1-4244-7427-1/10/$26.00 ©2010 AACC 6519

(a) A population of m Markovian agents
(b) Population Markov process
Fig. 1. A vector Markov process consists of multiple agents, each consistingof Markovian dynamics.
of cells. Second, Bayesian approaches are equipped withformal means to incorporate prior knowledge which canbe derived from the underlying biology. Third, becauseBayesian methods produce distributions of parameters, ratherthan a single point estimates, their outcomes can capturesubtle interactions with respect to population members.
II. PROBLEM FORMULATION
A. Preliminaries
Consider a population of N agents. Each agent i assumes astate si(t) ∈ S at time t, where S = {1, 2, ⋅ ⋅ ⋅ ,m} is the setof labels of states that an agent can take. The evolution i-thagent’s states can be described by the random process si ={si(1), si(2), ⋅ ⋅ ⋅ , si(T )}, where T is the time horizon. Thetransitions of the entire population of cells can be describedby the N × T matrix S
S =
⎡⎢⎢⎢⎣s1(1) s1(2) ⋅ ⋅ ⋅ s1(T )s2(1) s2(2) ⋅ ⋅ ⋅ s2(T )
......
sN (1) sN (2) ⋅ ⋅ ⋅ sN (T )
⎤⎥⎥⎥⎦ =
⎧⎨⎩s1
s2
...sN
⎫⎬⎭ (1)
The matrix S is the most complete description of the celltransitions since it allows for tracking the time trajectory ofeach individual cell. In the population statistics literature,this is known as the panel data matrix [8].
A more compact representation of the transitions is todefine the m× 1 aggregate count vector � that denotes that
(a) Synchronous panel data (b) Asynchronous panel data
(c) Synchronous longitudinal data (d) Asynchronous longitudinaldata
Fig. 2. Illustration of panel data S and longitudinal data Θ for a 2-statesystem for both synchronous and asynchronous transitions. (a) and (b): cellcolor (black or white) represents the state of each cell (state 1 or state 2)as it evolves over time. (c) and (d): bar heights represent the total numberof cells (aggregate data) in each state for each time step. The red verticallines represent observation time points.
aggregate number of cells occupying each of the states.
�(t) =
⎧⎨⎩# of cells in state 1 at time t# of cells in state 2 at time t
...# of cells in state m at time t
⎫⎬⎭ (2)
Thus the kth element of �(t), �k(t), is the number of cellsin the population that assume state k at time t. Note that∑k
�k = N . The evolution of �(t) over time is given by the
m× T matrix Θ
Θ = [�(0),�(1), ⋅ ⋅ ⋅ ,�(T )] (3)
This matrix Θ is known as aggregate or longitudinal datamatrix. Note that in typical situations m << N , i.e. there aremany more agents than states, and the matrix Θ representshighly summarized data describing the system. Figure 2illustrates the distinction between panel data and longitudinaldata for both the synchronous and asynchronous cases.
Let pjk denote the probability of transition of from statej to state k. For simplicity we assume that the population ishomogeneous, and thus pjk applies to all agents, and that thetransitions of each agents is independent of each other. Them×m probability transition matrix P = [pjk] is unknown,and is the objective of our estimation problem. Note that forP to be a valid stochastic matrix, its elements have to obeybasic constraints, namely that 0 ≤ pjk ≤ 1 and
∑k
pjk = 1.
B. Asynchronous Transition Model
To model the asynchronous nature of the transitions, werely on a Poisson processes description of the temporal statis-tics of the transitions. This description has two consequences.
6520

First, the time at which a particular agent visits a particularstate is given by an exponential distribution, characterizedby the parameter �. Second, for a given time interval Δt,the probability that n transitions occur within that period isgiven by
Pr(n∣�,Δt) = e−�Δt (�Δt)n
n!. (4)
Such a description is common for arrival rates within giventime intervals.
C. Bayesian Estimation FormulationOur problem becomes: given longitudinal and asyn-
chronous observations Θ, estimate the probability transitionmatrix P. Since we are adopting a Bayesian framework, wearrive at probability distributions of the parameters of interest– the elements of the probability transition matrix. Thereforewe recursively apply
Pr(P∣�(t),�(t+ Δt)) =Pr(�(t+ Δt)∣P,�(t)) ⋅ Pr(P∣�(t))
Pr(�(t+ Δt)∣�(t))(5)
In most cases, the computation of the denominator (a pro-portionality constant), is not required, and we will satisfyourselves with relative probabilistic values. Note that thepriors Pr(P∣�(t)) are either given or assumed given theparticular context of the problem. The key challenge in thisproblem, as with most Bayesian estimation problems, is tocompute the likelihood function Pr(�(t+ Δt)∣P,�(t)).
III. ESTIMATION FORMULATIONA. State Transition Flows
The state transition flow matrix F(t) is defined by F(t) =[fjk(t)], where fjk(t) is the number of cells that have tran-sitioned from state j to state k during the interval (t, t+Δt].We introduced F(t) as an auxiliary variable since it simplifiesthe problem formulation considerably.
Given a candidate state transition matrix P, the probabilityof a flow vector out of a given node is captured by themultinomial distribution:
Pr(fi1(t), fi2(t), ⋅ ⋅ ⋅ fim(t)∣P, �i(t))
=
(�i(t)
fi1(t)fi2(t) ⋅ ⋅ ⋅ fim(t)
)pfi1(t)i1 ⋅ ⋅ ⋅ pfim(t)
im
=�i(t)!
m∏k=1
pfik(t)ik
fik(t)!. (6)
The probability of the entire flow matrix F(t) is the jointprobability of the individual flow vectors given by equation(6). Assuming independence of the flows originating out ofall the nodes, the joint probability is computed by:
Pr(F(t)∣P,�(t))
= Pr([f11, ⋅ ⋅ ⋅ f1m] ∩ ⋅ ⋅ ⋅ ∩ [fm1, ⋅ ⋅ ⋅ fmm]∣P,�(t))
=
m∏i=1
�i(t)!
m∏k=1
pfik(t)ik
fik(t)!. (7)
These flow matrices have to satisfy the consistency con-straints that i) the sum of flows out of a particular nodeis equal to the total agents in that node, and ii) the sum offlows into a node equals the number of agents in that nodeat the next instance. These constraints are written as∑
k
fik(t) = �i(t) (8)∑i
fik(t) = �k(t+ Δt) (9)
Furthermore, a set of inequality constraints must be satisfied,specifically that the flows out of a node are non-negative, andare bounded by the total number of agents in a given state:
fik(t) ≥ 0 (10)fik(t) ≤ �i (11)
Without loss of generality, we can compactly write equalityconstraints (8), (9) and inequality constraints (10), (11) as
A(t)f(t) + b(t) = 0 (12)C(t)f(t) + d(t) ≤ 0 (13)
We denote the set of all possible flow matrices satisfyingconstraints (12) and (13) by ℱ(t).
B. Estimation of State Transition Probabilities PTo compute the likelihood of aggregate longitudinal ob-
servations, we marginalize over all possible flow matricessatisfying the consistency constraints. Thus,
Pr(�(t+ Δt)∣P,�(t)) =∑
F(t)∈ℱ(t)
Pr(F(t)∣P,�(t))
=∑
F(t)∈ℱ(t)
(m∏i=1
�i(t)!
m∏k=1
pfik(t)ik
fik(t)!
)(14)
Equation (14), when substituted in equation (5) becomesthe basis for our estimation scheme.
IV. COMPUTATIONAL ISSUESThe computation of the posterior distribution in eq. (14)
by exhaustive inference is computationally expensive. This isprimarily because the set ℱ(t) is typically of a large dimen-sionality (m2), and consequently exact summation occursover a large number of elements. To attain computationaltractability, we apply the Monte Carlo principle to computethis summation approximately efficiently. We rely on twokey approximations:
1) Approximate the multinomial distribution (eq. (6))describing the likelihood functions by an equivalentmulti-dimensional Gaussian distribution, implying thatPr(F(t)∣P,�(t)) ≈ N (�f ,Σf )
2) Apply Monte Carlo methods to evaluate the summationover the set ℱ efficiently by relying on appropriatesampling techniques. We implement this via Gibb’ssampling from the approximated Gaussian probabil-ity distributions while satisfying equality constraints
6521
(12) and inequality constraints (13). This implies that∑F∈ℱ
N (�f ,Σf ) ≈∑
Fsamples∈ℱ
N (�f ,Σf ).
Both of these approximations are described next in detail.
A. Gaussian Approximation to the Multinomial LikelihoodFunction
The likelihood functions for the flow transition matrices ineq. (7) are multinomial distributions. These functions can bereadily approximated by multivariate Gaussian distributionsby matching the means and the covariances appropriately [9].To simplify the ensuing expressions, it is useful to rewritethe m ×m matrix quantities F and P as m2 × 1 vectors fand p by stacking the matrix elements column wise.
The expectation of a particular flow path fik is given by�fik = E[fik] = pik�i. Therefore the mean of Gaussianapproximation is given by
�f = [E[fik(t)]]. (15)
The m2 ×m2 covariance matrix of f has a block diagonalstructure since the flows emanating from two different nodesare independent. Therefore, by denoting the itℎ row of F(t)as fi(⋅), we write
Σf = Cov(f) =
⎡⎢⎣[Cov
(f1(⋅)
)]0
. . .0
[Cov
(fm(⋅)
)]⎤⎥⎦(16)
The elements of the itℎ m×m sub matrix on the diagonal,[Cov
(fi(⋅))]
, are given each by
Cov(fi(⋅))
= Cov(fij , fik) =
{�ipij(1− pik) if j = k−�ipijpik if j ∕= k
Therefore, in the absence of any constraints such as (12) or(13), the probability distribution of P is approximated byN (�f ,Σf ).
B. Constrained Gaussian Sampling: Equality Constraints
Given the Gaussian approximation to the multinomialdistribution, our objective is to draw Monte Carlo samplesfrom the Gaussian distribution subject to admissibility con-straints (12) and (13). In [7] we have shown that in order tosatisfy equality constraint (12), we sample from a distributioncharacterized by
f = Aocv −A#b (17)
where Aoc is the orthogonal complement of the matrix A,and A# is its pseudo-inverse. The samples v are drawn froma lower dimensional Gaussian that is characterized by
�v = A#oc�f −A#
ocfo (18)
Σv = A#ocΣf
(A#oc
)T(19)
The resulting samples can be shown to satisfy constraint (12).
C. Constrained Gaussian Sampling: Inequality Constraints
To ensure that the Monte Carlo samples satisfy inequalityconstraint 13, we rely on Gibbs sampling [10], [11]. In thisapproach, points are sequentially sampled in each dimensionby drawing from a truncated multi-variable distributionsmultiple times. This procedure is detailed as follows:
1) Transform the Gaussian distribution N (�f ,Σf ) in theproblem space to the standard form. The transformedrandom vector z is characterized by N (0, I). Thistransformation is accomplished via
z = T−1(f − �f )
where T = UΛ12 , U and Λ are obtained from an
eigen decomposition of the covariance, matrix Σf =UΛUT .
2) Similarly transform the inequality constraints Cf+d ≤0 to equivalent constraints in the z-space according toCTz− ≤ d −C�f . This results in an equivalent setof constraints C̃z ≤ d̃.
3) Apply Gibb’s sampling by iterating through the dimen-sions of the search space. This reduces the compli-cated problem of sampling the inequality constrainedGaussian to a series of univariate truncated Gaus-sian samples. For each dimension k, the boundson the univariate truncated Gaussians are given by
[11]: zmink = maxC̃ik<0
d̃i −∑j ∕=k
C̃ijzj∣∣∣C̃ij∣∣∣ and zmaxk =
minC̃ik>0
d̃i −∑j ∕=k
C̃ijzj∣∣∣C̃ij∣∣∣ .
4) Transform the samples acquired from the z-space backto the problem space via
f = Tz + �f .
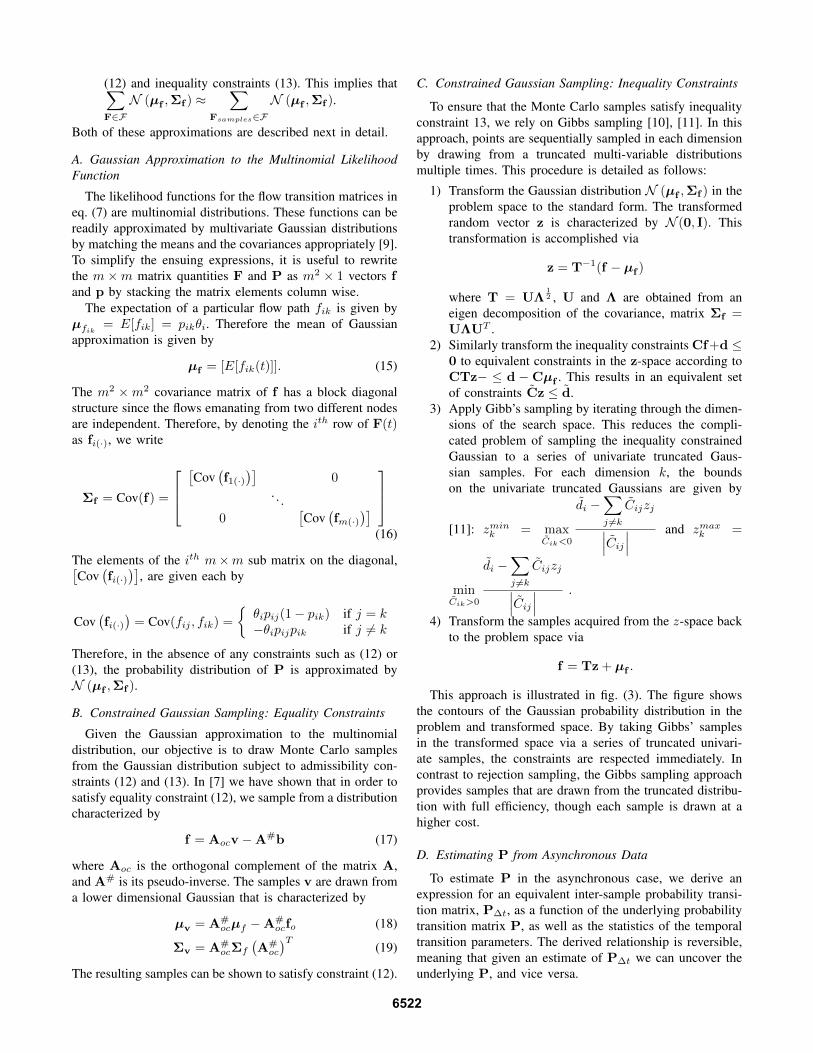
This approach is illustrated in fig. (3). The figure showsthe contours of the Gaussian probability distribution in theproblem and transformed space. By taking Gibbs’ samplesin the transformed space via a series of truncated univari-ate samples, the constraints are respected immediately. Incontrast to rejection sampling, the Gibbs sampling approachprovides samples that are drawn from the truncated distribu-tion with full efficiency, though each sample is drawn at ahigher cost.
D. Estimating P from Asynchronous Data
To estimate P in the asynchronous case, we derive anexpression for an equivalent inter-sample probability transi-tion matrix, PΔt, as a function of the underlying probabilitytransition matrix P, as well as the statistics of the temporaltransition parameters. The derived relationship is reversible,meaning that given an estimate of PΔt we can uncover theunderlying P, and vice versa.
6522

Recall that we assumed that the statistics of the temporalstate-transitions are governed by a Poisson process (4). Con-sequently, the number of transitions, nj , that cell j undergoesin a time period Δt is given by the Poisson distribution:
Pr(nj) = e(−�Δt) ⋅ (�Δt)nj
nj !
If cell j assumes state i at time t, then it occupies state kat the next transition with probability pik. Therefore itℎ rowof P, the vector pi(⋅), represents the probability distributionthat the cell occupies each of the states at the next transitionconditioned on the current state being i.
Pr(sj(t+ Δt)∣sj(t) = i, nj = 1;�) =(PT)ei
Similarly, the probability distribution after ni transitions, thisprobability distribution is given by
Pr(sj(t+ Δt)∣sj(t) = i, nj ;�) =(PT)nj
ei
where ei is the itℎ unit vector. To compute the probabilitydistribution for all possible transitions predicted by thePoisson process, we marginalize over all possible values ofnj :
Pr(sj(t+ Δt)∣sj(t) = i;�)
=
∞∑nj=0
Pr(sj(t+ Δt)∣sj(t) = i, nj ;�)
=
∞∑nj=0
{Pr(nj ∣�,Δt) ⋅ Pr(sj(t+ Δt)∣sj(t) = i, nj ;�)}
Manipulating this expression leads to
Pr(sj(t+ Δt)∣sj(t) = i;�)
=
∞∑nj=0
{e−�Δt (�Δt)
nj
nj !⋅(PT)nj
ei
}=e−�Δte(�Δt⋅PT ) ⋅ ei (20)
where the last equality follows from the definition of matrix
exponentiation eM = I + M +M2
2!+
M3
3!+ ⋅ ⋅ ⋅ =
∞∑k=0
Mk
k!.
Consequently, an equivalent probability transition matrix thattakes into account the asynchronicity of the process is givenby
PΔt = e−�Δt ⋅ e(�Δt⋅P) (21)
The resultant equivalent probability transition matrix, PΔt,can therefore be estimated using the tools and techniquesdeveloped to estimate the transition probabilities for theasynchronous case. Given PΔt, the nominal matrix P canbe recovered according to
P =1
�Δt⋅ logM
(PΔt
e−�Δt
)(22)
where logM denotes the matrix logarithm.
V. SUMMARY OF THE ALGORITHM
A summary of the algorithm for estimating the probabilitytransition matrix P from asynchronous, longitudinal obser-vations is as follows:
1) For each observation �(t), approximate the multino-mial likelihood function of the flow matrix F (7)by an equivalent multivariate Gaussian according toequations (15) and (16). Thus Pr(F(t)∣P,�(t)) ≈N (�f ,Σf ).
2) Approximate the summation over the set ℱ by asmaller number of samples
Pr(�(t+ 1)∣P,�(t)) ≈∑F∈ℱ
N (�f ,Σf )
≈∑
Fsamples∈ℱ
N (�f ,Σf )
3) To obtain the samples Fsamples:a) Compute an equality constrained representation
of the Gaussian model using Equations (18) and(19).
b) Using the procedure of Section (IV-C), obtaininequality constrained Gaussian samples of thesample space.
4) Use the samples Fsamples to compute the posteriordistribution according to eq. (14).
5) Adjust the effects of asynchronicity by converting PΔt
to P via equation (22).
VI. SIMULATION RESULTS & DISCUSSION
We simulated the algorithm for a two state process, usingthe following probability transition matrix as a representationof the real transition parameters:
P1 =
[0.35 0.650.80 0.20
].
In this two-dimensional instance of the problem, all possibleprobability transition matrices can be succinctly summarizedon a two dimensional grid ranging from 0 to 1 on each axis.Figure 4 shows the progression of the algorithm over threetime steps as estimates converge to the true value.
While our illustrations focused on 2-state examples forclarity of presentation, it can be extended in a straightforwardmanner to problems with higher number of states. Thecomputation time for estimating the likelihood of any onecandidate transition probability is not a function of thenumber of states, but rather is primarily a function of thenumber of samples required to get an accurate summation inthe Monte Carlo step. As the number of states increases,however, the number of candidate transition probabilitiesincreases exponentially.
Therefore, the formulation presented in this approach is ageneralization of two particular problems addressed prior:
1) The synchronous case is a special one where n = 1.2) The case of having full panel data case is a special
case when the set ℱ admits only one element.
6523

(a) Rejection sampling in problemspace
(b) Rejection sampling in trans-formed space
(c) Gibbs sampling in transformedspace
(d) Gibbs sampling in problem space
Fig. 3. Illustration of Gibbs sampling scheme to efficiently samplefrom Gaussian distributions subject to inequality constraints. (a) Gaussiandistribution contours shown in problem space. The feasible region satisfyingall inequality constraints is shaded in gray. Samples are drawn from thedistribution irrespective of the inequality constraints (red asterisks). Only thesamples satisfying the inequality constraints are picked (blue circles) andretained. (b) Distribution, data and constraints of subfigure (a) but are shownunder the transformation. (c) In the transformed space, samples are drawnfrom the constrained distribution via Gibbs sampling. All samples satisfythe inequality constraints. (d) Samples are transformed back to problemspace, maintaining feasibility.
The algorithm developed here can be directly applied to thosetwo special cases without the need for further development.
It is important to note that the estimation scheme presentedhere for the computation of the probability of a particularset of parameters is independent of the dimensionality ofthe problem and also independent of the number of agentsconsidered. Thus, the algorithm scales well with respect tothose two parameters, but scales linearly with the number ofsamples acquired during the Gibbs steps of the algorithm.
REFERENCES
[1] Ronald A. Howard. Dynamic Probabilistic Systems, volume 1. JohnWiley & Sons, Inc., 1971.
[2] Nathalie Q. Balaban, Jack Merrin, Remy Chait, Lukasz Kowalik,and Stanislas Leibler. Bacterial Persistence as a Phenotypic Switch.Science, 305(5690):1622–1625, 2004.
[3] David R. Soll. High-frequency switching in Candida albicans. Clin.Microbiol. Rev., 5(2):183–203, 1992.
[4] Robert A. Arkowitz. Responding to attraction: chemotaxis andchemotropism in dictyostelium and yeast. Trends in Cell Biology,9(1):20 – 27, 1999.
[5] Sampsa Hautaniemi, Sourabh Kharait, Akihiro Iwabu, Alan Wells,and Douglas A. Lauffenburger. Modeling of signal-response cascadesusing decision tree analysis. Bioinformatics, 21(9):20272035, 2005.
[6] L.B. Wood, A. Das, R.D. Kamm, and H.H. Asada. A stochastic controlframework for regulating collective behaviors of an angiogenesiscell population. In Proceedings of IEEE Biomedical Robotics andBiomechatronics Conference, pages 390–396, 2008.
[7] Waleed A. Farahat and H. Harry Asada. Identification of phenotypicstate transition probabilities in living cells. In Proceedings of theASME 2nd Dynamics Systems and Control Conference, 2009.
(a) Estimate at t = 1
(b) Estimate at t = 2
(c) Estimate at t = 3
Fig. 4. Progression of the estimation algorithm in time as the estimatesconverge to the true value, represented by the point (0.35, 0.20).
[8] D. L. Hawkins and Chien-Pai Han. Estimating transit ion probabilitiesfrom aggregate samples plus partial transition data. Biometrics,56:848–854, September 2000.
[9] Norman L. Johnson, Samuel Kotz, and N. Balakrishnan. DiscreteMultivariate Distributions, volume 2. John Wiley & Sons, Inc., 1997.
[10] J. H. Kotecha and P. M. Djuric. Gibbs sampling approach for gener-ation of truncated multivariate gaussian random variables. In ICASSP’99: Proceedings of the Acoustics, Speech, and Signal Processing,1999. on 1999 IEEE International Conference, pages 1757–1760,Washington, DC, USA, 1999. IEEE Computer Society.
[11] Claire Lauvernet, Jean-Michel Brankart, Frdric Castruccio, GrgoireBroquet, Pierre Brasseur, and Jacques Verron. A truncated gaussianfilter for data assimilation with inequality constraints: Application tothe hydrostatic stability condition in ocean models. Ocean Modelling,27(1-2):1 – 17, 2009.
6524