ESTIMATION OF PIER SCOUR AND CHANNEL … · highway crossings of the Red River, ... Estimation of...
71
ESTIMATION OF PIER SCOUR AND CHANNEL STABILITY FOR HIGHWAY CROSSINGS OF THE RED RIVER IN LOUISIANA By J. Josh Gilbert and Paul A. Ensminger U.S. GEOLOGICAL SURVEY Open-File Report 96-574 Prepared in cooperation with the: LOUISIANA DEPARTMENT OF TRANSPORTATION AND DEVELOPMENT Baton Rouge, Louisiana 1996
Transcript of ESTIMATION OF PIER SCOUR AND CHANNEL … · highway crossings of the Red River, ... Estimation of...
ESTIMATION OF PIER SCOUR AND CHANNEL STABILITY FOR HIGHWAY CROSSINGS OF THE RED RIVER IN LOUISIANA
By J. Josh Gilbert and Paul A. Ensminger
U.S. GEOLOGICAL SURVEY
Open-File Report 96-574
Prepared in cooperation with the:LOUISIANA DEPARTMENT OF TRANSPORTATION AND DEVELOPMENT
Baton Rouge, Louisiana
1996

U.S. DEPARTMENT OF THE INTERIOR
BRUCE BABBITT, SECRETARY
U.S. GEOLOGICAL SURVEY
Gordon P. Eaton, Director
For additional information write to:
District ChiefU.S. Geological Survey3535 S. Sherwood Forest Blvd., Suite 120Baton Rouge, LA 70816E-mail: [email protected]: (504) 389-0281
Copies of this report can be purchased from:
U.S. Geological Survey Branch of Information Services Box 25286 Denver, CO 80225-0286

CONTENTS
Abstract.................................................................................................................................................................. 1Introduction......................................................................................................^^ 1
Purpose and Scope...................................................................................................................................... 2Description of Study Area.......................................................................................................................... 2Acknowledgments...................................................................................................................................... f
Hydrology and Hydraulics..................................................................................................................................... 5Scour Analysis....................................................................................................................................................... 7
Channel Stability ........................................................................................................................................ 7Contraction and Abutment Scour............................................................................................................... 7Pier Scour Equation.................................................................................................................................... f
Highway Crossings of the Red River in Louisiana................................................................................................ fLouisiana Highway 107 near Moncla, Louisiana....................................................................................... f
Pier Scour........................................................................................................................................ 9Channel Stability............................................................................................................................. 11
U.S. Highways 167, 165, and 71 at Alexandria, Louisiana........................................................................ 1^U.S. Highway 167 at Alexandria, Louisiana.............................................................................................. M
Pier Scour........................................................................................................................................ 1^Channel Stability............................................................................................................................. 1*
U.S. Highway 167 (Proposed) at Alexandria, Louisiana ........................................................................... 17Pier Scour........................................................................................................................................ 17Channel Stability............................................................................................................................. 17
U.S. Highway 165 at Alexandria, Louisiana.............................................................................................. 17Pier Scour........................................................................................................................................ 17Channel Stability............................................................................................................................. 20
U.S. Highway 71 at Alexandria, Louisiana................................................................................................ 20Pier Scour........................................................................................................................................ 20Channel Stability............................................................................................................................. 20
Louisiana Highway 8 at Boyce, Louisiana................................................................................................. 26Pier Scour........................................................................................................................................ 27Channel Stability............................................................................................................................. 27
Louisiana Highway 6 at Grand Ecore, Louisiana....................................................................................... 27Pier Scour........................................................................................................................................ 31Channel Stability............................................................................................................................. 31
U.S. Highway 84 at Coushatta, Louisiana.................................................................................................. 35Pier Scour........................................................................................................................................ 35Channel Stability............................................................................................................................. 37
Louisiana Highways 511 and 3032, Interstate Highway 20, and U.S. Highway 80 at Shreveport,Louisiana............................................................................................................................................... 37
Louisiana Highway 511 at Shreveport, Louisiana...................................................................................... 41Pier Scour........................................................................................................................................ 41Channel Stability............................................................................................................................. 41
Louisiana Highway 3032 at Shreveport, Louisiana.................................................................................... 41Pier Scour........................................................................................................................................ 41Channel Stability............................................................................................................................. 46
Interstate Highway 20 at Shreveport, Louisiana ........................................................................................ 46Pier Scour........................................................................................................................................ 46Channel Stability............................................................................................................................. 50
U.S. Highway 80 at Shreveport, Louisiana................................................................................................ 50Pier Scour........................................................................................................................................ 50Channel Stability............................................................................................................................. 50
Interstate Highway 220 at Shreveport, Louisiana ...................................................................................... 56Pier Scour........................................................................................................................................ 56
in

Channel Stability............................................................................................................................. 58Louisiana Highway 2 near Hosston, Louisiana.......................................................................................... 58
Pier Scour........................................................................................................................................ 61Channel Stability............................................................................................................................. 61
Conclusions............................................................................................................................................................ 61Selected References............................................................................................................................................... 65
FIGURES
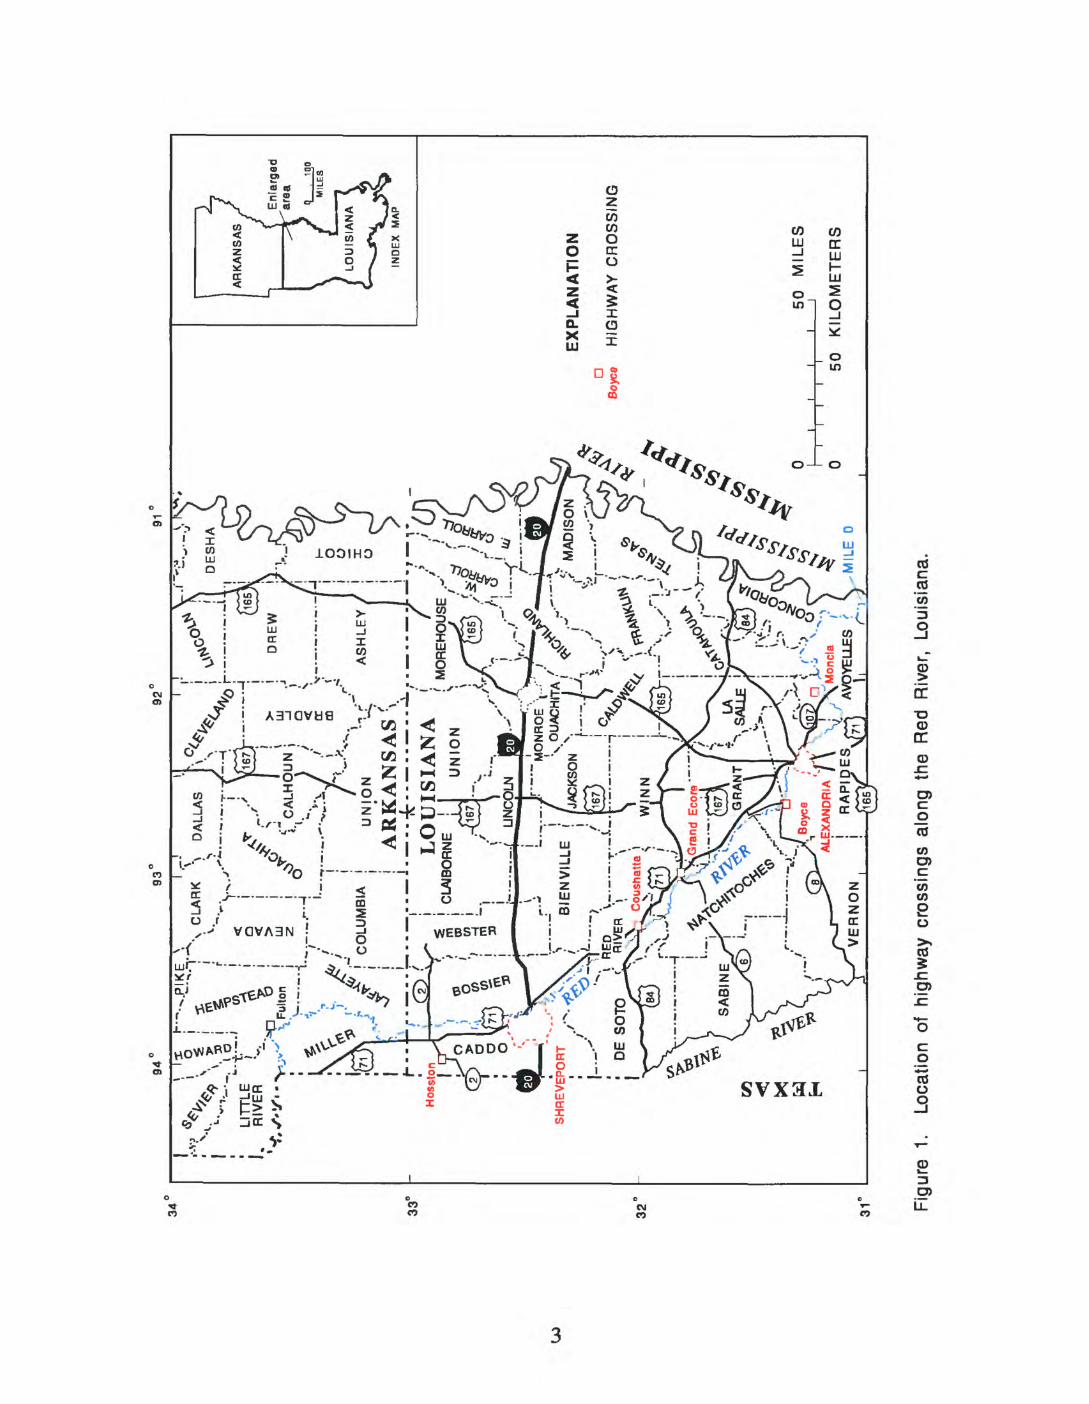
1. Location of highway crossings along the Red River, Louisiana............................................................. 32. Location of highway crossings evaluated in the vicinity of Shreveport, Louisiana................................ 43. The 500-year flood estimates on the Red River from Fulton, Arkansas, to Alexandria, Louisiana........ 64. Comparative cross sections and pier-scour estimates at Louisiana Highway 107 near Moncla,
Louisiana.................................................................................................................................................. 105. Aerial photograph of the Louisiana Highway 107 crossing of the Red River near Moncla, Louisiana,
Octobers, 1987....................................................................................................................................... 126. Aerial photograph of the Louisiana Highway 107 crossing of the Red River near Moncla, Louisiana,
November 1, 1988 ................................................................................................................................... 137. Comparative cross sections and pier-scour estimates at U.S. Highway 167 crossing at Alexandria,
Louisiana.................................................................................................................................................. 168. Comparative cross sections and pier-scour estimates at proposed Louisiana Highway 167 crossing
at Alexandria, Louisiana.......................................................................................................................... 189. Comparative cross sections and pier-scour estimates at U.S. Highway 165 crossing at Alexandria,
Louisiana.................................................................................................................................................. 1910. Aerial photograph of the U.S. Highways 165 and 167 crossings of the Red River at Alexandria,
Louisiana, August 8, 1977....................................................................................................................... 2111. Aerial photograph of the U.S. Highways 165 and 167 crossings of the Red River at Alexandria,
Louisiana, October 5, 1987...................................................................................................................... 2212. Comparative cross sections and pier-scour estimates at U.S. Highway 71 crossing at Alexandria,
Louisiana.................................................................................................................................................. 2313. Aerial photograph of the U.S. Highway 71 crossing of the Red River at Alexandria, Louisiana,
Augusts, 1977......................................................................................................................................... 2414. Aerial photograph of the U.S. Highway 71 crossing of the Red River at Alexandria, Louisiana,
Octobers, 1987....................................................................................................................................... 2515. Comparative cross sections and pier-scour estimates at Louisiana Highway 8 crossing at Boyce,
Louisiana.................................................................................................................................................. 2816. Aerial photograph of the Louisiana Highway 8 crossing of the Red River at Boyce, Louisiana,
April 22, 1986.......................................................................................................................................... 2917. Aerial photograph of the Louisiana Highway 8 crossing of the Red River at Boyce, Louisiana,
October 6, 1987 ....................................................................................................................................... 3018. Comparative cross sections and pier-scour estimates at Louisiana Highway 6 crossing at Grand
Ecore, Louisiana...................................................................................................................................... 3219. Aerial photograph of the Louisiana Highway 6 crossing of the Red River at Grand Ecore, Louisiana,
September 1, 1977................................................................................................................................... 3320. Aerial photograph of the Louisiana Highway 6 crossing of the Red River at Grand Ecore, Louisiana,
October 7, 1988 ....................................................................................................................................... 3421. Comparative cross sections and pier-scour estimates at U.S. Highway 84 crossing at Coushatta,
Louisiana.................................................................................................................................................. 3622. Aerial photograph of the U.S. Highway 84 crossing of the Red River at Coushatta, Louisiana,
February 21, 1977.................................................................................................................................... 3823. Aerial photograph of the U.S. Highway 84 crossing of the Red River at Coushatta, Louisiana,
October 6, 1987 ....................................................................................................................................... 39
IV
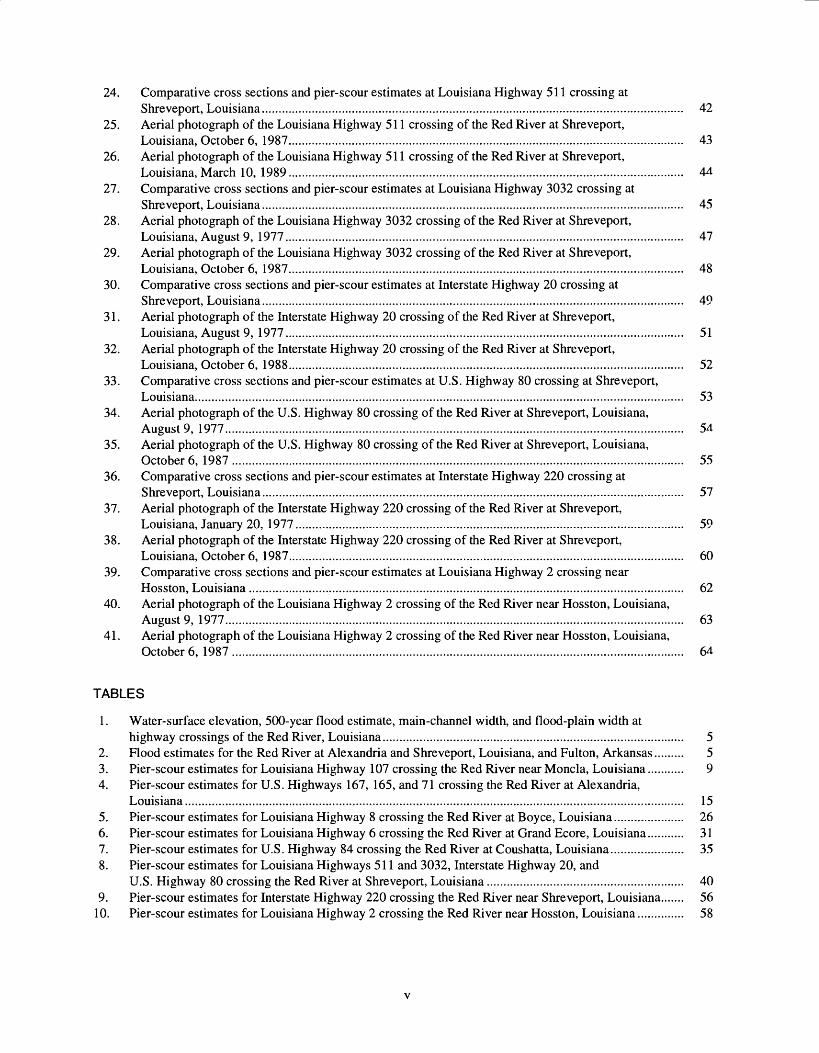
24. Comparative cross sections and pier-scour estimates at Louisiana Highway 511 crossing atShreveport, Louisiana.............................................................................................................................. 42
25. Aerial photograph of the Louisiana Highway 511 crossing of the Red River at Shreveport,Louisiana, October 6, 1987...................................................................................................................... 43
26. Aerial photograph of the Louisiana Highway 511 crossing of the Red River at Shreveport,Louisiana, March 10, 1989...................................................................................................................... 44
27. Comparative cross sections and pier-scour estimates at Louisiana Highway 3032 crossing atShreveport, Louisiana.............................................................................................................................. 45
28. Aerial photograph of the Louisiana Highway 3032 crossing of the Red River at Shreveport,Louisiana, August 9, 1977....................................................................................................................... 47
29. Aerial photograph of the Louisiana Highway 3032 crossing of the Red River at Shreveport,Louisiana, October 6, 1987...................................................................................................................... 48
30. Comparative cross sections and pier-scour estimates at Interstate Highway 20 crossing atShreveport, Louisiana.............................................................................................................................. 49
31. Aerial photograph of the Interstate Highway 20 crossing of the Red River at Shreveport,Louisiana, August 9, 1977....................................................................................................................... 51
32. Aerial photograph of the Interstate Highway 20 crossing of the Red River at Shreveport,Louisiana, October 6, 1988...................................................................................................................... 52
33. Comparative cross sections and pier-scour estimates at U.S. Highway 80 crossing at Shreveport,Louisiana.................................................................................................................................................. 53
34. Aerial photograph of the U.S. Highway 80 crossing of the Red River at Shreveport, Louisiana,August 9, 1977......................................................................................................................................... 54
35. Aerial photograph of the U.S. Highway 80 crossing of the Red River at Shreveport, Louisiana,October 6, 1987 ....................................................................................................................................... 55
36. Comparative cross sections and pier-scour estimates at Interstate Highway 220 crossing atShreveport, Louisiana.............................................................................................................................. 57
37. Aerial photograph of the Interstate Highway 220 crossing of the Red River at Shreveport,Louisiana, January 20, 1977.................................................................................................................... 59
38. Aerial photograph of the Interstate Highway 220 crossing of the Red River at Shreveport,Louisiana, October 6, 1987...................................................................................................................... 60
39. Comparative cross sections and pier-scour estimates at Louisiana Highway 2 crossing nearHosston, Louisiana.................................................................................................................................. 62
40. Aerial photograph of the Louisiana Highway 2 crossing of the Red River near Hosston, Louisiana,August 9, 1977......................................................................................................................................... 63
41. Aerial photograph of the Louisiana Highway 2 crossing of the Red River near Hosston, Louisiana,October 6, 1987 ....................................................................................................................................... 64
TABLES
1. Water-surface elevation, 500-year flood estimate, main-channel width, and flood-plain width athighway crossings of the Red River, Louisiana.......................................................................................... 5
2. Flood estimates for the Red River at Alexandria and Shreveport, Louisiana, and Fulton, Arkansas......... 53. Pier-scour estimates for Louisiana Highway 107 crossing the Red River near Moncla, Louisiana........... 94. Pier-scour estimates for U.S. Highways 167, 165, and 71 crossing the Red River at Alexandria,
Louisiana..................................................................................................................................................... 155. Pier-scour estimates for Louisiana Highway 8 crossing the Red River at Boyce, Louisiana..................... 266. Pier-scour estimates for Louisiana Highway 6 crossing the Red River at Grand Ecore, Louisiana........... 317. Pier-scour estimates for U.S. Highway 84 crossing the Red River at Coushatta, Louisiana...................... 358. Pier-scour estimates for Louisiana Highways 511 and 3032, Interstate Highway 20, and
U.S. Highway 80 crossing the Red River at Shreveport, Louisiana........................................................... 409. Pier-scour estimates for Interstate Highway 220 crossing the Red River near Shreveport, Louisiana....... 56
10. Pier-scour estimates for Louisiana Highway 2 crossing the Red River near Hosston, Louisiana.............. 58
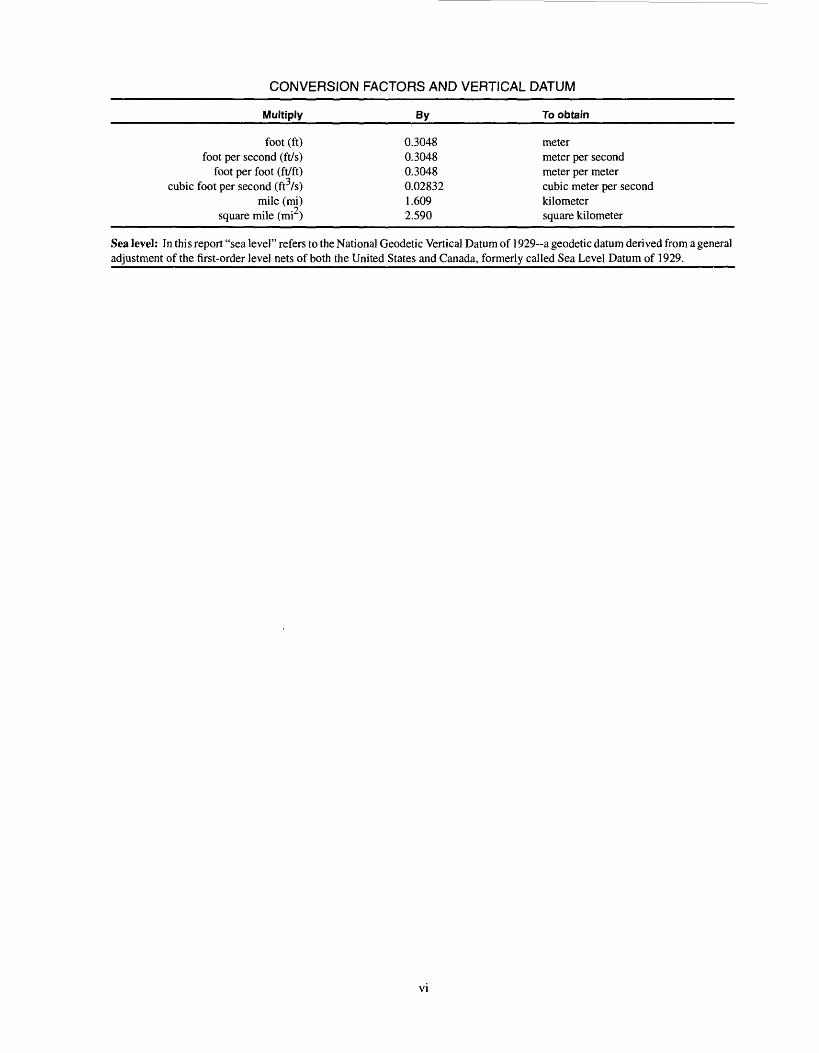
CONVERSION FACTORS AND VERTICAL DATUM
Multiply By To obtain
foot (ft) 0.3048 meterfoot per second (ft/s) 0.3048 meter per second
foot per foot (ft/ft) 0.3048 meter per metercubic foot per second (ft/s) 0.02832 cubic meter per second
mile (mi) 1.609 kilometersquare mile (mi ) 2.590 square kilometer
Sea level: In this report "sea level" refers to the National Geodetic Vertical Datum of 1929~a geodetic datum derived from a general adjustment of the first-order level nets of both the United States and Canada, formerly called Sea Level Datum of 1929.
VI
Estimation of Pier Scour and Channel Stability for Highway Crossings of the Red River in Louisiana
ByJ. Josh Gilbert and Paul A. Ensminger
ABSTRACT
Thirteen bridges that cross the Red River in Louisiana were evaluated for pier scour and channel stability. The analyses performed at each bridge were based on guidelines described in Hydrologic Engineering Circular 18 (HEC 18) and Hydrologic Engineering Circular 20 (HEC 20).
Long-term aggradation and degradation of the channel at the bridge sites were evaluated using historic hydrographic information, aerial photographs, and site inspections. Contraction scour was not present because bridge abutments were landward of the flood protection levee system along the river, or were above the 500-year flood estimate. Pier-scour depth estimates ranged from 3.0 feet at Louisiana Highway 3032 to 47 feet at U.S. Highway 167.
The greatest pier-scour estimate was for Interstate Highway 20 near Shreveport where 38 feet was estimated at the pier at Department of Transportation and Development station 320+85. The greatest channel-bed dynamics was observed at Louisiana Highway 2 near Hosston where thalweg elevations 21 feet deeper than the ambient bed moved laterally across the cross section.
INTRODUCTION
The design, construction, and maintenance of highway crossings over rivers and flood plains require consideration of design variables such as bridge and embankment section lengths, pier spacing, and pile penetration. Bridge design must consider the cost and effort of construction, maintenance, and safety requirements. The Federal Highway Administration requires that all State highway agencies evaluate bridges in the Federal aid system for scour susceptibility. The U.S. Geological Survey (USGS), in cooperation with the Louisiana Department of Transportation and Development (DOTD), began this study in 1991 to evaluate pier scour and channel stability of selected bridges that cross the Red River. One of the bridges evaluated, Louisiana Highway (La. Hwy.) 3032 near Shreveport, is part of the USGS National Bridge Scour Program. Part of the mission of the National Bridge Scour Program is to collect scour data at selected sites in the United States.
The magnitude of the 500-year flood estimate used in the scour analyses was estimated as outlined by the Interagency Advisory Committee on Water Data using a log Pearson Type III distribution. Gagir^ stations along the Red River were individually evaluated to determine their 500-year flood estimate. TH 500-year flood estimates ranged from 249,700 to 386,700 cubic feet per second at the 13 bridge site<\ Water-surface elevations associated with the 500-year flood estimates ranged from 71.1 to 198.6 feet above sea level.
In Louisiana, the reach of the Red River evaluated is primarily a sand-bed stream that ranges in width from 500 to 1,350 feet. Most of this reach is confined by flood protection levees on one or both banks, has a flood plain that ranges in width from 800 to 3,000 feet, and ranges in drainage area from 57,035 to 67,527 square miles. Bank and channel stabilization measures were placed along the river to stabilize the channel as well as to protect facilities along the river from erosion.
Purpose and Scope
This report describes pier scour and channel stability at 13 bridges that cross the Red River in Louisiana. All hydrologic, hydraulic, and hydrographic information used in this evaluation are derived from previously collected data. The bridge, pier, and pile geometry examined in this report are derived from DOTD bridge plans.
Description of Study Area
The Red River originates in eastern New Mexico and flows southeasterly across the Texas panhandle- The distance from the Red River's source to the river's junction with the Atchafalaya River is about 1,200 river miles. The total drainage area of the Red River basin at the mouth is about 93,000 mi2 . Red Rive'- mileage, established by the U.S. Army Corps of Engineers (COE), is measured in an upstream direction beginning at river mile 0.0 (fig. 1).
This analysis focuses on the reach of the Red River from the north Louisiana State line to the river's confluence with the Atchafalaya River at river mile 0.0. Thirteen bridges across the Red River near Moncla, Alexandria, Boyce, Grand Ecore, Coushatta, Shreveport, and Hosston, La. (figs. 1 and 2), were evaluated for scour potential and channel stability. This reach of the river is bounded on one or both banks by levees 800 to 3,000 ft apart, has a main channel that ranges from 500 to 1,350 ft in width at the 13 highway crossings listed in table 1, and has a general flood slope of 0.0001 ft/ft. In this reach, the river cuts through an alluvial deposit that is primarily composed of sand, silt, and clay.
Biedenharn and others (1989) reported that the radius-width ratio of the Red River ranges from 1.5 to 2.0. Nanson and Hickin (1986) stated that the maximum rate of channel migration occurs in rivers with a radius-width ratio of 2 to 3. Although the radius-width ratios on the Red River approaches the lower limit defined by Nanson and Hackin for maximum channel migration, bank stabilization measures placed along the river by the COE and others tend to arrest large scale channel migration. Also, Biedenharn and others (1989) reported that the average channel slope is 0.00013 ft/ft, the median particle size of the bed material is approximately 0.0008 ft (0.25 mm), and the bank material is typically a finer grain with a particle size of approximately 0.0003 ft (0.10 mm). Limited bed samples collected from the Red River in 1983 by the USGS support this range of 0.0003 to 0.0008 ft as the grain size for the bed material and banks.
ACKNOWLEDGMENTS
The assistance of Mr. Jack Manno and Mr. Fred Cifreo of the Louisiana Department of Transportation and Development, and Mr. Fred Pinkard of the U.S. Army Corps of Engineers, Vicksburg District, in providing hydrographic survey information on the Red River is gratefully acknowledged.
94
-93
34'
33"
-
32 31
UN
ION
AR
KA
NS
AS
LO
UIS
IAN
A.
MO
RE
HO
US
E S
EX
PL
AN
AT
ION
HIG
HW
AY
CR
OS
SIN
G
ALE
XA
ND
RIA
! R
AP
I50
KIL
OM
ET
ER
S
Figu
re
1.
Loca
tion
of h
ighw
ay c
ross
ings
alo
ng t
he
Red
R
iver
, Lo
uisi
ana.
EXPLANATION
HIGHWAY CROSSING
0 1 2 MILESI_____i_____i
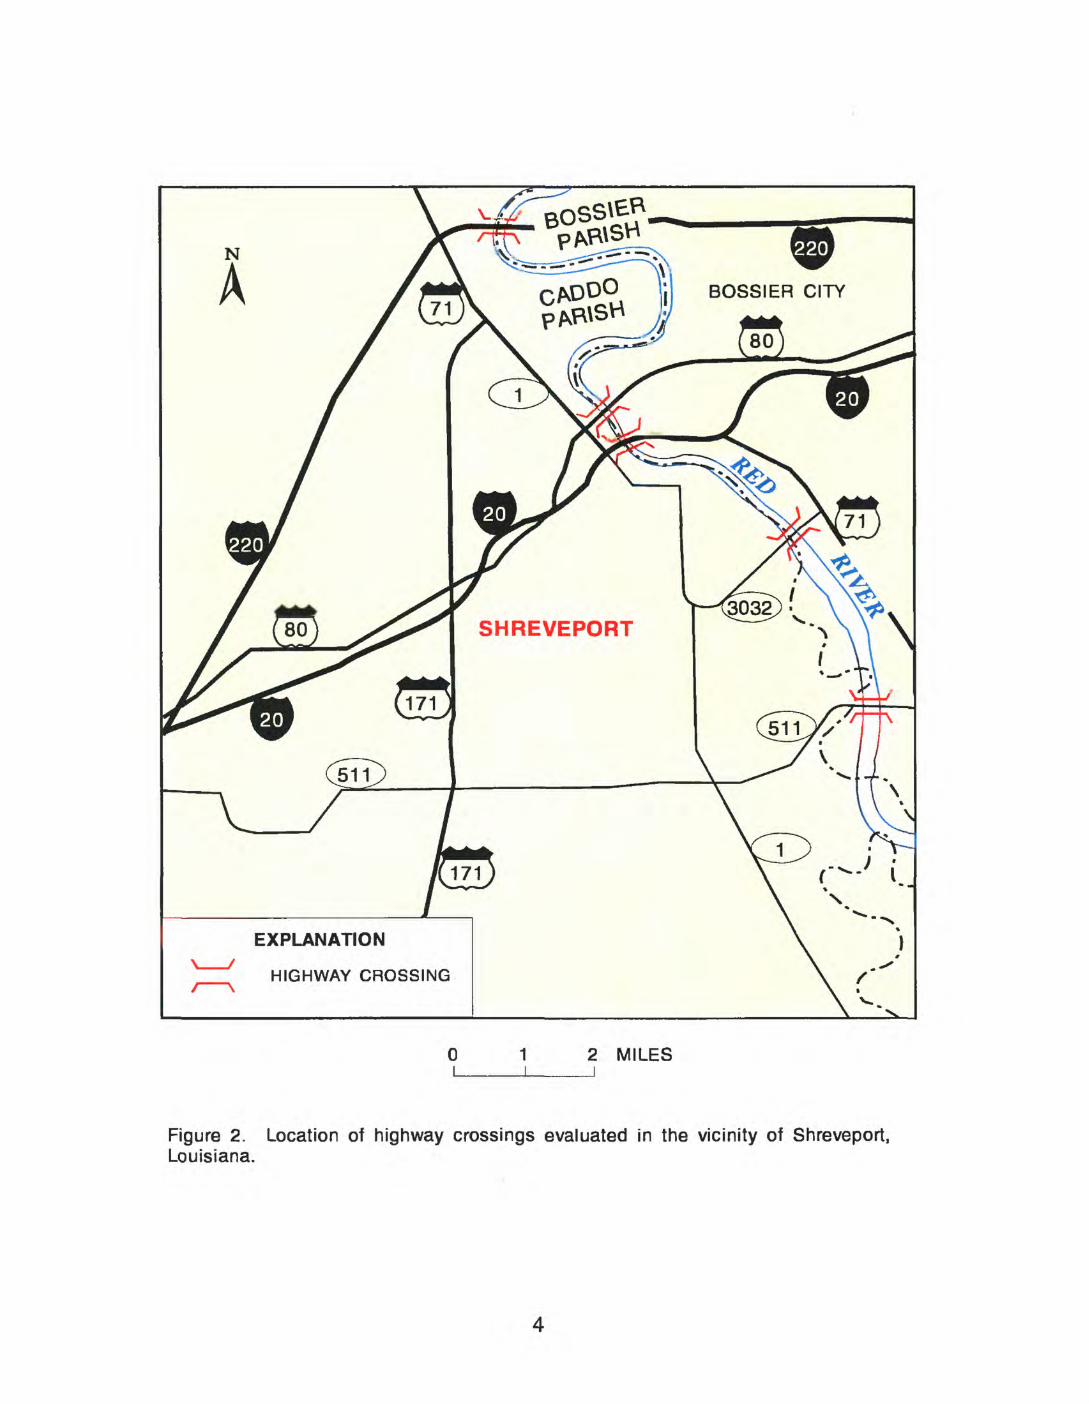
Figure 2. Location of highway crossings evaluated in the vicinity of Shreveport, Louisiana.
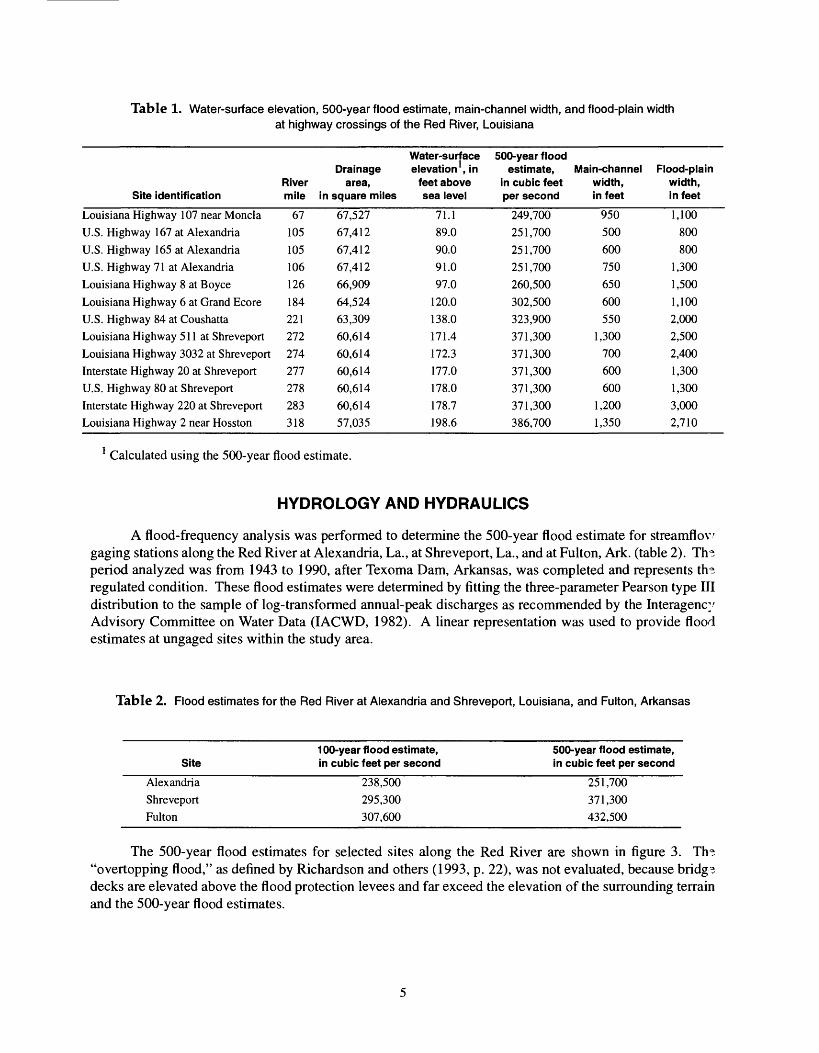
Table 1. Water-surface elevation, 500-year flood estimate, main-channel width, and flood-plain widthat highway crossings of the Red River, Louisiana
Site identification
Louisiana Highway 107 near MonclaU.S. Highway 167 at AlexandriaU.S. Highway 165 at AlexandriaU.S. Highway 71 at AlexandriaLouisiana Highway 8 at BoyceLouisiana Highway 6 at Grand EcoreU.S. Highway 84 at CoushattaLouisiana Highway 5 1 1 at ShreveportLouisiana Highway 3032 at ShreveportInterstate Highway 20 at ShreveportU.S. Highway 80 at ShreveportInterstate Highway 220 at ShreveportLouisiana Highway 2 near Hosston
Drainage River area, mile in square miles
67105105106126
184221272274277278283318
67,52767,41267,41267,41266,90964,52463,30960,61460,61460,61460,61460,61457,035
Water-surface elevation , in
feet above sea level
71.189.090.091.097.0
120.0138.0171.4172.3177.0178.0178.7198.6
500-year flood estimate,
in cubic feet per second
249,700251,700251,700251,700260,500302,500323,900371,300371,300371,300371,300371,300386,700
Main-channel width, in feet
950500600750650
600550
1,300700600600
1,2001,350
Flood-plain width, in feet
1,100800800
1,3001,5001,1002,0002,5002,4001,3001,3003,0002,710
1 Calculated using the 500-year flood estimate.
HYDROLOGY AND HYDRAULICS
A flood-frequency analysis was performed to determine the 500-year flood estimate for streamflov gaging stations along the Red River at Alexandria, La., at Shreveport, La., and at Fulton, Ark. (table 2). Th?, period analyzed was from 1943 to 1990, after Texoma Dam, Arkansas, was completed and represents th? regulated condition. These flood estimates were determined by fitting the three-parameter Pearson type III distribution to the sample of log-transformed annual-peak discharges as recommended by the Interagency Advisory Committee on Water Data (IACWD, 1982). A linear representation was used to provide flood estimates at ungaged sites within the study area.
Table 2. Flood estimates for the Red River at Alexandria and Shreveport, Louisiana, and Fulton, Arkansas
Site100-year flood estimate, in cubic feet per second
500-year flood estimate, in cubic feet per second
Alexandria Shreveport Fulton
238,500295,300307,600
251,700371,300432,500
The 500-year flood estimates for selected sites along the Red River are shown in figure 3. Th?. "overtopping flood," as defined by Richardson and others (1993, p. 22), was not evaluated, because bridg?. decks are elevated above the flood protection levees and far exceed the elevation of the surrounding terrain and the 500-year flood estimates.
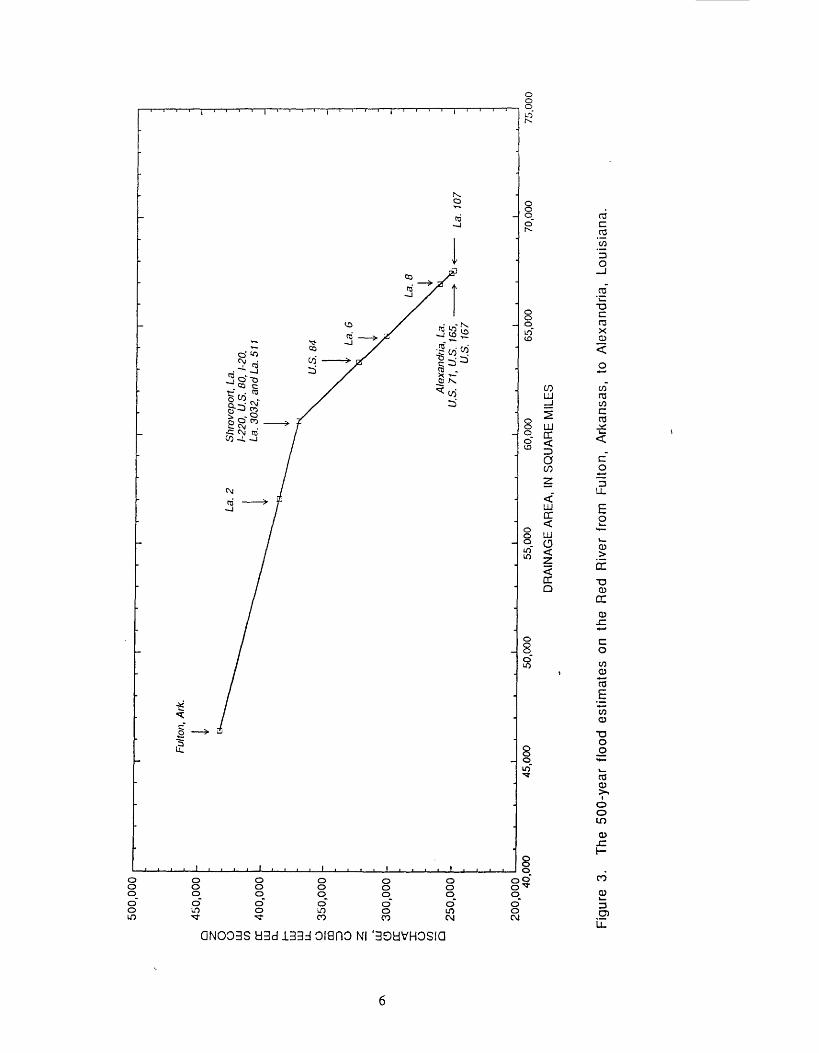
DISCHARGE, IN CUBIC FEET PER SECOND
<QCCD
CO
HCD
cn o oi *<CD
OoQ.
CD
r CD
CD Q.
5CD
CDXCJrjQ. 2. S'
o o
o o o
COo o "o o o
CO cn o "o o o
o o o
Cn o o o o
cn o o "o o o
O o rn §
rn
(S)O C
§ rn
m
A computer program, water-surface profiles (WSPRO) (Shearman and others, 1986), was used to calculate the water-surface elevations for annual-peak discharges of record and for the 500-year flood estimate. In the initial WSPRO analyses, a flood slope between 0.0001 and 0.0004 ft/ft, in conjunction with cross-sectional properties, was used to calculate a starting downstream water-surface elevation. Roughness coefficients ranged from 0.025 to 0.035 in the main channel, and 0.06 to 0.08 on the overbanks. Th~< resulting calculated water-surface elevations at the highway crossings were compared to the observe'! water-surface elevations. Model adjustments were made when necessary to provide adequate calibration cf the WSPRO model results.
SCOUR ANALYSIS
Channel Stability
Historical hydrographic data were examined to evaluate any trends indicating long-term aggradation, degradation, or shifting of the channel at the 13 bridge sites. Channel geometry changes at some sites indicated long-term trends, whereas other sites indicated only the seasonal, relatively low-magnitude, dynamic behavior of the Red River.
The interaction of factors that affect long-term aggradation, degradation, or shifting of the channel are complex and difficult to predict. Migration of river meanders is influenced by factors such as boundary material composition, bank height and angle, and variations in hydrologic and hydraulic conditions. In addition, channel planform and extent of vegetation in the overbank area can influence channel migration. The site-specific mechanisms responsible for bank erosion vary along the Red River. Thorne (1989) note! that bank retreat usually is caused by a combination of flow erosion of intact bank material and mass failure of the bank due to gravity, followed by removal of the material from the bank toe. Regardless of the mechanism, bed-form changes are ultimately a function of the hydraulic process, which is largely determined by the planform and flow geometry. In this report, an evaluation of potential aggradation, degradation, or shifting of the bed was based on the historic observed channel changes. The greatest amount of historical hydrographic information was at the U.S. Hwy. 80 at the Shreveport, La., crossing where five independent cross sections measured in 1931, 1932, 1969, 1980, and 1992 were evaluated.
The examination of channel-bed elevations at an individual site over time can indicate fairly substantial bed changes between individual surveys, but changes noted between two surveys may not appear substantial when compared to many surveys. The most notable example of this would be a comparison of two hydrographic surveys, one performed during low-flow conditions, and the other during high-flow conditions. For sites addressed in this report, the channel conditions from the COE calibration data set were initially used for analysis. The site was then evaluated using the most recent observed bridge section.
Contraction and Abutment Scour
In general, 13 bridges are elevated on piles above the top of the levee, with no embankment fill material riverward of the levee. Given this type of structure and flow conditions, there is no contraction due to encroachments; therefore, no contraction or abutment scour is present. The fixed-bed hydraulics were not modified to reflect contraction-scoured conditions, but were represented by the most applicable hydrographic survey. Accumulation of debris on the bridge and pier structure is expected to be minimal at the 13 bridge sites, based on the performance of similar structures in this flow environment.
Pier Scour Equation
Local scour at the pier locations is calculated using the Colorado State University equation (modified from Richardson and others, 1993, eq. 2).
y/yj = 2.0 x Kj x K2 x K3 x (a/yi ) °'65 x (Fr) °'43 , (:.)
y = GSE-y, (2)
where ys = estimated depth of pier scour, in feet;yj = flow depth directly upstream of the pier, in feet; Kj = dimensionless correction factor for pier nose shape; K2 = dimensionless correction factor for skew; K3 = dimensionless correction factor for bed form;
a = width of pier, in feet; Fr = Froude number;yd = channel-bed elevation of the computed scour hole, in feet above sea level; and
GSE = observed ambient ground-surf ace (channel-bed) elevation, in feet above sea level.
The value for yj at each pier was based upon the difference between the computed water-surface elevation and the most appropriate ground-surf ace elevation. The minimum channel-bed elevation historically observed at that location, or the potential channel-bed elevation may be chosen as the mo^t appropriate ground-surface information. The values for Kj, K2, and K3 were taken from values recommended by Richardson and others (1993, p. 39-40) for pier geometry as represented on DOTD bridge plans. The Froude number at the pier location is based upon the value of velocity, which was computed using WSPRO.
HIGHWAY CROSSINGS OF THE RED RIVER IN LOUISIANA
Louisiana Highway 107 near Moncla, Louisiana
The COE maintains a gage at the La. Hwy. 107 bridge crossing the Red River near Moncla and has recorded the stage of the Red River from 1935 to 1985. The peak stage of record was 70.9 ft above sea level and occurred in 1935. For the 51 years of stage record, five peak stages exceeded 68 ft above sea level. Although the peak-stage data cover 50 years, there are only 5 years of flood-discharge record (1938-42). The maximum discharge measured during the 5 years was 168,000 ft /s in 1942, with a flood stage of 68.5 ft above sea level. The limited flood-discharge data near Moncla are not sufficient to determine flood-frequency estimates.
The starting downstream water-surface elevation must be specified at 70.0 ft above sea level for computed water-surface elevations from WSPRO to match the recorded historical stage elevations. This is an increase of 10.0 ft more than the slope conveyance starting water-surface elevation of approximately 60.0 ft above sea level. The increased stage recorded in gage records is most likely due to backwater fro*n Black River.
Pier Scour
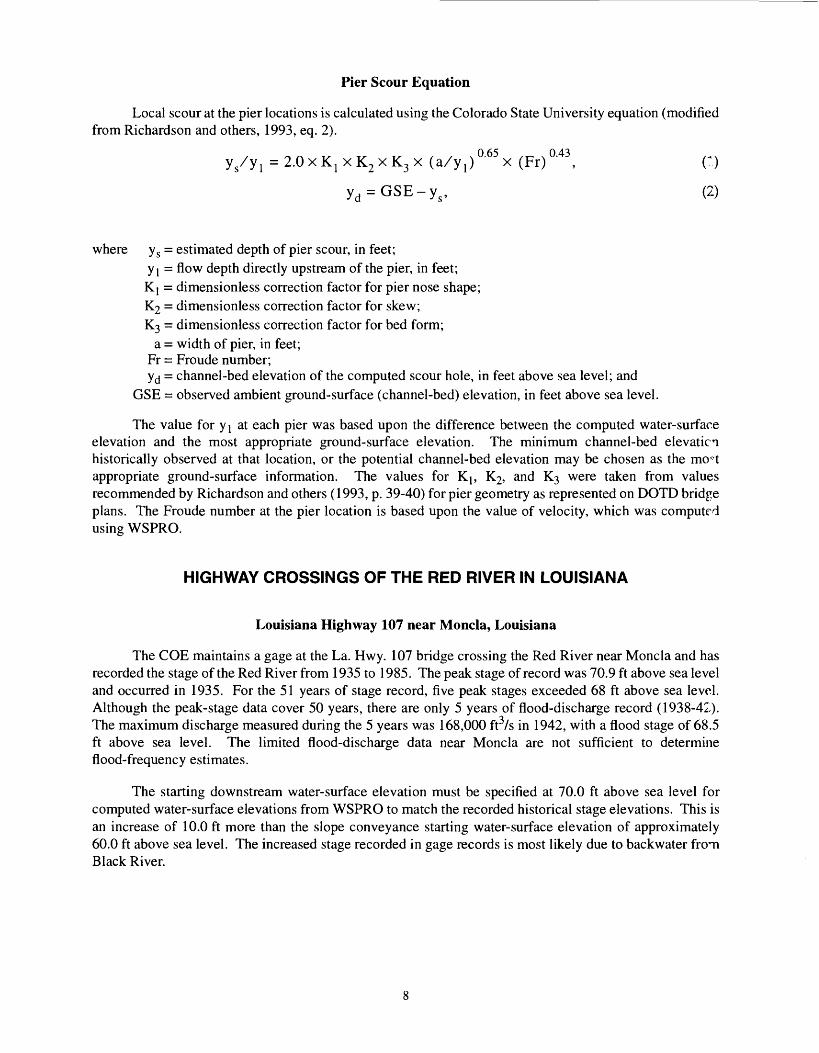
The results of the hydraulic simulations indicate that a discharge of 249,700 ft3/s (table 1) produces a water-surface elevation of 71.1 ft above sea level (table 3), an energy gradeline with a slope of approximately 0.00002, and Froude numbers ranging from 0.10 to 0.35 along the cross section. TH main-span pier geometry is a sharp-nosed pier, 12 ft wide and 44 ft long. Values of y± were based on tH COE survey of 1968. Values of K t , K2, and K3 are 1.0, 1.0, and 1.1, respectively, recommended by Richardson and others (1993, p. 39-40), and Lagasse and others (1991). The width of the scour holes was based on the recommendations by Richardson and others (1991, p. 28) of a bed width of 5 ft greater than the pier width, and a top width of 2.75 x ys . For the spacing between the piers, no scour holes overlapped.
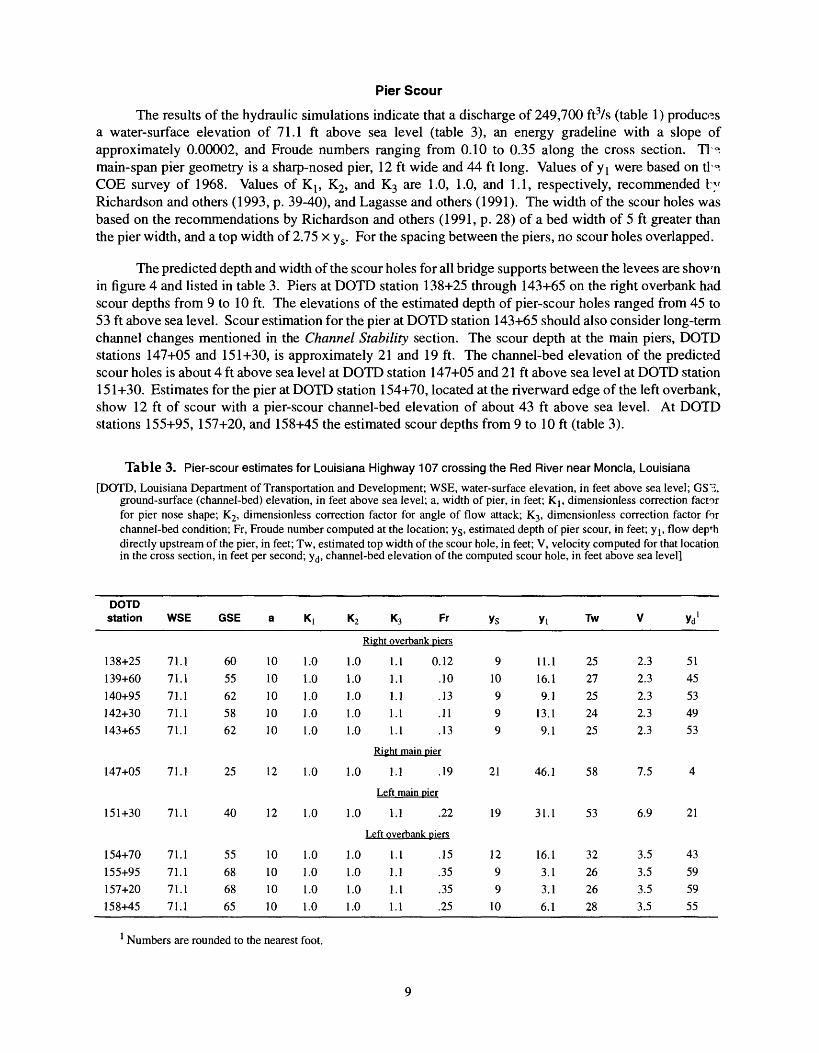
The predicted depth and width of the scour holes for all bridge supports between the levees are shown in figure 4 and listed in table 3. Piers at DOTD station 138+25 through 143+65 on the right overbank had scour depths from 9 to 10 ft. The elevations of the estimated depth of pier-scour holes ranged from 45 to 53 ft above sea level. Scour estimation for the pier at DOTD station 143+65 should also consider long-term channel changes mentioned in the Channel Stability section. The scour depth at the main piers, DOTD stations 147+05 and 151+30, is approximately 21 and 19 ft. The channel-bed elevation of the predicted scour holes is about 4 ft above sea level at DOTD station 147+05 and 21 ft above sea level at DOTD station 151+30. Estimates for the pier at DOTD station 154+70, located at the riverward edge of the left overbank, show 12 ft of scour with a pier-scour channel-bed elevation of about 43 ft above sea level. At DOTD stations 155+95, 157+20, and 158+45 the estimated scour depths from 9 to 10 ft (table 3).
Table 3. Pier-scour estimates for Louisiana Highway 107 crossing the Red River near Moncla, Louisiana
[DOTD, Louisiana Department of Transportation and Development; WSE, water-surface elevation, in feet above sea level; GS'ii, ground-surface (channel-bed) elevation, in feet above sea level; a, width of pier, in feet; Kj, dimensionless correction factor for pier nose shape; K2, dimensionless correction factor for angle of flow attack; K3 , dimensionless correction factor for channel-bed condition; Fr, Froude number computed at the location; y^, estimated depth of pier scour, in feet; yj, flow dep*h directly upstream of the pier, in feet; Tw, estimated top width of the scour hole, in feet; V, velocity computed for that location in the cross section, in feet per second; yd , channel-bed elevation of the computed scour hole, in feet above sea level]
DOTD station WSE GSE a KI K2 K3 Fr YS Yi Tw V Yd 1
Right overbank piers
138+25
139+60140+95142+30143+65
71.171.171.171.171.1
6055625862
1010101010
1.01.01.01.01.0
1.0 1.11.0 1.11.0 1.11.0 1.11.0 1.1
0.12.10.13.11.13
910999
11.116.19.1
13.19.1
2527252425
2.32.32.32.32.3
5145534953
Right main pier
147+05 71.1 25 12 1.0 1.0 1.1 .19 21 46.1 58 7.5 4
Left main pier
151+30 71.1 40 12 1.0 1.0 1.1 .22 19 31.1 53 6.9 21
Left overbank piers
154+70
155+95157+20158+45
71.171.171.171.1
55686865
10101010
1.01.01.01.0
1.0 1.11.0 1.11.0 1.11.0 1.1
.15
.35
.35
.25
1299
10
16.13.13.16.1
32262628
3.53.53.53.5
43
595955
Numbers are rounded to the nearest foot.
£U
U
150
_i
§ CO 1 ti 10°
HI
LL.
Z ELEVATION
50
0
- - - ~
17
,00
0
i .
. .
. |
. ,
. .
| ,,,,,,,,,
| . ,.,,,.,,,.,
EX
PLA
NA
TIO
N
1969
, u
ep
aim
ieiii
ui
i lanspuiiauuii
w
ov->
wu
n ti_
[zvr\
i iw
ix
, Cor
ps o
f E
ngin
eers
-
-
1
988,
Dep
artm
ent o
f Tra
nspo
rtatio
n-- -
- 1
990
X/^ 1
Cl
S\
CT
1_L.I~
1
BA
NK
,
16,5
00
, Dep
artm
ent o
f Tra
nspo
rtatio
n
. - -
^1
^
Q) 8 0) -J A*
^r--
-
V \
+ \' \\\
1 '
j-s
Brid
ge/ P
ier
ys
*" 6
IS IJ 11 1 u
~~«
. r
~-~>
A w.
\ ^/
/de
ck
t
\ /IJ
"
>
<K- .
//'
\.Q)
\.
i \
^
^K
A^ )
: ~"
RIG
HT
BA
NK
vt^^
-^I*'
1 ....
1 , ...
1 ....
1 ....
1 ....
1 ....
16,0
00
15,5
00
15,0
00
14
,50
0
14,0
00
13,5
00
13,0
DE
PA
RT
ME
NT
OF
TR
AN
SP
OR
TA
TIO
N S
TA
TIO
NIN
G,
IN F
EE
T
Figu
re 4
. C
ompa
rativ
e cr
oss
sect
ions
and
pie
r-sc
our
estim
ates
at
Loui
sian
a H
ighw
ay 1
07 c
ross
ing
near
Mon
cla,
Lo
uisi
ana.
Channel Stability
A comparison of the historic hydrographic information in the vicinity of Moncla using the COE hydrographic survey of 1969 and 1990 indicates the river bed degraded about 5 ft during the 20-year period. Additional cross-sectional information was taken from limited hydrographic surveys performed by DOTD. A comparison of the DOTD surveys of 1988 and 1990 (fig. 4) indicates channel-bed elevations in 1990 were approximately 5 ft lower at one location, but were unchanged at other locations. The observed channel-bed fluctuations could result from a combination of the normal dynamic behavior of the river channel over a wide range of streamflows, and the local effect of the rock dike on the channel cross section (fig. 4). Although local scouring, filling, and transient bed forms alter channel depth periodically, the long-term minimum channel-bed elevation may be relatively stable at 25 ft above sea level, and neither aggrading nor degrading substantially.
An important significant factor affecting channel geometry is the COE system of alternating revetments that armor the bed and banks of the Red River where the flow impinges on the bank. A revetment is a series of concrete slabs wired together into a mattress, resembling a giant Venetian blind, to protect against erosion from the top bank to the thalweg. These longitudinally placed revetments effectively reinforce the desired bank. A revetment of this type, in addition to a rock dike, is on the left bank near Moncla.
The aerial photographs taken by DOTD, October 5, 1987 (fig. 5), and November 1, 1988 (fig. 6), show the location of the rock dike along the left bank. Under normal flow conditions, this rock dike near Moncla may facilitate deposition of the coarser suspended sediments in the area landward of the dike. The aerial photographs indicate some deposition behind the rock dike.
Continued maintenance of the current rock dike and revetment may prevent the meander from shifting and eroding the left bank. Eventually, stabilizing vegetation may grow between the dike and bark to further protect the left bank. If a flood breaches the rock dike and revetment prior to growth of soil-stabilizing vegetation, the newly deposited material will erode substantially. The left bank landward of the tree line appears stable from aerial photographs; this stability indicates that the bank around the pier at DOTD station 155+95 may not be readily susceptible to erosion.
Lateral stability assessment was based on data from limited hydrographic records, aerial photographs (figs. 5 and 6), and field inspection. The DOTD cross sections at La. Hwy. 107 (fig. 4) indicate the dynamics of the channel bed, but the shape and position of main channel is generally unchanging. The 1988 and 1990 DOTD surveys show a reduction in channel-bed elevation of approximately 5 ft at the low point in the cross sections (fig. 4). Although the DOTD surveys are limited in extent on the right bank, and provide information on only the riverward edge of the right bank, other indications of right-bank instability were evident from visual inspection in 1990. Large trees, old fence lines, and part of the right bank had fallen into the river. Crescent-shaped sections of the right bank showed recent slumping and mass wasting. The extent of right-bank degradation is uncertain; however, the rock dike has reduced the medium- to low-water width of the river. Before the placement of the rock dike, the width of the Red River main channel for medium flows near Moncla was about 900 ft (figs. 5 and 6), compared to the width of 700 ft after the dike construction. The rock dike is about 300 ft from the mature tree line on the left bank. Extending the median 900-foot width channel from the rock dike is a rough indicator of the potentially erodible area of the righ* bank. If this bank material eroded, piers at DOTD stations 142+30 and 143+65 could be susceptible to scour. Given the potential for erosion on the right bank an estimate of approximately 20 ft of scour, at DOTD station 143+65, referenced from the existing ground surface, could be considered based on estimates for the main channel piers.
11
Phot
o so
urce
- Lo
uisi
ana
Dep
artm
ent o
f Tra
nspo
rtatio
n an
d D
evel
opm
ent
Figu
re 5
. A
eria
l ph
otog
raph
of
the
Loui
sian
a H
ighw
ay 1
07 c
ross
ing
of t
he R
ed R
iver
nea
r M
oncl
a, L
ouis
iana
, O
ctob
er 5
, 19
87.
Photo source: Louisiana Department of Transportation and Development
Figure 6. Aerial photograph of the Louisiana Highway 107 crossing of the Red River near Moncla, Louisiana, November 1, 1988.
13
U.S. Highways 167,165, and 71 at Alexandria, Louisiana
Flood-frequency estimates based on gaging station records for the Red River at Alexandria indicate a 500-year flood estimate of 251,700 ft3/s (fig. 3, table 1). The computed water-surface elevation associated with this discharge is approximately 89.5 and 89.0 ft above sea level for the reach representing U.S. Hwy. 167 and the proposed U.S. Hwy. 167, respectively (table 4). The computed water-surface elevations for U.S. Hwy. 165 and 71 are 90.0 and 91.0 ft above sea level. Three floods that have been recorded at Alexandria since 1945 had discharges that ranged from 200,000 to 233,000 ft3/s. The discharge of 233,000 ft3/s has a flood having a recurrence interval of slightly less than 100 years, and corresponds with a water-surface elevation of 89.5 ft above sea level recorded at U.S. Hwy. 165.
The model reach for evaluation of the bridges extends from downstream of U.S. Hwy. 167 to upstream of U.S. Hwy. 71. The width of the channel ranges from approximately 500 to 750 ft throughout the reach. The minimum channel-bed elevations for the cross sections ranged from 13 to 26 ft above s?a level. The downstream starting elevation for computations using WSPRO was 89 ft above sea level. This starting elevation is slightly higher than the starting elevation using a downstream boundary specification of a slope of 0.0001, but yields computed water-surface elevations that more closely fit the peaks of record. The WSPRO simulations indicate an energy gradeline slope of approximately 0.0001, and velocities ranging from 1.2 to 9.6 ft/s along the cross sections at the bridges (table 4).
U.S. Highway 167 at Alexandria, Louisiana
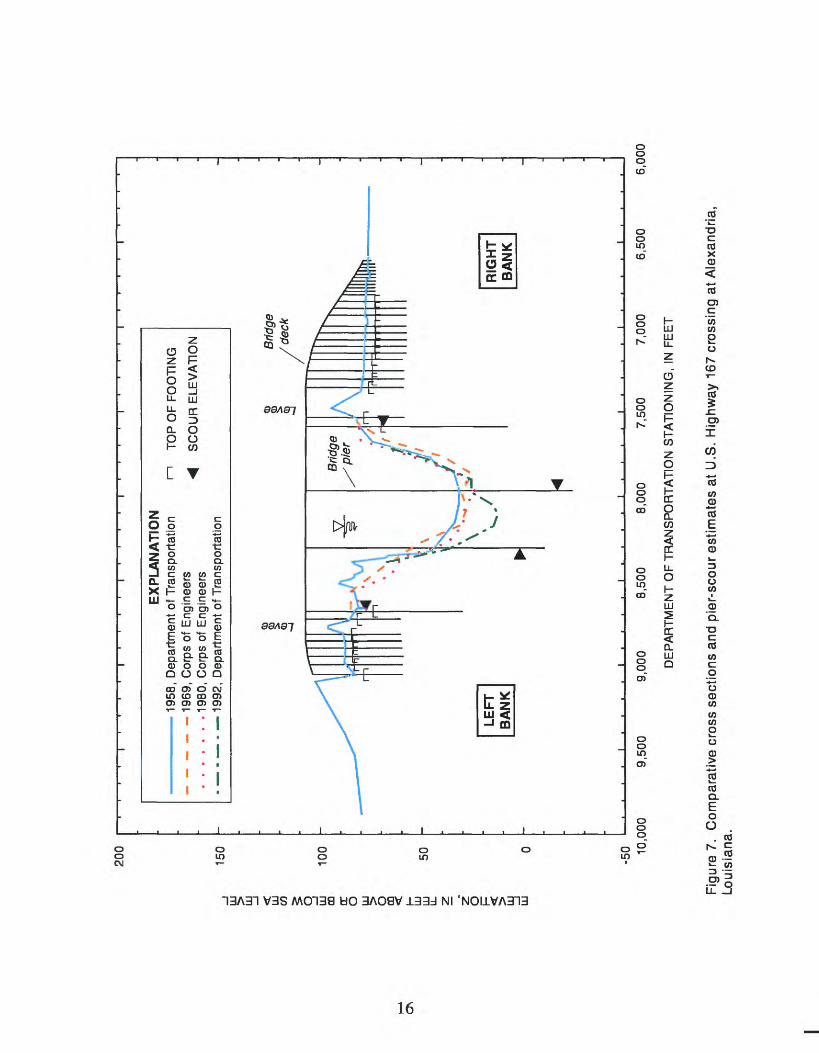
Pier Scour
To evaluate pier scour at U.S. Hwy. 167, values for yj at each pier were based on the DOTD hydrographic survey of 1992. The cross section used for analysis of U.S. Hwy. 167 represents minimum channel-bed elevations of the sections shown in figure 7. The computed scour depths ranged from 9.2 to 47.0 ft, 74 to -17 ft above sea level at the base of the pier-scour hole (table 4). Channel-bed elevations decreased about 10 ft locally between the 1980 and 1992 surveys. This decrease is substantial, compared to the small change during three previous surveys over a 34-year period (1958-92).
The right overbank pier at DOTD station 75+09, had an estimated scour depth of 11.9 ft, which corresponds to a channel-bed elevation of 68 ft above sea level (fig. 7, table 4). The greatest scour depth estimated was 47.0 ft at the right main pier (DOTD station 78+83), and the corresponding channel-bed elevation was 17 ft below sea level. Scour estimated at the left main pier at DOTD station 82+17 is 40.7 ft, and the channel-bed elevation is 1 ft below sea level. The estimated scour depth for these two main channel piers is approximately 10 ft from the elevation of the bottom of the piers shown on DOTD bridge plans.
Channel Stability
Hydrographic surveys of 1958, 1969, and 1980 (fig. 7) do not indicate any substantial trends or changes in the channel at the U.S. Hwy. 167 bridge. The survey performed by the DOTD in 1992 indicates a deepening of the thalweg. It is not known whether the channel change represents anew channel condition, or is transient and short term. The channel-bed elevations from the 1980 and prior surveys range from 28 to 32 ft above sea level. The minimum channel-bed elevation from the 1992 survey is approximately 13 ft above sea level.
14
Table 4. Pier-scour estimates for U.S. Highways 167,165, and 71 crossing the Red River at Alexandria, Louisiana
[DOTD, Louisiana Department of Transportation and Development; WSE, water-surface elevation, in feet above sea level; GSE, ground-surface (channel-bed) elevation, in feet above sea level; a, width of pier, in feet; Kj, dimensionless correction factor for pier nose shape; K2, dimensionless correction factor for angle of flow attack; K3 , dimensionless correction factor for channel-bed condition; Fr, Froude number computed at the location; ys , estimated depth of pier scour, in feet; y ls approach flow depth directly upstream of the pier, in feet; Tw, estimated top width of the scour hole, in feet; V, approach velocity computed for that location in the cross section, in feet per second; yd , channel-bed elevation of the computed scour hole, in feet above sea level]
DOTD station
75+0978+8382+1785+91
WSE
89.589.589.589.5
GSE
80304083
a
12404012
K,
U.S
1.0
1.01.01.0
K2
. Highway 167
1.0
1.0
1.0
1.0
K3 Fr Ys Yi Tw V Yd'
. bridge at Fulton Street
1.
1.
1.
1.
U.S. Highway 167.
103+09104+86107+31
110+61113+06113+95114+85
106+62108+152
111+47113+08113+90114+70
89.089.089.089.089.089.089.0
90.090.090.090.090.090.0
81602450857880
603050858079
8101212
888
52525
555
1.01.01.01.01.01.01.0
1.01.01.0
1.01.01.0
1.0
1.0
1.0
1.0
1.0
1.0
1.0
U.S. Highway
1.0
1.0
1.0
1.0
1.0
1.0
1.
1.
1.
1.
1.
1.
1.
165.
1.
1.
1.
1.
1.
1.
1 0.20 11.91 .17 47.01 .14 40.71 .15 9.2
proposed bridge
1 .21 9.0
1 .11 12.4
1 .16 21.71 .16 18.01 .19 6.71 .11 7.71 .12 7.5
. Jackson Street
1 .11 8.9
1 .18 35.9
1 .23 34.4
1 .17 5.11 .12 5.61 .11 5.6
9.059.049.0
6.0
8.029.064.0
39.04.0
11.09.0
30.060.040.0
5.010.011.0
3312911225
25346050182121
229995141516
3.47.45.62.1
3.43.47.4
5.62.12.12.1
3.58.08.22.12.12.1
68-17
-1
74
7248
332787073
52-6
168074
73
U.S. Highway 71. O.K. Alien Bridge
114+25
119+26120+88121+91122+93
91.091.091.091.091.0
7037828080
1212121212
1.01.01.01.01.0
1.0
1.0
1.0
1.0
1.0
1.
1.
1.
1.
1.
1 .08 10.11 .23 21.61 .07 6.91 .06 7.11 .06 7.1
21.054.0
9.011.011.0
2859192020
2.29.61.21.21.2
6015757373
1 Numbers are rounded to the nearest foot.2 Pier armored with riprap, scour estimate is for the condition with no riprap in place.
15
200
LU LU
CO I LU m DC o o m LU
LL O I y LU
150
100
50
EX
PL
AN
AT
ION
1958
, D
epar
tmen
t of
Tra
nspo
rtatio
n 19
69,
Cor
ps o
f E
ngin
eers
19
80,
Cor
ps o
f E
ngin
eers
19
92,
Dep
artm
ent
of T
rans
porta
tion
TO
P O
F F
OO
TIN
G
SC
OU
R E
LEV
AT
ION Brid
ge
/deck
Brid
ge
^p
ier
-50 10
,000
9,50
0 9,
000
8,50
0 8,
000
7,50
0 7,
000
DE
PA
RT
ME
NT
OF
TR
AN
SP
OR
TA
TIO
N S
TA
TIO
NIN
G,
IN F
EE
T
6,50
06,
000
Figu
re 7
. C
ompa
rativ
G c
ross
sec
tions
and
pie
r-sc
our
estim
ates
at
U.S
. H
ighw
ay 1
67 c
ross
ing
at A
lexa
ndria
, Lo
uisi
ana.
U.S. Highway 167 (Proposed) at Alexandria, Louisiana
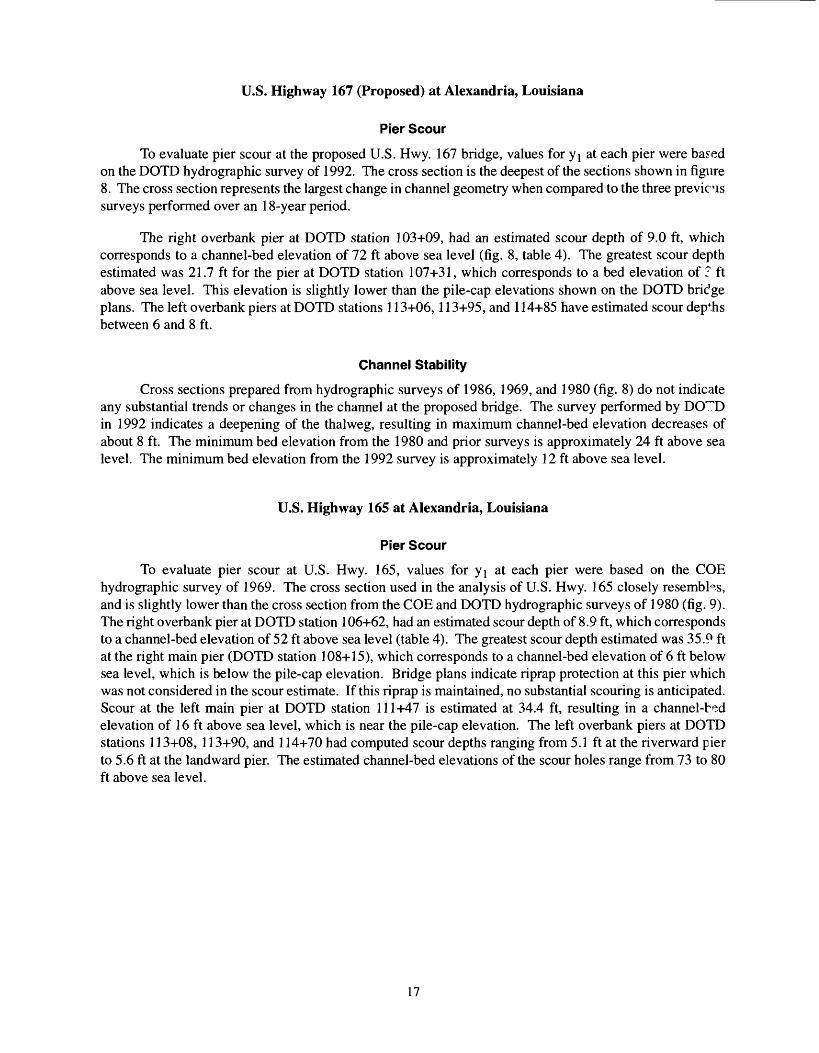
Pier Scour
To evaluate pier scour at the proposed U.S. Hwy. 167 bridge, values for yj at each pier were based on the DOTD hydrographic survey of 1992. The cross section is the deepest of the sections shown in figure 8. The cross section represents the largest change in channel geometry when compared to the three previews surveys performed over an 18-year period.
The right overbank pier at DOTD station 103+09, had an estimated scour depth of 9.0 ft, which corresponds to a channel-bed elevation of 72 ft above sea level (fig. 8, table 4). The greatest scour depth estimated was 21.7 ft for the pier at DOTD station 107+31, which corresponds to a bed elevation of: ft above sea level. This elevation is slightly lower than the pile-cap elevations shown on the DOTD bridge plans. The left overbank piers at DOTD stations 113+06,113+95, and 114+85 have estimated scour depths between 6 and 8 ft.
Channel Stability
Cross sections prepared from hydrographic surveys of 1986, 1969, and 1980 (fig. 8) do not indicate any substantial trends or changes in the channel at the proposed bridge. The survey performed by DO'D in 1992 indicates a deepening of the thalweg, resulting in maximum channel-bed elevation decreases of about 8 ft. The minimum bed elevation from the 1980 and prior surveys is approximately 24 ft above sea level. The minimum bed elevation from the 1992 survey is approximately 12 ft above sea level.
U.S. Highway 165 at Alexandria, Louisiana
Pier Scour
To evaluate pier scour at U.S. Hwy. 165, values for yj at each pier were based on the COE hydrographic survey of 1969. The cross section used in the analysis of U.S. Hwy. 165 closely resembles, and is slightly lower than the cross section from the COE and DOTD hydrographic surveys of 1980 (fig. 9). The right overbank pier at DOTD station 106+62, had an estimated scour depth of 8.9 ft, which corresponds to a channel-bed elevation of 52 ft above sea level (table 4). The greatest scour depth estimated was 35.9 ft at the right main pier (DOTD station 108+15), which corresponds to a channel-bed elevation of 6 ft below sea level, which is below the pile-cap elevation. Bridge plans indicate riprap protection at this pier which was not considered in the scour estimate. If this riprap is maintained, no substantial scouring is anticipated. Scour at the left main pier at DOTD station 111+47 is estimated at 34.4 ft, resulting in a channel-bed elevation of 16 ft above sea level, which is near the pile-cap elevation. The left overbank piers at DOTD stations 113+08, 113+90, and 114+70 had computed scour depths ranging from 5.1 ft at the riverward pier to 5.6 ft at the landward pier. The estimated channel-bed elevations of the scour holes range from 73 to 80 ft above sea level.
17
ex
150
y <
100
CO LU rH
50
z
o 1 -50
-80 12
,000
EX
PL
AN
AT
ION
1
986,
Dep
artm
ent
of T
rans
port
atio
n 1
969,
Cor
ps o
f E
ngin
eers
1
980,
Cor
ps o
f E
ngin
eers
1
992,
Dep
artm
ent
of T
rans
port
atio
n
1-1
TO
P O
F F
OO
TIN
G
<<
SC
OU
R E
LEV
AT
ION
Brid
ge
deck
11,5
00
11,0
00
10,5
00
DE
PA
RT
ME
NT
OF
TR
AN
SP
OR
TA
TIO
N S
TA
TIO
NIN
G,
IN F
EE
T
10,0
00
Figu
re 8
. C
ompa
rativ
e cr
oss
sect
ions
and
pie
r-sc
our
estim
ates
at
prop
osed
Lou
isia
na H
ighw
ay 1
67 c
ross
ing
at
Ale
xand
ria,
Loui
sian
a.

150
s a LJJ
CO 9 LU
GO QC
O
LU O LU
LU Z a LU
100
50 -30
EX
PL
AN
AT
ION
1980
, D
epar
tmen
t of
Tra
nspo
rtatio
n 19
69,
Cor
ps o
f E
ngin
eers
19
80,
Cor
ps o
f E
ngin
eers
TO
P O
F F
OO
TIN
G
SC
OU
R E
LEV
AT
ION
Brid
ge
deck
11,8
0011
,500
11
,000
DE
PA
RT
ME
NT
OF
TR
AN
SP
OR
TA
TIO
N S
TA
TIO
NIN
G,
IN F
EE
T
10
,50
0
Figu
re 9
. C
ompa
rativ
e cr
oss
sect
ions
and
pie
r-sc
our
estim
ates
at
U.S
. H
ighw
ay 1
65 c
ross
ing
at A
lexa
ndria
, Lo
uisi
ana.
Channel Stability
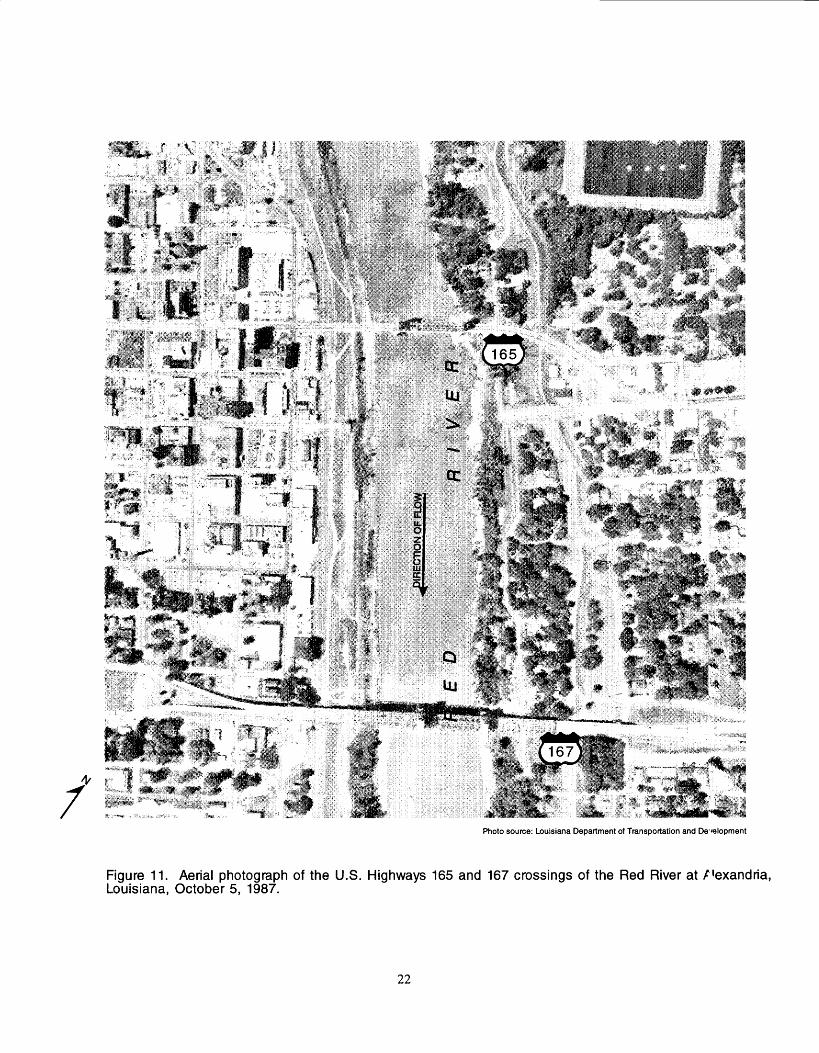
Hydrographic surveys of 1969 and 1980 at the U.S. Hwy. 165 bridge do not indicate any substantial trends or changes in the channel. The lowest channel-bed elevations occur at the right main pier of th~. bridge. The differences indicated between the COE and DOTD surveys of 1980 can be attributed to miner differences in where the cross section was measured. The DOTD survey is performed at the highway crossing, and the COE cross section is a surveyed cross section nearest to the bridge location. Th~, channel-bed elevations from the surveys range from 21 to 25 ft above sea level. The top of the footing at the right main pier is 18 ft above sea level. The layer of bed material covering the right main pier footing appears stable from the hydrographic information, but the scour estimates from the previous paragraph indicate the potential removal of this material, exposing the footing. Aerial photographs taken in 1977 an! 1987 (figs. 10 and 11) show no substantial changes of alignment.
U.S. Highway 71 at Alexandria, Louisiana
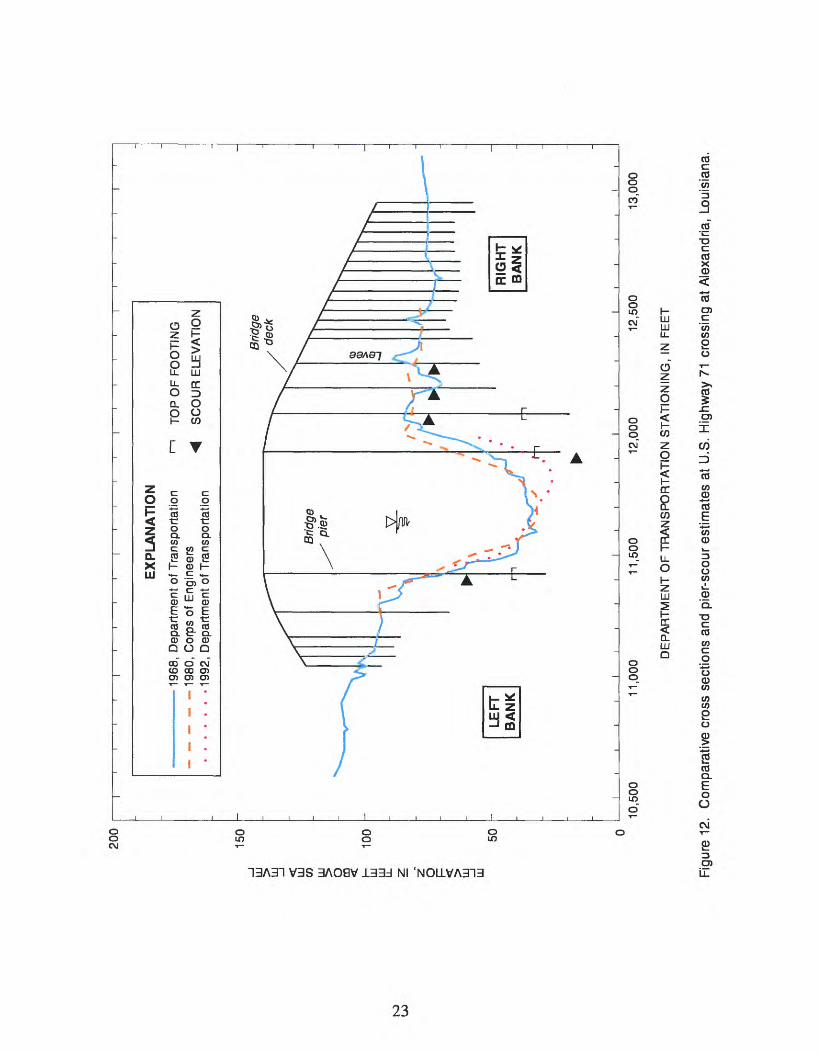
Pier Scour
To evaluate pier scour at U.S. Hwy. 71, values for y^ at each pier were based on the DOTD hydrographic survey of 1992. The cross section represented by the 1992 DOTD survey indicates decrease-! channel-bed elevations near the right main pier (fig. 12). Values for Kpl.O, K2=1.0, and K3=l.l were based on DOTD bridge plans and recommendations presented by Richardson and others (1993, p. 39-40). The Froude number at the pier location is based upon the value of velocity, which was computed using WSPRO.
The maximum computed pier scour depth was 21.6 ft at the right main pier (DOTD station 119+26) (table 4). The elevation of the bed at the computed scour hole is 15 ft above sea level. The elevation of the top of the footing for this pier is 35 ft above sea level. This scour estimate is well below the designed top of footing. The left main pier is at DOTD station 114+25, where channel-bed elevations are higher than at the right main pier. The scour depth for the left main pier is 10.1 ft, and the elevation of the bed of the scour hole is 60 ft above sea level. The left overbank piers are above the water surface for the 500-year flood estimate, consequently no scour computations were performed for the left overbank piers. There are three piers on the right bank at DOTD stations 120+88, 121+91 and 122+93. For these three piers the scour depths range from 6.9 to 7.1 ft, and the corresponding channel-bed elevations of the estimated scour holes range from 73 to 75 ft above sea level.
Channel Stability
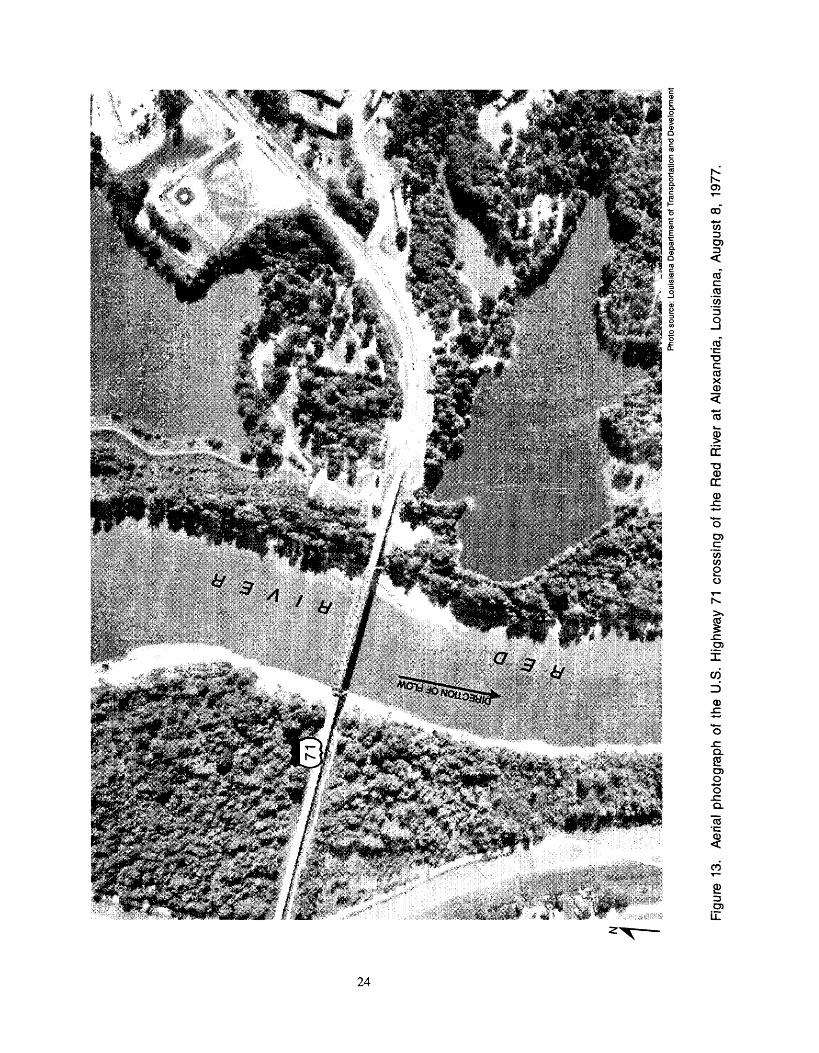
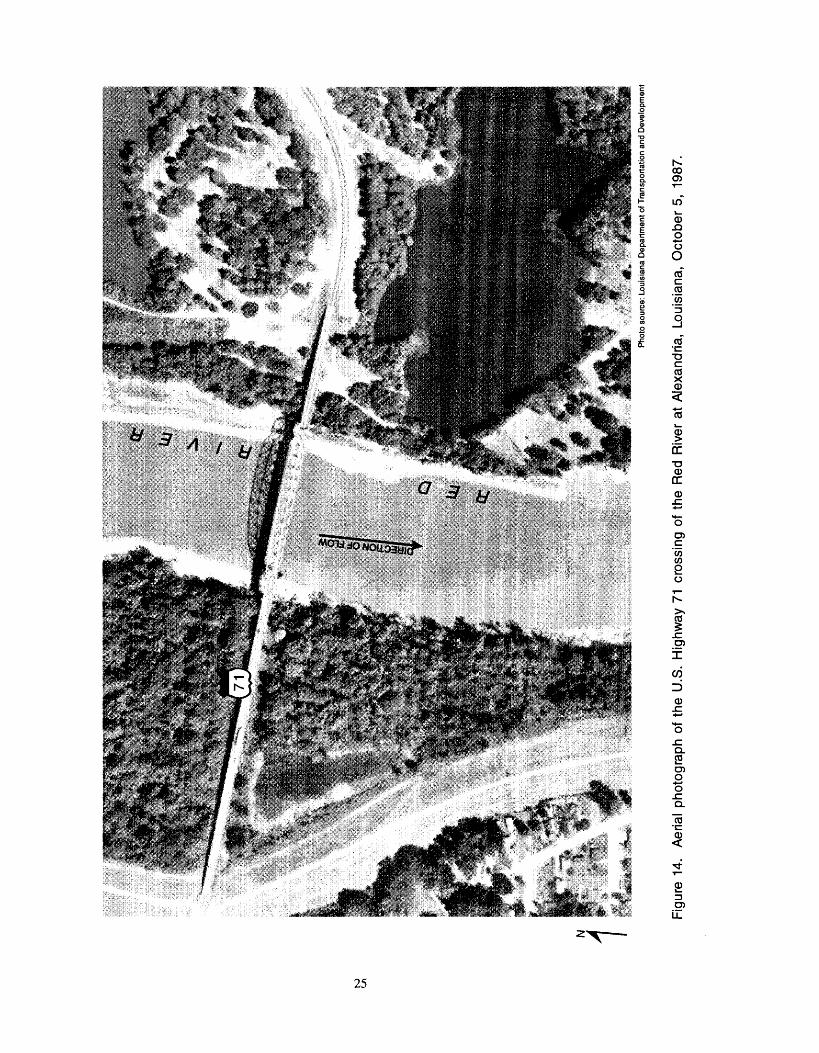
The hydrographic surveys of 1968 and 1980 show little dynamic activity of the river bed (fig. 12); however, the DOTD hydrographic survey of 1992 indicates a deepening and migration of the thalweg towards the right bank. This most recent survey indicates channel-bed elevations are below the top of the right-bank main-pier footing. Based on this information, the pier is at a higher risk of failure than the other piers at this site. Aerial photographs taken in 1977 and 1987 (figs. 13 and 14) were taken at low-water conditions and indicate no alignment changes.
20
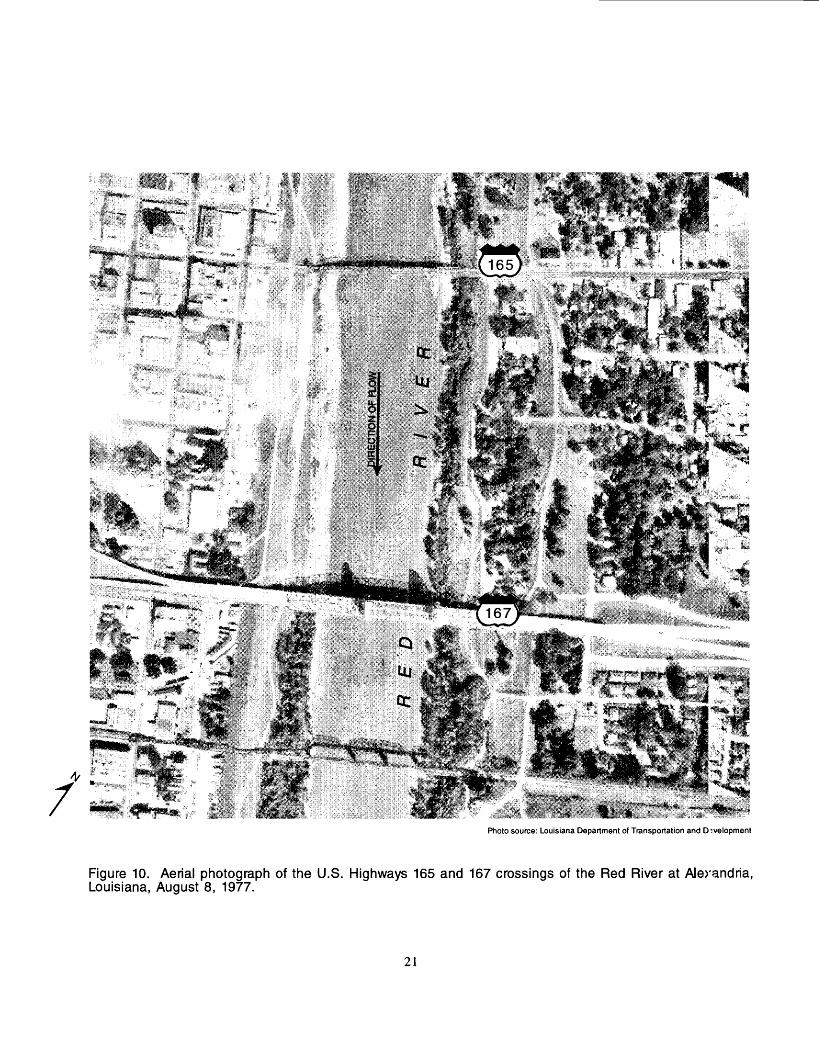
Photo source: Louisiana Department of Transportation and Development
Figure 10. Aerial photograph of the U.S. Highways 165 and 167 crossings of the Red River at Alexandria, Louisiana, August 8, 1977.
21
7Photo source: Louisiana Department of Transportation and Development
Figure 11. Aerial photograph of the U.S. Highways 165 and 167 crossings of the Red River at A'exandria, Louisiana, October 5, 1987.
22
to
^uu
150
s y LJJ
CO s o m I-
100
UJ
HI
LJ_
Z z" 0 I y LJJ
50
i
- - _ - - - -
i
10,5
00
^-_ i
' '
V -
*-v
LEF
T
BA
NK
I
1968
,19
80,
1992
,
\Tv
I
.
i i
i i
i i
i i
i i
i i
i
EX
PLA
NA
TIO
N
II
1 1
1 1
Dep
artm
ent
of T
rans
port
atio
n r-
i JQ
P O
F FO
OTI
NG
Cor
ps o
f E
ngin
eers
^
SC
OU
R E
LEV
ATI
ON
D
epar
tmen
t of
Tra
nspo
rtat
ion
X ix ^
11,0
00
^
^^--
'>"""
«-» ^^ r
Brid
ge^^ p
ier ¥
\ \ U\
k.
---^
|
r; 1 I ^
/ / / /. /
r n
-
Sr/c
fge
.^^^
/
deck
^̂̂
^
t/^ /^
s^^^ 03 S
1"^ X
V.
n
r*
i i
i i
i i
i i
i i
i
x_
v^
^'s
s^V
^^ ^^
^-x^
^^
^ ,- "'"
~~
- - --"
" :A RIG
HT
B
AN
K
-
i ill
11,5
00
12,0
00
12,5
00
13,0
00
DE
PA
RT
ME
NT
OF
TR
AN
SP
OR
TA
TIO
N S
TA
TIO
NIN
G,
IN F
EE
T
Figu
re 1
2.
Com
para
tive
cros
s se
ctio
ns a
nd p
ier-
scou
r es
timat
es a
t U
.S.
Hig
hway
71
cros
sing
at A
lexa
ndria
, Lo
uisi
ana.
Pho
to s
ourc
e: L
ouis
iana
Dep
artm
ent o
f Tra
nspo
rtatio
n an
d D
evel
opm
ent
Figu
re 1
3.
Aer
ial
phot
ogra
ph o
f th
e U
.S.
Hig
hway
71
cros
sing
of
the
Red
Riv
er a
t A
lexa
ndria
, Lo
uisi
ana,
Aug
ust
8, 1
977.
Pho
to s
ourc
e: L
ouis
iana
Dep
artm
ent o
f Tra
nspo
rtatio
n an
d D
evel
opm
ent
Figu
re 1
4.
Aer
ial
phot
ogra
ph o
f th
e U
.S.
Hig
hway
71
cros
sing
of
the
Red
Riv
er a
t A
lexa
ndria
, Lo
uisi
ana,
Oct
ober
5,
1987
.
Louisiana Highway 8 at Boyce, Louisiana
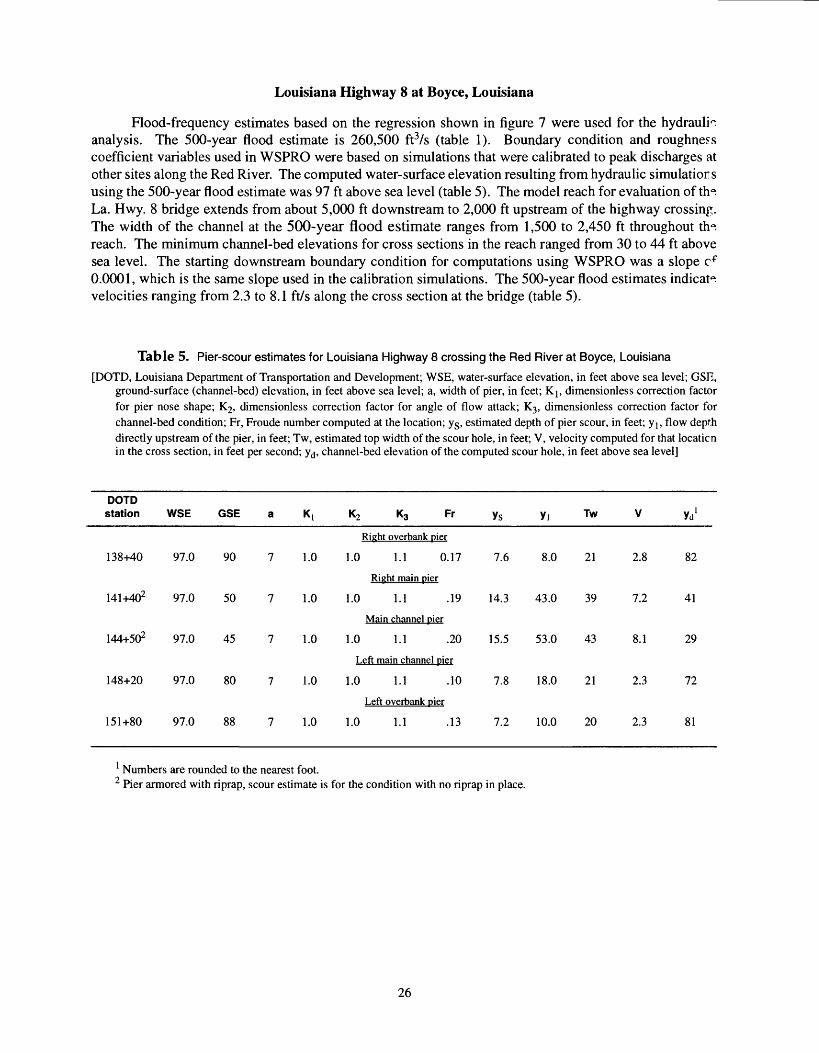
Rood-frequency estimates based on the regression shown in figure 7 were used for the hydraulic analysis. The 500-year flood estimate is 260,500 ft3/s (table 1). Boundary condition and roughness coefficient variables used in WSPRO were based on simulations that were calibrated to peak discharges at other sites along the Red River. The computed water-surface elevation resulting from hydraulic simulations using the 500-year flood estimate was 97 ft above sea level (table 5). The model reach for evaluation of th^ La. Hwy. 8 bridge extends from about 5,000 ft downstream to 2,000 ft upstream of the highway crossing. The width of the channel at the 500-year flood estimate ranges from 1,500 to 2,450 ft throughout th~, reach. The minimum channel-bed elevations for cross sections in the reach ranged from 30 to 44 ft above sea level. The starting downstream boundary condition for computations using WSPRO was a slope cf 0.0001, which is the same slope used in the calibration simulations. The 500-year flood estimates indicate velocities ranging from 2.3 to 8.1 ft/s along the cross section at the bridge (table 5).
Table 5. Pier-scour estimates for Louisiana Highway 8 crossing the Red River at Boyce, Louisiana
[DOTD, Louisiana Department of Transportation and Development; WSE, water-surface elevation, in feet above sea level; GSE, ground-surface (channel-bed) elevation, in feet above sea level; a, width of pier, in feet; Kj, dimensionless correction factor for pier nose shape; K2, dimensionless correction factor for angle of flow attack; 1(3, dimensionless correction factor for channel-bed condition; Fr, Froude number computed at the location; ys, estimated depth of pier scour, in feet; yj, flow depth directly upstream of the pier, in feet; Tw, estimated top width of the scour hole, in feet; V, velocity computed for that location in the cross section, in feet per second; y<j, channel-bed elevation of the computed scour hole, in feet above sea level]
DOTD station
138+40
141+402
144+502
148+20
151+80
WSE
97.0
97.0
97.0
97.0
97.0
GSE
90
50
45
80
88
a
7
7
7
7
7
K,
1.0
1.0
1.0
1.0
1.0
K2 K3 Fr
Right overbank pier
1.0 1.1 0.17
Right main pier
1.0 1.1 .19
Main channel pier
1.0 1.1 .20
Left main channel pier
1.0 1.1 .10
Left overbank pier
1.0 1.1 .13
Ys
7.6
14.3
15.5
7.8
7.2
Yi
8.0
43.0
53.0
18.0
10.0
Tw V
21 2.8
39 7.2
43 8.1
21 2.3
20 2.3
Yd'
82
41
29
72
81
Numbers are rounded to the nearest foot.Pier armored with riprap, scour estimate is for the condition with no riprap in place.
26
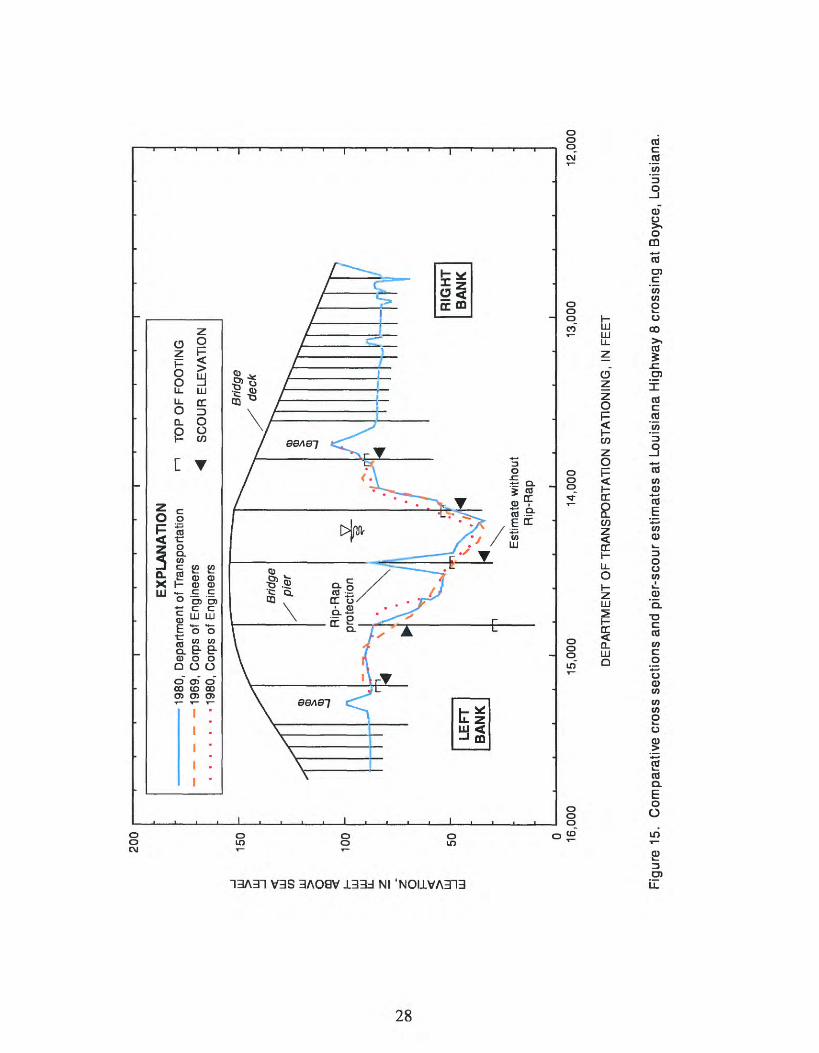
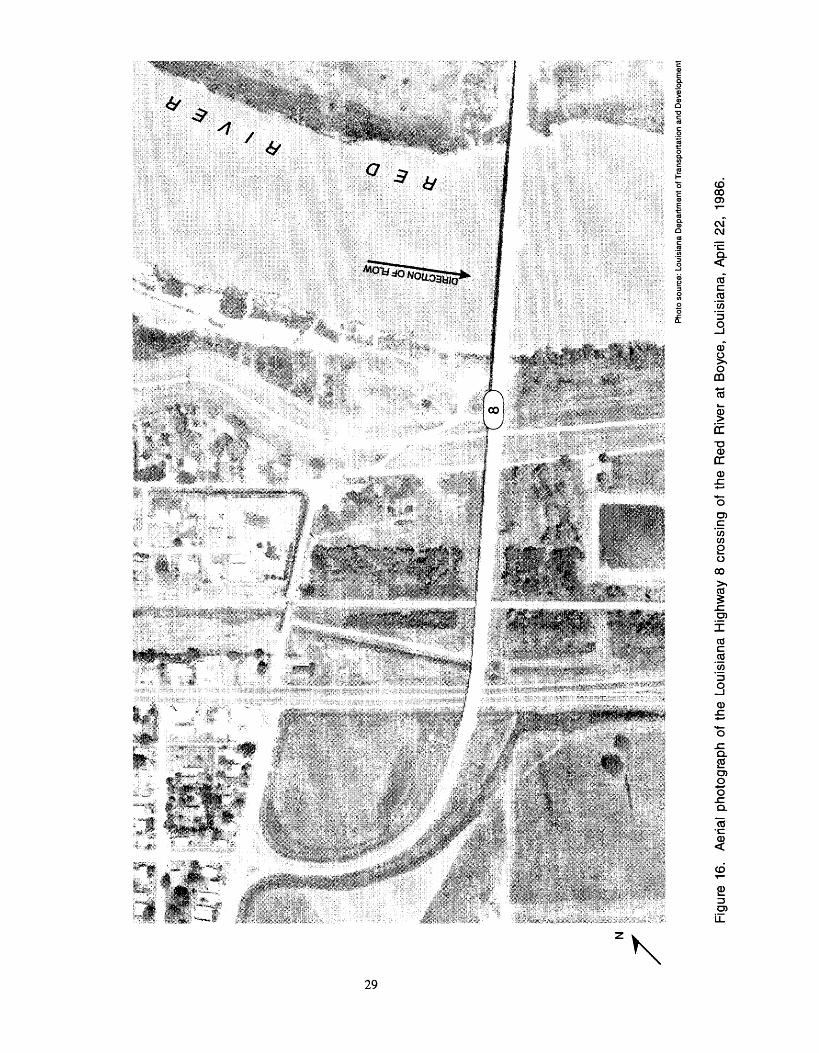
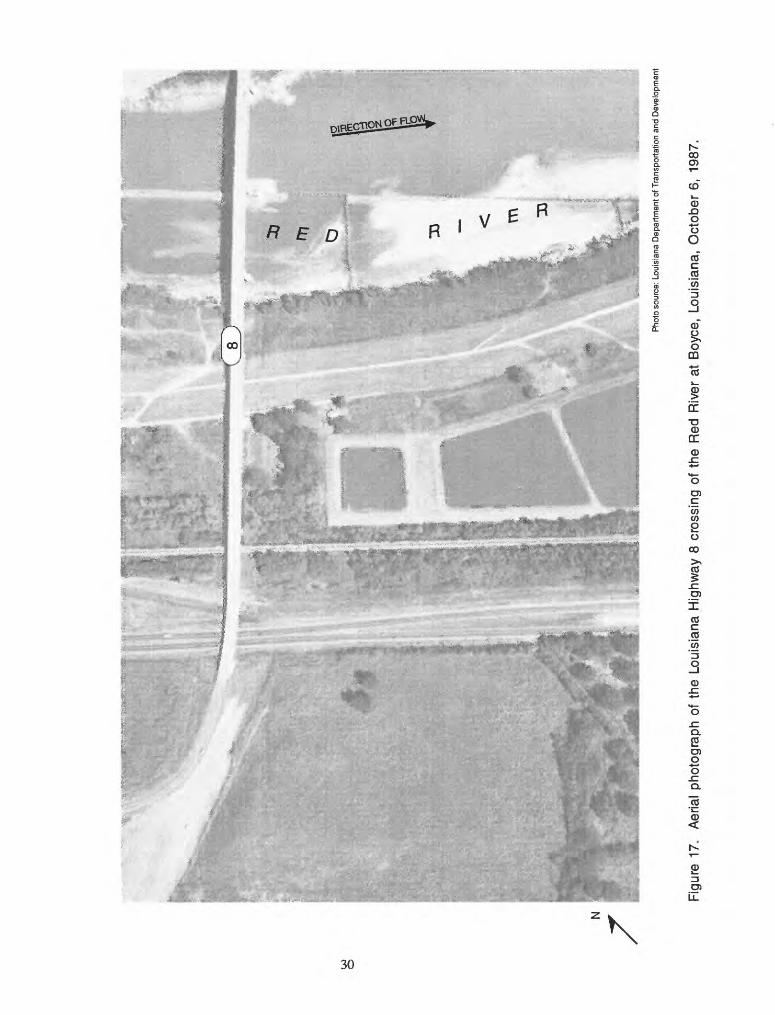
Pier Scour
For evaluation of pier scour at La. Hwy. 8, values for yj at each pier were based on the COB hydrographic survey of 1969. The cross section represented by the 1969 survey represents a fairly uniform section and represents the lowest elevations for sections based on the historic cross-section information at the site (fig. 15). Other surveys at this site indicate minor changes in the minimum channel-bed elevation, but with no substantial movement of the thalweg. Values for Kj=1.0, K2=1.0, and K3=l.l were based on DOTD bridge plans and recommendations presented by Richardson and others (1993, p. 39-40). Tha- Froude number at the pier location is based upon the value of velocity, which was computed using WSPRO (table 5). The maximum computed scour depth was 15.5 ft for the pier at DOTD station 144+50. The elevation of the bed of the computed scour hole is approximately 29 ft above sea level. The two piers in the main channel at DOTD stations 141+40 and 144+50 are protected from scouring by stone riprap according to the design plans. The Colorado State University pier-scour equation recommended by Richardson and others (1991,1993) is for cohesionless sand-bed streams, not for locations armored with large stone material such as riprap. For this reason, estimates of pier scour for locations with riprap protection are shown for information purposes only. For the pier at DOTD station 144+50, the riprap is part of a rock dike, which is visible from aerial photographs (figs. 16 and 17). The riprap protection for the pier at DOTD station 141+50 is unconfirmed by information collected for this evaluation, and the presence of the riprap material is assumed, based solely on the bridge plan drawings.
Channel Stability
To evaluate channel stability at the La. Hwy. 8 crossing of the Red River, cross-section information is available for the years 1969 and 1980. Two surveys are shown in figure 15 for 1980, one performed by the COE and one by DOTD. The differences in the 1980 cross sections can be attributed to minor differences in the location at which the cross section was measured and the potential error in recovering the 1969 elevation information from map sources. All three surveys represent the same general cross-section geometry. The stone riprap protection, which is part of a rock dike around the pier at DOTD station 144+50, is indicated only from the 1980 survey performed by DOTD. The protection around the pier is visible on aerial photographs taken in 1986 and 1987 (figs. 16 and 17). The 1987 photograph was taken during a lower river stage than when the 1986 photo was taken and parts of the rock dike are visible. Although no observable channel migration appears in the photographs, higher channel-bed elevations are noted behind the lines of timber piles on the right bank. These higher elevations may be due to deposition behind the flow-directing timber structures.
Louisiana Highway 6 at Grand Ecore, Louisiana
Flood-frequency estimates based on the data shown in figure 3 were used for the hydraulic analyst at La. Hwy. 6. The 500-year flood estimate is 302,500 ft3/s (table 1). Hydraulic simulations were calibrated to a peak discharge of 224,000 ft3/s, with a water-surface elevation of about 115.0 ft above sea level. The computed water-surface elevation resulting from hydraulic simulations using the 500-year flood estimate was about 120.0 ft above sea level (table 6).
The model reach for evaluation of the La. Hwy. 6 bridge extends from about 1,000 ft upstream to 3,900 ft downstream of the highway crossing. The width of the channel at the design discharge ranges from 1,100 to 2,704 ft throughout the reach. The minimum channel-bed elevations for cross sections in the reach ranged from 64 to 77 ft above sea level. The downstream boundary condition for computations using WSPRO was a slope of 0.0001, for both the calibration simulations and the 500-year flood estimate simulation. The 500-year flood estimate simulation indicates velocities ranging from 9.8 to 12.0 ft/s along the cross section at the bridge.
27
200
to 00
LJU
LJU tn LJU O 9 LJU
LJU
LL g LJJ
150
100 50
0 16,0
00
EX
PL
AN
AT
ION
1980
, D
epar
tmen
t of T
rans
porta
tion
- - - 1
969,
Cor
ps o
f E
ngin
eers
......
198
0, C
orps
of
Eng
inee
rs
TO
P O
F F
OO
TIN
G
SC
OU
R E
LEV
AT
ION
Brid
ge
deck
Est
imat
e w
ithou
t R
ip-R
ap
15,0
0014
,000
13,0
0012
,000
DE
PA
RT
ME
NT
OF
TR
AN
SP
OR
TA
TIO
N S
TA
TIO
NIN
G,
IN F
EE
T
Figu
re 1
5.
Com
para
tive
cros
s se
ctio
ns a
nd p
ier-
scou
r es
timat
es a
t Lo
uisi
ana
Hig
hway
8 c
ross
ing
at B
oyce
, Lo
uisi
ana.
ts>
7P
hoto
sou
rce:
Lou
isia
na D
epar
tmen
t of T
rans
porta
tion
and
Dev
elop
men
t
Figu
re 1
6.
Aer
ial
phot
ogra
ph o
f th
e Lo
uisi
ana
Hig
hway
8 c
ross
ing
of t
he R
ed R
iver
at
Boy
ce,
Loui
sian
a, A
pril
22,
1986
.
u> o
7Ph
oto
sour
ce:
Loui
sian
a D
epar
tmen
t of T
rans
porta
tion
and
Dev
elop
men
t
Figu
re 1
7.
Aer
ial
phot
ogra
ph o
f th
e Lo
uisi
ana
Hig
hway
8 c
ross
ing
of t
he R
ed R
iver
at
Boy
ce,
Loui
sian
a, O
ctob
er 6
, 19
87.
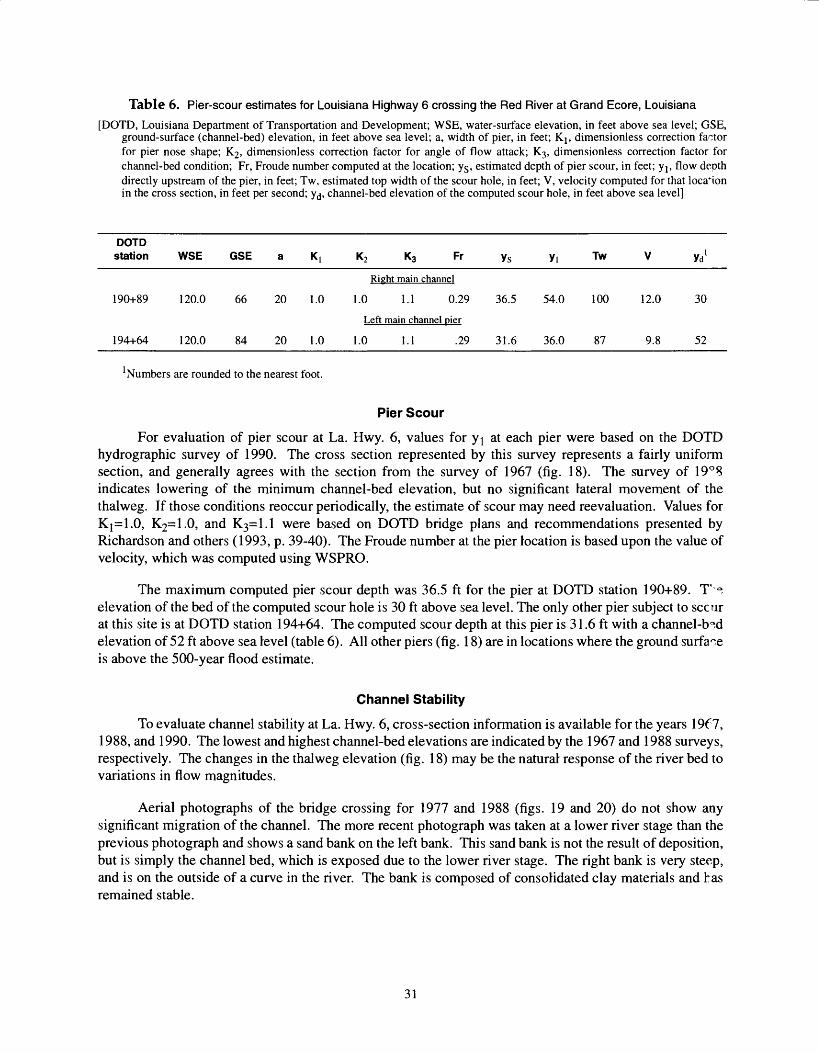
Table 6. Pier-scour estimates for Louisiana Highway 6 crossing the Red River at Grand Ecore, Louisiana
[DOTD, Louisiana Department of Transportation and Development; WSE, water-surface elevation, in feet above sea level; GSE, ground-surface (channel-bed) elevation, in feet above sea level; a, width of pier, in feet; Kj, dimensionless correction factor for pier nose shape; K2, dimensionless correction factor for angle of flow attack; K3 , dimensionless correction factor for channel-bed condition; Fr, Froude number computed at the location; ys , estimated depth of pier scour, in feet; y 1? flow depth directly upstream of the pier, in feet; Tw, estimated top width of the scour hole, in feet; V, velocity computed for that location in the cross section, in feet per second; yd , channel-bed elevation of the computed scour hole, in feet above sea level]
DOTDstation WSE GSE a K, K2 K3 Fr ys y, Tw V yd '
Right main channel
190+89 120.0 66 20 1.0 1.0 1.1 0.29 36.5 54.0 100 12.0 30
Left main channel pier
194+64 120.0 84 20 1.0 1.0 1.1 .29 31.6 36.0 87 9.8 52
lumbers are rounded to the nearest foot.
Pier Scour
For evaluation of pier scour at La. Hwy. 6, values for y\ at each pier were based on the DOTD hydrographic survey of 1990. The cross section represented by this survey represents a fairly uniform section, and generally agrees with the section from the survey of 1967 (fig. 18). The survey of 19 Q 8 indicates lowering of the minimum channel-bed elevation, but no significant lateral movement of the thalweg. If those conditions reoccur periodically, the estimate of scour may need reevaluation. Values for Kj=1.0, K2=1.0, and K3=l.l were based on DOTD bridge plans and recommendations presented by Richardson and others (1993, p. 39-40). The Froude number at the pier location is based upon the value of velocity, which was computed using WSPRO.
The maximum computed pier scour depth was 36.5 ft for the pier at DOTD station 190+89. T Q- elevation of the bed of the computed scour hole is 30 ft above sea level. The only other pier subject to sccur at this site is at DOTD station 194+64. The computed scour depth at this pier is 31.6 ft with a channel-b^d elevation of 52 ft above sea level (table 6). All other piers (fig. 18) are in locations where the ground surface is above the 500-year flood estimate.
Channel Stability
To evaluate channel stability at La. Hwy. 6, cross-section information is available for the years 19f 7, 1988, and 1990. The lowest and highest channel-bed elevations are indicated by the 1967 and 1988 surveys, respectively. The changes in the thalweg elevation (fig. 18) may be the natural response of the river bed to variations in flow magnitudes.
Aerial photographs of the bridge crossing for 1977 and 1988 (figs. 19 and 20) do not show any significant migration of the channel. The more recent photograph was taken at a lower river stage than the previous photograph and shows a sand bank on the left bank. This sand bank is not the result of deposition, but is simply the channel bed, which is exposed due to the lower river stage. The right bank is very steep, and is on the outside of a curve in the river. The bank is composed of consolidated clay materials and has remained stable.
31
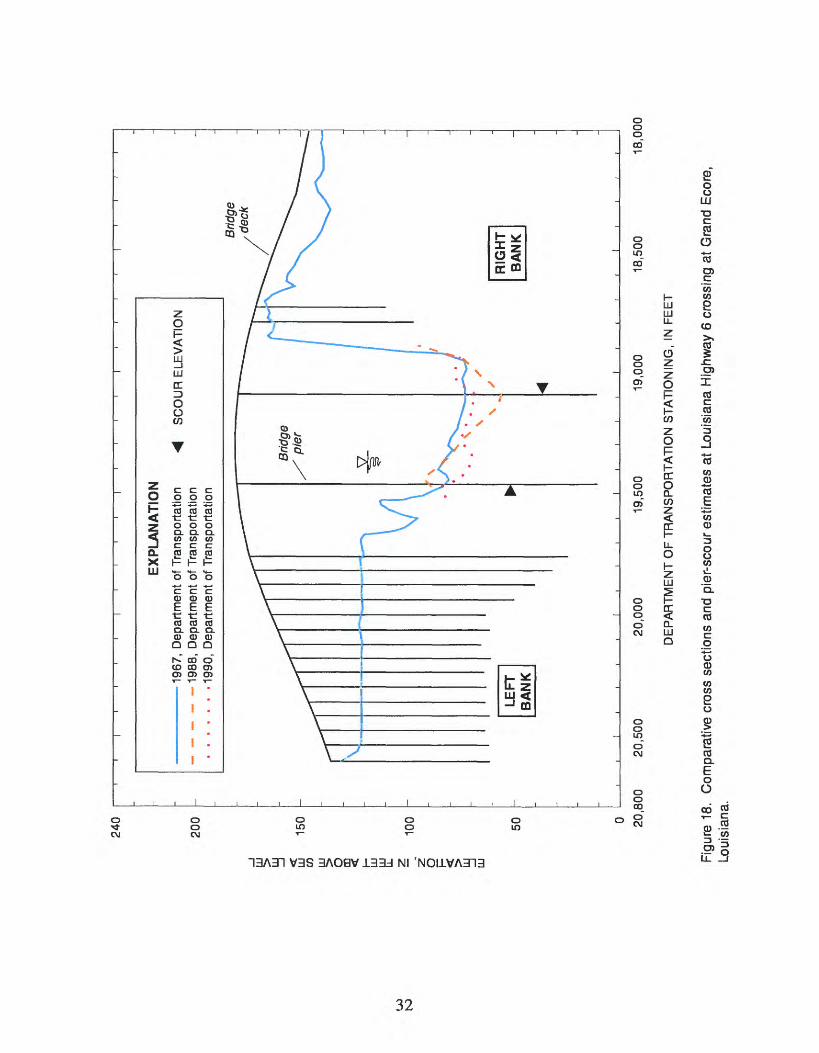
240
OJ to
200
-
LU y uj
150
U) s LU U! -
100
z O 1 y LJJ
50
-
EX
PL
AN
AT
ION
1967
, D
epar
tmen
t of
Tra
nspo
rtat
ion
1988
, D
epar
tmen
t of
Tra
nspo
rtat
ion
1990
, D
epar
tmen
t of
Tra
nspo
rtat
ion
SC
OU
R E
LEV
AT
ION
0 20,8
00
20,5
0020
,000
19
,500
19
,000
18
,500
DE
PA
RT
ME
NT
OF
TR
AN
SP
OR
TA
TIO
N S
TA
TIO
NIN
G,
IN F
EE
T
18,0
00
Figu
re 1
8.
Com
para
tive
cros
s se
ctio
ns a
nd p
ier-
scou
r es
timat
es a
t Lo
uisi
ana
Hig
hway
6 c
ross
ing
at G
rand
Eco
re,
Loui
sian
a.
N.
So
mb
er
Phot
o so
urce
: Lou
isia
na D
epar
tmen
t of T
rans
porta
tion
and
Dev
elop
men
t
°< t
he l
ouM
ana
Hig
hway
6 c
ross
ing
of t
he R
ed R
iver
at
Gra
nd E
core
, Lo
uisi
ana,
Pho
to s
ourc
e: L
ouis
iana
Dep
artm
ent o
f Tra
nspo
rtatio
n an
d D
evel
opm
ent
Figu
re 2
0.
Aer
ial
phot
ogra
ph o
f th
e Lo
uisi
ana
Hig
hway
6 c
ross
ing
of t
he R
ed R
iver
at
Gra
nd E
core
, Lo
uisi
ana,
Oct
ober
7,
1988
.
U.S. Highway 84 at Coushatta, Louisiana
Flood-frequency estimates based on the 500-year flood estimate shown in figure 3 were used for tH hydraulic analysis at U.S. Hwy. 84. The 500-year flood estimate is 323,900 ft3/s (table 1). Hydraulic simulations were calibrated to a historic discharge of about 275,000 ft3/s, which occurred on April 7, 1945, with a water-surface elevation of about 136 ft above sea level. The computed water-surface elevation resulting from hydraulic simulations using the 500-year flood estimate is about 138 ft above sea level (table 7).
The model reach for evaluation of the U.S. Hwy. 84 bridge extends from about 4,000 ft downstream to 500 ft upstream of the highway crossing. The width of the channel at the 500-year flood estimate ranges from 1,700 to 2,400 ft throughout the reach. The minimum channel-bed elevations for cross sections in the reach ranged from 68 to 98 ft above sea level. The downstream starting elevation for computations using WSPRO was a slope of 0.0004, which is the same specification used in the calibration simulations. Simulations indicate velocities ranging from 1.9 to 9.5 ft/s along the cross section at the bridge (table 7).
Table 7. Pier-scour estimates for U.S. Highway 84 crossing the Red River at Coushatta, Louisiana
[DOTD, Louisiana Department of Transportation and Development; WSE, water-surface elevation, in feet above sea level; GfR, ground-surface (channel-bed) elevation, in feet above sea level; a, width of pier, in feet; K I; dimensionless correction factor for pier nose shape; K^, dimensionless correction factor for angle of flow attack; K^, dimensionless correction factor for channel-bed condition; Fr, Froude number computed at the location; ys , estimated depth of pier scour, in feet; yj, flow depth directly upstream of the pier, in feet; Tw, estimated top width of the scour hole, in feet; V, velocity computed for that location in the cross section, in feet per second; y^, channel-bed elevation of the computed scour hole, in feet above sea level]
DOTD station
127+29129+57132+67
WSE
138.0138.0138.0
GSE
1067694
a
131313
K,
1.01.01.0
K2 K3
1.0 1.11.0 1.11.0 1.1
Fr
0.19.21.21
Ys19.325.422.5
Yi32.062.044.0
Tw
537062
V
6.29.58.0
Yd 1
875171
Right overbank piers138.0138.0
100110
88
1.01.0
1.0 1.11.0 1.1
.05
.068.78.3
38.028.0
2423
1.91.9
91102
Numbers are rounded to the nearest foot.
Pier Scour
For evaluation of pier scour at U.S. Hwy. 84, values for yj at each pier were based on the COE hydrographic survey of 1969. The cross section represented by this survey represents the lowest channel-bed elevations of the cross sections shown in figure 21. Values for K^l.O, K2,=1.0, and K3=l.l were based on DOTD bridge plans and recommendations presented by Richardson and others (1993, p. 39-40). The Froude number at the pier location is based upon the value of velocity, which was computed using WSPRO.
35
U)
OS
20
0
S LJJ
CO O
150
CD LJJ
LJJ O I
100
LJJ
50
1 1
EX
PLA
NA
TIO
N
1980
, D
epar
tmen
t of
Tra
nspo
rtat
ion
1969
, C
orps
of
Eng
inee
rs
1980
, C
orps
of
Eng
inee
rs
SC
OU
R E
LEV
ATI
ON
Brid
ge
deck
J_
__
Ii
i 1
14,8
00
14,5
0014
,000
13
,500
1
3,0
00
12
,500
12,0
00
DE
PA
RT
ME
NT
OF
TR
AN
SP
OR
TA
TIO
N S
TA
TIO
NIN
G,
IN F
EE
T
11,5
00
11,2
00
Figu
re 2
1.
Com
para
tive
cros
s se
ctio
ns a
nd p
ier-
scou
r es
timat
es a
t U
.S.
Hig
hway
84
cros
sing
at
Cou
shat
ta,
Loui
sian
a.
Estimates for scour at the piers on the right overbank were based on a channel-bed elevations between 100 and 110 ft above sea level (table 7). This is the range of elevations for this group of piers based on the 1980 DOTD survey. The scour estimate for the pier at DOTD station 127+29 is 19.3 ft, yielding an elevation for the bed at the scour hole at 87 ft above sea level. The maximum computed scour depth w*s 25.4 ft for the pier at DOTD station 129+57, with an elevation of the bed at the computed scour hole of 51 ft above sea level. The depth of scour for the pier at DOTD station 132+67 is approximately 22.5 ft, with an estimated channel-bed elevation of 71 ft above sea level.
Channel Stability
The cross sections at U.S. Hwy. 80 shown in figure 21 indicate several geometric conditions. The cross sections from the 1980 surveys by DOTD and COE data differ substantially. This difference is mcst likely due to relatively slight differences in the location where the cross section was surveyed. The DOTD cross section was surveyed exactly at the bridge location. The COE survey cross section is the cross section from the hydrographic survey that was nearest the bridge. The COE cross sections surveyed in 1969 and 1980 differ in longitudinal location on the river by about 500 ft. The 1969 cross section was surveyed at river mile 220.6, which is at the highway crossing and the 1980 cross section was surveyed at river mile 220.7. This difference in geometry does not indicate changing bed conditions at the bridge site, but it doa.s indicate the difference in channel geometry along a very short reach near the bridge. One condition that shows some stability is the steeply sloping left bank. The location and slope of the left bank is identical for all three surveys shown. Some insight into the variability on the right bank can be emphasized from aerial photographs taken in 1977 and 1987. The photograph taken in 1977 (fig. 22) indicates erosion along the right bank, immediately downstream of the bridge. This evidence of erosion does not appear in the photograph taken in 1987 (fig. 23). This later photograph indicates a shift in flow towards the left bank. Established vegetation can be observed in the 1987 photograph in the areas where bank erosion w>s observed in the 1977 photograph. Vegetation also has become established in the areas of deposition on the right bank, upstream of the highway crossing.
Louisiana Highways 511 and 3032, Interstate Highway 20, and U.S. Highway 80 at Shreveport, Louisiana
Flood-frequency estimates based on the data shown in figure 3 indicate a 500-year flood estimate of 371,300 ft3/s for highway crossings at Shreveport, La., where the drainage area is 60,614 mi (table 1). The water-surface elevation associated with this discharge ranges from 171.4 ft above sea level at La. Hwy. 511 to 178.0 ft above sea level at U.S. Hwy. 80 (table 8). Two floods that occurred during the period 18^9 through 1990 that are greater than 250,000 ft3/s. The largest discharge recorded during this period was 303,000 ft3/s in 1945, with a water-surface elevation of 169.4 ft above sea level.
The model reach for evaluation of the bridges extends from downstream of La. Hwy. 511 to upstream of U.S. Hwy. 80. The width of the channel at the bridges for the 500-year flood estimates range from 4,600 ft near La. Hwy. 511 to 1,800 ft near U.S. Hwy. 80. The minimum channel-bed elevations for the cnrs sections at the bridges ranged from 113 to 129 ft above sea level. This minimum elevation is derived from the COE cross sections used for hydraulic routing through the reach. Surveys by DOTD indicate remnants of scour holes near some bridge piers. The channel-bed elevations used for pier scour were taken as the ambient bed level in the vicinity of the pier. The starting downstream boundary condition for computations using WSPRO was a slope of 0.0002 ft/ft. This starting condition produced reasonable flood profiles when calibrating to floods of record. WSPRO simulations indicate an energy gradeline slope of slightly greater than 0.0002, and velocities ranging from 1.1 to 13.0 ft/s along the cross sections at the bridges.
37
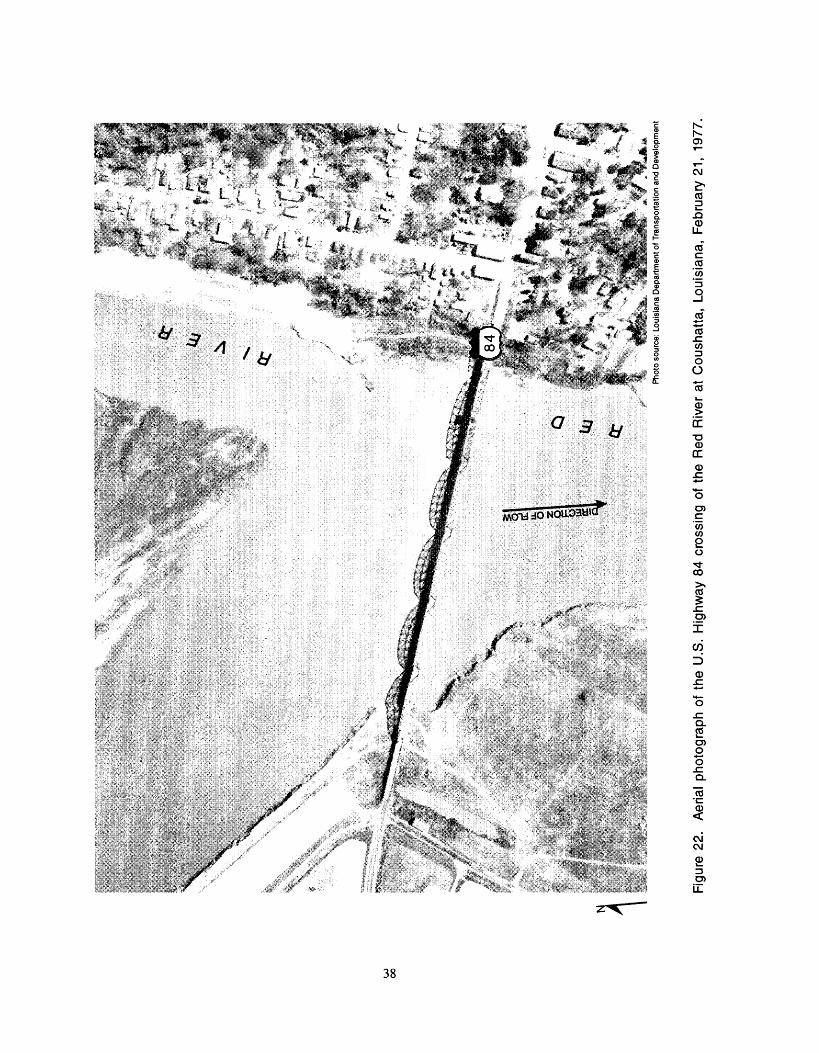
u>
oo
Pho
to s
ourc
e: L
ouis
iana
Dep
artm
ent o
f Tra
nspo
rtatio
n an
d D
evel
opm
ent
Figu
re 2
2.
Aer
ial
phot
ogra
ph o
f th
e U
.S.
Hig
hway
84
cros
sing
of
the
Red
Riv
er a
t C
oush
atta
, Lo
uisi
ana,
Feb
ruar
y 21
, 19
77.
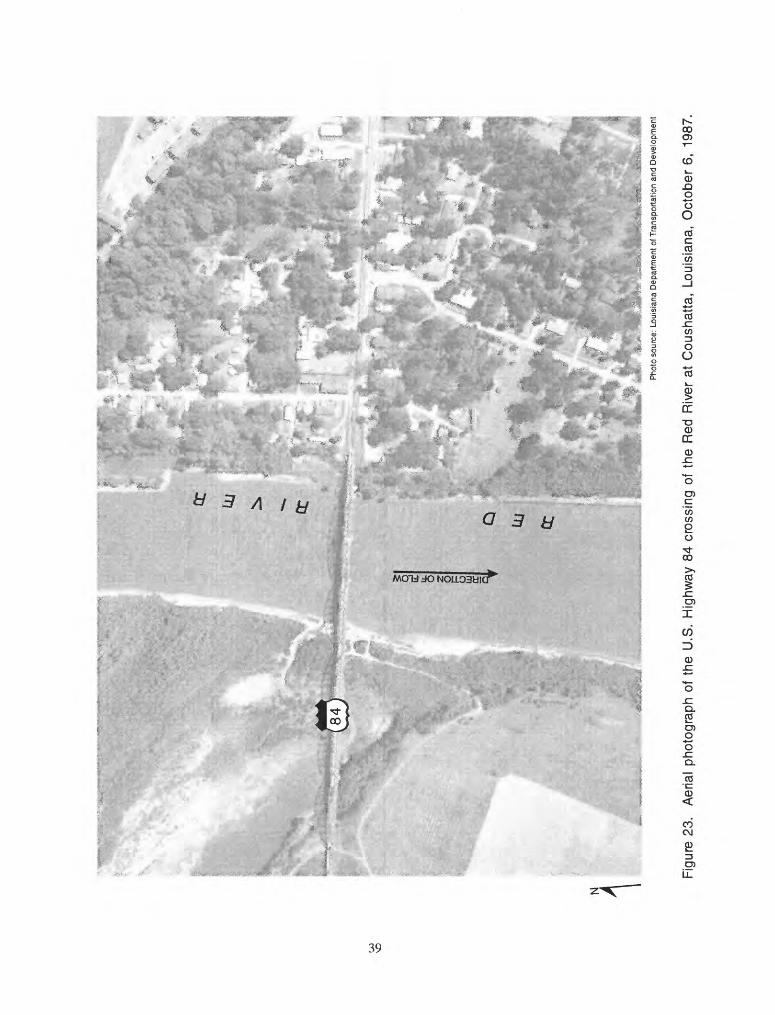
Phot
o so
urce
: Lo
uisi
ana
Dep
artm
ent o
f Tra
nspo
rtatio
n an
d D
evel
opm
ent
Figu
re 2
3.
Aer
ial
phot
ogra
ph o
f th
e U
.S.
Hig
hway
84
cros
sing
of
the
Red
Riv
er a
t C
oush
atta
, Lo
uisi
ana,
Oct
ober
6,
1987
.
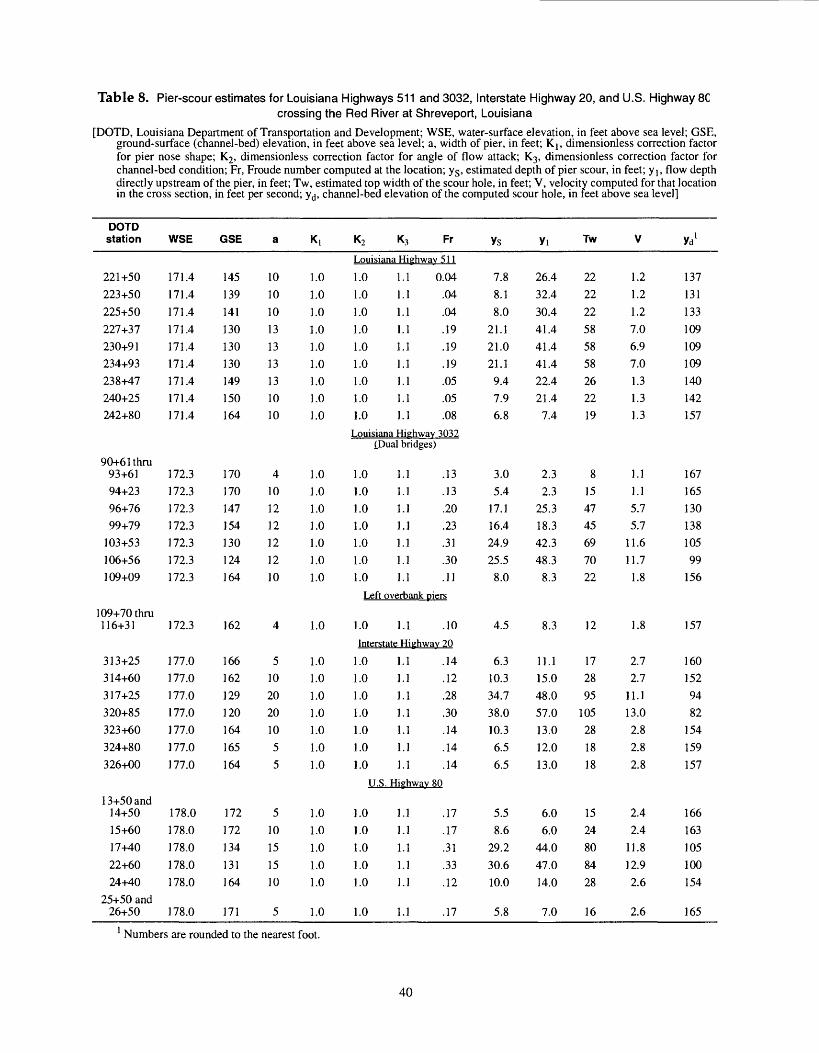
Table 8. Pier-scour estimates for Louisiana Highways 511 and 3032, Interstate Highway 20, and U.S. Highway 8Ccrossing the Red River at Shreveport, Louisiana
[DOTD, Louisiana Department of Transportation and Development; WSE, water-surface elevation, in feet above sea level; GSE, ground-surface (channel-bed) elevation, in feet above sea level; a, width of pier, in feet; Kj, dimensionless correction factor for pier nose shape; K2 , dimensionless correction factor for angle of flow attack; K^, dimensionless correction factor for channel-bed condition; Fr, Froude number computed at the location; ys , estimated depth of pier scour, in feet; y lt flow depthdirectly upstream of the pier, in feet; Tw, estimated top width of the scour hole, in feet; V, velocity computed for that location in the cross section, in feet per second; yd , channel-bed elevation of the computed scour hole, in feet above sea level]
DOTD station
221+50223+50225+50227+37230+91234+93238+47240+25242+80
90+61 thru 93+6194+2396+7699+79
103+53106+56109+09
109+70 thru 116+31
313+25314+60317+25320+85323+60324+80326+00
13+50 and 14+5015+6017+4022+6024+40
25+50 and 26+50
WSE
171.4171.4171.4171.4171.4171.4171.4171.4171.4
172.3172.3172.3172.3172.3172.3172.3
172.3
177.0177.0177.0177.0177.0177.0177.0
178.0178.0178.0178.0178.0
178.0
GSE
145139141130130130149150164
170170147154130124164
162
166162129120164165164
172172134131164
171
a
101010131313131010
4101212121210
4
51020201055
510151510
5
K,
1.01.01.01.01.01.01.01.01.0
1.01.01.01.01.01.01.0
1.0
1.01.01.01.01.01.01.0
1.01.01.01.01.0
1.0
K2 K3 Fr
Louisiana Highway 511
1.0 1.1 0.041.0 1.1 .041.0 1.1 .041.0 1.1 .191.0 1.1 .191.0 1.1 .191.0 1.1 .051.0 1.1 .051.0 1.1 .08
Louisiana Highway 3032 {.Dual bridges)
1.0 1.1 .131.0 1.1 .131.0 1.1 .201.0 1.1 .231.0 1.1 .311.0 1.1 .301.0 1.1 .11
Left overbank piers
1.0 1.1 .10
Interstate Highway 20
1.0 1.1 .141.0 1.1 .121.0 1.1 .281.0 1.1 .301.0 1.1 .141.0 1.1 .141.0 1.1 .14
U.S. Highway 80
1.0 1.1 .17
1.0 1.1 .171.0 1.1 .311.0 1.1 .331.0 1.1 .12
1.0 1.1 .17
YS
7.88.18.0
21.121.021.19.47.96.8
3.05.4
17.116.424.925.58.0
4.5
6.310.334.738.010.36.56.5
5.58.6
29.2
30.610.0
5.8
Yi
26.432.430.441.441.441.422.421.47.4
2.32.3
25.318.342.348.3
8.3
8.3
11.115.048.057.013.012.013.0
6.06.0
44.047.014.0
7.0
Tw
222222
585858262219
8154745697022
12
172895
10528
1818
1524808428
16
V
1.21.21.27.06.97.01.31.31.3
1.11.15.75.7
11.611.7
1.8
1.8
2.72.7
11.113.02.82.82.8
2.42.4
11.812.92.6
2.6
Yd 1
137131133109109109140142157
16716513013810599
156
157
1601529482
154159157
166163105100154
165
Numbers are rounded to the nearest foot.
40
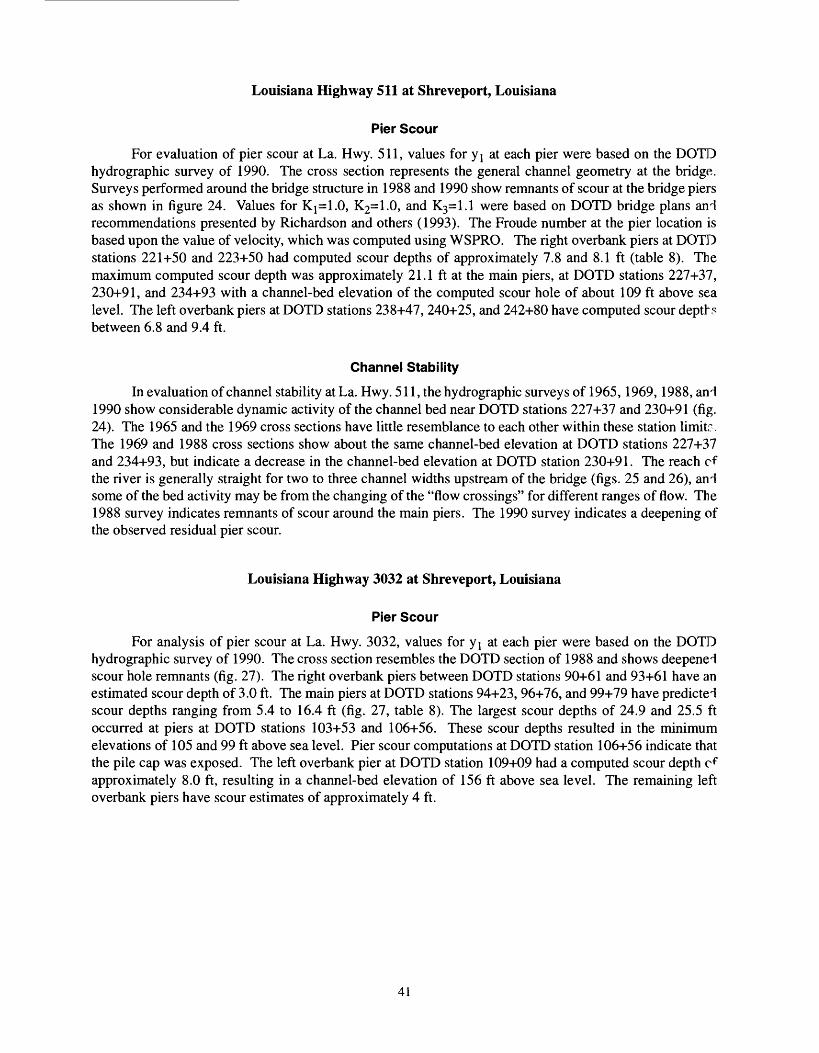
Louisiana Highway 511 at Shreveport, Louisiana
Pier Scour
For evaluation of pier scour at La. Hwy. 511, values for yj at each pier were based on the DOTD hydrographic survey of 1990. The cross section represents the general channel geometry at the bridge. Surveys performed around the bridge structure in 1988 and 1990 show remnants of scour at the bridge piers as shown in figure 24. Values for Kj=1.0, K2=1.0, and K3=l.l were based on DOTD bridge plans and recommendations presented by Richardson and others (1993). The Froude number at the pier location is based upon the value of velocity, which was computed using WSPRO. The right overbank piers at DOTD stations 221+50 and 223+50 had computed scour depths of approximately 7.8 and 8.1 ft (table 8). The maximum computed scour depth was approximately 21.1 ft at the main piers, at DOTD stations 227+37, 230+91, and 234+93 with a channel-bed elevation of the computed scour hole of about 109 ft above sea level. The left overbank piers at DOTD stations 238+47, 240+25, and 242+80 have computed scour depths between 6.8 and 9.4 ft.
Channel Stability
In evaluation of channel stability at La. Hwy. 511, the hydrographic surveys of 1965,1969,1988, and 1990 show considerable dynamic activity of the channel bed near DOTD stations 227+37 and 230+91 (fig. 24). The 1965 and the 1969 cross sections have little resemblance to each other within these station limit?. The 1969 and 1988 cross sections show about the same channel-bed elevation at DOTD stations 227+37 and 234+93, but indicate a decrease in the channel-bed elevation at DOTD station 230+91. The reach of the river is generally straight for two to three channel widths upstream of the bridge (figs. 25 and 26), and some of the bed activity may be from the changing of the "flow crossings" for different ranges of flow. The 1988 survey indicates remnants of scour around the main piers. The 1990 survey indicates a deepening of the observed residual pier scour.
Louisiana Highway 3032 at Shreveport, Louisiana
Pier Scour
For analysis of pier scour at La. Hwy. 3032, values for yj at each pier were based on the DOTD hydrographic survey of 1990. The cross section resembles the DOTD section of 1988 and shows deepened scour hole remnants (fig. 27). The right overbank piers between DOTD stations 90+61 and 93+61 have an estimated scour depth of 3.0 ft. The main piers at DOTD stations 94+23, 96+76, and 99+79 have predicted scour depths ranging from 5.4 to 16.4 ft (fig. 27, table 8). The largest scour depths of 24.9 and 25.5 ft occurred at piers at DOTD stations 103+53 and 106+56. These scour depths resulted in the minimum elevations of 105 and 99 ft above sea level. Pier scour computations at DOTD station 106+56 indicate that the pile cap was exposed. The left overbank pier at DOTD station 109+09 had a computed scour depth cf approximately 8.0 ft, resulting in a channel-bed elevation of 156 ft above sea level. The remaining left overbank piers have scour estimates of approximately 4 ft.
41
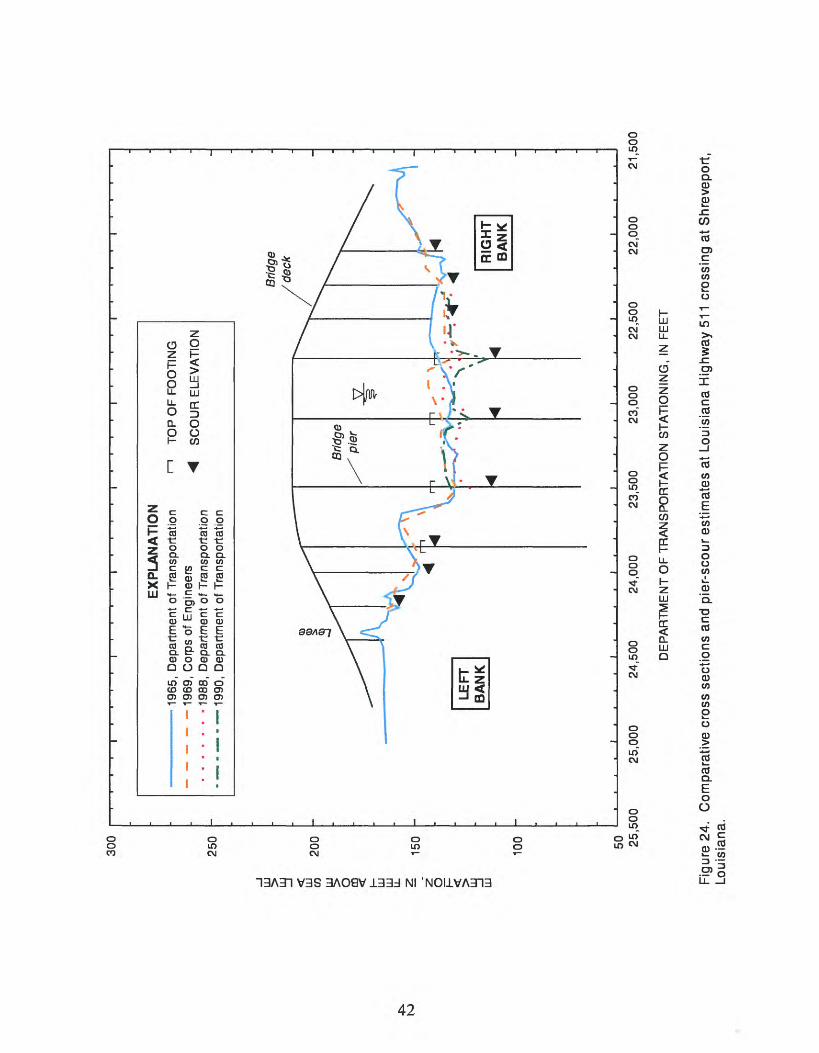
300
LJJ
250
s a £
200
g o -
150
z"
g LJJ
100 50 25
,500
EX
PL
AN
AT
ION
1
965,
Dep
artm
ent
of T
rans
porta
tion
- 1
969,
Cor
ps o
f E
ngin
eers
1
988,
Dep
artm
ent o
f Tra
nspo
rtatio
n 1
990,
Dep
artm
ent
of T
rans
porta
tion
TO
P O
F F
OO
TIN
G
SC
OU
R E
LEV
AT
ION
Brid
ge
deck
25,0
00
24,5
00
24,0
00
23,5
00
23,0
00
22,5
00
DE
PA
RT
ME
NT
OF
TR
AN
SP
OR
TA
TIO
N S
TA
TIO
NIN
G,
IN F
EE
T
22,0
0021
,500
Figu
re 2
4.
Com
para
tive
cros
s se
ctio
ns a
nd p
ier-
scou
r es
timat
es a
t Lo
uisi
ana
Hig
hway
511
cro
ssin
g at
Shr
evep
ort,
Loui
sian
a.
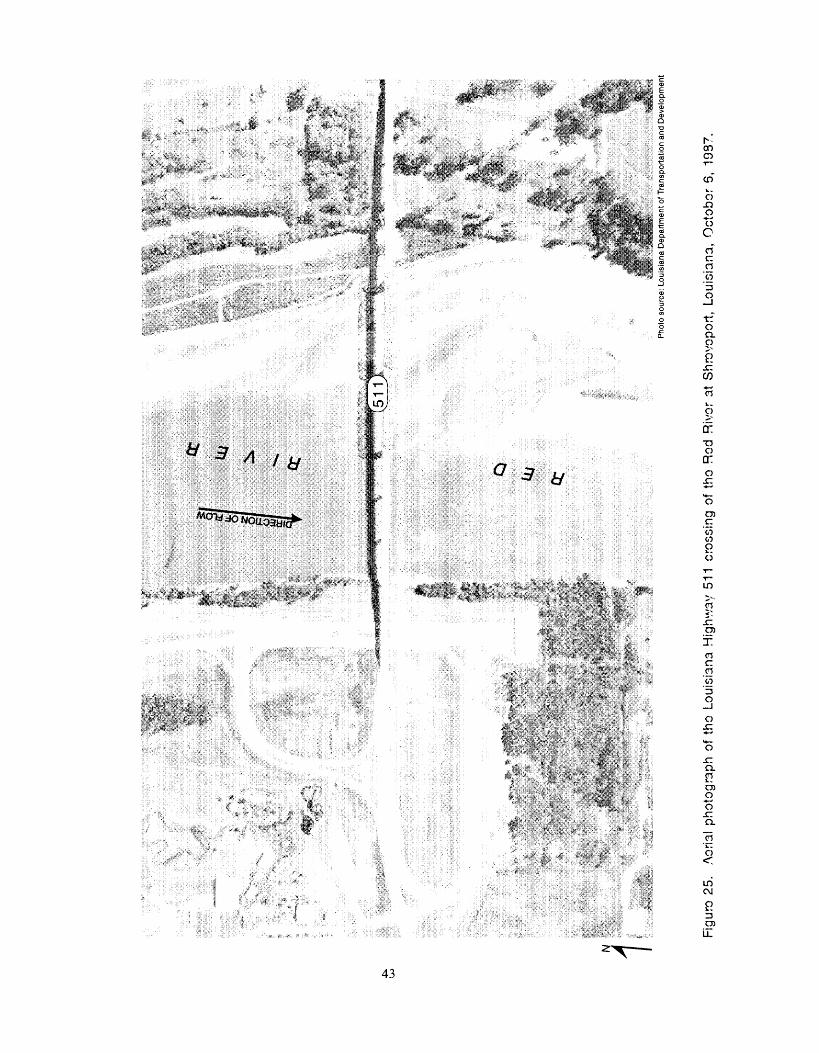
Pho
to s
ourc
e: L
ouis
iana
Dep
artm
ent o
f Tra
nspo
rtatio
n an
d D
evel
opm
ent
Fig
ure
25.
Aor
ia!
phot
ogra
ph o
f th
o Lo
uisi
ana
Hig
hway
511
cr
ossi
ng o
f th
o R
od R
ivor
at
Shr
ovop
ort,
Loui
sian
a, O
ctob
or 5
, 19
37.
cc Q
U/
Q:
N 1P
hoto
sou
rce:
Lou
isia
na D
epar
tmen
t of T
rans
porta
tion
and
Dev
elop
men
t
Fig
um 2
6.
A^r
ia!
phot
ogra
ph n
f th
fi Lo
uisi
ana
Hig
hway
S11
cr
ossi
ng o
f th
e R
ed R
iver
at
Shr
evep
ort,
Loui
sian
a, M
arch
10,
198
9.
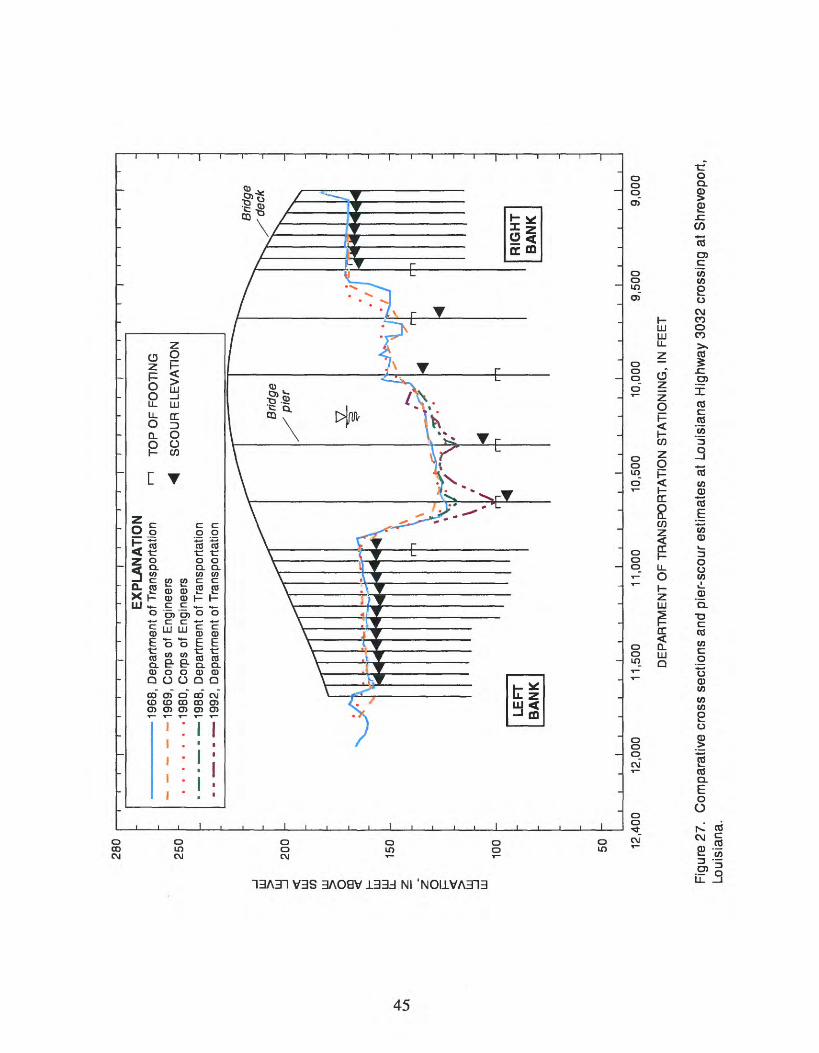
Ui
280
250
LU §
200
LU S o LU G! 15
0
o I LU
100 50
\ \
r1
' r
EX
PL
AN
AT
ION
1968
, D
epar
tmen
t of T
rans
porta
tion
]969
- C
orps
of
Eng
inee
rs
1980
, C
orps
of
Eng
inee
rs
1988
, D
epar
tmen
t of T
rans
porta
tion
1992
, D
epar
tmen
t of T
rans
porta
tion
TOP
OF
FOO
TIN
G
SC
QU
R E
LEV
ATI
ON
12,4
00
1 1
12,0
00
Brid
ge
11,5
00
11,0
00
10,5
00
10,0
00
9,50
0
DE
PA
RT
ME
NT
OF
TR
AN
SP
OR
TA
TIO
N S
TA
TIO
NIN
G,
IN F
EE
T
9,00
0
Figu
re 2
7.
Com
para
tive
cros
s se
ctio
ns a
nd p
ier-
scou
r es
timat
es a
t Lo
uisi
ana
Hig
hway
303
2 cr
ossi
ng a
t S
hrev
epor
t, Lo
uisi
ana.
The La. Hwy. 3032 bridge crossing the Red River near Shreveport is a part of the USGS Nation?! Bridge Scour Program. Part of the mission of the program is collection of scour data. Data were recently collected during a flood at this site on May 19 and 22, 1990, which had a peak discharge of approximately 297,000 ft /s. Measurements of velocity and depth at the approach to the pier and measurements of the bed around the pier were obtained. The depth of the scour around the pier at DOTD station 106+56 ranged from 17 to 25 ft, with an accuracy of 1 to 2 ft. The estimated value (table 8) is 25.5 ft, which is within the range of the observed values. This comparison of observed scour at a discharge that is about 80 percent of trn discharge used in computing the estimate provides greater confidence in the estimated values.
Channel Stability
Hydrographic surveys of 1968 and 1969 indicate no substantial changes in the channel in the vicinity of the bridge. The DOTD cross sections of 1988 and 1992 taken at the bridge indicate remnants of pier scour at DOTD stations 103+53 and 106+56. The 1988 and 1992 surveys indicate that the lowest channel-bed elevations are on the left bank. Although the channel is straight for three or four channel widths upstream and downstream (figs. 28 and 29), this straight part of the reach is between two relatively long and mild curves to the right. The general shape of the section defined by these two cross sections is typical of a reach which is turning to the right. The bed elevation at the pier (DOTD station 106+56) from the 1992 survey is more than 25 ft deeper than the elevation indicated by the surveys of 1968 and 1969. Remediation and protective measures could be considered if the deepening trend continues.
Interstate Highway 20 at Shreveport, Louisiana
Pier Scour
For evaluation of pier scour at Interstate Hwy. 20, values for y j at each pier were based on the COE hydrographic survey of 1980. The cross section resembles the channel-bed elevations recorded in 1953 and 1969, but is the highest of the three cross sections shown in figure 30. The right overbank pier has an estimated scour depth of 6.3 ft, which corresponds to a bed elevation of 160 ft above sea level (table 8). This elevation is equal to the pile-footing cap elevation. The pier at DOTD station 314+60 has an estimated scour depth of 10.3 ft, which corresponds to a bed elevation of 152 ft above sea level. This elevation is well above the pile-footing cap. The main piers at DOTD stations 317+25 and 320+85 have the largest predicted scour depths of approximately 34.7 and 38.0 ft. The minimum predicted channel-bed elevation from pier scour is 82 ft above sea level for the pier at DOTD station 320+85. Pier-scour computations for left overbank piers at DOTD stations 323+60, 324+80, and 326+00 have estimated scour depths of 10.3, 6.5, and 6.5 f*.. The scour estimate at DOTD station 326+00 indicates that the pile cap is slightly exposed. Computations outlined by Richardson and others (1991, 1993) for exposed footings were used to evaluate the scour potential for the exposed pile cap. The resulting scour depth was not substantially different from the initial pier scour computation.
46
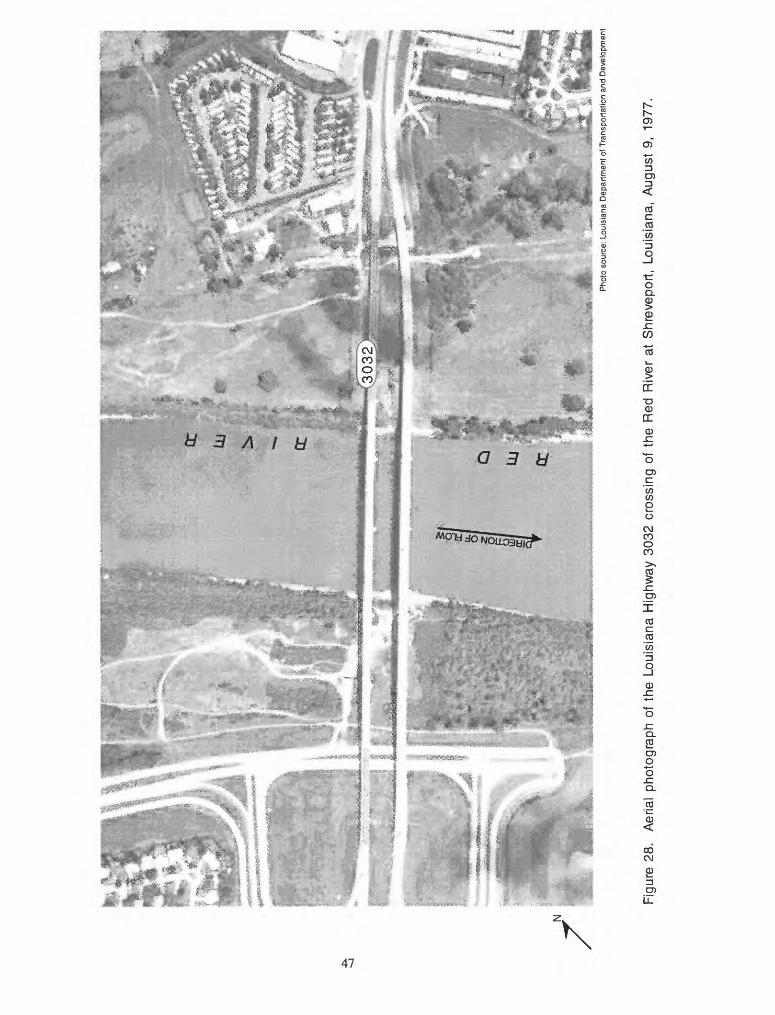
Pho
to s
ourc
e: L
ouis
iana
Dep
artm
ent
of T
rans
porta
tion
and
Dev
elop
men
t
Figu
re 2
8.
Aer
ial
phot
ogra
ph o
f th
e Lo
uisi
ana
Hig
hway
303
2 cr
ossi
ng o
f th
e R
ed R
iver
at
Shr
evep
ort,
Loui
sian
a, A
ugus
t 9,
197
7.
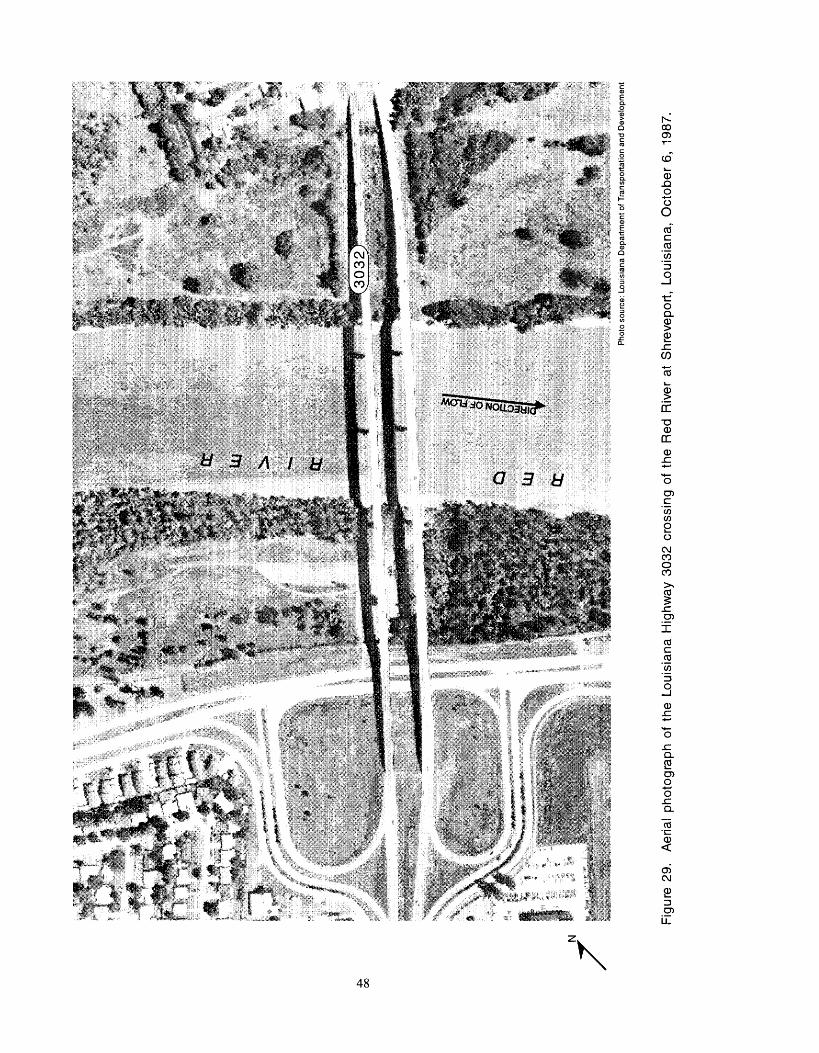
IN
Pho
to s
ourc
e: L
ouis
iana
Dep
artm
ent
of T
rans
porta
tion
and
Dev
elop
men
t
Fig
ure
29.
Aer
ial
phot
ogra
ph o
f th
e Lo
uisi
ana
Hig
hway
303
2 cr
ossi
ng o
f th
e R
ed R
iver
at
Shr
evep
ort,
Loui
sian
a, O
ctob
er 6
, 19
87.
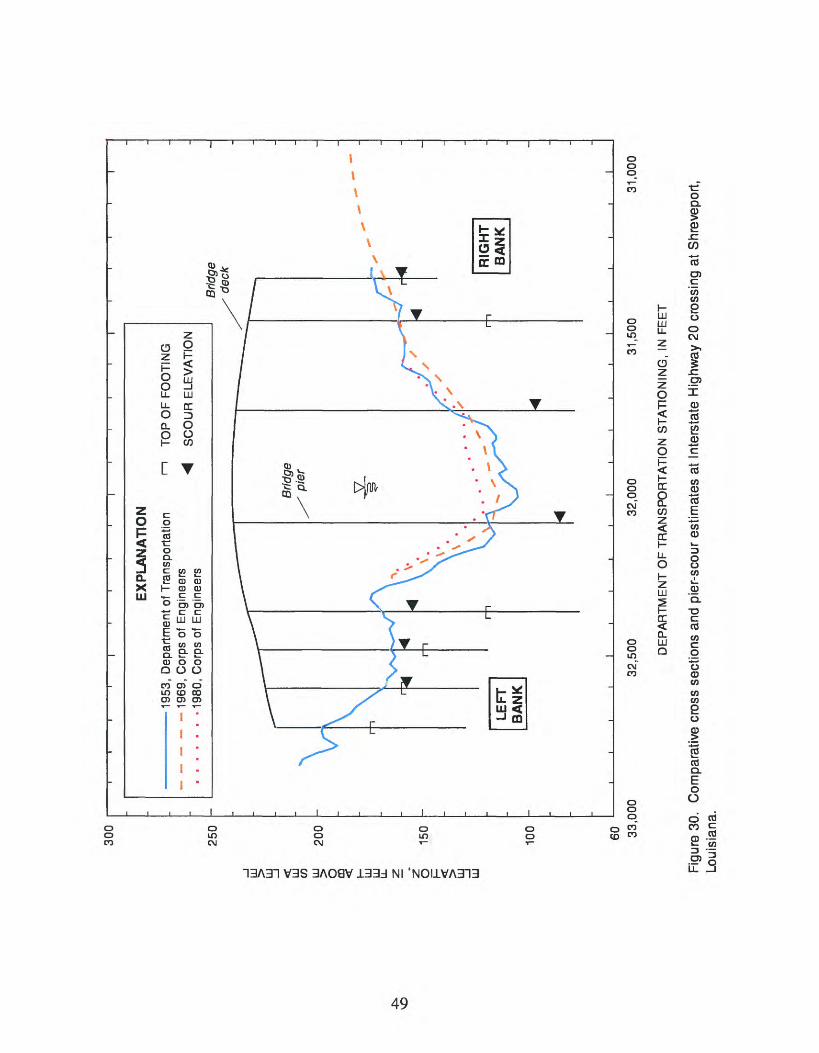
300
vo
LLJ
LJJ
CO O CQ LJJ O I y LJJ
250
200
150
100
60 33,0
00
EX
PL
AN
AT
ION
195
3, D
epar
tmen
t of T
rans
porta
tion
-.
-. 1
969,
Cor
ps o
f E
ngin
eers
......
-198
0, C
orps
of
Eng
inee
rs
TO
P O
F F
OO
TIN
G
SC
OU
R E
LEV
AT
ION
Brid
ge
deck
32,5
00
32,0
00
31,5
00
DE
PA
RT
ME
NT
OF
TR
AN
SP
OR
TA
TIO
N S
TA
TIO
NIN
G,
IN F
EE
T
31,0
00
Figu
re 3
0.
Com
para
tive
cros
s se
ctio
ns a
nd p
ier-
scou
r es
timat
es a
t In
ters
tate
Hig
hway
20
cros
sing
at
Shr
evep
ort,
Loui
sian
a.
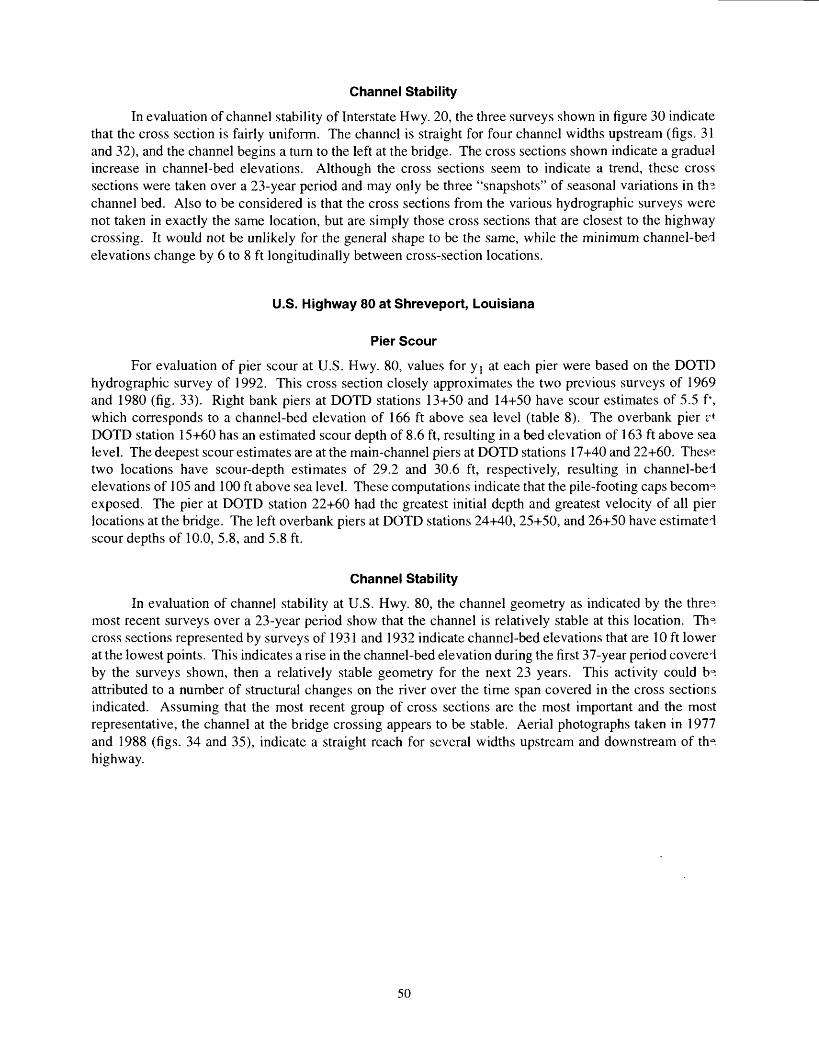
Channel Stability
In evaluation of channel stability of Interstate Hwy. 20, the three surveys shown in figure 30 indicate that the cross section is fairly uniform. The channel is straight for four channel widths upstream (figs. 31 and 32), and the channel begins a turn to the left at the bridge. The cross sections shown indicate a gradual increase in channel-bed elevations. Although the cross sections seem to indicate a trend, these cross sections were taken over a 23-year period and may only be three "snapshots" of seasonal variations in th?. channel bed. Also to be considered is that the cross sections from the various hydrographic surveys were not taken in exactly the same location, but are simply those cross sections that are closest to the highway crossing. It would not be unlikely for the general shape to be the same, while the minimum channel-bed elevations change by 6 to 8 ft longitudinally between cross-section locations.
U.S. Highway 80 at Shreveport, Louisiana
Pier Scour
For evaluation of pier scour at U.S. Hwy. 80, values for yj at each pier were based on the DOTD hydrographic survey of 1992. This cross section closely approximates the two previous surveys of 1969 and 1980 (fig. 33). Right bank piers at DOTD stations 13+50 and 14+50 have scour estimates of 5.5 f% which corresponds to a channel-bed elevation of 166 ft above sea level (table 8). The overbank pier ?t DOTD station 15+60 has an estimated scour depth of 8.6 ft, resulting in a bed elevation of 163 ft above sea level. The deepest scour estimates are at the main-channel piers at DOTD stations 17+40 and 22+60. These two locations have scour-depth estimates of 29.2 and 30.6 ft, respectively, resulting in channel-be-i elevations of 105 and 100 ft above sea level. These computations indicate that the pile-footing caps become exposed. The pier at DOTD station 22+60 had the greatest initial depth and greatest velocity of all pier locations at the bridge. The left overbank piers at DOTD stations 24+40, 25+50, and 26+50 have estimate! scour depths of 10.0, 5.8, and 5.8 ft.
Channel Stability
In evaluation of channel stability at U.S. Hwy. 80, the channel geometry as indicated by the threQ. most recent surveys over a 23-year period show that the channel is relatively stable at this location. Trn cross sections represented by surveys of 1931 and 1932 indicate channel-bed elevations that are 10 ft lower at the lowest points. This indicates a rise in the channel-bed elevation during the first 37-year period covered by the surveys shown, then a relatively stable geometry for the next 23 years. This activity could b~. attributed to a number of structural changes on the river over the time span covered in the cross sections indicated. Assuming that the most recent group of cross sections are the most important and the most representative, the channel at the bridge crossing appears to be stable. Aerial photographs taken in 1977 and 1988 (figs. 34 and 35), indicate a straight reach for several widths upstream and downstream of th". highway.
50
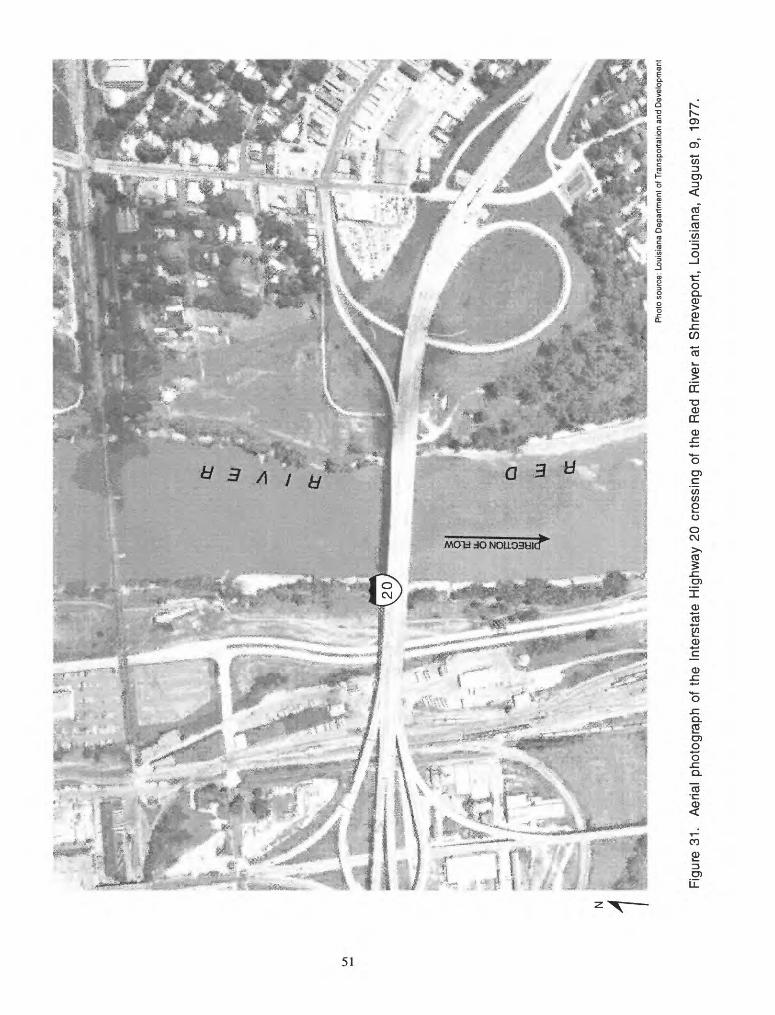
N
1P
hoto
sou
rce:
Lou
isia
na D
epar
tmen
t of
Tra
nspo
rtatio
n an
d D
evel
opm
ent
Figu
re 3
1.
Aer
ial
phot
ogra
ph o
f th
e In
ters
tate
Hig
hway
20
cros
sing
of
the
Red
Riv
er a
t S
hrev
epor
t, Lo
uisi
ana,
Aug
ust
9, 1
977.
IN 1P
hoto
sou
rce:
Lou
isia
na D
epar
tmen
t of T
rans
porta
tion
and
Dev
elop
men
t
Figu
re 3
2.
Aer
ial
phot
ogra
ph o
f th
e In
ters
tate
Hig
hway
20
cros
sing
of
the
Red
Riv
er a
t S
hrev
epor
t, Lo
uisi
ana,
Oct
ober
6,
1988
.
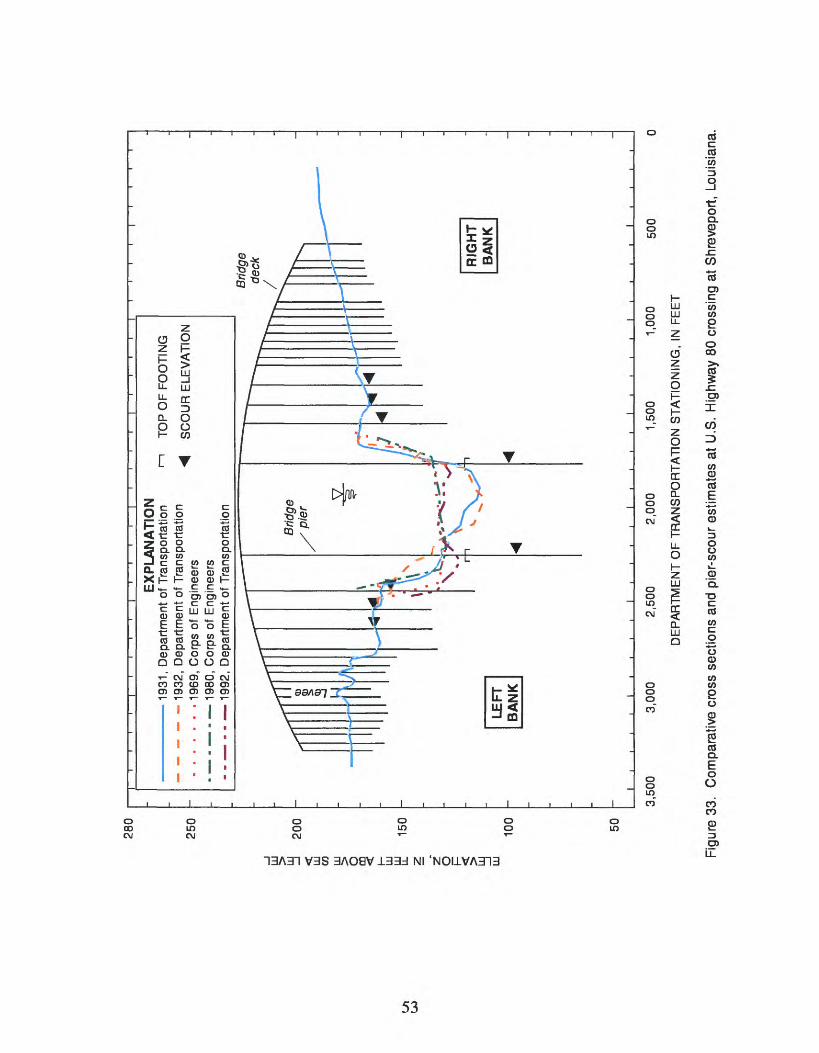
LO
LU
CO LU
O LU O I a LU
28
0
250
200
150
100
50
' '
' I
I
I I
I I
I I
EX
PL
AN
AT
ION
1
931,
Dep
artm
ent
of T
rans
porta
tion
1
932,
Dep
artm
ent
of T
rans
porta
tion
1
969,
Cor
ps o
f E
ngin
eers
1
980,
Cor
ps o
f E
ngin
eers
1
992,
Dep
artm
ent
of T
rans
porta
tion
TO
P O
F F
OO
TIN
G
SC
OU
R E
LE
VA
TIO
N
3,5
00
3,0
00
2,5
00
2,0
00
1,50
0 1,
000
DE
PA
RT
ME
NT
OF
TR
AN
SP
OR
TA
TIO
N S
TA
TIO
NIN
G,
IN F
EE
T
500
Figu
re 3
3.
Com
para
tive
cros
s se
ctio
ns a
nd p
ier-
scou
r es
timat
es a
t U
.S.
Hig
hway
80
cros
sing
at
Shr
evep
ort,
Loui
sian
a.
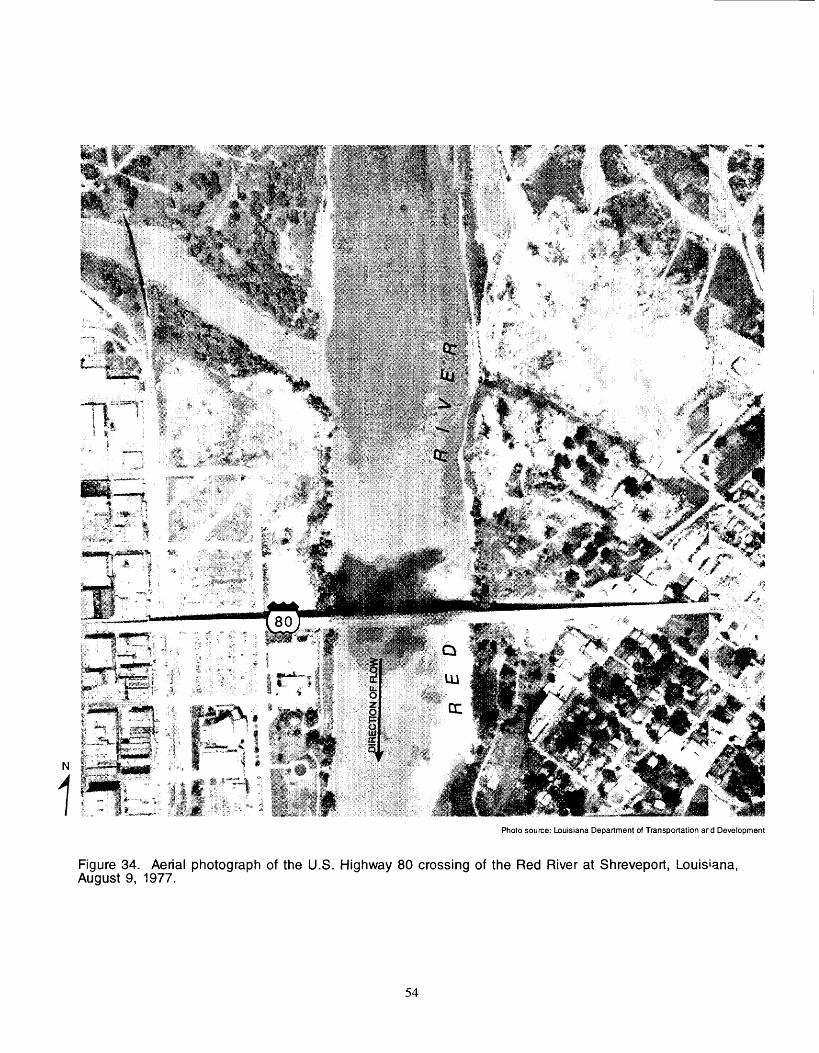
IN
1Photo source: Louisiana Department of Transportation and Development
Figure 34. Aerial photograph of the U.S. Highway 80 crossing of the Red River at Shreveport, Louisiana, August 9, 1977.
54
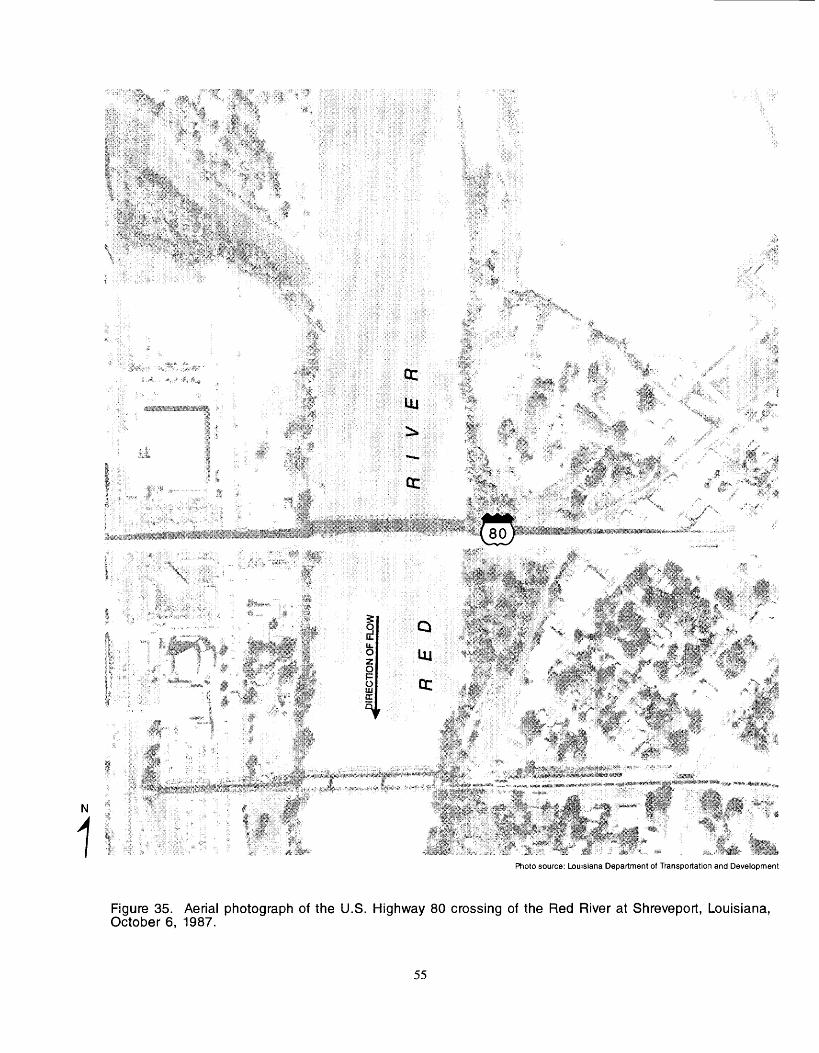
IN
1Photo source: Louisiana Department of Transportation and Development
Figure 35. Aerial photograph of the U.S. Highway 80 crossing of the Red River at Shreveport, Louisiana, October 6, 1987.
55
Interstate Highway 220 at Shreveport, Louisiana
Flood-frequency estimates based on the data shown in figure 3 were used for the hydraulic analysis. The 500-year flood estimate is 371,300 ft3/s (table 1). Hydraulic computations were based on calibration simulations for other highway crossings at Shreveport. The model reach for evaluation of the Interstate Hwy. 220 bridge extends from about 6,500 ft downstream of the highway crossing through the bridge cross section. The width of the channel at the 500-year flood estimate ranges from 3,000 to 5,500 ft throughout the reach. The minimum channel-bed elevations for cross sections in the reach ranged from 129 to 137 ft above sea level. The starting downstream boundary condition for computations using WSPRO was a slope of 0.0002, which is the same slope used in the calibration simulations. The computed water-surfroe elevation resulting from hydraulic simulations using the 500-year flood estimate was about 178.7 ft abo'e sea level (table 9). Simulations indicate velocities ranging from 3.1 to 8.6 ft/s along the cross section at the bridge.
Table 9. Pier-scour estimates for Interstate Highway 220 crossing the Red River near Shreveport, Louisiana
[DOTD, Louisiana Department of Transportation and Development; WSE, water-surface elevation, in feet above sea level; GSE, ground-surface (channel-bed) elevation, in feet above sea level; a, width of pier, in feet; Kj, dimensionless correction factor for pier nose shape; K2 , dimensionless correction factor for angle of flow attack; K3 , dimensionless correction factor for channel-bed condition; Fr, Froude number computed at the location; ys , estimated depth of pier scour, in feet; y lt flow depth directly upstream of the pier, in feet; Tw, estimated top width of the scour hole, in feet; V, velocity computed for that location in the cross section, in feet per second; yd , channel-bed elevation of the computed scour hole, in feet above sea level]
DOTD station
457+50
459+10
460+65
463+05
465+80
468+20
469+85
471+50
473+15
474+80
WSE
178.7
178.7
178.7
178.7
178.7
178.7
178.7
178.7
178.7
178.7
GSE
166
170
165
130
129
151
148
147
160
159
a
6
6
6
6
6
6
6
6
6
6
K,
.0
.0
1.0
.0
.0
.0
0
.0
.0
.0
K2 K
1.0 1.
1.0 1.
1.0 1.
1.0 1.
1.0 1.
1.0 1.
1.0 1.
1.0 1.
1.0 1.
1.0 1.
» Fr
0.15
.19
.15
.17
.17
.29
.17
.15
.17
.15
Vs
7.7
7.2
7.7
12.9
12.9
13.2
10.8
10.5
9.2
8.8
Vi
12.7
8.4
13.7
48.7
49.7
27.7
30.7
31.7
18.7
19.7
Tw
21
20
21
35
36
36
30
29
25
24
V
3.1
3.1
3.1
6.8
6.8
8.6
5.2
4.8
4.2
3.7
Yd 1
158
163
157
117
116
138
137
137
151
150
Numbers are rounded to the nearest foot.
Pier Scour
For evaluation of pier scour at Interstate Hwy. 220, values for yj at each pier were based on the DOTD hydrographic survey of 1991. The cross section represented by this survey represents a fairly uniform section (fig. 36). Other surveys at this site indicate little movement of the thalweg. Values for Kj=1.0, K2=1.0, and K3=l.l were based on DOTD bridge plans and recommendations presented by Richardson and others (1993, p. 39-40). The Froude number at the pier location is based upon the value of velocity, which was computed using WSPRO.
The maximum computed scour depth was about 13.2 ft for the pier at DOTD station 468+20 (table 9). The minimum channel-bed elevation of the computed scour hole at DOTD station 465+80 is about 116 ft above sea level. The elevation of the top of the footing for this pier is about 102 ft above sea level.
56
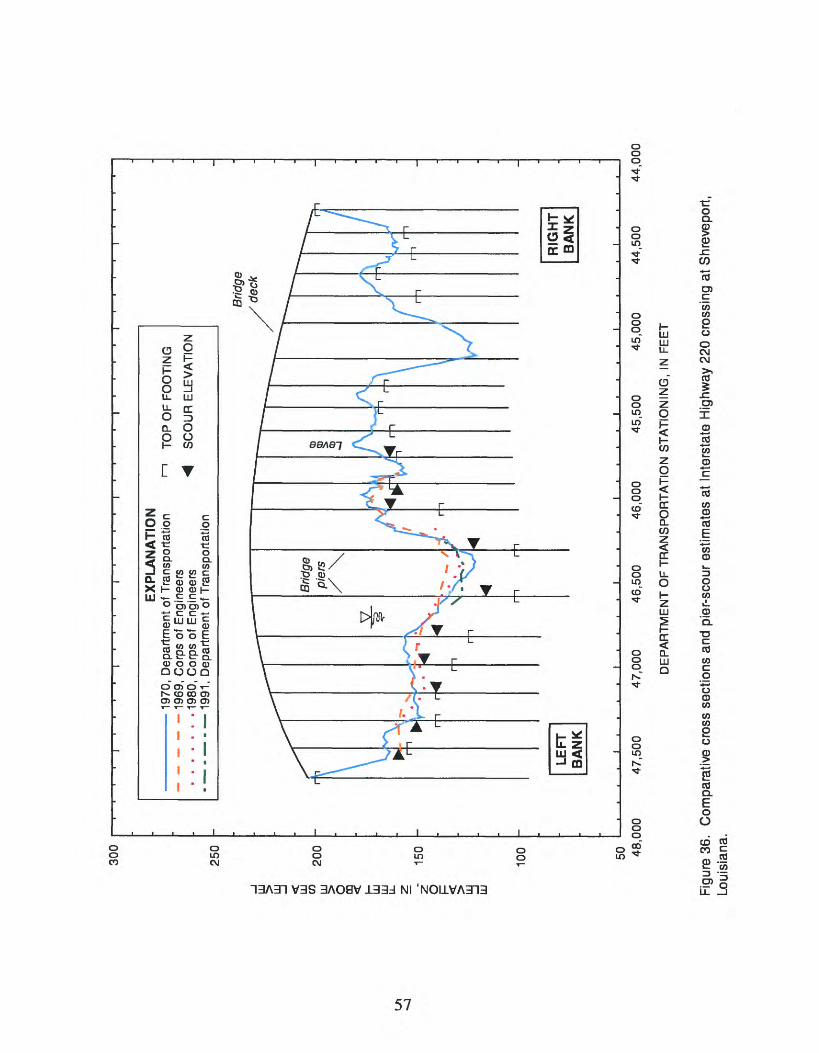
300
Lfl
LJJ
LJJ
U) O ffl LJJ
LL O I a LJJ
250
200
150
100 50 48
,000
EX
PL
AN
AT
ION
1
970,
Dep
artm
ent
of T
rans
porta
tion
----- 1
969,
Cor
ps o
f E
ngin
eers
......
. 198
0, C
orps
of
Eng
inee
rs
1
991,
Dep
artm
ent
of T
rans
porta
tion
TO
P O
F F
OO
TIN
G
SC
OU
R E
LEV
AT
ION
Brid
ge
deck
47,5
00
47,0
00
46,5
00
46,0
00
45,5
00
45,0
00
DE
PA
RT
ME
NT
OF
TR
AN
SP
OR
TA
TIO
N S
TA
TIO
NIN
G,
IN F
EE
T
44,5
0044
,000
Figu
re 3
6.
Com
para
tive
cros
s se
ctio
ns a
nd p
ier-
scou
r es
timat
es a
t In
ters
tate
Hig
hway
220
cro
ssin
g at
Shr
evep
ort,
Loui
sian
a.
Channel Stability
Cross-section information exists for the years 1969, 1970, 1980, and 1991. The elevation of th~, thalweg changes about 10 ft among the surveys. Indication of any lateral movement or shifting of trn channel is not significant based on the survey information. Some of the variation in channel-bed elevations may be the response of the stream bed to seasonal variations in discharge. The right bank is the steepest of the two stream banks, and is the outside bank of the curve in the river to the left. Although this bank is relatively steeply sloping, and is the outside bank of a curve, the cross-section information indicates that it is stable and shows no erosion. Figures 37 and 38 are aerial photographs of the bridge crossing for 1977 and 1987. Timber river-training works are visible on the right bank in the photographs. This timber piling may have contributed to the stability of the right bank.
Louisiana Highway 2 near Hosston, Louisiana
Flood-frequency estimates based on the regression shown in figure 7 were used for the hydraulic analysis. The 500-year flood estimate is 386,700 ft3/s (table 1). Hydraulic simulations were calibrated to a historic discharge of 214,000 ft3/s, with a water-surface elevation of 189.5 ft above sea level. The computed water-surface elevation resulting from hydraulic simulations using the 500-year flood estimate was 198.6 ft above sea level (table 10). The model reach for evaluation of the La. Hwy. 2 bridge extends from about 4,000 ft downstream to 500 ft upstream of the highway crossing. The width of the channel at the 500-yerr flood estimate ranges from 2,700 to 4,500 ft throughout the reach. The minimum channel-bed elevations for cross sections in the reach ranged from 140 to 160 ft above sea level. The downstream starting elevation for computations using WSPRO was a slope of 0.0002 ft/ft, which is the same slope used in the calibration simulations. Simulations indicate velocities ranging from 3.8 to 8.6 ft/s along the cross section at the bridge (table 10).
Table 10. Pier-scour estimates for Louisiana Highway 2 crossing the Red River near Hosston, Louisiana
[DOTD, Louisiana Department of Transportation and Development; WSE, water-surface elevation, in feet above sea level; GSE, ground-surface (channel-bed) elevation, in feet above sea level; a, width of pier, in feet; K 1? dimensionless correction factor for pier nose shape; K2 , dimensionless correction factor for angle of flow attack; K^, dimensionless correction factor for channel-bed condition; Fr, Froude number computed at the location; ys , estimated depth of pier scour, in feet; y l5 flow depth directly upstream of the pier, in feet; Tw, estimated top width of the scour hole, in feet; V, velocity computed for that location in the cross section, in feet per second; yd , channel-bed elevation of the computed scour hole, in feet above sea level]
DOTD station
304+34
308+00
311+65
315+30
318+93
WSE
198.6
198.6
198.6
198.6
198.6
GSE
175
143
170
168
178
a
13
13
13
13
13
K,
1.0
1.0
1.0
1.0
1.0
K2 K
1.0 1.
1.0 1.
1.0 1.
1.0 1.
1.0 1.
» Fr
0.14
.18
.28
.24
.15
Vs
13.7
20.8
19.9
19.1
13.6
Vi
23.6
55.6
28.6
30.6
20.6
Tw
38
57
55
52
37
V
3.8
7.7
8.6
7.6
3.9
Yd'
161
122
150
149
164
Landward of 319+00
Left overbank piers
198.6 172 13 1.0 1.0 .10 12.4 26.6 34 2.9 160
Numbers are rounded to the nearest foot.
58
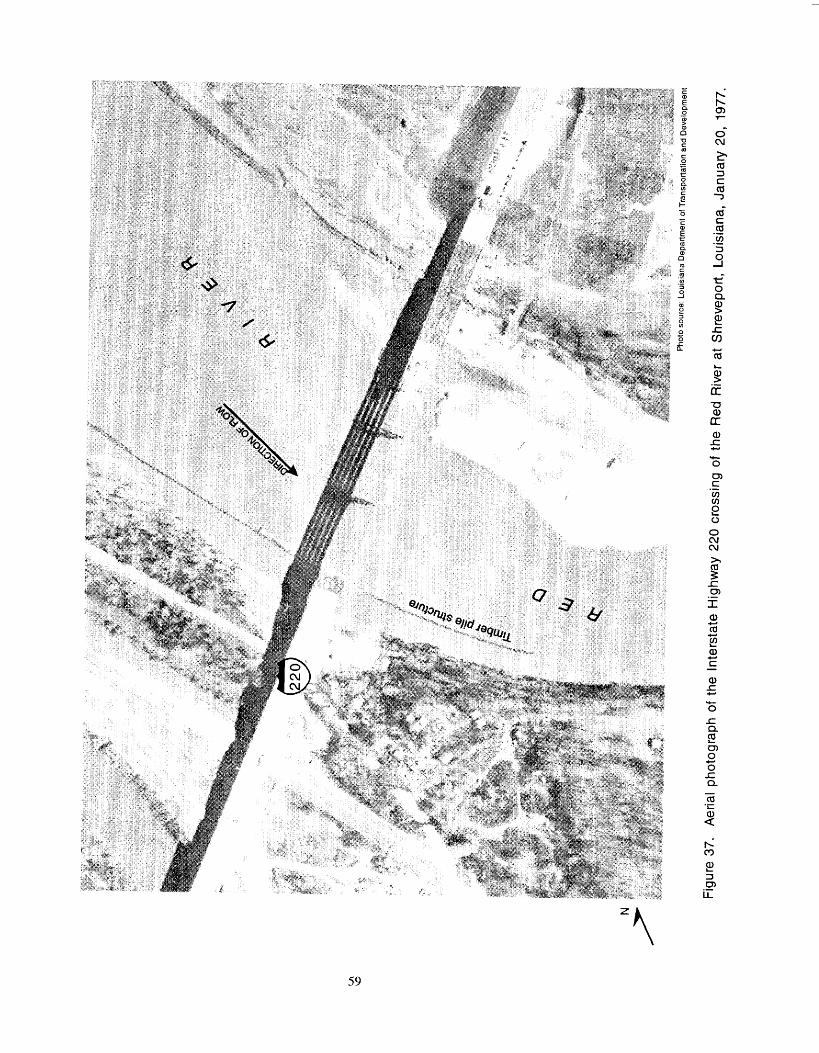
Pho
to s
ourc
e: L
ouis
iana
Dep
artm
ent o
f Tra
nspo
rtatio
n an
d D
evel
opm
ent
Figu
re 3
7.
Aer
ial
phot
ogra
ph o
f th
e In
ters
tate
Hig
hway
220
cro
ssin
g of
the
Red
Riv
er a
t S
hrev
epor
t, Lo
uisi
ana,
Jan
uary
20,
197
7.
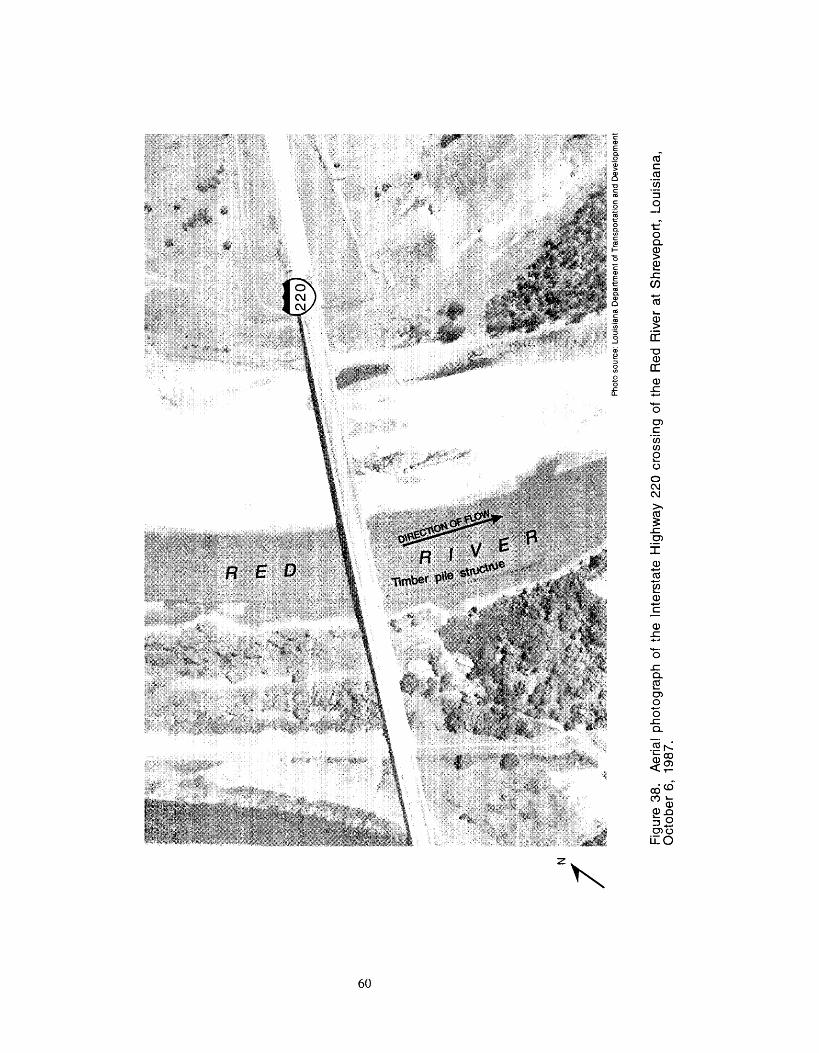
Os
O
Pho
to s
ourc
e: L
ouis
iana
Dep
artm
ent
of T
rans
porta
tion
and
Dev
elop
men
t
Fig
ure
38.
Aer
ial
phot
ogra
ph o
f th
e In
ters
tate
Hig
hway
220
cro
ssin
g of
the
Red
Riv
er a
t S
hrev
epor
t, Lo
uisi
ana,
O
ctob
er 6
, 19
87.
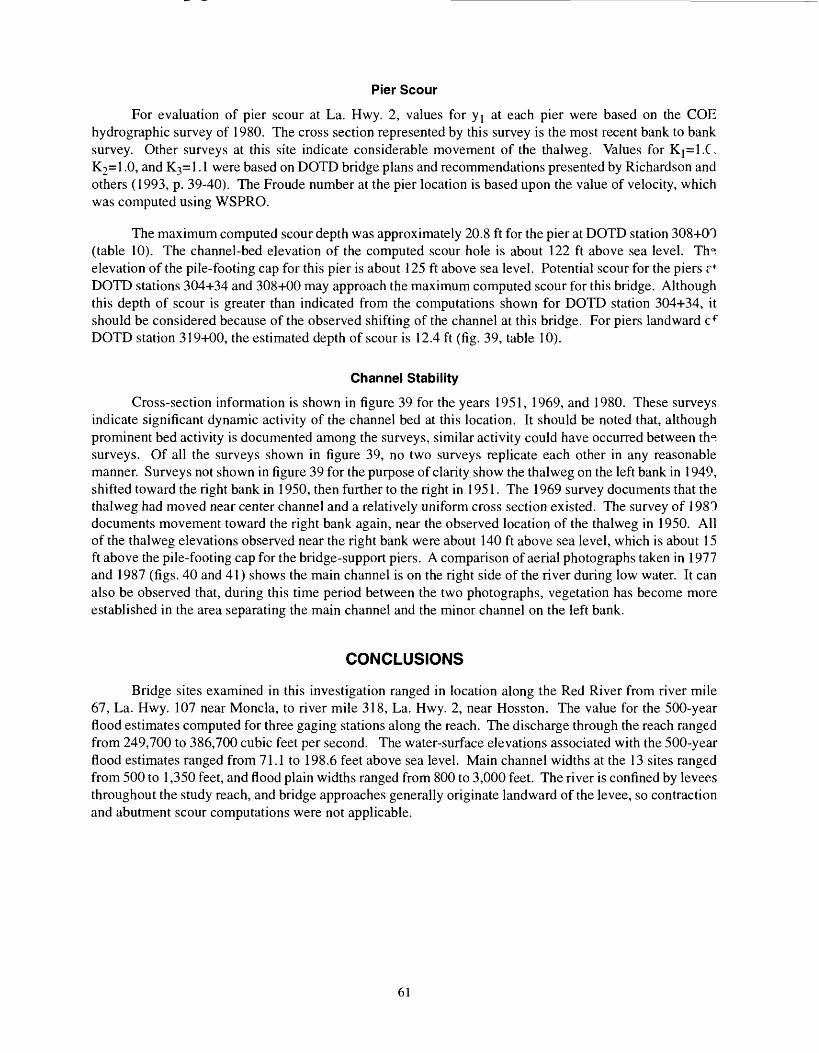
Pier Scour
For evaluation of pier scour at La. Hwy. 2, values for yi at each pier were based on the COR hydrographic survey of 1980. The cross section represented by this survey is the most recent bank to bank survey. Other surveys at this site indicate considerable movement of the thalweg. Values for Ki=l.C, K2=l .0, and K3=l. 1 were based on DOTD bridge plans and recommendations presented by Richardson and others (1993, p. 39-40). The Froude number at the pier location is based upon the value of velocity, which was computed using WSPRO.
The maximum computed scour depth was approximately 20.8 ft for the pier at DOTD station 308+00 (table 10). The channel-bed elevation of the computed scour hole is about 122 ft above sea level. Trn elevation of the pile-footing cap for this pier is about 125 ft above sea level. Potential scour for the piers rf DOTD stations 304+34 and 308+00 may approach the maximum computed scour for this bridge. Although this depth of scour is greater than indicated from the computations shown for DOTD station 304+34, it should be considered because of the observed shifting of the channel at this bridge. For piers landward cf DOTD station 319+00, the estimated depth of scour is 12.4 ft (fig. 39, table 10).
Channel Stability
Cross-section information is shown in figure 39 for the years 1951, 1969, and 1980. These surveys indicate significant dynamic activity of the channel bed at this location. It should be noted that, although prominent bed activity is documented among the surveys, similar activity could have occurred between tha, surveys. Of all the surveys shown in figure 39, no two surveys replicate each other in any reasonable manner. Surveys not shown in figure 39 for the purpose of clarity show the thalweg on the left bank in 1949, shifted toward the right bank in 1950, then further to the right in 1951. The 1969 survey documents that the thalweg had moved near center channel and a relatively uniform cross section existed. The survey of 1980 documents movement toward the right bank again, near the observed location of the thalweg in 1950. All of the thalweg elevations observed near the right bank were about 140 ft above sea level, which is about 15 ft above the pile-footing cap for the bridge-support piers. A comparison of aerial photographs taken in 1977 and 1987 (figs. 40 and 41) shows the main channel is on the right side of the river during low water. It can also be observed that, during this time period between the two photographs, vegetation has become more established in the area separating the main channel and the minor channel on the left bank.
CONCLUSIONS
Bridge sites examined in this investigation ranged in location along the Red River from river mile 67, La. Hwy. 107 near Moncla, to river mile 318, La. Hwy. 2, near Hosston. The value for the 500-year flood estimates computed for three gaging stations along the reach. The discharge through the reach ranged from 249,700 to 386,700 cubic feet per second. The water-surface elevations associated with the 500-year flood estimates ranged from 71.1 to 198.6 feet above sea level. Main channel widths at the 13 sites ranged from 500 to 1,350 feet, and flood plain widths ranged from 800 to 3,000 feet. The river is confined by levees throughout the study reach, and bridge approaches generally originate landward of the levee, so contraction and abutment scour computations were not applicable.
61
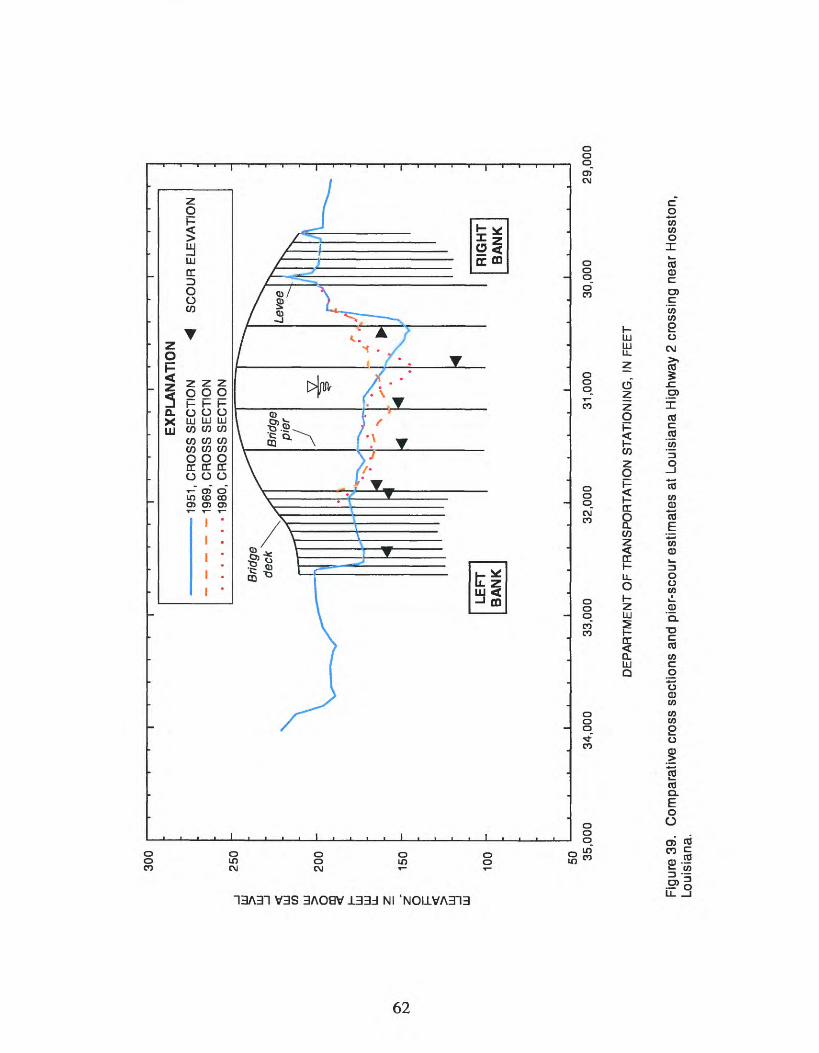
Os
to
LJJ
LJJ
300
250
LJJ
CO LJJ o
20°
LJJ
15°
100 50 35
,000
34,0
00
EX
PL
AN
AT
ION
1951
, C
RO
SS
SE
CT
ION
19
69,
CR
OS
S S
EC
TIO
N
1980
, C
RO
SS
SE
CT
ION
SC
OU
R E
LEV
AT
ION
Brid
ge
LEFT
B
AN
K
Brid
ge
pier
Leve
e
33,0
0032
,000
31,0
0030
,000
29,0
00
DE
PA
RT
ME
NT
OF
TR
AN
SP
OR
TA
TIO
N S
TA
TIO
NIN
G,
IN F
EE
T
Figu
re 3
9.
Com
para
tive
cros
s se
ctio
ns a
nd p
ier-
scou
r es
timat
es a
t Lo
uisi
ana
Hig
hway
2 c
ross
ing
near
Hos
ston
, Lo
uisi
ana.
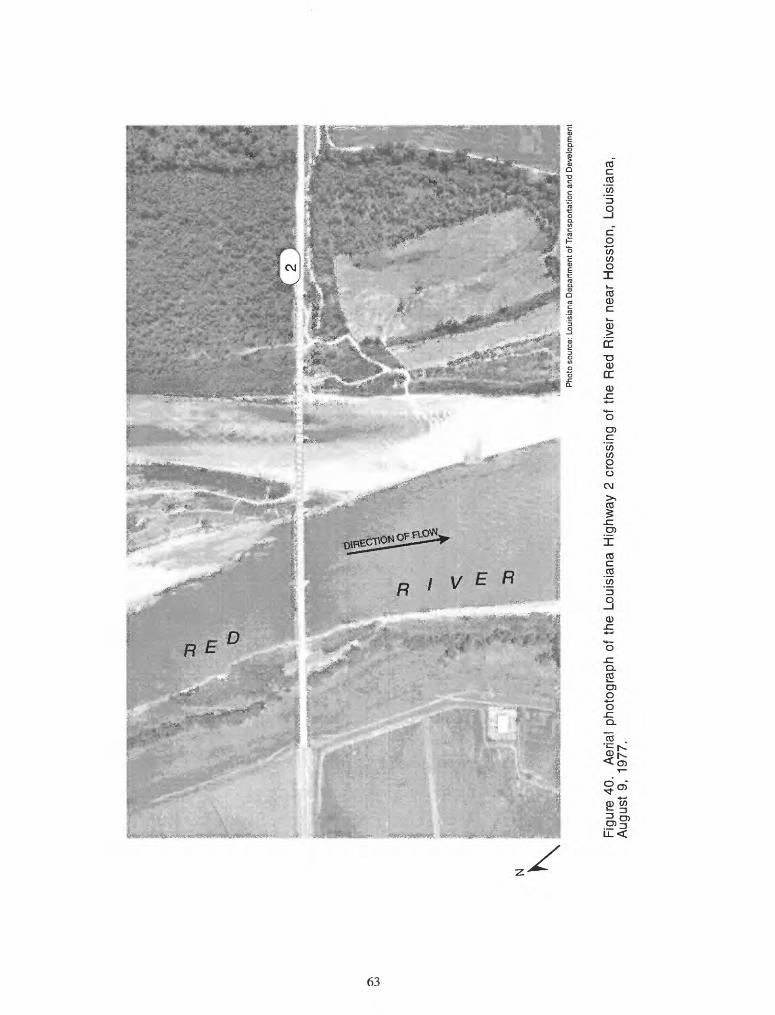
Pho
to s
ourc
e: L
ouis
iana
Dep
artm
ent o
f Tra
nspo
rtatio
n an
d D
evel
opm
ent
Figu
re 4
0.
Aer
ial
phot
ogra
ph o
f th
e Lo
uisi
ana
Hig
hway
2 c
ross
ing
of t
he R
ed R
iver
nea
r H
osst
on,
Loui
sian
a,
Aug
ust
9, 1
977.
Pho
to s
ourc
e: L
ouis
iana
Dep
artm
ent o
f Tra
nspo
rtatio
n an
d D
evel
opm
ent
Figu
re 4
1.
Aer
ial
phot
ogra
ph o
f th
e Lo
uisi
ana
Hig
hway
2 c
ross
ing
of t
he R
ed R
iver
nea
r H
osst
on,
Loui
sian
a, O
ctob
er 6
, 19
87.
To determine values for the hydraulic variables that are used in the pier-scour equation, the Water Surface Profile model, WSPRO, was calibrated to historic data along the river. Downstream boundary conditions were established by a water-surface specification for one site, and by a water-surface slope at all others. Values for the velocity at each pier were established from partitioning the flow along the cross section. Roughness coefficients used in the hydraulic simulations ranged from 0.025 to 0.035 in the channels to 0.06 to 0.08 in the overbanks. The calibrated model was then used to simulate the hydraulic conditions associated with the 500-year flood estimates.
The Colorado State University pier-scour equation presented in HEC-18 were applied to estimate the amount of scour that could occur during a 500-year flood estimate. Scour depths estimated at piers ranged from approximately 3.0 feet on the overbank at La. Hwy. 3032 to approximately 47 feet for a main channel pier on U.S. Hwy. 167. At La. Hwy. 8 where piers are protected by riprap, a scour estimate was computed but was not relevant. Periodic monitoring of the elevation of the riprap has indicated that the riprap has stabilized the channel bed.
The channel was most dynamic at La. Hwy. 2, where periodic surveys indicated a shifting thalweg. The site with the most physical evidence of pier scour was La. Hwy. 3032. Scour holes were also measured at this site during the 1990 high flow event, which are comparable in magnitude to the estimated scour depths.
SELECTED REFERENCES
Biedenharn, D.S., Combs, P.G., Hill, G.J., Pinkard, C.F., Jr., and Pinkston, C.B., 1989, Relationship between channel migration and radius of curvature on the Red River, in Wang, S.S.Y., ed., 1989, Sediment Transport Modeling Proceedings of the International Symposium (New Orleans, La., Aug. 14-18, 1989), New York, American Society of Civil Engineers, p. 536-541.
Lagasse, P.P., Schall, J.D., Johnson, F., Richardson, E.V., Richardson, J.R., Chang, F., 1991, Stream stability at highway structures: U.S. Department of Transportation, Federal Highway Administration, FHWA-IP-90-014, Hydraulic Engineering Circular no. 20, 195 p.
Nanson, G.C., and Hickin, E.J., 1986, A statistical analysis of bank erosion and channel migration in Western Canada: Geological Society of America, Bulletin 97, p. 497-504.
Neill, C.R., and Yaremko, E.K., 1989, Identifying causes and predicting effects of bank erosion, in Ports, M.A., ed., Hydraulic Engineering: Proceedings of the 1989 National Conference on Hydraulic Engineering (New Orleans, La., Aug. 14-18, 1989), New York, American Society of Civil Engineers, p. 101-105.
Richardson, E.V., Harrison, L.J., and Davis, S.R., 1991, Evaluating scour at bridges: U.S. Department of Transpo"- tation, Federal Highway Administration, FHWA-IP-90-017, Hydraulic Engineering Circular no. 18, 105 p.
Richardson, E.V., Harrison, L.J., Richardson, J.R, and Davis, S.R., 1993 (revised), Evaluating scour at bridges: U.S. Department of Transportation, Federal Highway Administration, FHWA-IP-90-017, Hydraulic Engineerirg Circular no. 18, 105 p.
Shearman, J.O., Kirby, W.H., Schneider, V.R., and Flippo, H.N., Bridge waterways analysis: U.S. Department of Transportation, Federal Highway Administration, Research Report, FHWA-RD-86-108, 112 p.
Thorne, C.R., 1989, Bank processes on the Red River between Index, Arkansas, and Shreveport, Louisiana, Preliminary draft of final technical report to European Research Office of U.S. Army, London, England.
U.S. Geological Survey, 1982, Guidelines for determining flood flow frequency: Reston, Va., Office of Water Data Coordination, Interagency Advisory Committee on Water Data, Bulletin 17B of the Hydrology Subcommittee, 162 p.
65


![International Journal of Engineering...scour include internal openings through the pier, one of these method is slot [5-7]. Grimaldi et al. [8] indicated that the values of scour depth](https://static.fdocuments.net/doc/165x107/61374d4a0ad5d20676488869/international-journal-of-engineering-scour-include-internal-openings-through.jpg)