Estimation of Ocean Current Velocity near Incheon using...
10
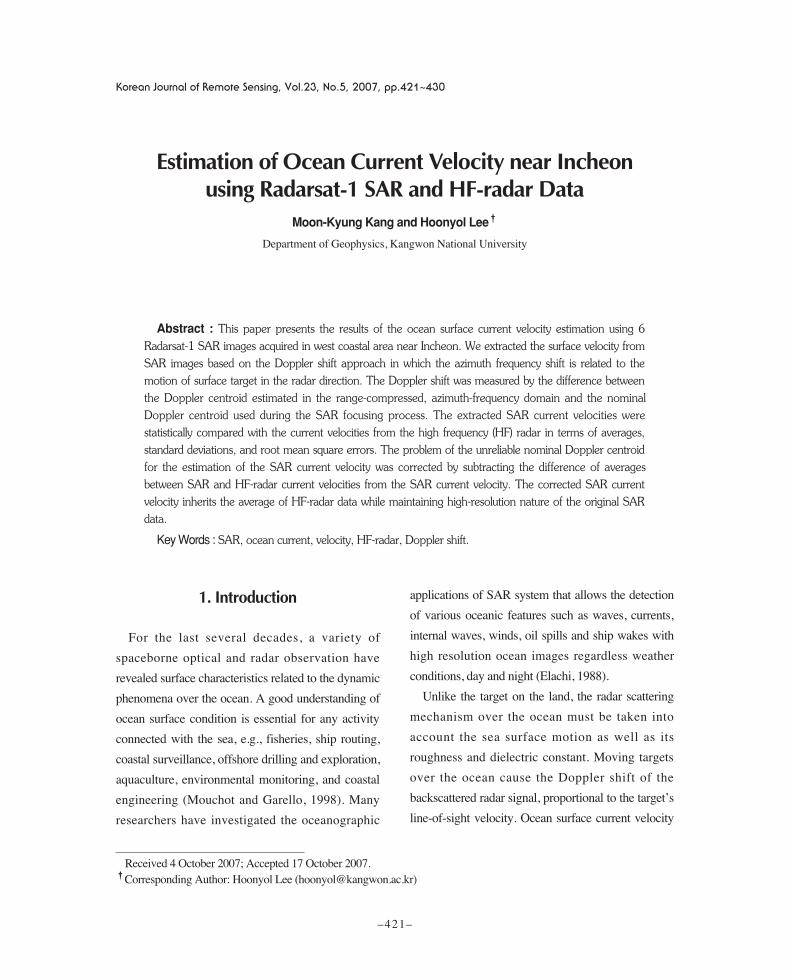
1. Introduction For the last several decades, a variety of spaceborne optical and radar observation have revealed surface characteristics related to the dynamic phenomena over the ocean. A good understanding of ocean surface condition is essential for any activity connected with the sea, e.g., fisheries, ship routing, coastal surveillance, offshore drilling and exploration, aquaculture, environmental monitoring, and coastal engineering (Mouchot and Garello, 1998). Many researchers have investigated the oceanographic applications of SAR system that allows the detection of various oceanic features such as waves, currents, internal waves, winds, oil spills and ship wakes with high resolution ocean images regardless weather conditions, day and night (Elachi, 1988). Unlike the target on the land, the radar scattering mechanism over the ocean must be taken into account the sea surface motion as well as its roughness and dielectric constant. Moving targets over the ocean cause the Doppler shift of the backscattered radar signal, proportional to the target’s line-of-sight velocity. Ocean surface current velocity –421– Estimation of Ocean Current Velocity near Incheon using Radarsat-1 SAR and HF-radar Data Moon-Kyung Kang and Hoonyol Lee † Department of Geophysics, Kangwon National University Abstract : This paper presents the results of the ocean surface current velocity estimation using 6 Radarsat-1 SAR images acquired in west coastal area near Incheon. We extracted the surface velocity from SAR images based on the Doppler shift approach in which the azimuth frequency shift is related to the motion of surface target in the radar direction. The Doppler shift was measured by the difference between the Doppler centroid estimated in the range-compressed, azimuth-frequency domain and the nominal Doppler centroid used during the SAR focusing process. The extracted SAR current velocities were statistically compared with the current velocities from the high frequency (HF) radar in terms of averages, standard deviations, and root mean square errors. The problem of the unreliable nominal Doppler centroid for the estimation of the SAR current velocity was corrected by subtracting the difference of averages between SAR and HF-radar current velocities from the SAR current velocity. The corrected SAR current velocity inherits the average of HF-radar data while maintaining high-resolution nature of the original SAR data. Key Words : SAR, ocean current, velocity, HF-radar, Doppler shift. Korean Journal of Remote Sensing, Vol.23, No.5, 2007, pp.421~430 Received 4 October 2007; Accepted 17 October 2007. † Corresponding Author: Hoonyol Lee ([email protected])
Transcript of Estimation of Ocean Current Velocity near Incheon using...
1. Introduction
For the last several decades, a variety of
spaceborne optical and radar observation have
revealed surface characteristics related to the dynamic
phenomena over the ocean. A good understanding of
ocean surface condition is essential for any activity
connected with the sea, e.g., fisheries, ship routing,
coastal surveillance, offshore drilling and exploration,
aquaculture, environmental monitoring, and coastal
engineering (Mouchot and Garello, 1998). Many
researchers have investigated the oceanographic
applications of SAR system that allows the detection
of various oceanic features such as waves, currents,
internal waves, winds, oil spills and ship wakes with
high resolution ocean images regardless weather
conditions, day and night (Elachi, 1988).
Unlike the target on the land, the radar scattering
mechanism over the ocean must be taken into
account the sea surface motion as well as its
roughness and dielectric constant. Moving targets
over the ocean cause the Doppler shift of the
backscattered radar signal, proportional to the target’s
line-of-sight velocity. Ocean surface current velocity
–421–
Estimation of Ocean Current Velocity near Incheon using Radarsat-1 SAR and HF-radar Data
Moon-Kyung Kang and Hoonyol Lee†
Department of Geophysics, Kangwon National University
Abstract : This paper presents the results of the ocean surface current velocity estimation using 6Radarsat-1 SAR images acquired in west coastal area near Incheon. We extracted the surface velocity fromSAR images based on the Doppler shift approach in which the azimuth frequency shift is related to themotion of surface target in the radar direction. The Doppler shift was measured by the difference betweenthe Doppler centroid estimated in the range-compressed, azimuth-frequency domain and the nominalDoppler centroid used during the SAR focusing process. The extracted SAR current velocities werestatistically compared with the current velocities from the high frequency (HF) radar in terms of averages,standard deviations, and root mean square errors. The problem of the unreliable nominal Doppler centroidfor the estimation of the SAR current velocity was corrected by subtracting the difference of averagesbetween SAR and HF-radar current velocities from the SAR current velocity. The corrected SAR currentvelocity inherits the average of HF-radar data while maintaining high-resolution nature of the original SARdata.
Key Words : SAR, ocean current, velocity, HF-radar, Doppler shift.
Korean Journal of Remote Sensing, Vol.23, No.5, 2007, pp.421~430
Received 4 October 2007; Accepted 17 October 2007.†Corresponding Author: Hoonyol Lee ([email protected])
can be evaluated by estimating the Doppler frequency
of the SAR data. The Doppler shift can be measured
by estimating the difference of the Doppler centroid
obtained from the SAR data and the nominal Doppler
centroid calculated by using the trajectory parameters
of satellite orbit.
The purpose of this study is 1) the estimation of
ocean current velocity from SAR images using the
Doppler shift method and 2) the evaluation and
correction of the results by comparing them with HF-
radar data.
2. Methodology
1) Study Area and Data
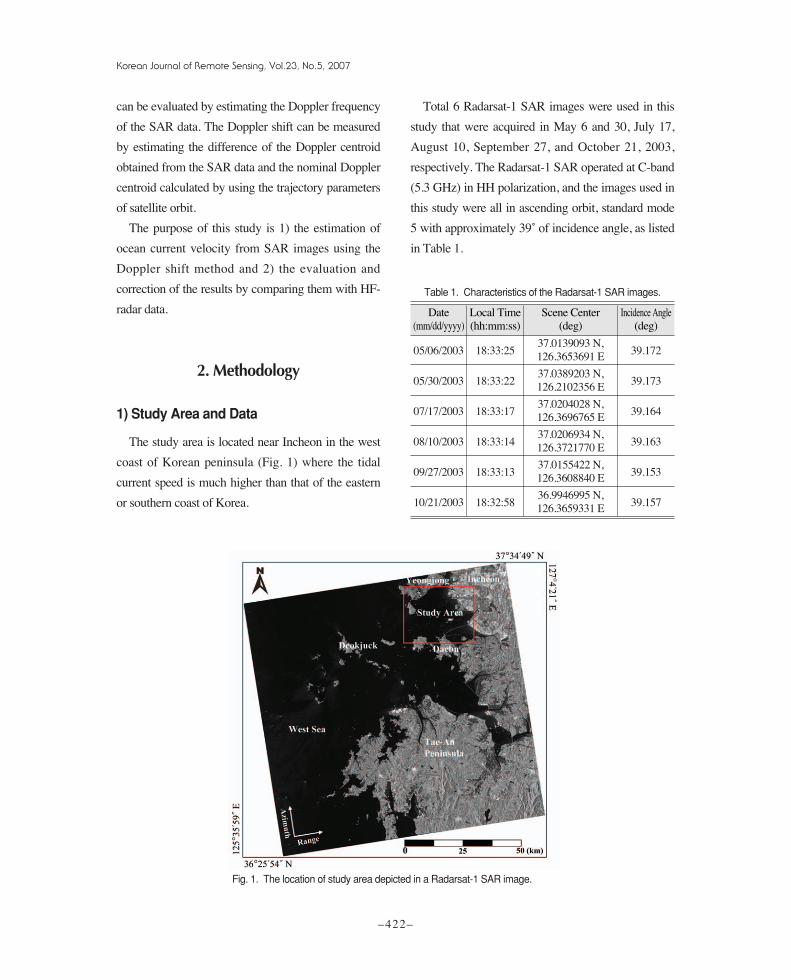
The study area is located near Incheon in the west
coast of Korean peninsula (Fig. 1) where the tidal
current speed is much higher than that of the eastern
or southern coast of Korea.
Total 6 Radarsat-1 SAR images were used in this
study that were acquired in May 6 and 30, July 17,
August 10, September 27, and October 21, 2003,
respectively. The Radarsat-1 SAR operated at C-band
(5.3 GHz) in HH polarization, and the images used in
this study were all in ascending orbit, standard mode
5 with approximately 39˚ of incidence angle, as listed
in Table 1.
Korean Journal of Remote Sensing, Vol.23, No.5, 2007
–422–
Table 1. Characteristics of the Radarsat-1 SAR images.
Date Local Time Scene Center Incidence Angle(mm/dd/yyyy) (hh:mm:ss) (deg) (deg)
05/06/2003 18:33:2537.0139093 N,
39.172126.3653691 E
05/30/2003 18:33:2237.0389203 N,
39.173126.2102356 E
07/17/2003 18:33:1737.0204028 N,
39.164126.3696765 E
08/10/2003 18:33:1437.0206934 N,
39.163126.3721770 E
09/27/2003 18:33:1337.0155422 N,
39.153126.3608840 E
10/21/2003 18:32:5836.9946995 N,
39.157126.3659331 E
Date Local Time Scene Center Incidence Angle(mm/dd/yyyy) (hh:mm:ss) (deg) (deg)
Fig. 1. The location of study area depicted in a Radarsat-1 SAR image.
The HF-radar data used in this work were
measured by National Oceanographic Research
Institute (NORI) of Korea at the same time of SAR
data acquisition and also in the West Sea between
37˚17′34″to 37°28′7″N and 126˚25′7″to 126˚36′
52″E. It gives the current velocity data in east and
north direction.
2) SAR Current Velocity
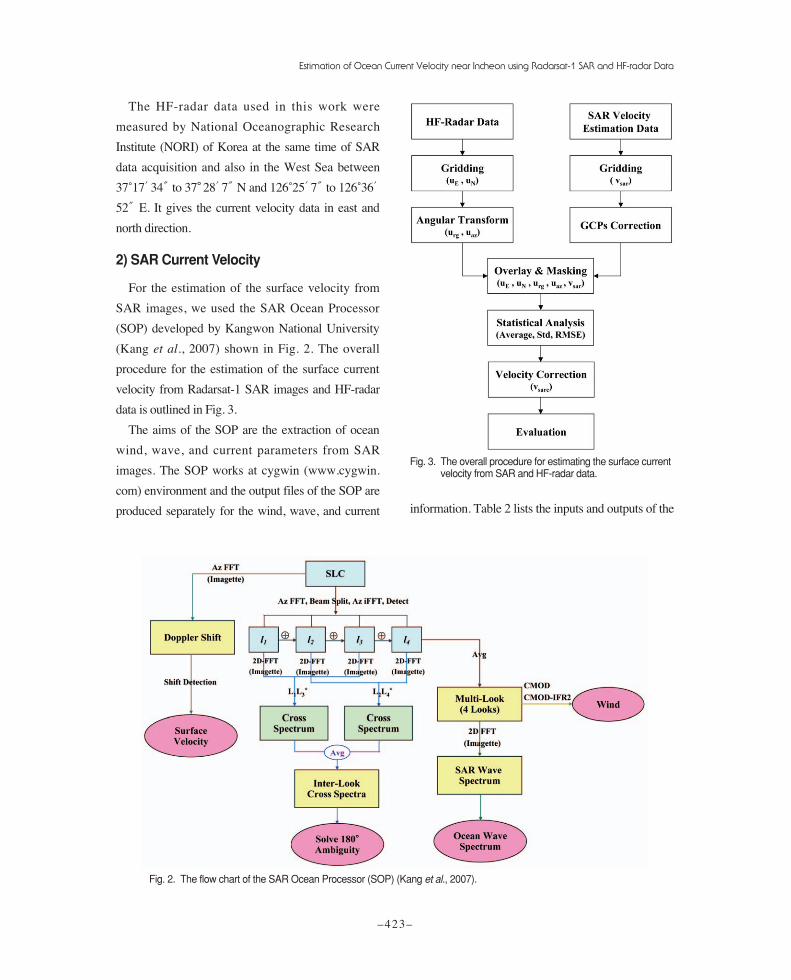
For the estimation of the surface velocity from
SAR images, we used the SAR Ocean Processor
(SOP) developed by Kangwon National University
(Kang et al., 2007) shown in Fig. 2. The overall
procedure for the estimation of the surface current
velocity from Radarsat-1 SAR images and HF-radar
data is outlined in Fig. 3.
The aims of the SOP are the extraction of ocean
wind, wave, and current parameters from SAR
images. The SOP works at cygwin (www.cygwin.
com) environment and the output files of the SOP are
produced separately for the wind, wave, and current information. Table 2 lists the inputs and outputs of the
Estimation of Ocean Current Velocity near Incheon using Radarsat-1 SAR and HF-radar Data
–423–
Fig. 2. The flow chart of the SAR Ocean Processor (SOP) (Kang et al., 2007).
Fig. 3. The overall procedure for estimating the surface currentvelocity from SAR and HF-radar data.
SOP. The SOP implemented the existing algorithms
such as the CMOD4 (Stoffelen and Anderson, 1997a,
1997b), CMOD-IFR2 (IFREMER-CERSAR, 1999)
models, and a polarization ratio conversion
(Horstmann et al., 2000) for the retrieval of wind
speed, the wave-SAR transforms and inter-look
cross-spectra (Engen and Johnsen, 1995) for the
extraction of wavelength and propagation direction of
wave, and the Doppler shift approach (Chapron et al.,
2005) for the estimation of the surface current
velocity. Only the surface current velocity is extracted
by the SOP and evaluated in this paper as it is a
dominant oceanic phenomenon in this study area
driven by the strong tidal current.
The surface velocity, VD for a simple target of
fixed shape moving toward the radar line-of-sight can
be calculated as (Chapron et al. 2005)
VD = fD/ke sin qI (1)
where fD is the Doppler shift of the surface target, ke
is the wavenumber of the incident electromagnetic
wave, and qI is the incidence angle of the radar beam.
fD can be calculated by multiplying Df by Dpixel,
where Df is the frequency sampling interval and
Dpixel is the pixel distance between the nominal and
the estimated Doppler centroid in the azimuth
frequency domain. VD and fD are defined positive if
the target moves toward the radar.
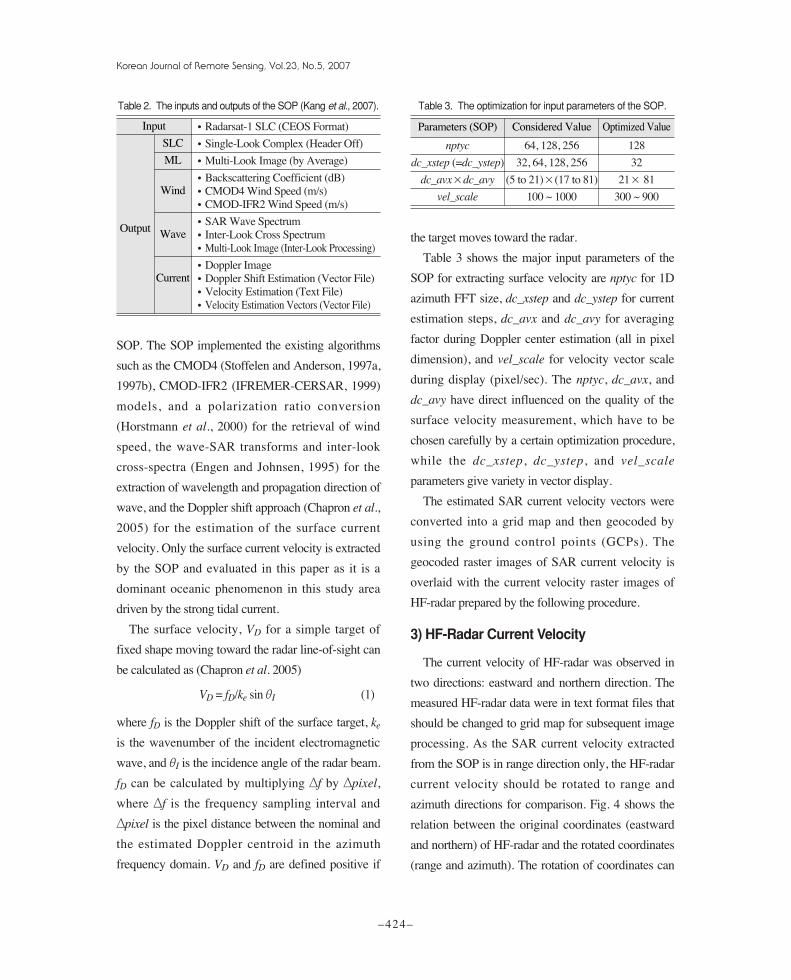
Table 3 shows the major input parameters of the
SOP for extracting surface velocity are nptyc for 1D
azimuth FFT size, dc_xstep and dc_ystep for current
estimation steps, dc_avx and dc_avy for averaging
factor during Doppler center estimation (all in pixel
dimension), and vel_scale for velocity vector scale
during display (pixel/sec). The nptyc, dc_avx, and
dc_avy have direct influenced on the quality of the
surface velocity measurement, which have to be
chosen carefully by a certain optimization procedure,
while the dc_xstep, dc_ystep, and vel_scale
parameters give variety in vector display.
The estimated SAR current velocity vectors were
converted into a grid map and then geocoded by
using the ground control points (GCPs). The
geocoded raster images of SAR current velocity is
overlaid with the current velocity raster images of
HF-radar prepared by the following procedure.
3) HF-Radar Current Velocity
The current velocity of HF-radar was observed in
two directions: eastward and northern direction. The
measured HF-radar data were in text format files that
should be changed to grid map for subsequent image
processing. As the SAR current velocity extracted
from the SOP is in range direction only, the HF-radar
current velocity should be rotated to range and
azimuth directions for comparison. Fig. 4 shows the
relation between the original coordinates (eastward
and northern) of HF-radar and the rotated coordinates
(range and azimuth). The rotation of coordinates can
Korean Journal of Remote Sensing, Vol.23, No.5, 2007
–424–
Table 2. The inputs and outputs of the SOP (Kang et al., 2007).
Input Radarsat-1 SLC (CEOS Format)
Output SLC Single-Look Complex (Header Off)
ML Multi-Look Image (by Average)
Wind Backscattering Coefficient (dB)CMOD4 Wind Speed (m/s)CMOD-IFR2 Wind Speed (m/s)
Wave SAR Wave SpectrumInter-Look Cross SpectrumMulti-Look Image (Inter-Look Processing)
Current Doppler ImageDoppler Shift Estimation (Vector File)Velocity Estimation (Text File)Velocity Estimation Vectors (Vector File)
Input
SLC
ML
Wind
Output Wave
Current
Table 3. The optimization for input parameters of the SOP.
Parameters (SOP) Considered Value Optimized Value
nptyc 64, 128, 256 128
dc_xstep (=dc_ystep) 32, 64, 128, 256 32
dc_avx×dc_avy (5 to 21)×(17 to 81) 21× 81
vel_scale 100 ~ 1000 300 ~ 900
Parameters (SOP) Considered Value Optimized Value
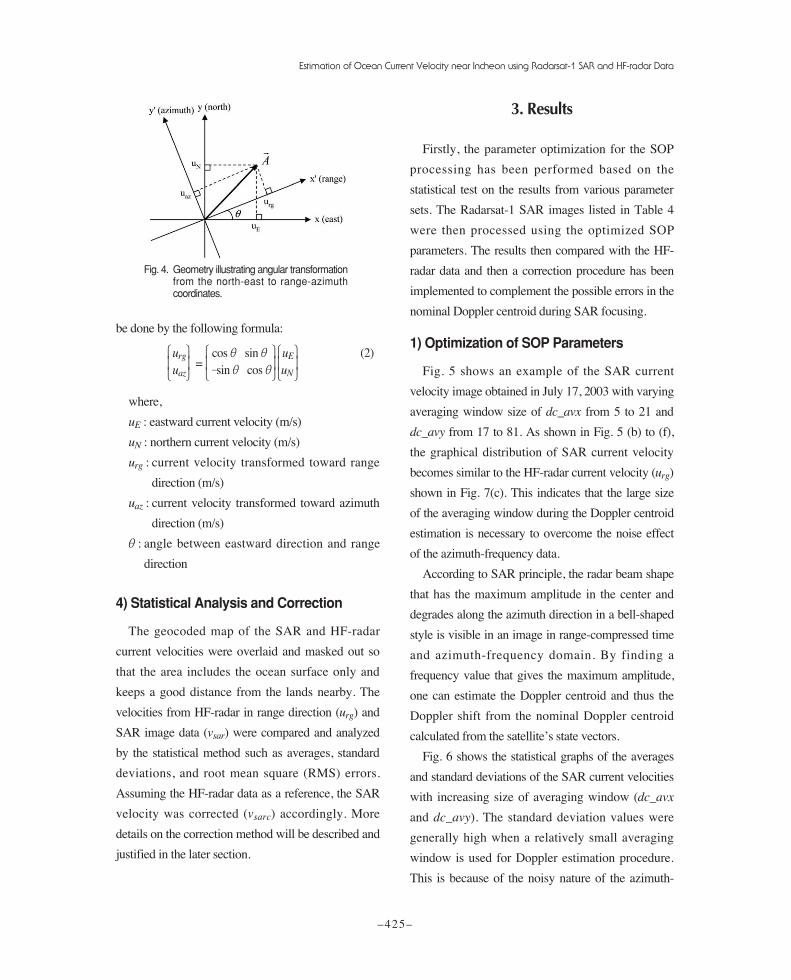
be done by the following formula:
urg=
cos q sin q uE (2)uaz
_sin q cos q uN
where,
uE : eastward current velocity (m/s)
uN : northern current velocity (m/s)
urg : current velocity transformed toward range
direction (m/s)
uaz : current velocity transformed toward azimuth
direction (m/s)
q : angle between eastward direction and range
direction
4) Statistical Analysis and Correction
The geocoded map of the SAR and HF-radar
current velocities were overlaid and masked out so
that the area includes the ocean surface only and
keeps a good distance from the lands nearby. The
velocities from HF-radar in range direction (urg) and
SAR image data (vsar) were compared and analyzed
by the statistical method such as averages, standard
deviations, and root mean square (RMS) errors.
Assuming the HF-radar data as a reference, the SAR
velocity was corrected (vsarc) accordingly. More
details on the correction method will be described and
justified in the later section.
3. Results
Firstly, the parameter optimization for the SOP
processing has been performed based on the
statistical test on the results from various parameter
sets. The Radarsat-1 SAR images listed in Table 4
were then processed using the optimized SOP
parameters. The results then compared with the HF-
radar data and then a correction procedure has been
implemented to complement the possible errors in the
nominal Doppler centroid during SAR focusing.
1) Optimization of SOP Parameters
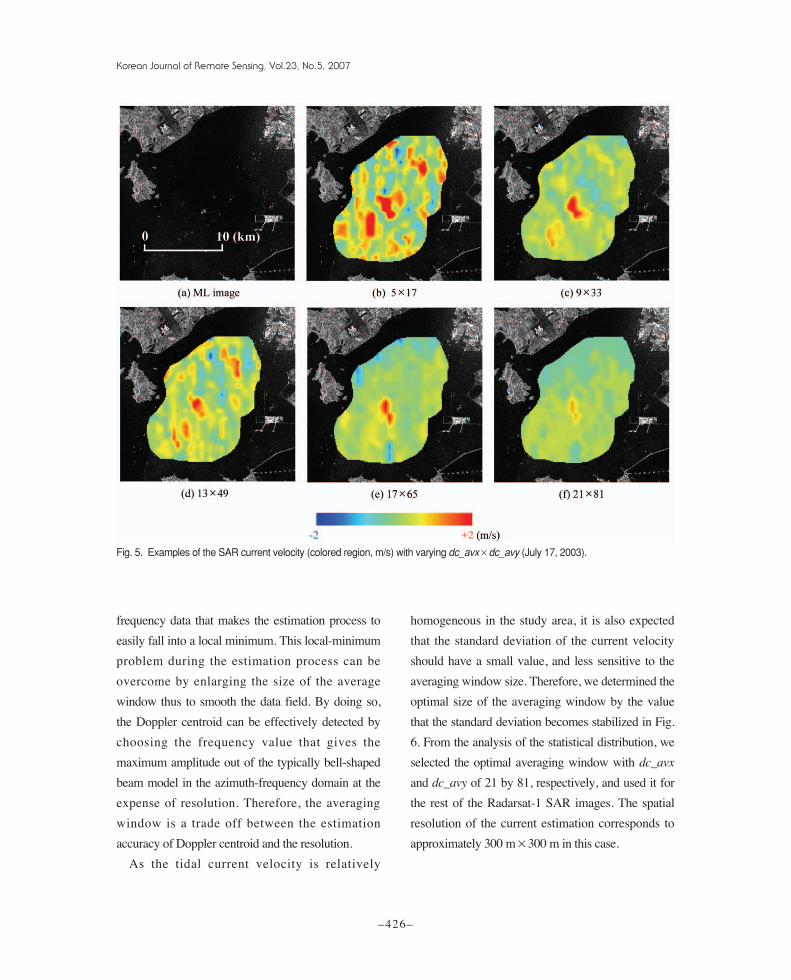
Fig. 5 shows an example of the SAR current
velocity image obtained in July 17, 2003 with varying
averaging window size of dc_avx from 5 to 21 and
dc_avy from 17 to 81. As shown in Fig. 5 (b) to (f),
the graphical distribution of SAR current velocity
becomes similar to the HF-radar current velocity (urg)
shown in Fig. 7(c). This indicates that the large size
of the averaging window during the Doppler centroid
estimation is necessary to overcome the noise effect
of the azimuth-frequency data.
According to SAR principle, the radar beam shape
that has the maximum amplitude in the center and
degrades along the azimuth direction in a bell-shaped
style is visible in an image in range-compressed time
and azimuth-frequency domain. By finding a
frequency value that gives the maximum amplitude,
one can estimate the Doppler centroid and thus the
Doppler shift from the nominal Doppler centroid
calculated from the satellite’s state vectors.
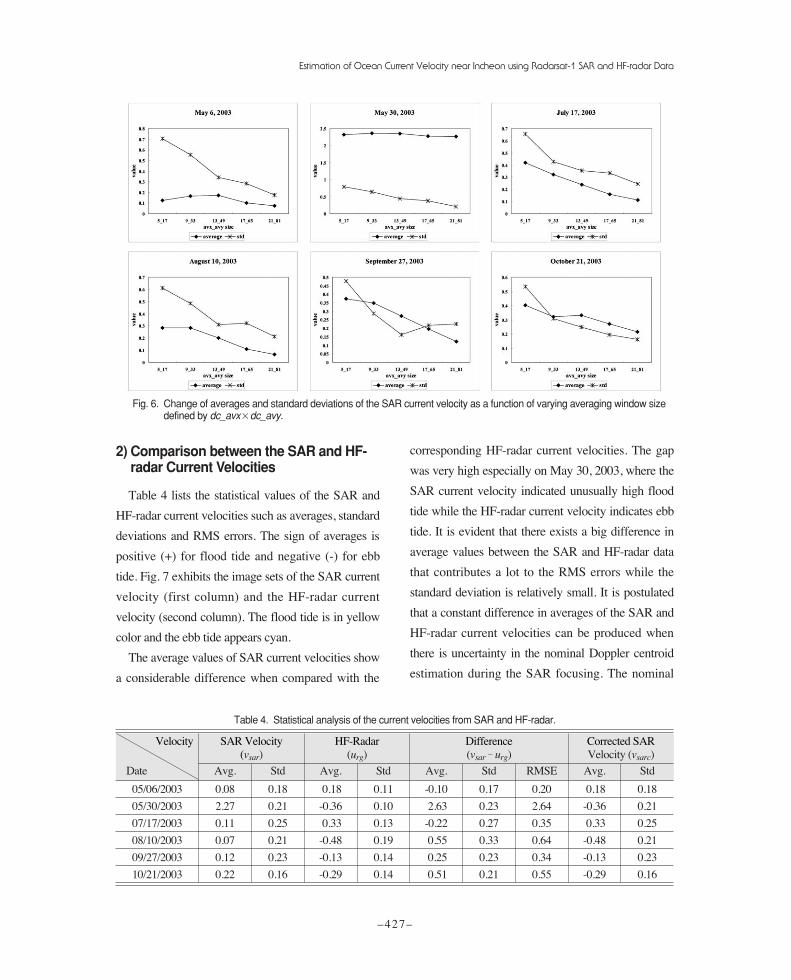
Fig. 6 shows the statistical graphs of the averages
and standard deviations of the SAR current velocities
with increasing size of averaging window (dc_avx
and dc_avy). The standard deviation values were
generally high when a relatively small averaging
window is used for Doppler estimation procedure.
This is because of the noisy nature of the azimuth-
Estimation of Ocean Current Velocity near Incheon using Radarsat-1 SAR and HF-radar Data
–425–
Fig. 4. Geometry illustrating angular transformationfrom the north-east to range-azimuthcoordinates.
Ô Ô ÔÏÔÓÏÔÓ
ÏÔÓ
frequency data that makes the estimation process to
easily fall into a local minimum. This local-minimum
problem during the estimation process can be
overcome by enlarging the size of the average
window thus to smooth the data field. By doing so,
the Doppler centroid can be effectively detected by
choosing the frequency value that gives the
maximum amplitude out of the typically bell-shaped
beam model in the azimuth-frequency domain at the
expense of resolution. Therefore, the averaging
window is a trade off between the estimation
accuracy of Doppler centroid and the resolution.
As the tidal current velocity is relatively
homogeneous in the study area, it is also expected
that the standard deviation of the current velocity
should have a small value, and less sensitive to the
averaging window size. Therefore, we determined the
optimal size of the averaging window by the value
that the standard deviation becomes stabilized in Fig.
6. From the analysis of the statistical distribution, we
selected the optimal averaging window with dc_avx
and dc_avy of 21 by 81, respectively, and used it for
the rest of the Radarsat-1 SAR images. The spatial
resolution of the current estimation corresponds to
approximately 300 m×300 m in this case.
Korean Journal of Remote Sensing, Vol.23, No.5, 2007
–426–
Fig. 5. Examples of the SAR current velocity (colored region, m/s) with varying dc_avx×dc_avy (July 17, 2003).
2) Comparison between the SAR and HF-radar Current Velocities
Table 4 lists the statistical values of the SAR and
HF-radar current velocities such as averages, standard
deviations and RMS errors. The sign of averages is
positive (+) for flood tide and negative (-) for ebb
tide. Fig. 7 exhibits the image sets of the SAR current
velocity (first column) and the HF-radar current
velocity (second column). The flood tide is in yellow
color and the ebb tide appears cyan.
The average values of SAR current velocities show
a considerable difference when compared with the
corresponding HF-radar current velocities. The gap
was very high especially on May 30, 2003, where the
SAR current velocity indicated unusually high flood
tide while the HF-radar current velocity indicates ebb
tide. It is evident that there exists a big difference in
average values between the SAR and HF-radar data
that contributes a lot to the RMS errors while the
standard deviation is relatively small. It is postulated
that a constant difference in averages of the SAR and
HF-radar current velocities can be produced when
there is uncertainty in the nominal Doppler centroid
estimation during the SAR focusing. The nominal
Estimation of Ocean Current Velocity near Incheon using Radarsat-1 SAR and HF-radar Data
–427–
Fig. 6. Change of averages and standard deviations of the SAR current velocity as a function of varying averaging window sizedefined by dc_avx×dc_avy.
Table 4. Statistical analysis of the current velocities from SAR and HF-radar.
Velocity SAR Velocity HF-Radar Difference Corrected SAR(vsar) (urg) (vsar
_ urg) Velocity (vsarc)Date Avg. Std Avg. Std Avg. Std RMSE Avg. Std
05/06/2003 0.08 0.18 0.18 0.11 -0.10 0.17 0.20 0.18 0.18
05/30/2003 2.27 0.21 -0.36 0.10 2.63 0.23 2.64 -0.36 0.21
07/17/2003 0.11 0.25 0.33 0.13 -0.22 0.27 0.35 0.33 0.25
08/10/2003 0.07 0.21 -0.48 0.19 0.55 0.33 0.64 -0.48 0.21
09/27/2003 0.12 0.23 -0.13 0.14 0.25 0.23 0.34 -0.13 0.23
10/21/2003 0.22 0.16 -0.29 0.14 0.51 0.21 0.55 -0.29 0.16
Velocity SAR Velocity HF-Radar Difference Corrected SAR(vsar) (urg) (vsar
_ urg) Velocity (vsarc)
Date Avg. Std Avg. Std Avg. Std RMSE Avg. Std

Korean Journal of Remote Sensing, Vol.23, No.5, 2007
–428–
Fig. 7. Ocean current velocity maps in range direction (m/s). The acquisition dates of the Radarsat-1 SAR images are (a) May 6, (b)May 30, (c) July 17, (d) August 10, (e) September 27, and (f) October 21, 2003. The 1st column is the SAR current velocity(vsar) and the 2nd is the HF-radar current velocity (urg). The 3rd column is vsar - urg. The 4th is the corrected SAR currentvelocity (vsarc) and the 5th is vsarc - urg.
Doppler centroid is calculated from the satellite’s
state vectors such as the position and velocity vectors
with time, which is generally acceptable for general
SAR processing (Curlander and McDonough, 1991;
Lee, 2005) but not for the purpose of the velocity
estimation causing significant errors. Therefore, we
tried to correct the current velocity anomaly of
constant type caused by the uncertainty of the
nominal Doppler centroid, by using the difference of
averages between the SAR and HF-radar current
velocities.
3) Correction of the SAR Current Velocity
To compensate for the possible errors caused by
the nominal Doppler centroid, the difference of
averages between the current velocities from SAR
and HF-radar was subtracted from the SAR current
velocity as:
vsarc = vsar_ (v
_sar
_ u_
rg) (3)
The images of the corrected SAR current velocity
(vsarc) are shown in the 4th column of Fig. 7 and also
the statistics in Table 4. After the correction, the SAR
current velocity images (4th columns) are much
similar to the HF-radar current images (2nd column).
There is also a significant improvement in the
difference images before (3rd column) and after the
correction (5th column). In case of the difference
images, red color appear when the SAR velocity is
higher than the current velocity of HF-radar and the
blue color is for the opposite. From this result we
confirmed that the nominal Doppler centroid
anomaly during SAR focusing processing can be
corrected by using the reference data such as the HF-
radar current velocity data.
Table 4 shows that the corrected SAR current
velocity (vsarc) inherits the average of the HF-radar
current velocity (urg) and the standard deviation of the
SAR current velocity before correction (vsar). This
means that a constant error in the nominal Doppler
centroid has been corrected by the HF-radar data
while the advantage of higher resolution of the SAR
current velocity has been maintained.
4. Conclusion
This study presented the results of estimating the
ocean surface current in West Sea near Incheon of
Korea by using Radarsat-1 SAR images and HF-
radar data. The retrieval of current velocity from SAR
images was processed by the SOP program based on
the Doppler shift approach. The extracted SAR
current velocity was compared with the HF-radar
current velocity by statistical method such as
averages, standard deviations, and RMS errors. We
concluded that 1) the problem related to the
unreliable nominal Doppler centroid estimation
during the SAR focusing can be corrected by a
reference data such as the HF-radar data; 2) the
corrected SAR current velocity has the average of
HF-radar data while maintaining the advantage of
high-resolution SAR.
Acknowledgements
This work was supported by the Korea Research
Foundation Grant funded by the Korean
Government(MOEHRD) (KRF-2006-351-D00043).
The HF-radar data were provided by the National
Oceanographic Research Institute (NORI) of Korea.
The authors appreciate Ji-Hye Kang and Su-Jung
Jung of the RS/GIS laboratory at Kangwon National
University for their considerable assistance in data
processing.
Estimation of Ocean Current Velocity near Incheon using Radarsat-1 SAR and HF-radar Data
–429–
References
Chapron, B., C. Fabrice, and A. Fabrice, 2005. Direct
Measurments of Ocean Surface Velocity from
Space: Interpretation and Validation, J. of
Geophysical Research, 110: 1-17.
Curlander, J. and R. McDonough, 1991. Synthetic
Aperture Radar: Systems and Signal
Processing, John Wiley & Sons, Inc., New
York.
Elachi, C., 1988. Spaceborne Radar Remote Sensing:
Applications and Techniques, IEEE Press,
New York.
Engen, G. and H. Johnsen, 1995. SAR-Ocean Wave
Inversion Using Image Cross Spectra, IEEE
Transaction on Antennas and Propagation,
33(4): 1047-1056.
Horstmann, J., W. Koch, S. Lehner, and R. Tonboe,
2000. Wind Retrieval over the Ocean using
Synthetic Aperture Radar with C-band HH
Polarization, IEEE Transaction on
Geoscience and Remote Sensing, 38(5): 2122-
2131.
IFREMER-CERSAR, 1999. Off-Line Wind
Scatterometer ERS Products: User Manual,
Technical Report C2-MUT-W-010IF,
IFREMER- CERSAR.
Kang, M. K., Y. W. Park, M. J. Lee, and H. Y. Lee,
2007. Study on the Extraction of Ocean
Wind, Wave and Current using SAR, Journal
of Korean Navigation and Port Research,
31(1): 35-42.
Lee, H., 2005. Development and Distribution of an
Educational Synthetic Aperture Radar
(eSAR) Processor, Korean Journal of Remote
Sensing, 21(2): 163-171.
Mouchot, M. -C. and R. Garello, 1998. SAR for
Oceanography, in Henderson, F. M. and A. J.
Lewis Ed., Principles & Applications of
Imaging Radar, John Wiley & Sons, Inc.,
New York.
Stoffelen, A. and D. Anderson, 1997a. Scatterometer
Data Interpretation: Estimation and
Validation of the Transfer Function CMOD4,
J. of Geophysical Research, 102(C3): 5767-
5780.
Stoffelen, A. and D. Anderson, 1997b. Scatterometer
Data Interpretation: Measurement Space and
Inversion, J. of Atmospheric and Oceanic
Technology, 14: 1298-1313.
Korean Journal of Remote Sensing, Vol.23, No.5, 2007
–430–