Estimation of Life Cycle CO Emission and Energy Cost of ...
147
Estimation of Life Cycle CO 2 Emission and Energy Cost of Different Building Materials By SHOVONA KHUSRU Roll Number: 0409042310 A thesis submitted to the Department of Civil Engineering of Bangladesh University of Engineering and Technology, Dhaka, in partial fulfillment of the requirements for the degree of MASTER OF SCIENCE IN CIVIL AND STRUCTURAL ENGINEERING JUNE, 2012
Transcript of Estimation of Life Cycle CO Emission and Energy Cost of ...

Estimation of Life Cycle CO2 Emission and Energy Cost of
Different Building Materials
By
SHOVONA KHUSRU
Roll Number: 0409042310
A thesis submitted to the Department of Civil Engineering of Bangladesh University of
Engineering and Technology, Dhaka, in partial fulfillment of the requirements for the
degree of
MASTER OF SCIENCE IN CIVIL AND STRUCTURAL ENGINEERING
JUNE, 2012

The thesis titled “Estimation of Life Cycle CO2 Emission and Energy Cost of Different Building Materials” submitted by Shovona Khusru, Student No. 0409042310 and Session: April 2009 has been accepted as satisfactory in partial fulfillment of the requirement for the degree of M.Sc. Engg. (Civil and Structural) on June 5, 2012.
BOARD OF EXAMINERS
______________________________________ Chairman
Dr. Munaz Ahmed Noor (Supervisor) Professor Department of Civil Engineering, BUET, Dhaka-1000 _______________________________________ Member
Dr. Md. Mujibur Rahman (Ex-officio) Professor and Head Department of Civil Engineering, BUET, Dhaka-1000 _______________________________________ Member Dr. Raquib Ahsan Professor Department of Civil Engineering, BUET, Dhaka-1000 _______________________________________ Member Dr. Sharmin Reza Chowdhury (External) Associate Professor Department of Civil Engineering Ahsanullah University of Science and Technology , Dhaka -1208

References 109
REFERENCES ______________________________________________________________________
Alcorn, A. (2003). Embodied energy and CO2 coefficients for New Zealand building
materials, Center for Building Performance Research by Victoria University of
Wellington, pp.27.
Aye, L., Bamford, N., Charters, B., & Robinson, J. (1999). Optimising embodied energy
in commercial office development. RICS Foundation, pp.217-223.
Baird, G., & Chan, S. A. (1983).Energy costs of houses and light construction buildings
and remodelling of existing houses (No. 76). Auckland: New Zealand Energy Research
and Development Committee, University of Auckland.
Bernstein, L., Peter, B., Canziani, O., & Huq, Z. (2007). IPCC Summary of
policymakers. Intergovernamental panel on climate change - fourth assessment report.
Blanchard et al. (1998). Life cycle analysis of a residential home in
Michigan.M.Sc.thesis. School of Natural Resources and Environment. University of
Michigan.
Cole, R. J., & Kernan, P. C. (1996). Life - Cycle Energy Use in Office Buildings.
Building and Environment, Vol. 31(4): pp. 307-317(311).
Crishna, N. & Gsodsir, S. (2010). “Embodied carbon in natural building stone in
Scotland”, Natural Stone Specialist, pp. 20-21.
Das, Anjana & Kandpal. (1997). “Iron and Steel Manufacturing Technologies in India:
Estimation of CO2 Emission”, International Journal of Energy Research, Vol. 21: pp.
1187- 1202.

References 110
Eaton, K. J., & Amato, A. (1998). A comparative life cycle assessment of steel and
concrete framed office buildings. Journal of constructional steel research, Vol.46: pp.1-
3.
Fernandez, N.P. (2008). “The Influence of Construction Materials on Life Cycle Energy
Use and Carbon Dioxide Emissions of Medium Size Commercial Buildings”, M. Sc.
thesis. Victoria University of Wellington.
Grant, T. (2010).Think Brick Australia-LCA of Brick Products. Final Report after
Critical Review, pp. 4-5.
Gratsos, G, P. Zachariadis (2005), “The Life Cycle Cost of maintaining the effectiveness
of a ships structure and environmental impact of ship design parameters” Royal
Institution of Naval Architects (Transaction papers of 18/19 October 2005).
Hammond, G.P. & Jone C.I. (2008). 'Embodied energy and carbon in construction
materials', Proc. Instn Civil. Engrs: Enegy, University of Bath.
Hendriks, C. A., Worrell, E., de Jager, D., Blok, K., Riemer, P., (2002). Emission
Reduction of Greenhouse Gases from the Cement Industry, Greenhouse Gas Control
Technologies Conference, International Energy Agency.
http://www.alibaba.com/productgs/444230098/Diameter_1500mm_rotary_screen_machi
ne.html, 3 December, 2010.
http://www.beneficiationchina.com , 2 December, 2010.
http://www.searates.com/reference/portdistance/, 12 March, 2011.
http://www.worldgbc.org/, 25 August, 2010.
http://saferenvironment.wordpress.com, 8 January, 2011.
http://transitionculture.org/wp-content/uploads/wood-pile.jpg, July 16, 2009.

References 111
IFIAS. (1974). Energy analysis workshop on methodology and convention, Workshop
Report No. 6, Stockholm: International Federation of Institutes for Advanced Study.
“Improving Kiln Efficiency of the Brick Making Industry in Bangladesh” (2008). Report
of United Nations Framework Convention on Climate Change (UNFCC), pp. 2:12-13 &
33.
Kameyama, M., K. Hiraoka, A. Sakurai, T. Naruse, H. Tauchi (2004), “Development of
LCA software for ships and LCI analysis based on actual shipbuilding and operation,”
Proceedings of The 6th International Conference on Eco Balance, Oct.25- Oct. 27,
Tsukuba, Japan pp. 159-162.
Maersk Line (2007), Brochure: Constant Care for the Environment, Swedish Network
for Transport and the Environment.
Nebel, B., & Love, S. (2008). Maximising wood plan. Forest research. New Zealand
Business Council for Sustainable Development. Climate Change: How to Calculate and
Report GHG Emissions.
Oppenheim, D., & Treloar, G. (1995). Embodied energy and office buildings - A case
study. Proceedings of the 33rd Australian and New Zealand Solar Energy Society
Conference 1, pp. 349 – 354.
Page, I. (2006). E408 Timber in Government buildings - cost and environmental impact
analysis (No.QC5018).
Pierquet, P., Bowyer, J., Huelman, P. (1998). “Thermal Performance and Embodied
Energy of Cold Climate Wall Systems”, Forest Products Journal, Vol. 48, No. 6, pp. 53-
60.
Prospectus of BSRM. http://www.secbd.org/Prospectus_BSRMS.pdf, 20 October, 2010.
Rahman, A. & Ullah, A.T. (1999). Ship Breaking, ILO's Sectoral Activities Programme.
References 112
Singh, G. & Singh, J. (2005). Building Materials (Materials of Construction), Standard
Publisher and Distributers, Delhi, pp. 193-194.
Suzuki, M., & Oka, T. (1998). Estimation of life cycle energy consumption and CO2
emission of office buildings in Japan. Energy and Buildings Vol.28(1), pp. 33-41.
Treloar, G. J., Fay, R., Ilozor, B., & Love, P. E. D. (2001). An analysis of the embodied
energy of office buildings by height. Facilities, Vol.19 (5-6), pp.204-214(211).
Units and conversion fact sheet. http://web.mit.edu/mit_energy, 15 April, 2010.
Venta, Glaser & Associates, (1999). “Cement and Structural Concrete Products: Life
Cycle Inventory Update” Combined with original report “Raw Material Balances,
Energy Profiles and Environmental Unit Factor Estimates for Cement and Structural
Concrete Products”. CANMET & Radian Canada Inc.
World Green Building Council, 2006.
www.cemex.com, 16 December 2010.
www.cranescn.com/products/tower-crane/tower-crane-qtz50.html, 21 July, 2011.
www.izumi-mfg.co.jp/english/outline.html, 21 July, 2011.
www.sbm-mp.at, 18 October, 2010.
www.secbd.org/Prospectus_BSRMS.pdf, 10 May, 2011.
www.sussex.ac.uk , 21 November, 2010.
www.tececo.com. 24 December, 2010.
www.tradingeconomics.com, 18 January, 2011.

Emission factors
APPENDIX A Emission Factors __________________________________________________________ Table A1: Fuel combustion emission factors (fuels used for stationary combustion) - 2008
Emission Source User Unit
Emission factor Total CO2-e
Emission factor
total (kg CO2-e/unit)
(kg CO2/unit)
Stationary Combustion
Distributed Natural Gas
Commercial KWh 0.194 0.192
GJ 54 53.3 Coal – Bituminous Commercial Kg 2.59 2.57 Coal – Sub-bituminous
Commercial Kg 1.98 1.97
Coal – Lignite Commercial Kg 1.41 1.4 Coal – Default* Commercial Kg 1.98 1.97 Diesel Commercial Litre 2.64 2.64 LPG** Commercial Kg 2.97 2.96 Heavy Fuel Oil Commercial Litre 3.01 3.01 Light Fuel Oil Commercial Litre 2.94 2.93 Distributed Natural Gas
Industry KWh 0.192 0.192 GJ 53.4 53.3
Coal – Bituminous Industry Kg 2.58 2.57 Coal – Sub-bituminous
Industry Kg 1.98 1.97
Coal – Lignite Industry Kg 1.41 1.4 Coal – Default* Industry Kg 1.98 1.97 Diesel Industry Litre 2.64 2.64 LPG** Industry Kg 2.97 2.96 Heavy Fuel Oil Industry Litre 3.02 3.01 Light Fuel Oil Industry Litre 2.94 2.93 Wood Industry*** Kg 0.0178 1.26 Wood Fireplaces**** Kg 0.0865 1.26
* The default coal emission factor should be used if it is not possible to identify the specific type of coal. ** LPG-use data in litres can be converted to kilograms by multiplying by the specific gravity of 0.536 kg/l. *** It is not expected that many commercial or industrial users will burn wood in fireplaces but this
emission factor has been provided for completeness. It is the default residential emission factor. **** The Total CO2-e emission factor (for wood) only includes CH4 and N2O emissions. This is based on
ISO 14064-1 and the GHG Protocol reporting requirements for combustion of biomass as Scope 1 emissions. CO2 emissions, from the combustion of biologically sequestered carbon, are reported separately.

Emission factors 114
Source: Guidance for Voluntary, Corporate Greenhouse Gas Reporting, 2008 Table A2: CO2 - from the combustion of different fuels
Fuel
Carbon Content (kg C/kg fuel)
Energy Content(kWh/kg)
Emission of CO2 (kg CO2/kWh)
Coal (bituminous/anthracite) 0.75 7.5 0.37 Gasoline 0.9 12.5 0.27 Diesel 0.86 11.8 0.24 Light Oil 0.7 11.7 0.26 Natural Gas, Methane 0.75 12 0.23 LPG - Liquid Petroleum Gas 0.82 12.3 0.24 Bioenergy 0 - 0 Source:http://saferenvironment.wordpress.com
Table A3: CO2 - from the combustion of different fuels Fuel Units Carbon emissions CO2 Intensity
(t/unit) (tCO2/GJ)
Coking coal tonne 0.58 0.074 Non-coking coal (reductant) tonne 0.56 0.092 Boiler Coal tonne tonne 0.43 0.095 Coke tonne 0.75 0.094 Petroleum Products tonne 0.85 0.074 Natural Gas 1000 nm3 0.5 0.053 Electricity* 1000 kwh 0.27 0.271 *Assuming a conversion efficiency of 35% in a coal fired thermal power plant. Source: Das and kandpal, 1997. Table A4: Best Practice Weighting Factors for Various Products in Steel Manufacturing Process.
Process Fuel (GJ/ton)
Electricity (GJ/ton)
Final Energy Use
(GJ/ton)
Blast Furnace (total)1 15.19 0.26 15.45 Sinter Plant 1.37 0.23 1.6 Pellet Plant 0.51 0.11 0.62 Blast Furnace 13.31 -0.09 13.22 DRI2 10.5 0.4 10.9 BOF-slab3 0.57 0.12 -0.45 EAF-slab3 0.79 1.52 2.31 Hot Rolling3 1.82 0.37 2.19 Cold Rolling3 1.1 0.53 1.63 Assuming a conversion efficiency of 35% in a coal fired thermal power plant Source: Das and Kandpal (1997).

Emission factors 115
Table A5: Emissions statistics across different modes Mode CO2
(g/tonne-km) Boeing 747-400 552 Heavy truck 50 Rail-diesel 17 Rail-electric 18 S-type container vessel 8.35 PS-type container vessel (6,600 TEU) 7.48
Source : Maersk Line (2007), Brochure: “Constant Care for the Environment”. Swedish Network for Transport and the Environment.

116
APPENDIX B Product Specifications _____________________________________________________________ 1. Sand Dredger Description: 1200 m3/hr sand dredger Suction main engine 1400 HP Fuel tank volume 50T Fresh water tank volume 80T Suction capacity 1200M3/h Fuel consumption per hour 282kg/h Date of built Jan, 1990 Hull Total 49.94m Length of the ship 47.30m Full load line 47.30m Breadth 12.00m Depth 3.70m Light draft 1.750m Load draft 2.200m Load displacement 1013.000t Light displacement 782.600t Source: Pan Asia ship Engineering Company limited, www.ecplaza.net ,October 7, 2010
2. Rotary screen
Specifications ISO: 9001:2008, CE standard Style: Opening and closed. Capacity: 1-200 t/h __________________________________________________________________________________
Source:http://www.alibaba.com/productgs/444230098/Diameter_1500mm_rotary_screen_machine.html, 3 December, 2010.

Product specifications 117
3. Concrete Mixers
Model NO.: JZC350A Trademark: chuangneng Origin: China(Mainland) Product Description Feed Capacity 560L Discharge Capacity 350L Productivity 10-14M3/H Lifing Capacity 5.5kw Driving Speed(Max) 20Km/h Mixing Material Max. Dia 60mm Drum Rotation Speed 14r/min Model of the Water Pump 40DWB8-12A Water Pump Capacity 0.55kw Weight 1950kg Appearance Dimension(Length*Width*Hight) 2765*2140*3000mm
4. Vibrator Product Description Model No. TMV28 Vibrating Head Dimensions(mm) 28x470 Vibration(v.p.m) 10,000-12,000 Vibration Amplitude(mm) 0.9 Flexible Shaft Dia.(mm) 10 Rubber Hose Dia. & L.(mm) 30mmx4m - 6m Work capacity: 163CC Max. Output: 5.5HP/4000rpm Fuel tank capacity 4 Liter Continuous operating time: 5 hours
Source: Pan Asia ship Engineering Company limited, www.ecplaza.net, October 7, 2010
5. Tower crane
Hoisting
kW
m/min 32/16/4.5 64 32 915/15/4
t 2 4 1 2 Derricking
m/min 39/26 2.2/1.5
Slewing
r/min 0.62 3.7
Jacking
m/min 0.4 4
Power Supply 380V/50HZ Power Capacity 24.9 Source: http://www.cranescn.com/favicon.ico/tower-crane-qtz40315%2028%, 21 July, 2011.

APPENDIX C Design Detail Charts _____________________________________________________________________________ CONCRETE BUILDING Table C1: Detail chart of Beam design of concrete building
STIRRUP
Location Description Bar No of
Floor
Length of beam
(ft)
Total Length of bar (ft) L
volume of main
steel(cft)
total volume of
main steel(cft)
spacingtotal no of
stirrup
Area (sft)
length (ft)
(one closed
stirrup)
Volume of shear
reinforcement (cft)
total volume of steel cft
Area of concrete per floor sft
Gross Volume of concrete cft
Net Volume of concrete cft
BeamFRAME A
#7 1 82.17 295.00 1.23#6 1 82.17 349.17 1.07#7 5 82.17 541.50 2.26#6 5 82.17 102.67 0.31
GRADE BEAM GB1 (12"x24")
#6 1 82.17 328.67 1.00 1.00 #4@ 24" 42 0.001 5 0.21 1.21 2 164.33 163.12
FRAME B#7 1 82.17 328.67 1.37#6 1 82.17 493.89 1.51#6 5 82.17 196 0.60#7 5 82.17 332.00 1.01#8 5 82.17 53.33 0.16#9 5 82.17 246.50 0.75
GRADE BEAM GB2 (12"x24") #6 1 82.17 448.50 1.37 1.37 #4@ 24" 42 0.001 5 0.21 1.21 2 164.33 163.12
FRAME C#6 1 32.67 16.33 0.05#7 1 32.67 130.67 0.54#8 1 32.67 81.67 0.45#7 5 32.67 196.00 0.60
#8 5 32.67 130.67 0.72
GRADE BEAM GB2 (12"x24")
#6 1 32.67 163.33 0.50 0.50 #4@24" 17 0.001 5 0.09 0.58 2.00 65.33 64.83
B2 (18"X27")
B3 (18"X27")
B3 (18"X27")
FLOOR
ROOF
FLOOR
ROOF
FLOOR
B1 (18"x27")
B1 (18"x27")
B2 (18"X27")
361.04
6.58
#4@11"
2.88
12.65
#4@11" and #4@ 24" 0.001 6.5 3.60 16.452 3.375
#4@11" and #4@ 24" 80 0.001 6.5 0.72 3.015 277.31 274.297
3.375 277.31 274.297#4@11" and #4@ 24"
3.60
ROOF 2.30
12.85 399
1386.56 1370.111
1386.56 1370.111
3.375
80 0.001 6.5 0.72 3.015
#4@11"
16.452 3.375#4@11" and #4@ 24" 399 0.001 6.5
1.17 7.75 3.375 551.25 544.67
0.001 6.5 0.23 1.28 3.375
MAIN STEEL CALCULATION
110.25 108.97
180 0.001 6.5

Design detail charts 119
FRAME E#6 1 49.50 199.43 0.61#7 1 49.50 285.79 1.19#6 5 49.50 87.12 0.27#7 5 49.50 383.69 1.60
GRADE BEAM GB3 (12"x24")
#6 1 49.50 198.01 0.61 0.61 #4@24" 25 0.001 5 0.12 0.73 2 99.00 98.27
FRAME G#7 1 32.67 106.18 0.44#8 1 32.67 65.34 0.36#7 5 32.67 130.68 0.54#9 5 32.67 65.34 0.45
GRADE BEAM GB4 (12"x24")
#7 1 32.67 130.68 0.54 0.54 #4 @ 24" 16 0.001 5 0.08 0.63 2 65.34 64.71
FRAME H#5 1 82.17 33.00 0.07#6 1 82.17 33.00 0.10#7 1 82.17 426.69 1.78#8 1 82.17 164.34 0.90#6 5 82.17 98.84 0.30#7 5 82.17 591.03 2.46
GRADE BEAM GB1 (12"x24")
#7 1 82.17 328.68 1.37 1.37 #4 @ 11" 41 0.001 5 0.21 1.57 2 164.34 162.77
FRAME I#7 1 82.17 229.68 0.96#9 1 82.17 164.34 1.14#6 5 82.17 77.22 0.24#7 5 82.17 394.02 1.64
GRADE BEAM GB1 (12"x24")
#7 1 82.17 328.68 1.37 1.37 #4@ 24" 41 0.001 5 0.21 1.58 2 164.34 162.76
FRAME 1
#6 1 64.00 265.68 0.81 3.75
#7 1 64.00 242.67 1.01
#6 1 46.83 97.99 0.30 2.25
#7 1 46.83 93.66 0.39#6 5 64.00 594.48 1.82
#7 5 64.00 347.72 1.45
B9 (12"X27") #6 5 46.83 240.32 0.73 #4 @ 24"c/c 115 0.001 5.5 0.63 2.25
#6 1 64.00 128.00 0.39
#7 1 64.00 128.00 0.53
#6 1 46.83 93.66 0.29
#7 1 46.83 93.66 0.39
B4 (18"X27")
B4 (18"X27")
B5 (18"X27")
B5 (18"X27")
B6 (18"X27")
B6 (18"X27")
B8 (20"X27")
FLOOR
6.15
#4 @ 24"c/c
#4@ 10.5"c/c & #4@24"c/c
#4@11"
#4@11"
3.37
2.91
FLOOR
ROOF
FLOOR
#4 @ 11"
#4 @ 11"
2.09ROOF
0.001 6.5
0.001
GB5 (12"X24")
GB6 (12"X18")
GRADE BEAM
ROOF
FLOOR
ROOF
FLOOR
ROOF
3.375 1386.62 1374.32
#4@11" and #4@ 24"
277.32 274.6490
448
0.001
0.001
6.5
6.5
3.3752.68
12.30
3.375
10.76 3.375
3.375
0.00180
399
36
178
13.82
#4@11" and #4@ 24"
4.99
2.85
2.10
9.39
B9 (12"X27")
B8 (20"X27")
2.51
B7 (18"X27")
B7 (18"X27")
0.80
20.00
1.60
9.32 #4@11" and #4@ 24" 220 0.001 6.5 1.43
1.80 #4@11" and #4@ 24" 44 0.001 6.5 0.29
277.32
0.58
#4@ 10.5"c/c & #4@24"c/c 3.01
167.07 164.99
835.31 824.56
6.5 1.16
273.95
0.001 6.5 2.59 16.41 3.375 1386.62 1370.21
6.5 0.52
3.375 551.31 545.16
0.23 1.03 3.375 110.26 109.23
0.001
0.001
6.83333
5.5
6.833
5
4
32
23
0.37
0.13
1.84
0.09
0.16
0.001
0.001
0.001
342.36345.37
1.5
2
3.75
#4 @ 24"c/c
#4 @ 24"c/c
23
54
270
1.85
22.48
196.39198.25
1704.361726.84

Design detail charts 120
FRAME 2#6 1 119.58 393.16 1.20#7 1 119.58 137.68 0.57#8 1 119.58 76.83 0.42#9 1 119.58 307.33 2.13#7 5 119.58 457.08 1.90#8 5 119.58 109.47 0.60#9 5 119.58 411.49 2.86#6 1 119.58 239.16 0.73#7 1 119.58 239.16 1.00
FRAME 3#6 1 119.58 393.16 1.20#7 1 119.58 137.68 0.57#8 1 119.58 76.83 0.42#9 1 119.58 307.33 2.13#7 5 119.58 457.08 1.90#8 5 119.58 109.47 0.60#9 5 119.58 411.49 2.86#6 1 119.58 239.16 0.73#7 1 119.58 239.16 1.00
FRAME 4
#6 134.42
298.31 0.91
#7 1 34.42 68.84 0.29#6 1 70.41 261.64 0.80
#7 1 70.41 140.82 0.59
#6 5 34.42 68.84 0.21
#7 5 34.42 103.26 0.43
#8 5 34.42 22.95 0.13
#9 5 34.42 103.26 0.72B14
(15"X27") #7 5 70.41 356.47 1.49 7.43 #4 @ 24" c/c 176 0.001 6 1.06 2.8125
#6 1 104.83 209.66 0.64 #4 @ 24" c/c 0.001 5
#7 1 104.83 209.66 0.87
TOTAL 234.22 19452.81
FLOOR
GRADE BEAM
B11 (18"X27")
B11 (18"X27")
GB8 (12"X24")
4.33ROOF
60
523
105 0.001
0.001
0.001
3.40
0.30
5.01
30.21
2.03
26.81
1.73 #4 @ 24"c/c
#4@ 10"c/c &
#4@24"c/c
#4@ 10"c/c &
#4@24"c/c398.57
3.375 2017.91 2014.52
2 239.16 237.13
0.001 6.5 0.68 5.01
3.375 403.586.5
6.5
5
0.68
3.40 30.21 3.375 2017.91 2014.52
ROOF B11 (18"X27") 4.33
#4@ 10"c/c &
#4@24"c/c105 3.375 403.58 398.57
FLOOR B11 (18"X27") 26.81
#4@ 10"c/c &
#4@24"c/c523 0.001 6.5
34#4 @ 12" c/c
2.81250.216
GRADE BEAM GB8 (12"X24") 1.73 #4 @ 24"c/c 60 237.130.001 5 0.30 2.03
1.20
1.39
7.42
1.51
2 239.16
3.750.246.8330.001
FLOOR
GB9 (12"X24")GRADE BEAM
B14 (15"X27")
B13 (20"X27")
B13 (20"X27")
ROOF 3.03
17.31
327.10
1635.52
324.07
1618.20
207.88
0.00135#4 @ 24" c/c
3.751.416.8330.001207#4 @ 10" c/c
209.6621.780.2652

Design detail charts 121
Table C2: Detail Chart of Column Design of Concrete Building
Story Point designation Height (ft) bar rebar % Tie volume of tie (cft) Total As (cft) Gross Volume of
concrete (cft)Net Volumeof concrete
(cft)
BASE TO GL 1-A C2(18"X18") 8 10# 9 3.09 0.56GL TO FLOOR 2 C2(18"X18") 24 10# 9 3.09 1.67
FLOOR 2 TO FLOOR 4 C2(18"X18") 24 10#9 3.09 1.67 5.22 1.96 7.18 180.00 172.82FLOOR 4 TO FLOOR 6 C2(18"X18") 24 8#9 2.47 1.33
BASE TO GL 2-I C2(18"X18") 8 10# 9 3.09 0.56GL TO FLOOR 2 C2(18"X18") 24 10# 9 3.09 1.67
FLOOR 2 TO FLOOR 4 C2(18"X18") 24 10#9 3.09 1.67 5.22 1.96 7.18 180.00 172.82FLOOR 4 TO FLOOR 6 C2(18"X18") 24 8#9 2.47 1.33
BASE TO GL 3-I C2(18"X18") 8 10# 9 3.09 0.56GL TO FLOOR 2 C2(18"X18") 24 10# 9 3.09 1.67
FLOOR 2 TO FLOOR 4 C2(18"X18") 24 10#9 3.09 1.67 5.22 1.96 7.18 180.00 172.82FLOOR 4 TO FLOOR 6 C2(18"X18") 24 8#9 2.47 1.33
BASE TO GL 4-A C2(18"X18") 8 10# 9 3.09 0.56GL TO FLOOR 2 C2(18"X18") 24 10# 9 3.09 1.67
FLOOR 2 TO FLOOR 4 C2(18"X18") 24 10#9 3.09 1.67 5.22 1.96 7.18 180.00 172.82FLOOR 4 TO FLOOR 6 C2(18"X18") 24 8#9 2.47 1.33
BASE TO GL 4-C C2(18"X18") 8 10# 9 3.09 0.56GL TO FLOOR 2 C2(18"X18") 24 10# 9 3.09 1.67
FLOOR 2 TO FLOOR 4 C2(18"X18") 24 10#9 3.09 1.67 5.22 1.96 7.18 180.00 172.82FLOOR 4 TO FLOOR 6 C2(18"X18") 24 8#9 2.47 1.33
BASE TO GL 2-A C3(22"X22") 8 12#10 3.15 0.85GL TO FLOOR 2 C3(22"X22") 24 12#10 3.15 2.54
FLOOR 2 TO FLOOR 4 C3(22"X22") 24 10#10 2.62 2.12 7.20 2.61 9.80 268.89 259.08FLOOR 4 TO FLOOR 6 C3(22"X22") 24 8#10 2.1 1.69
BASE TO GL 3-A C3(22"X22") 8 12#10 3.15 0.85GL TO FLOOR 2 C3(22"X22") 24 12#10 3.15 2.54
FLOOR 2 TO FLOOR 4 C3(22"X22") 24 10#10 2.62 2.12 7.20 2.61 9.81 268.89 259.08FLOOR 4 TO FLOOR 6 C3(22"X22") 24 8#10 2.1 1.69
BASE TO GL 4-B C3(22"X22") 8 12#10 3.15 0.85GL TO FLOOR 2 C3(22"X22") 24 12#10 3.15 2.54
FLOOR 2 TO FLOOR 4 C3(22"X22") 24 10#10 2.62 2.12 7.20 2.61 9.81 268.89 259.08FLOOR 4 TO FLOOR 6 C3(22"X22") 24 8#10 2.1 1.69
BASE TO GL 1-G C1(15"X15") 8 16#6 3.13 0.39GL TO FLOOR 2 C1(15"X15") 24 16#7 3.13 1.17
FLOOR 2 TO FLOOR 4 C1(15"X15") 24 14#6 2.74 1.03 3.47 2.69 6.16 125.00 118.84FLOOR 4 TO FLOOR 6 C1(15"X15") 24 12#6 2.35 0.88
BASE TO GL 1-I C1(15"X15") 8 16#6 3.13 0.39GL TO FLOOR 2 C1(15"X15") 24 16#7 3.13 1.17
FLOOR 2 TO FLOOR 4 C1(15"X15") 24 14#6 2.74 1.03 3.47 2.69 6.16 125.00 118.84FLOOR 4 TO FLOOR 6 C1(15"X15") 24 12#6 2.35 0.88
BASE TO GL 4-I C1(15"X15") 8 16#6 3.13 0.39GL TO FLOOR 2 C1(15"X15") 24 16#7 3.13 1.17
FLOOR 2 TO FLOOR 4 C1(15"X15") 24 14#6 2.74 1.03 3.47 2.69 6.16 125.00 118.84FLOOR 4 TO FLOOR 6 C1(15"X15") 24 12#6 2.35 0.88
#3@18"c/c
#3@18"c/c
#3@18"c/c
#3@18"c/c
#3@18"c/c
#3@18"c/c
#3@18"c/c
#3@18"c/c
#3@12"c/c
#3@12"c/c
#3@12"c/c
Main steel (cft)

Design detail charts 122
BASE TO GL 4-H C4(18"X22") 8 12#9 3.03 0.67GL TO FLOOR 2 C4(18"X22") 24 12#9 3.03 2.00
FLOOR 2 TO FLOOR 4 C4(18"X22") 24 10#9 2.53 1.67 5.67 2.07 7.74 220.00 212.26FLOOR 4 TO FLOOR 6 C4(18"X22") 24 8#9 2.02 1.33
BASE TO GL 4-E C4(18"X22") 8 12#9 3.03 0.67GL TO FLOOR 2 C4(18"X22") 24 12#9 3.03 2.00
FLOOR 2 TO FLOOR 4 C4(18"X22") 24 10#9 2.53 1.67 5.67 2.07 7.74 220.00 212.26FLOOR 4 TO FLOOR 6 C4(18"X22") 24 8#9 2.02 1.33
BASE TO GL 1-B C5(25"X25") 8 24#8 3.03 1.05GL TO FLOOR 2 C5(25"X25") 24 24#8 3.03 3.16
FLOOR 2 TO FLOOR 4 C5(25"X25") 24 20#8 2.53 2.63 8.95 3.48 12.44 347.22 334.79FLOOR 4 TO FLOOR 6 C5(25"X25") 24 16#8 2.02 2.11
BASE TO GL 3-H C5(25"X25") 8 24#8 3.03 1.05GL TO FLOOR 2 C5(25"X25") 24 24#8 3.03 3.16
FLOOR 2 TO FLOOR 4 C5(25"X25") 24 20#8 2.53 2.63 8.95 3.48 12.43 347.22 334.79FLOOR 4 TO FLOOR 6 C5(25"X25") 24 16#8 2.02 2.11
BASE TO GL 2-B C6(24"X24") 8 12#11 3.25 1.04GL TO FLOOR 2 C6(24"X24") 24 12#11 3.25 3.12
FLOOR 2 TO FLOOR 4 C6(24"X24") 24 10 #11 2.71 2.60 8.84 4.36 13.20 320.00 306.80FLOOR 4 TO FLOOR 6 C6(24"X24") 24 8#11 2.17 2.08
BASE TO GL 3-E C7(25"X25") 8 24#8 3.03 1.05GL TO FLOOR 2 C7(25"X25") 24 24#8 3.03 3.16
FLOOR 2 TO FLOOR 4 C7(25"X25") 24 20#8 2.53 2.63 8.95 3.48 12.44 347.22 334.79FLOOR 4 TO FLOOR 6 C7(25"X25") 24 16#8 2.02 2.11
BASE TO GL 3-B C8(20"X32") 8 20#9 3.13 1.11GL TO FLOOR 2 C8(20"X32") 24 20#9 3.13 3.33
FLOOR 2 TO FLOOR 4 C8(20"X32") 24 16 #9 2.5 2.67 9.44 3.26 12.70 355.56 342.85FLOOR 4 TO FLOOR 6 C8(20"X32") 24 14#9 2.19 2.33
BASE TO GL 3-C C9(15"X30") 8 14#9 3.11 0.78GL TO FLOOR 2 C9(15"X30") 24 14#9 3.11 2.33
FLOOR 2 TO FLOOR 4 C9(15"X30") 24 12#9 2.67 2.00 6.78 3.23 10.00 250.00 240.00FLOOR 4 TO FLOOR 6 C9(15"X30") 24 10#9 2.22 1.67
BASE TO GL 2-G C10(18"X26") 8 18#8 3.04 0.79GL TO FLOOR 2 C10(18"X26") 24 18#8 3.04 2.37
FLOOR 2 TO FLOOR 4 C10(18"X26") 24 16#8 2.7 2.11 6.85 2.93 9.78 260.00 250.22FLOOR 4 TO FLOOR 6 C10(18"X26") 24 12#8 2.03 1.58
BASE TO GL 2-D C10(18"X26") 8 18#8 3.04 0.79GL TO FLOOR 2 C10(18"X26") 24 18#8 3.04 2.37
FLOOR 2 TO FLOOR 4 C10(18"X26") 24 16#8 2.7 2.11 6.85 2.93 9.78 260.00 250.22FLOOR 4 TO FLOOR 6 C10(18"X26") 24 12#8 2.03 1.58
BASE TO GL 2-E C10(18"X26") 8 18#8 3.04 0.79GL TO FLOOR 2 C10(18"X26") 24 18#8 3.04 2.37
FLOOR 2 TO FLOOR 4 C10(18"X26") 24 16#8 2.7 2.11 6.85 2.93 9.78 260.00 250.22FLOOR 4 TO FLOOR 6 C10(18"X26") 24 12#8 2.03 1.58
BASE TO GL 2-H C10(18"X26") 8 12#10 3.26 0.85GL TO FLOOR 2 C10(18"X26") 24 12#10 3.26 2.54
FLOOR 2 TO FLOOR 4 C10(18"X26") 24 10#10 2.71 2.12 7.20 2.93 10.13 260.00 249.87FLOOR 4 TO FLOOR 6 C10(18"X26") 24 8#10 2.17 1.69
BASE TO GL 1-H C12(18"x24") 8 22#7 3.06 0.73GL TO FLOOR 2 C12(18"x24") 24 22#7 3.06 2.20
FLOOR 2 TO FLOOR 4 C12(18"x24") 24 18#7 2.5 1.80 6.33 3.14 9.48 240.00 230.52FLOOR 4 TO FLOOR 6 C12(18"x24") 24 16#7 2.22 1.60
TOTAL 221.44 5547.45
#3@16"c/c
#3@18"c/c
#3@18"c/c
#3@16"c/c
#3@16"c/c
#4@ 22"c/c
#3@18"c/c
#3@16"c/c
#3@14"c/c
#3@18"c/c
#3@15"c/c
#3@16"c/c
#3@16"c/c

Design detail charts 123
Table C3: Detail Chart of Slab Design of Concrete Building
Steel Measurement
Panel ID Bar No Length of strip Spacing Nos Length of
Bar Total Length No of Floor
Volume of steel
ft inch ft ft cft Main Steel
AB14 # 4 8.50 8 13 82.17 1047.67 6.00 9.60 # 4 17.00 5.5 37 82.17 3047.76 6.00 27.94 # 4 8.50 8 13 82.17 1047.67 6.00 9.60
BD14 # 4 7.25 9 10 72.17 697.64 6.00 6.40 # 4 14.50 6 29 72.17 2092.93 6.00 19.19 # 4 7.25 9 10 72.17 697.64 6.00 6.40
AD12 # 4 6.50 10 8 63.92 498.58 6.00 4.57 11.00 7 19 63.92 1205.35 6.00 11.05 6.50 10 8 63.92 498.58 6.00 4.57
AI34 # 4 6.50 10 8 120.83 942.47 6.00 8.64 11.00 7 19 120.83 2278.51 6.00 20.89 6.50 10 8 120.83 942.47 6.00 8.64
EG41 # 3 13.00 5 31 82.17 2563.70 6.00 11.75 HI41 # 3 5.00 9 7 82.17 547.80 6.00 2.51
# 3 10.00 6 20 82.17 1643.40 6.00 7.53 # 3 5.00 9 7 82.17 547.80 6.00 2.51
EI12 # 3 32.67 6.5 60 33.00 1990.15 6.00 9.12 AI23 # 3 16.83 10 20 120.83 2440.28 6.00 11.18 CE34 # 3 5.92 9 8 32.00 252.44 6.00 1.16
11.75 6 24 32.00 752.00 6.00 3.45 5.92 9 8 32.00 252.59 6.00 1.16

Design detail charts 124
Steel
Measurement
Panel ID Bar No
Length of strip Spacing Nos Length of
Bar Total Length No of Floor
Volume of steel
ft inch ft ft cft
EXTRA TOP
AB12 #3 8.50 16 6 8.00 51.00 6.00 0.23 17.00 11 19 8.00 148.36 6.00 0.68 8.50 16 6 8.00 51.00 6.00 0.23
AB34 #3 8.50 16 6 8.00 51.00 6.00 0.23 17.00 11 19 8.00 148.36 6.00 0.68 8.50 16 6 8.00 51.00 6.00 0.23
AB23 #3 8.50 16 6 24.00 153.00 6.00 0.70 17.00 11 19 24.00 445.09 6.00 2.04 8.50 16 6 24.00 153.00 6.00 0.70
BC13 #3 7.25 18 5 12.37 59.81 6.00 0.27 14.50 12 15 12.37 179.43 6.00 0.82 7.25 18 5 12.37 59.81 6.00 0.27
EG13 #3 13.00 10 16 12.37 193.04 6.00 0.88 HI14 #3 5.00 18 3 24.75 82.50 6.00 0.38
10.00 12 10 24.75 247.50 6.00 1.13 5.00 18 3 24.75 82.50 6.00 0.38
AI23 #3 16.83 20 10 13.92 140.53 6.00 0.64 AB23 #4 34.42 16 26 16.83 434.42 6.00 3.98 EG13 #4 13.00 10 16 12.37 193.04 6.00 1.77 HI14 #4 5.00 18 3 12.38 41.25 6.00 0.38
10.00 12 10 12.38 123.75 6.00 1.13 5.00 18 3 12.38 41.25 6.00 0.38
AI12 #4 6.50 20 4 19.67 76.70 6.00 0.70 11.00 14 9 19.67 185.43 6.00 1.70 6.50 20 4 19.67 76.70 6.00 0.70
Total Volume of Steel 209.12 cft Gross Volume of Concrete 22929.16 cft
Net Volume Of Concrete 22720.04 cft

Design detail charts 125
CORNER REINFORCEMENT
Panel ID Bar No Panel
Length Spacing Nos Length of Bar Total Length weight
of steel
Total Weight of Steel
(ft) ()inch (ft) (ft) (ton) (ton)
Total Corner 4 # 4
32.67 ft X 34 .42 ft panel.
5.50 4 9.19 36.76 0.012 5.50 8 8.54 68.32 0.023
5.50 8 7.89 63.12 0.021 5.50 8 7.24 57.92 0.019 5.50 8 6.59 52.72 0.018 5.50 8 5.94 47.52 0.016 5.50 8 5.29 42.32 0.014 1.041 5.50 8 4.64 37.12 0.012 ( in 6 floors) 5.50 8 3.99 31.92 0.011 5.50 8 3.34 26.72 0.009 5.50 8 2.69 21.52 0.007 5.50 8 2.04 16.32 0.005 5.50 8 1.39 11.12 0.004 5.50 8 0.74 5.92 0.002
considering weight of steel = 7850.00 kg/m3 [1 kg/m3 = 0.0624 lb/ft3 ] = 489.84 lb/cft = 0.24 ton /cft
so total weight of steel in slab = 52.26 ton

Design detail charts 126
STEEL BUILDING Table C4: Detail chart of Beam design of Steel building
FRAME ID GRID ID SECTION LENGTH NO WEIGHT PER FEET WEIGHTft lb/ft tonne
FRAME 1A-B W30X99 34.42 6 99 10.22
W8X58 34.42 1 58 1.00B-D W30X90 29.58 6 90 7.99
W 8X40 29.58 1 40 0.59E-G W16X26 14.17 6 26 1.11
W8X40 14.17 1 40 0.28G-H W8X40 13.83 1 40 0.28H-I W16X31 20.00 6 31 1.86
W8X40 20.00 1 40 0.40FRAME 2
A-B W30X148 34.42 6 148 15.28W30X173 34.42 1 173 2.98W8X35 34.42 1 35 0.60
B-D W30X108 29.58 3 108 4.79W30X173 29.58 2 173 5.12W30X116 29.58 1 116 1.72W8X35 29.58 1 35 0.52
D-E W8X10 8.83 6 10 0.26W8X18 8.83 1 18 0.08
E-G W16X31 14.17 6 31 1.32W8X15 14.17 1 15 0.11
G-H W12X26 13.83 6 26 1.08W8X15 13.83 1 15 0.10
H-I W21X55 20.00 6 55 3.30W8X18 20.00 1 18 0.18
FRAME 3A-B W30X148 34.42 6 148 15.28
W8X35 34.42 1 35 0.60B-C W14X30 14.83 6 30 1.34
W8X15 14.83 1 15 0.11C-D W24X76 14.75 6 76 3.36
W8X24 14.75 1 24 0.18F-H W30X99 28.00 6 99 8.32
W8X31 28.00 1 31 0.43H-I W24X62 20.00 6 62 3.72
W8X18 20.00 1 18 0.18

Design detail charts 127
FRAME 4A-B W30X108 34.42 6 108 11.15
W8X58 34.42 1 58 1.00B-C W8X28 14.83 1 28 0.21C-E W 8X40 23.58 7 40 3.30E-G W24X68 28.00 6 68 5.71
W8X31 28.00 1 31 0.43H-I W18X40 20.00 6 40 2.40
W8X28 20.00 1 28 0.28FRAME A
1-2 W27X84 32.67 6 84 8.23W8X40 32.67 1 40 0.65
2-3 W16X31 16.83 6 31 1.57W8X28 16.83 1 28 0.24
3-4 W30X90 32.67 6 90 8.82W8X40 32.67 1 40 0.65
FRAME B1-2 W36X182 32.67 1 182 2.97
W36X150 32.67 5 150 12.25W8X35 32.67 1 35 0.57
2-3 W8X21 16.83 1 21 0.18W8X18 16.83 5 18 0.76W8X35 16.83 1 35 0.29W14X90 32.67 5 90 7.35
W30X173 32.67 1 173 2.83W8X67 32.67 1 67 1.09
FRAME C3-4 W14X99 32.67 6 99 9.70
W8X58 32.67 1 58 0.95FRAME E
2-3 W18X50 16.83 6 50 2.52W8X40 16.83 1 40 0.34
3-4 W21X147 32.67 1 147 2.40W30X132 32.67 5 132 10.78
W8X40 32.67 1 40 0.65FRAME G
1-2 W30X90 32.67 6 90 8.82W8X58 32.67 1 58 0.95
FRAME H1-2 W12X50 32.67 6 50 4.90
W8X58 32.67 1 58 0.952-3 W8X21 16.83 6 21 1.06
W8X24 16.83 1 24 0.203-4 W27X129 32.67 6 129 12.64
W8X35 32.67 1 35 0.57FRAME I
1-2 W30X90 32.67 6 90 8.82W8X40 32.67 1 40 0.65
2-3 W18X35 16.83 6 35 1.77W8X24 16.83 1 24 0.20
3-4 W30X108 32.67 1 108 1.76W30X90 32.67 5 90 7.35

Design detail charts 128
Table C5: Detailing chart of column in Steel building
FRAME ID GRID ID SECTION LENGTH NO WEIGHT PER FEET WEIGHTft lb/ft tonne
1-A W14X82 80.00 1 82 3.281-B W30X211 80.00 1 211 8.441G W14X109 80.00 1 109 4.361H W14X145 80.00 1 145 5.801I W14X43 80.00 1 43 1.722A W14X176 80.00 1 176 7.042B W30X292 80.00 1 292 11.682D W14X161 80.00 1 161 6.442E W14X22 80.00 1 22 0.882G W14X109 80.00 1 109 4.362H W14X120 80.00 1 120 4.802I W14X109 80.00 1 109 4.363A W14X176 80.00 1 176 7.043B W14X233 80.00 1 233 9.323C W14X145 80.00 1 145 5.803E W14X193 80.00 1 193 7.723H W14X193 80.00 1 193 7.723I W14X99 80.00 1 99 3.964A W14X74 80.00 1 74 2.964B W14X145 80.00 1 145 5.804C W14X176 80.00 1 176 7.044E W14X120 80.00 1 120 4.804H W14X120 80.00 1 120 4.804I W14X43 80.00 1 43 1.72
378.11 tonTotal weight of steel in all the columns and beams =

Design detail charts 129
Table C6: Detailing chart of slab of Steel building with corner reinforcements
AB41 # 4 8.50 8 13 82.17 1047.67 2.10# 4 17.00 5.5 37 82.17 3047.76 6.11# 4 8.50 8 13 82.17 1047.67 2.10
BD41 # 4 7.25 9 10 72.17 697.64 1.40# 4 14.50 6 29 72.17 2092.93 4.19# 4 7.25 9 10 72.17 697.64 1.40
AD12 # 4 6.50 10 8 63.92 498.58 1.0011.00 7 19 63.92 1205.35 2.426.50 10 8 63.92 498.58 1.00
AI34 # 4 6.50 10 8 120.83 942.47 1.8911.00 7 19 120.83 2278.51 4.576.50 10 8 120.83 942.47 1.89
EG41 # 3 13.00 5 31 82.17 2563.70 2.89HI41 # 3 5.00 9 7 82.17 547.80 0.62
# 3 10.00 6 20 82.17 1643.40 1.85# 3 5.00 9 7 82.17 547.80 0.62
EI12 # 3 32.67 6.5 60 33.00 1990.15 2.24AI23 # 3 16.83 10 20 120.83 2440.28 2.75CE34 # 3 5.92 9 8 32.00 252.44 0.28
11.75 6 24 32.00 752.00 0.855.92 9 8 32.00 252.59 0.28
AB12 # 3 8.50 16 6 8.00 51.00 0.0617.00 11 19 8.00 148.36 0.178.50 16 6 8.00 51.00 0.06
AB34 # 3 8.50 16 6 8.00 51.00 0.0617.00 11 19 8.00 148.36 0.178.50 16 6 8.00 51.00 0.06
AB23 # 3 8.50 16 6 24.00 153.00 0.1717.00 11 19 24.00 445.09 0.508.50 16 6 24.00 153.00 0.17
BC13 # 3 7.25 18 5 12.37 59.81 0.0714.50 12 15 12.37 179.43 0.207.25 18 5 12.37 59.81 0.07
EG13 # 3 13.00 10 16 12.37 193.04 0.22HI14 # 3 5.00 18 3 24.75 82.50 0.09
10.00 12 10 24.75 247.50 0.285.00 18 3 24.75 82.50 0.09
Nos Length of Bar Total Length weight of steel
MAIN STEEL
EXTRA TOP
Bar No Panel Length SpacingPanel ID

Design detail charts 130
Considering weight of steel as 7850 kg/m3= 0.24 lb/cft Total weight of reinforcement in slab = 48.43 ton
AI12 #4 6.50 20 4 19.67 76.70 6.00 0.70
11.00 14 9 19.67 185.43 6.00 1.70
6.50 20 4 19.67 76.70 6.00 0.70
209.12 cft
22929.16 cft
22720.04 cft
Total Volume of Steel
Net Volume Of Concrete
Gross Volume of Concrete
Panel ID
ft inch ft ft tonne#4 5.50 4 9.19 36.76 0.012
5.50 8 8.54 68.32 0.0235.50 8 7.89 63.12 0.0215.50 8 7.24 57.92 0.0195.50 8 6.59 52.72 0.0185.50 8 5.94 47.52 0.0165.50 8 5.29 42.32 0.0145.50 8 4.64 37.12 0.0125.50 8 3.99 31.92 0.0115.50 8 3.34 26.72 0.0095.50 8 2.69 21.52 0.0075.50 8 2.04 16.32 0.0055.50 8 1.39 11.12 0.0045.50 8 0.74 5.92 0.002
TOTAL CORNER 4
32.67 ft X 34 .42 ft panel.
Bar No Panel Length Spacing Nos Length of Bar Total Length weight of
steel

Design detail charts 131
Table C7: Calculation Chart of Bracings for Elevation 1 and 4of steel building
SECTION LENGTH (FT)
X -AREA (in2)
VOLUME (ft3)
NOTOTAL
VOLUME (CFT)
HSS 5X0.25 16.6 3.49 0.40 12HSS 5x0.375 13.73 5.1 0.49 6HSS 4X0.237 16.6 2.61 0.30 24HSS 5X0.50 16.6 6.62 0.76 6
19.55

Design detail charts 132
Table C8: Calculation Chart of Bracings for Elevation A and I of steel building
Total volume of steel in bracing = 38 cft
SECTION LENGTH (FT)
X -AREA (in2)
VOLUME (ft3)
NOTOTAL
VOLUME (CFT)
HSS 5X0.25 16.2 3.49 0.39 42HSS 4X0.25 16.2 2.76 0.31 6
18.35

Design detail charts 133
Table C9: Sample Calculation Chart of Beam to Column One Side End Plate Connection
Beam and Column Data:
Beam Size = W30x99 Member Properties:
Column Size = W14x82 Beam:
Beam Yield Stress, Fyb = 40 Beam:
Column Yield Stress, Fyc = 40 d = 29.70 in.
tw = 0.52 in.
Connection Loadings: bf = 10.50 in.
Beam End Moment, M = 108.33 tf = 0.67 in.
Moment Includes Wind or Seismic? Yes k = 1.32 in.
Beam End Reaction (Shear), R = 10.00 Column:
d = 14.30 in.
Connection Data and Parameters: tw = 0.51 in.
End Plate Length, Lp = 21.750 bf = 10.10 in.
End Plate Width, Bp = 8.000 tf = 0.86 in.
End Plate Thickness, tp = 0.7500 k = 1.45 in.
End Plate Yield Stress, Fyp = 36 k1 = 1.06 in.
ASTM Bolt Desig. (A325 or A490) = A325
Bolt Type (N, X, or SC) = SC
Bolt Hole Type (in End Plate) = Standard
Diameter of Bolts, db = 0.875
Total Number of Bolts, Nb = 8
Top Flange to End Plate Welding:
Top Flange to End Plate Welding:
Lw = 21.820 in.
fw = 2.052 kips/in.
w = 2/16 in. (size)
w(min) = 4/16 in. End plate volume 0.08 CFT
Beam Web to End Plate Welding:
fw = 6.240 kips/in. Total length of weld 73.34 in
w = 7/16 in. (size) Weld size 0.42 in
w(min) = 4/16 in. Area of weld 0.21 sqft
SUMMERY:
Design detail charts 134
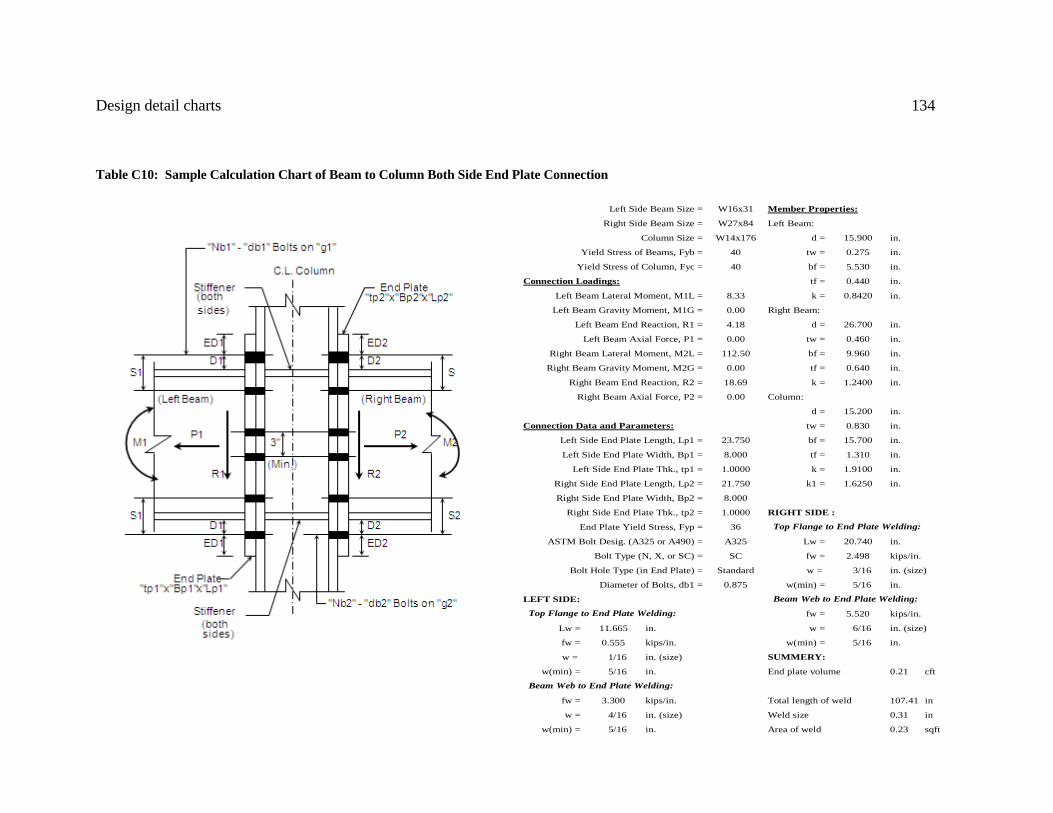
Table C10: Sample Calculation Chart of Beam to Column Both Side End Plate Connection
Left Side Beam Size = W16x31 Member Properties:
Right Side Beam Size = W27x84 Left Beam:
Column Size = W14x176 d = 15.900 in.
Yield Stress of Beams, Fyb = 40 tw = 0.275 in.
Yield Stress of Column, Fyc = 40 bf = 5.530 in.
Connection Loadings: tf = 0.440 in.
Left Beam Lateral Moment, M1L = 8.33 k = 0.8420 in.
Left Beam Gravity Moment, M1G = 0.00 Right Beam:
Left Beam End Reaction, R1 = 4.18 d = 26.700 in.
Left Beam Axial Force, P1 = 0.00 tw = 0.460 in.
Right Beam Lateral Moment, M2L = 112.50 bf = 9.960 in.
Right Beam Gravity Moment, M2G = 0.00 tf = 0.640 in.
Right Beam End Reaction, R2 = 18.69 k = 1.2400 in.
Right Beam Axial Force, P2 = 0.00 Column:
d = 15.200 in.
Connection Data and Parameters: tw = 0.830 in.
Left Side End Plate Length, Lp1 = 23.750 bf = 15.700 in.
Left Side End Plate Width, Bp1 = 8.000 tf = 1.310 in.
Left Side End Plate Thk., tp1 = 1.0000 k = 1.9100 in.
Right Side End Plate Length, Lp2 = 21.750 k1 = 1.6250 in.
Right Side End Plate Width, Bp2 = 8.000
Right Side End Plate Thk., tp2 = 1.0000 RIGHT SIDE :
End Plate Yield Stress, Fyp = 36 Top Flange to End Plate Welding:
ASTM Bolt Desig. (A325 or A490) = A325 Lw = 20.740 in.
Bolt Type (N, X, or SC) = SC fw = 2.498 kips/in.
Bolt Hole Type (in End Plate) = Standard w = 3/16 in. (size)
Diameter of Bolts, db1 = 0.875 w(min) = 5/16 in.
LEFT SIDE: Beam Web to End Plate Welding:
Top Flange to End Plate Welding: fw = 5.520 kips/in.
Lw = 11.665 in. w = 6/16 in. (size)
fw = 0.555 kips/in. w(min) = 5/16 in.
w = 1/16 in. (size) SUMMERY:
w(min) = 5/16 in. End plate volume 0.21 cft
Beam Web to End Plate Welding:
fw = 3.300 kips/in. Total length of weld 107.41 in
w = 4/16 in. (size) Weld size 0.31 in
w(min) = 5/16 in. 0.23 sqftArea of weld

Design detail charts 135
Table C11: Calculation Chart of Concrete and Reinforcement in Stair per Floor
Detailing of stair
#4 38 0.74#3 17 0.41
bottom beam+ landing beam 12"x10" 6 # 5 2 0.38
stirrup #3 @ 6" 59 0.121.65 97.34
net volume of concrete
(cft)
4.58
68.54
4.58
bar size
24.21
69.69
24.72
weist slab+landing slab
stair steps
item dimension
22
6"
No volume of steel(cft) volume of concrete (cft)
tread 10 " and rise 6 " 0.00

Design detail charts 136
Table C12: Calculation Chart of Concrete and Reinforcement in Shear Wall
Detailing of shear wall
Wall name
Gross concrete (cft)
Reinforcement (cft)
Net volume of concrete (cft)
1-DE 74.64 0.63 74.01D-12 261.36 2.40 258.96E-12 261.36 2.40 258.96
5.43 591.93
Volume

Design detail charts 137
Table C13: Detail Chart of brick and timber work of Concrete Building
ESTIMATION OF BRICK WORK
Description No of floor F
No of item N
Dimensions Area (sft)= [ FxNxLxB]
Volume (cft)
No of bricks required Length L
(ft) Width B
(ft) Height H
(ft) Brick wall( without opening) exterior wall 6 405.83 0.83 12.00 29220.00 24350 interior wall 6 424.33 0.42 12.00 30552.00 12730 Deduction for opening considering 40 % opening for door and window exterior wall 6 11688 9740 interior wall 6 12220.80 5092
Brick wall( excluding opening) exterior wall 14610 214746 interior wall 7638 112268
327014
ESTIMATION OF TIMBER WORK Considering frame as well as doors and windows are made of timber Also considering 40 % opening for door and window in the walls
No of floor , F exterior wall (sft) interior wall
(sft)
thickness of door and
frame total volume(cft)
Door and window 6 11688 12220.80 0.25 5977.20

i
DECLARATION
Declared that except where specified by reference to other works, the studies embodied in
thesis is the result of investigation carried out by the author. Neither the thesis nor any
part has been submitted to or is being submitted elsewhere for any other purposes.
Signature of the student
Shovona Khusru

ii
TABLE OF CONTENT
Page
No.
Declaration i
Table of contents ii
List of Symbols And Abbreviations vi
Acknowledgement vii
Abstract viii
Chapter 1 Introduction
1.1 General 1
1.2 Environmental Implications of Buildings 1
1.3 Building Materials and Construction Sector 3
1.4 Life-Cycle Assessment of Building Materials 6
1.5 Energy Cost 7
1.6 Scope 7
1.7 Objective 8
1.8 Research Overview 9
Chapter 2 Literature Review
2.1 Life Cycle Analysis 11
2.2 Carbon Dioxide (CO2) Emissions 12
2.3 CO2 Emissions Components of a Medium Size Building 13
2.3.1 Embodied Energy and Embodied CO2 Emissions 13
2.3.2 Construction Energy and Construction CO2 Emission 13
2.3.3 Energy in Use 13
2.3.4 Operating Energy and Operating CO2 Emission 14
2.3.5 Demolition Energy Consumption and Demolition CO2
Emissions
14
2.4 Life Cycle Energy Cost 15
2.5 Previous Researches 15

iii
2.6 Manufacturing Procedures of Building Materials 19
2.6.1 Brick 19
2.6.2 Cement 20
2.6.3 Sand 22
2.6.4 Aggregate 24
2.6.5 Steel 26
2.6.6 Timber 28
2.6.7 Concrete 28
Chapter 3 Methodology
3.1 General 31
3.2 Methodology of Developing Life Cycle CO2 Emission Equations of
Building Materials
31
3.2.1 Selection Criteria 31
3.2.2 Mode of Material Transport 33
3.2.3 Functional Unit 33
Chapter 4 Development of Life cycle CO2 Emission and Energy Cost
Equations
4.1 General 35
4.2 Life Cycle CO2 Emission Equations of Materials 35
4.2.1 Brick Profile 35
4.2.2 Cement Profile 37
4.2.3 Steel Profile 40
4.2.4 Sand Profile 44
4.2.5 Aggregate Profile 46
4.2.6 Timber Profile 47
4.2.7 Concrete Profile 49
4.3 Life Cycle Energy Cost Equations of Materials 51
4.3.1 Brick 52
4.3.2 Timber 53

iv
4.3.3 Steel 54
4.3.4 Aggregate 58
4.3.5 Sand 59
4.3.6 Cement 60
4.3.7 Concrete 61
Chapter 5 Comparative Study on Life Cycle CO2 Emission of
Concrete and Steel Building
5.1 General 63
5.2 Case study 63
5.2.1 Design of Building 63
5.2.2 Concrete building and Design Procedure 65
5.2.3 Steel Building and Design Procedure 66
5.3 Life Cycle CO2 Emission of Concrete Building 67
5.3.1 Cradle to Gate CO2 Emission of Concrete building 68
5.3.2 Emission of CO2 in Transportation Phase of Concrete building 71
5.3.3 Emission of CO2 in Construction Phase of Concrete building 73
5.3.4 Emission of CO2 in Demolition Phase of Concrete building 73
5.3.5 Total CO2 Emission of Concrete building 74
5.4 Life Cycle CO2 Emission From Steel Building 75
5.4.1 Cradle to Gate CO2 Emission of Materials in steel Building 76
5.4.2 Emission of CO2 in Transportation Phase of steel Building 79
5.4.3 Emission of CO2 in Construction Phase of steel Building 80
5.4.4 Emission of CO2 in Demolition Phase of steel Building 81
5.4.5 Total CO2 Emission of Steel Building 82
5.5 Comparison of Concrete and Steel Building Based on CO2 Emission 83
Chapter 6 Comparative Study on Life Cycle Energy Cost of Concrete
and Steel Building
6.1 General 85
6.2 Life Cycle Energy Cost Analysis of Concrete Building 85

v
6.2.1 Cradle to Gate Energy Cost of Materials Used in Concrete
building
85
6.2.2 Energy Cost in Transportation Phase of Concrete building 89
6.2.3 Energy Cost in Construction Phase of Concrete building 90
6.2.4 Energy Cost in Demolition Phase of Concrete building 91
6.2.5 Total Energy Cost from Concrete building 92
6.3 Life Cycle Energy Cost Analysis of Steel building 93
6.3.1 Cradle to Gate Energy Cost of Materials Used in Steel building 93
6.3.2 Energy Cost in Transportation Phase of Steel building 96
6.3.3 Energy Cost in Construction Phase of Steel building 98
6.3.4 Energy Cost in Demolition Phase of Steel building 99
6.3.5 Total Energy Cost from Steel building 99
6.4 Comparison Of Concrete and Steel building Based on Energy Cost 101
Chapter 7 Conclusions and Recommendations
7.1 General 105
7.2 Findings of the Research Work 106
7.3 Recommendations for Future Studies 107
References 109
Appendix A Emission Factors 113
Appendix B Product Specifications 116
Appendix C Design Detail Charts 118

vi
LIST OF SYMBOLS AND ABBREVIATIONS
AISC American Institute of Steel Construction
ASTM American Society for testing and Materials
ASD Allowable Stress Design
db1 Distance in kilometer from brick field to market.
db2 Distance in kilometer from construction site to brick chips processing site
c Distance in kilometer from cement factory to market
dst2 Distance in kilometer from market to construction site.
A Total area of weld in connection in square meter.
W Total weight of steel member and plates required to be weld in ton.
h Hoisting height of crane in meter for one ton of steel element transfer.
L Derricking length of crane in meter for one ton of steel element transfer
ds Total distance in km from sand processing unit to market
da Total distance in kilometer from aggregate processing unit to market
dad Distance in kilometer from construction site to disposal site.
t No of trees cut
dt1 Distance in kilometer from wood to saw mill and sawmill to market
dt2 distance in kilometer from market to construction site and construction
site to disposal site.
V Volume of timber cut in cubic feet.
Pd Price of 1 liter diesel in BDT
Pc Price of 1 kg coal in BDT
PLPG Price of 1 liter LPG in BDT

vii
ACKNOWLEDGEMENT
First, I would like to express my sincerest gratitude to the Almighty, the benevolent and
the kind, for His graciousness, unlimited kindness and divine blessings.
I would like to express my heartfelt gratitude and sincere thanks to my thesis supervisor,
Dr. Munaz Ahmed Noor, Professor, Department of Civil Engineering, BUET for his
adept guidance and enthusiastic support throughout the progress of this thesis. I am
greatly indebted to him for his affectionate assistance, spirited encouragement and
constructive criticism at every stage of this study. I consider myself very fortunate to
work under his sincere and supportive supervision. I would also like to take the
opportunity to specially thank him for his generous help and invaluable advice
throughout my master’s education.
I also wish to convey my honest gratefulness to the Head of the Department of Civil
Engineering, BUET and all members of the defense board for their time and patience.
I am immensely thankful to my employer, the authority of Ahsanullah University of
Science and Technology, Dhaka for giving me the permission to continue M.Sc.
Engineering in BUET.
At the end, I would like to thank all my teachers for their gracious toleration, endless
inspiration, support and of course all my family members especially my parents, friends
and colleagues for their treasured companionship and warm affection at all stages of my
life. I will be ever grateful to all of them for as long as I live.

viii
ABSTRACT
The construction sector of Bangladesh has seen massive boom in last few decades and is
responsible for greenhouse gases contribution. In this research, an investigation has been
made to develop empirical equations of life cycle CO2 emission and energy cost for seven
most widely used construction materials of Bangladesh namely brick, cement, sand, steel;
both from billet and scrap, stone chips, timber and concrete.
Based on overall study, an attempt has been made to present a guideline to estimate life
cycle energy cost and CO2 emission of different structural systems. To carry out the
investigation, this research modeled two similar medium sized buildings each designed by
finite element analysis using primarily Concrete and Steel. The models were based on a
914 m2 (9833 sq feet) floor area six-storey building. Both the superstructure of buildings
has been analyzed individually using the empirical equations developed in this study. The
major phases have been cradle to gate, transportation of component raw materials to site,
construction of the building and finally demolition. Operational CO2 emission of the
building has not been taken into consideration.
Analysis result of the said six storey mid rise building showed that steel produced from
ship breaking scrap consumes maximum energy in its entire life cycle and concrete emits
maximum CO2 in transportation phase among all the materials considered in this study.
This may be due to the fact that all the component materials are obtained from different
source locations. Although in cradle to gate phase, concrete building emits 73% of the
total life cycle CO2 and steel building emits 53.7% CO2, in construction phase emission of
CO2 of concrete building is less than one ton whereas that of steel building is 26.9% of
total emission. Considering total life cycle CO2 emission Steel building emits 1.7 times
CO2 per square feet as compared to concrete building. Considering total energy cost, Steel
building has 3.7 times energy cost per square feet than that of Concrete building. Based on
the results it can be concluded that concrete building is more sustainable than steel
building in perspective of Bangladesh.

CHAPTER 1
INTRODUCTION
______________________________________________________________________
1.1 GENERAL
The introductory chapter discusses the specific context in which this research project
was undertaken and latent implications of the results found, leading on to the problem
statement, including the objectives.
1.2 ENVIRONMENTAL IMPLICATIONS OF BUILDINGS The growing concentration of atmospheric carbon dioxide (CO2) contributing to global
climatic change is a long-term and large-scale problem (Bernstein et al., 2007).
Buildings have a significant impact on the environment, consuming world’s resources,
including water and energy. Buildings are also responsible for 40% of the waste which
ends up in the landfills and 40% of the greenhouse gas emissions (Cole et al., 1996). All
these impacts can be directly associated with each of the building’s life stages that occur
during its effective life – its construction, operation, maintenance, renovation, and so on.
Buildings are labeled according to the main material used for their sub- and super-
structures but the vast majority of buildings use a large number of materials. Hence it is
often not clear which materials or combinations of materials can achieve the best
environmental performance in terms of life-cycle cost and CO2 emissions. Nevertheless
this thesis will retain this labeling system while conscious of its limitations, as it is the
current practice.
As concern over the environmental impacts of building construction grows, many
researchers are beginning to use life cycle assessment as a means to quantify natural
resources consumption, and emissions of global greenhouse gases. Historically, focus
has been on understanding energy use during the operational period of the structure and
total life cycle emission in use phase. With this approach, an important factor has been
neglected; the embodied energy of construction materials. To understand overall

Introduction 2
environmental impacts of the building, all life cycle stages should be inventoried such as
material production, manufacturing, use and retirement. Assessing the environmental
impact of a complex system, such as a house, requires an understanding of the
environmental impacts of all of its parts.
More recently, it has been suggested that CO2 emissions may be a more meaningful
single indicator of overall global environmental impact. To assess the environmental
impact of global CO2 emission a lot of work had been done worldwide based on life
cycle CO2 emission, embodied energy and energy at use. Reduction in energy demand
through more efficient buildings brings benefits for the global environment as well as
lower costs and improved quality of life for the occupants. Oppenheim and Treloar
(Oppenheim et al.) discussed that in both Australia and overseas the field of embodied
energy and CO2 emission analysis is generally still only of academic interest. There is
little interest in the market place for undertaking of these calculations and the design
changes that would follow from the results produced. Additionally, no country yet has
embodied energy regulations. Accurate knowledge is hard to find, and it is rare to find
calculations done during the design process.
Scenario of Bangladesh
Carbon dioxide emissions in Bangladesh are those stemming from the burning of fossil
fuels and the manufacture of cement. Gas fuels has the largest contributionwhich is 62%
of the total emission (Carbon Dioxide Information Analysis Center). Other sources
include consumption of solid, liquid, and gas flaring. Bangladesh is considered as a
developing economy which has recorded GDP growth above 5% during the last few
years. CO2 emission in Bangladesh has been increasesd tremendously in the last few
decades. During the decade 1970-1980s, the emission was 5 to 8 thousand metric tons,
in 1981-1990s it was 9 to 12 thousand metric tons which increased rapidly in the decade
1991-2000, reaching 12-25 thousand metric tons and in 2007, it reached 40 thousand
metric tons (www.tradingeconomics.com). World Resource Institute reported in 2003
that the per capita CO2 emission in Bangladesh is 29874 thousand metric tons and
position of Bangladesh is sixty five in the whole world. This study in 2001 considered

Introduction 3
carbon dioxide emission from energy use and cement manufacturing (United Nations
Framework Convention on Climate Change (UNFCCC). Sector wise study of CO2
emission showed that 33% emission is from manufacturing and construction sector and
13% emission is from residences (International Energy Agency (IEA), 2001). All this
data emphasise on the importance of estimating CO2 emission from construction
materials and building construction process in Bangladesh.
In terms of energy consumption, much of the existing commercial building stock is
made up of multi-storey, highly-glazed, thermally-lightweight developments that are
totally dependent on non-renewable energy for heating, cooling and lighting. In terms of
materials, most commercial buildings tend to make extensive use of brick, steel, glass
and concrete, all of which can be energy-intensive to produce, via processes with the
potential to have adverse environmental impacts and using resources that are in
shortening supply.
In this regard, it is worth noting the commercial rivalries that can exist between the
purveyors of competing materials, each promoting the potential environmental
advantages of their respective products such as the thermal mass properties of concrete,
the recycle-ability of steel, the renew-ability of wood, and so on and the necessity for an
independent academic researcher to remain detached from these influences.
1.3 BUILDING MATERIALS AND CONSTRUCTION SECTOR
In developing countries, the share of fixed capital formation in construction is often
about 50% of the total but can be as high as 80% (UNCHS, 1986). Therefore, the
construction sector may be regarded as one of the backbones of the development process
mainly because of its multiplier effect in other sectors of the economy. In many
developing countries the annual growth rate in construction is often considerable higher
than the growth of population and the gross domestic product.
Building materials form the single largest input in construction, accounting for about 50
to 80 per cent of the total value of construction. Although part of the building materials
may be imported, there is considerable production of building materials at the local level

Introduction 4
in developing countries. For many types of building materials, developing countries
have improved their share of global production. For locally produced building materials,
notably those produced at the rural level, much less is known. Fired and unfired bricks,
clay roof tiles, lime, timber, bamboo, etc. are the building materials widely produced and
used within Bangladesh. Bricks in particular as well as bamboo, wood and natural fibers,
are important building materials in both urban and rural areas. For instance, in
Bangladesh out of about 14.8 million households, 3.7 million or about 25% used bricks
(fired and unfired) as wall material, while 9.4 million or about 63% used bamboo and
natural fibers such as straw, jute sticks, etc. (SDCSKAT,1991).
Building activities can be grouped into three main categories: Modern, Conventional and
Traditional. Each category makes its own pattern of demand for building materials. The
first category often requires sophisticated and costly building materials. For the other
two, the structure of the demand is somewhat different and diversified. The use and
choice of building materials by the traditional sector, generally associated with rural
areas, is largely influenced by the suitability and local availability of such materials and
may show regional variations due to climatic conditions, etc. The conventional sector,
often found in urban and semi-urban areas is based partly on traditional methods and
materials but mostly influenced by modern sector materials such as cement, reinforced
concrete, aluminum, gypsum, etc.
Many developing countries have geared their construction efforts towards the
establishment of the infrastructure needed for economic development in the form of
highways, major townships, irrigation works, bridges, office buildings, etc., for which
building materials often had to be imported. Subsequently, local production capacities
were developed in varying degrees, but, as the major construction activities were in the
modern sector, production capacities were mainly directed towards more sophisticated
capital and energy intensive products such as cement, steel and glass. These production
capacities, in general, are large scale, using imported components such as expertise,
equipment, and sometimes even raw materials and they are often owned by the
government sector. Much less development effort has been geared towards the

Introduction 5
traditional building materials sector which, again in general, is small scale,
locally/privately owned and uses local raw materials and equipment. This phenomenon
is also evident from the energy requirements for the production of building materials.
The use of local building material
The changes in the building materials industry have had a distinct influence on the way
buildings such as houses, etc. are built and the type of materials used, not only in Asia,
but in other parts of the world as well. Formerly, most housing and other buildings were
constructed out of locally available natural materials and/or materials manufactured
locally. These include wood, mud, brick, stone, lime, clay-tile, bamboo, thatch, etc.
Although still widely used in rural areas, many of these traditional materials, have been
gradually replaced by cement, steel, aluminum, asbestos cement, gypsum board, glass,
plastics, plywood, particle board, etc., especially in urban areas. However, there is still a
strong demand for more traditional building materials such as lime, fired clay bricks and
timber, although the growth rate in the use of these materials may be lower than cement
and iron roofing sheet. Unfortunately, little is known about the traditional construction
sector's use of locally-available building materials. In most countries, statistics on the
production or use of traditional building materials, as well as construction activities in
the traditional (rural) sector are almost non-existent and figures, which are available, are
often based on estimates.
Changes in the use of local building materials
Despite a lack of hard data, it appears that in wood scarce-areas people are moving away
from timber construction in favor of other construction materials. To some extent these
changes are a result of scarcity, higher prices, lower quality and/or irregular supply of
traditional materials and the availability of relatively cheap alternatives. But there may
be other reasons as well. First the use of concrete and metal structures increases the
status of the owner and is considered a sign of being modern. There are other less
obvious reasons for preferring one type of building material over others. For instance, in
Bangladesh, users of corrugated iron roofing sheets state that in times of economic
hardship, their corrugated iron roof sheets can be sold to raise money, unlike clay

Introduction 6
roofing tiles which appear to have no resale value. In addition, iron roofing sheets in
many cases can be recovered after storms, while other roofing materials may be
damaged beyond repair. One the other hand, the skills necessary for construction with
local building materials may have been partly or completely lost. For instance, earth is
frequently identified as a nondurable construction material. However, with proper roof
overhangs and/or an appropriate rendering of the walls, the lifetime of earth can be very
long. In Central and South America massive churches have been built using earth only.
Use of excessive amounts of cement to stabilize soils may turn a low-cost building
material into an "industrial" product – too expensive to be considered a real competitor
to other local building materials.
The use of fired clay bricks in structural masonry in place of reinforced concrete can be
a cost saving technique but unfortunately the use of bricks requires more skill during
construction. Brick walls without plaster are cheaper, not only during construction but
afterwards as well, as they do not require maintenance such as whitewashing, etc.
However skilled bricklayers are necessary to achieve a pleasing look and uniform bricks
(straight, no broken edges, etc.) are also needed. However, in all cases local conditions
such as the climate should be taken into account. Earth construction for example is less
suitable in areas which often become waterlogged. Bamboo should not be used in direct
contact with the soil unless it has been properly treated. Roof tiles may have to be
fastened to rafters and purlins in areas with strong wind. Much depends on local
conditions. Building materials which are appropriate and/or competitive in one country
may not be suitable in other countries. For instance "pozzolana" or hollow cement
blocks, widely used in Indonesia, India and Thailand, were a failure in Bangladesh
because the blocks apparently were too expensive and/or were considered inferior to
fired or unfired clay bricks and other building materials such as bamboo.
1.4 LIFE-CYCLE ASSESSMENT OF BUILDING MATERIALS
Buildings go through many stages throughout their useful life, none of which are
particularly simple to analyze from an environmental point of view. From the initial
conception to final recycling, re-use or demolition of a building, a whole range of

Introduction 7
processes must be taken into account. These include transportation to site, site erection
and construction, lifetime use of the building, repairs, maintenance and refurbishment,
demolition or dismantling it at the end of its life, transportation for reuse, and recycling or
disposal (Cole and Kernan, 1996; Eaton and Amato, 1998). In short, a full Life Cycle
Analysis (LCA) is required if one is to properly and thoroughly assess the environmental
impact of a building.
1.5 ENERGY COST
As far as the selection of appropriate indicators of environmental impact is concerned,
energy has long been the measurement of choice (Alcorn, 1998; Baird and Chan, 1983;
Baird and Newsam, 1986; Stein, Stein, Buckley and Green, 1980). Operational energy
use is relatively straightforward to assess. With international protocols (IFIAS, 1974) in
place for the assessment of the embodied energy of materials which tend to be country-
specific, embodied energy calculations have been the subject of considerable study,
particularly following the various ‘energy crises’ in the latter part of the twentieth
century. In many cases it is feasible to calculate CO2 emissions from energy data, though
again this tends to be country-specific, depending on the energy mix and industrial base
of the region and chemical releases of CO2. Hence, energy cost of the building materials
represent the expenditure in energy used in several phases of life cycle.
1.6 SCOPE
Life cycle assessment (LCA) is an analytical methodology that assesses the
environmental performance of a building by taking a system perspective over the whole
life-cycle, from cradle to grave (Nebel, 2007; Zsuzsa and Nebel, 2006). Normally an
LCA involves various environmental assessments such as emissions, wastes and
resources used from all of the buildings life stages from initial conception to final
recycling or disposal. In this study, the scope of the assessment is reduced to CO2
emissions and energy cost estimation, in the following main stages in the life of a
building:
− Extraction of raw building materials

Introduction 8
− Embodied CO2 emission calculation
− Transportation to site
− Construction process of the building
− Demolition and reuse of material
Other stages such as operation of the building and maintenance of the building materials
over the building’s effective life have not been considered because the focus of the study
is on life cycle CO2 emission of construction materials. Materials in their useful life do
not emit any CO2. Emission of CO2 in demolition and disposal has been considered
although previous studies agree that these contribute a relatively small amount to their
respective total life cycle energy consumption and life-cycle CO2 emissions (Cole &
Kernan, 1996; Suzuki & Oka, 1998).
Problem statement: The aim is to estimate life cycle carbon dioxide emission and
energy cost of different building materials. A secondary aim is to identify if the use of
different materials, such as steel and concrete for a building with same plan does
influence the outcome and how.
1.7 OBJECTIVE
The objectives of the thesis are to
- Develop CO2 emission equations from cradle to gate for different types of cement,
sand, timber and aggregate (stone chips) in context of Bangladesh.
- Develop CO2 emission equation from cradle to grave for brick in context of
Bangladesh.
- Develop total life cycle CO2 emission equation of steel from two different
sources i.e. billet and steel scrap.
- Develop CO2 emission equation of concrete using the equations of component
materials for different mix ratios.
- Identify most CO2 emitting material used in building construction in Bangladesh.

Introduction 9
- Estimate energy cost of the above stated building materials in perspective of
Bangladesh.
- Compare CO2 emission and energy cost for a realistic design of two buildings
with steel and concrete as the main construction materials used as the case
studies in the assessment.
Possible outcome:
This study will help to develop a simple carbon dioxide calculator. It will help local
Civil Engineers to assess the environmental impact and cost comparison of alternative
building materials of Bangladesh. It will be possible to identify sustainable materials
considering both CO2 emission and life cycle energy cost.
1.8 RESEARCH OVERVIEW
This thesis is divided into seven main chapters, with the current introduction section
providing the specific context in which this research project has been undertaken, leading
up to the problem statement and the objectives.
Chapter 2 reviews and discusses literature regarding the different life stages of building’s
life-cycle energy consumption and CO2 emissions. It presents the order of magnitudes
between the energy cost and CO2 emissions life stages that a medium size building
incurred during its effective life-cycle.
Chapter 3 describes the methodology employed in this research to determine the life-
cycle energy cost and CO2 emissions of the case study buildings. Chapter 4 represents the
life cycle CO2 emission and energy cost equations. To achieve this, this chapter will be
divided into two parts: one part of it involves developing equations of CO2 emission and
second part of this chapter involves development of energy cost equations and also
describes the different variables involved in the equations. Chapter 5 describes the case
study design with emphasis on the great care taken to ensure a realistic design of the two
buildings used as case studies in the assessment with concrete and steel used as main
construction materials. Chapter 3 will also provide the rationale and emphasis will be
placed on CO2 emissions, and especially, total life cycle CO2 emissions for steel as it has

Introduction 10
recycling potential.
Chapter 6 represents the results produced from the assessment of energy cost of steel and
concrete buildings separately, considering the individual construction materials and
building as a whole and also provides a discussion and comparison.
Conclusions related to each of the objectives are presented in Chapter 7. The chapter
concludes by suggesting future implications and research avenues.
The Appendices found in the rear of this document provide additional information to
support the rationale, assumptions and findings of this research project. Finally, the
schedules of materials and the spread sheet with the calculations of CO2 emissions and
energy cost are attached in the appendix.

CHAPTER 2
LITERATURE REVIEW
__________________________________________________________
This chapter introduces the different components of life-cycle CO2 emissions of different
building materials, energy cost and manufacturing procedures of construction materials. It
will also present the order of magnitudes between each of those life-cycle components.
Data from previous researches on the significance of CO2 emissions in the total life of the
building material for different building systems are also discussed in this chapter.
2.1 LIFE CYCLE ANALYSIS
Life cycle analysis (LCA) quantifies the environmental impacts caused by the energy and
material flows in all stages of a product’s life cycle. In LCA research, the product system
being investigated is structured into several stages. Conventionally, these are 1) raw
material acquisition, 2) parts fabrication, assembly, and construction, 3) use, and 4)
retirement or end-of-life. Life cycle assessment is commonly referred to as a cradle-to-
cradle analysis because it looks at all inputs and outflows in a product system over its
entire life history. In a full LCA, all inputs like material, energy, water and outflows such
as air and water emissions and solid wastes are accounted for. LCA examines the total
environmental impact of a material or product through every step of its life – from
obtaining raw materials, for example, through mining or logging, through manufacture,
transport, their use in the home, and ultimate disposal or recycling. There may be different
system boundaries for LCA studies. They are discussed below.
Cradle to gate: Cradle to gate is the life cycle of a material from the extraction of its raw
materials until it leaves the ‘gate’ of the manufacturing facility. It does not include the
transport to the construction site.
Cradle to site: Cradle to site indicates the life cycle of a material from extraction of raw
material to construction site. It is the extension of life cycle from cradle to gate where the
transportation distance from manufacturing facility to market and construction site is
considered.

Literature review 12
Cradle to grave: Cradle to grave measures the environmental impact of a product from the
extraction of its raw materials until the product is disposed to landfill. This does include
the transport to the construction site.
2.2 CARBON DIOXIDE (CO2) EMISSIONS
Total CO2 emissions represent the mass of CO2 produced during the combustion of solid,
liquid, and gaseous fuels, from gas flaring and the manufacture of cement. These estimates
do not include bunker fuels used in international transportation due to the difficulty of
apportioning these fuels among the countries benefiting from that transport. Carbon
dioxide emissions are often calculated and reported in terms of their content of elemental
carbon. For these data, their values were converted to the actual mass of CO2 by
multiplying the carbon mass by 3.664 (the ratio of the mass of CO2 to that of carbon). The
primary difference between Carbon Dioxide Information Analysis Center (CDIAC,
reported here) and International Energy Agency (IEA) CO2 emission estimates (also
available from Earth Trends) is that the CDIAC data include emissions from sources other
than fossil fuel combustion, primarily cement manufacture.
CO2 emissions from solid fuels represent the mass of carbon dioxide emitted primarily,
but not exclusively, from burning coal. Carbon dioxide emissions from liquid fuels are
primarily, but not exclusively, from burning of petroleum products. These estimates do not
include bunker fuels used in international transportation due to the difficulty of
apportioning these fuels among the countries benefiting from that transport. Carbon
dioxide emissions from gaseous fuels are primarily, but not exclusively, from burning of
natural gas. Carbon dioxide emissions from gas flaring result from the burning of gas
released in the process of petroleum extraction. CO2 emissions from cement
manufacturing are produced as cement is calcined to produce calcium oxide.
Approximately 0.5 metric tons of carbon is released for each metric ton of cement
production. Per capita CO2 emissions figures are obtained by dividing total emissions of
carbon dioxide by the population for a particular country and year. Total CO2 emissions
represent the mass of CO2 produced during the combustion of solid, liquid, and gaseous
fuels, from gas flaring and the manufacture of cement.

Literature review 13
2.3 CO2 EMISSIONS COMPONENTS OF A MEDIUM SIZE BUILDING
Different terminologies are used to discuss the life cycle energy consumption and CO2
emission of a building. They are discussed below.
2.3.1 Embodied Energy and Embodied CO2 Emissions
Embodied energy is the energy consumed in all activities necessary to support a process,
and comprises of both direct and indirect components (Baird and Chan, 1983). In building
construction, direct energy includes building assembly and indirect energy includes the
energy embodied in building materials and products (Treloar et al., 2001). As it was said
in Cole and Kernan (1996), “Normally embodied energy typically describes only the
energy to initially produce a building and does not include the energy associated with
maintaining, repairing and replacing material and components over the life of a building,
hence the importance of using the designation initial”.
In addition to the embodied energy, some processes in the production of building
materials release CO2, mainly due to the use of fossil fuel in the electricity mix used as
energy in the production of the materials or in for the use of carbonaceous materials. There
is some research done that accounts for embodied CO2 building materials’, but this is
much more infrequent than research on embodied energy (Nebel, 2007; Page, 2006).
2.3.2 Construction Energy and Construction CO2 Emission
Construction energy is the energy consumed in the construction phase of a building.
Construction activities and construction equipments is a great source of CO2 emission.
Construction of building involved a number of operations namely crane operation, mixing
of materials, use vibrator, compactor, lifts, welding and so on. The emission from this
operations and equipments are termed as construction CO2 emission.
2.3.3 Energy in Use
Energy in use that is the energy required by the occupants of an existing or planned
building, primarily for space heating, water heating and lighting – and of the need to
reduce it. Reduction in energy demand through more efficient buildings brings benefits for
the global environment as well as lower costs and improved quality of life for the
occupants. Buildings in use are the biggest source of energy demand in the UK, with

Literature review 14
homes accounting for approximately 30% (and offices 20%) of national energy
consumption (i.e. as much as the industrial and transport sectors put together). Homes and
offices accounted for the release of 579 million tons of carbon dioxide (MtCO2) in 1990. It
has been estimated that 20-30% of this energy demand could be saved through the
application of cost-effective energy efficiency measures (HMSO 1998).
2.3.4 Operating Energy and Operating CO2 Emissions
Operational CO2 emission of buildings is the CO2 emitted to condition (heat, cool and
ventilate) and light the interior spaces and to power equipment and other services. It varies
considerably with building use patterns, climate and season, and the efficiency of the
buildings and its systems (Cole and Kernan, 1996). It is by far the largest component of
the life-cycle CO2 emission. It is far larger than the construction, initial embodied, and
demolition emission all added together (Aye et al., 1999). Cole and Kernan (1996)
conclude that for a building designed following conventional energy performance
standards operational energy will be the largest component of the life-cycle energy
consumption. The study states that only as the energy efficiency of the buildings improve,
the amount of energy required to produce them – embodied energy – will represent an
increasing component of the life-cycle energy consumption (Cole and Kernan, 1996).
Page (2006) briefly ranked the energy use components of life-cycle energy use of the
buildings studied in that research. He said that in terms of energy consumption, the
operation of office buildings is ranked first and contributes to 82% of the life-cycle energy
consumption, while construction work contributes only 15%. For the single storey health
building studied in his study over a 50 year life period, if construction contributes 15% of
the energy consumption, embodied energy accounts for between 7% and 9% of the life-
cycle energy use (Page, 2006).
2.3.5 Demolition Energy Consumption and Demolition CO2 Emissions
Demolition energy is the energy used to demolish buildings and the subsequent transport
and disposal of the building’s waste materials at the end of its effective life. The amount
of CO2 emitted in demolition of a building is termed as demolition CO2 emission. There is
limited information published and it is a process difficult to assess both demolition energy
and CO2 emission based on the prediction of demolition practice some 50 years, or more,

Literature review 15
in the future. It can also be difficult to assume an increase in efficiency of demolition and
reutilization of materials during this period of time (Cole and Kernan, 1996). Suzuki and
Oka (1998) suggest that energy consumption is 0.49 GJ/m and CO2 emissions are 36
kg/CO2 from the demolition of a reinforced concrete office building. Both studies in this
section agree that energy consumption and CO2 emissions from the demolition work
contributes a relatively small amount to their respective totals (Cole and Kernan, 1996;
Suzuki and Oka, 1998).
2.4 LIFE CYCLE ENERGY COST
Life cycle costing can be defined as an economic assessment of a building or building
component that considers all the significant costs of ownership over its economic life
expressed in terms of equivalent monetary unit. Energy cost of a building material can be
defined as the expenditure involved in fuel, electricity and other forms of energy used in a
life cycle of a material. Each fuel source has a quantity of CO2 emissions associated with
it. These are not always available in a form that is complete for the end-use of these
energy sources. Coal, gas, petrol, diesel, electricity etc can be considered as the sources of
energy and amount of these energy sources used in the life cycle of a product can be
converted in monetary terms to calculate life cycle energy cost.
2.5 PREVIOUS RESEARCHES
Historically, embodied energy was the prime focus of the research on the life cycle CO2
emission of building materials. Cole and Kernan (1996) suggest distinguishing between
the following four distinct categories of a building’s life-cycle energy consumption.
− The energy to initially produce the building (Initial embodied energy).
− The recurring embodied energy required to refurbish and maintain the building over its
effective life.
− The operational energy, which is the energy use in the operation of the building, for
example the energy use to condition the building (heating, cooling and ventilation), light
the interior space and to power the equipment and other services.
− Energy to demolish and dispose of the building at the end of its effective life.
Literature review 16
Eaton and Amato (1998) suggest a slightly more detailed sequence of life stages:
− Transportation to site.
− Site erection and construction.
− Life-time of the building or structure.
− Repairs.
− Maintenance and refurbishment.
− Demolition or dismantling of the structure at the end of its life.
− Transportation for reuse.
− Recycling or disposal.
From all of the building’s life stages, energy and CO2 emissions of construction and
demolition phases are normally neglected and not accounted into the life-cycle energy use
and CO2 emissions of buildings (Aye et al., 1999). On the other hand from all different
environmental burdens, the researches commonly found are carried out for just a selection
of environmental impacts. These are typically energy use and in some cases CO2
emissions (Eaton & Amato, 1998).Blanchard et al. (1998) studied a 2,450 ft2 residential
home referred to as SH or Standard Home built in Ann Arbor, Michigan to determine total
life cycle energy consumption of materials fabrication, construction, use and demolition
over a 50 year period. Life cycle global warming potential (GWP) and life cycle cost were
also determined. The home was then modeled to reduce life cycle energy consumption by
employing various energy efficiency strategies and substitution of selected materials
having lower embodied energy. The total life cycle energy was found to be 15,455 GJ for
SH (equivalent to 2,525 barrels of crude oil1) of which 14,482 GJ (93.7%) occurred
during the use phase (space and water heating, lighting, plug loads and embodied energy
of maintenance and improvement materials). The purchase price of SH was $US 240,000
(actual market value) and determined to be $22,801 more for Energy Efficient Home or
EEH.
Suzuki et al. (1998) quantify the total amount of CO2 emission of office buildings in
Japan. In this study a method for estimating the life cycle energy consumption and the life

Literature review 17
cycle CO2 emissions of office building was proposed by construction price index from
1985 input/output (I/O) tables of Japan. Results produced showed that these were
representative of national average cases but it was unreliable mainly due to assumptions
regarding tariffs. The study found that the total emission of CO2 by the construction of
office building varies from 650 to 1100 kg/m2 with an average value of 790 kg/m2.
Nicolas (2008) studied a medium size commercial building to determine the influence of
construction material on the life cycle energy consumption and CO2 emissions. The
analysis was based on an actual 4250 m2 building with mixed mode ventilation system
which was under construction during the study at the University of Lanterberg in Christ
church. To estimate the embodied CO2, Alcorn (2003) and GaBi coefficients were used.
The building was also compared for timber, steel and concrete and timber plus material as
alternative structural system. The CO2 results showed that when using Alcorn coefficients
total embodied CO2 emission averaged 7% and operating CO2 emission averaged 93% and
using GaBi coefficients total embodied CO2 emission averaged 16% and operating CO2
emission averaged 84% of the total life cycle CO2 emission of the four buildings. Using
Alcorn coefficients, the difference between the highest (steel building ) and the lowest
(timber plus)life cycle CO2 emission represents 27% increment of the highest over the
lowest, while using GaBi coefficients it was 9%.
According to Center for Building Performance Research by Victoria University (Alcorn,
A., 2003), the embodied CO2 releases are as followed.
Table 2.1: Emission statistics of different building material
Material CO2 released g CO2/kg
g CO2/m2
Aluminium ( extruded, powder coated)
9205 24855
Concrete (30 MPa) 159 376 Steel (virgin, structural ) 1242 9749 Timber (pine) -1662 -698 Glass(float) 1735 4372
Source: Embodied energy and CO2 coefficients for New Zealand building materials, Center for Building
Performance Research by Victoria University of Wellington, 2003.
Hammond and Craig Jones (2008) of sustainable energy research team (SERT) of
Department of Mechanical Energy of University of Bath developed Inventory of Carbon

Literature review 18
and Energy (ICE). The aim of the work was to create an inventory of embodied energy
and carbon coefficients for building materials. The boundary of this study was cradle to
gate and the data was restricted for British Isles. The data was collected from secondary
resources in the public domain, including journal articles, Life Cycle Assessments
(LCA’s), books, conference papers etc. The report was structured into 34 main materials
groups namely Aggregates, Steel, Timber, Sand, Concrete, Aluminium etc. A material
profile was created for each main material. Table 2.2 below represents a summary of some
most used materials.
Table 2.2: Inventory of Carbon and Energy (ICE) of construction materials by University
of Bath, UK.
Material Embodied Energy and Carbon Data EE-MJ/kg EC- kg CO2/kg Aggregate 0.1 0.005 Aluminium 155 8.24 Brick (per single brick) 8.4 0.62 Cement (CEM I) 4.6 0.83 Concrete 1:2:4 1:1.5:3 1:3:6
0.95 1.11 0.77
0.129 0.159 0.096
Glass 15 0.85 Iron 25 1.91 Sand 0.10 0.005 Steel (average of all steels) Virgin Recycled
24.40 35.30 9.50
1.77 2.75 0.43
Timber 8.50 0.46
Many researchers have done several studies on the carbon footprint of individual
construction material. According to Winters-Downey (2010) based on the study of
reclaimed structural steel, the production process including scrap recovery for structural
steel from an electric arc furnace contributes approximately 0.73 tons of CO2 per ton of
steel, with transportation, fabrication and erection contributing roughly an additional 0.3
tons of CO2 per ton of steel.
The three cases in Canada are part of the research undertaken by Cole and Kernan (1995)
in which a 4,620 m2 three storey generic office building is redesigned utilizing either
Literature review 19
timber, steel or concrete as the material used mainly in the structural systems (finishing
materials remain the same for all cases). The results of that research show that the total
initial embodied energy is 4.26 GJ/m2, 4.86 GJ/m2 and 4.52 GJ/m2 for the timber, steel and
concrete building respectively. Steel is 1.14 times greater than Concrete, and concrete is
1.06 times greater than the wood structure (Cole and Kernan, 1996).
A research conducted in New Zealand in 2006 on a recently constructed building was
selected and the structural systems were re-designed, to an extent that was ‘practical and
reasonable’, in timber, concrete and steel. The building chosen was a health building
(Outpatient) with a floor area of 1640 m2 in a single storey. The layout consists of over 35
consultation and service rooms and an educational area attached to the back of the
building (Page, 2006). When looking at total embodied CO2 emissions, the results of that
research were 369 kg/m2, 253 kg/m2 and 149 kg/m2 for the concrete, steel and timber
building respectively. Note that this is a small single storey building and that not all
materials and fittings have been included in the alternative designs.
2.6 MANUFACTURING PROCEDURES OF BUILDING MATERIALS
2.6.1 Brick
In aggregate starved Bangladesh, fired clay bricks form a significant portion of the
materials used in the construction industry. They are the major “building-blocks” in all
infrastructure, building, road and highway projects. The stages of brick production are -
Clay Extraction, Transport and Preparation - The clay is excavated by hydraulic
excavator or by hand from nearby riverbeds and transported to the plant-stacking yard by
trucks. The clay is then crushed by means of roller mills, followed by a double-shaft
mixer, where water is added in such a manner as to ensure moisture content of 15%.
Brick Shaping - The tempered material is fed into a vacuum extruder for continuous
column production. The column is then cut with a cutter column and a cutter green to the
required size. The green brick is then manually loaded on to a drying car for drying.
Brick Drying - The drying car is then transported into the drying tunnel by means of a
hydraulic pusher. Hot air for drying is funneled into the tunnel from the annular kiln. The
drying cycle lasts for about 26 hours.

Literature review 20
Brick Firing - The dried green bricks are unloaded manually into the kiln. The speed of
the firing is 1.25m/h at a sintering temperature of about 950 oC–1050 oC. The fired bricks
are unloaded and conveyed manually in carts to the stacking yard.
2.6.2 Cement
A cement production plant consists of the following three processes: raw material process,
clinker burning process and finish grinding process. The raw material process and the
clinker burning process are each classified into the wet process and the dry process. These
processes are selected with consideration given to properties of raw materials, costs of
fuel, conditions of location and others. Cement manufacturing dry process description is
given below:
Quarrying- Two types of materials are necessary for the production of cement: one rich in
calcium or calcareous materials such as limestone, chalk, etc., and one that is rich in silica
or argillaceous materials such as clay. Extensive quarry drilling and analysis are being
undertaken to reduce the variability of the raw material quality. The quality check that
starts from the quarry ensures optimization in the utilization of the reserves. Limestone
and clay are either scraped or blasted from the quarry and then transported to the crusher.
Crushing- The crusher is responsible for the primary size reduction of the quarried
materials. Boulders as big as 1 meter are being crushed to material sizes less than 80 mm.
Pre-blending-The crushed materials pass through an on-line analyzer to determine the pile
composition. A stacker is then used to create different piles of materials and to reduce
variation in material beds.
Raw grinding and blending- A belt conveyor transports the pre-blended piles into
individual bins where a weighing feeder proportions it according to the type of clinker to
be produced. The materials are then ground into the desired fineness by the raw mill
equipment. The powdered raw meal is then transported into a continuous blending storage
silo where variations are further reduced by mixing using aeration.
Burning and clinker cooling - The homogenized raw mix is fed into the pre-heater, a heat
exchange equipment composed of a series of cyclones wherein heat transfer between the
raw mix feed and the counter current hot gases from the kiln take place. Calcination
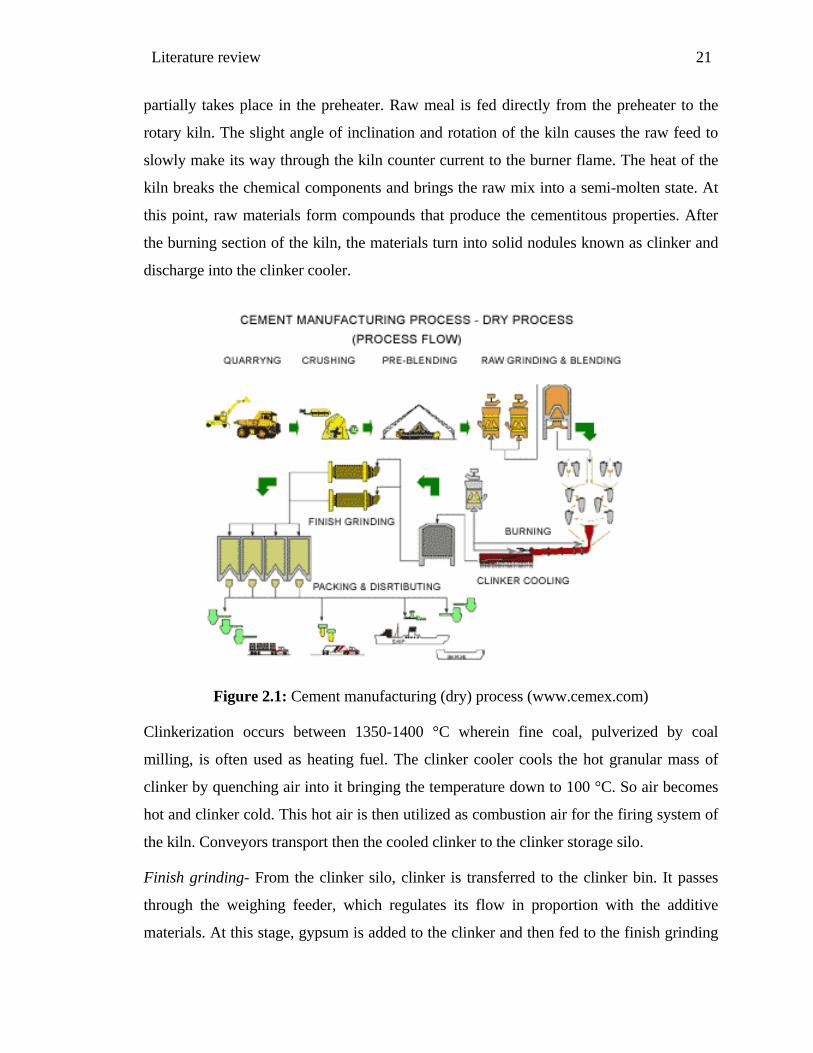
Literature review 21
partially takes place in the preheater. Raw meal is fed directly from the preheater to the
rotary kiln. The slight angle of inclination and rotation of the kiln causes the raw feed to
slowly make its way through the kiln counter current to the burner flame. The heat of the
kiln breaks the chemical components and brings the raw mix into a semi-molten state. At
this point, raw materials form compounds that produce the cementitous properties. After
the burning section of the kiln, the materials turn into solid nodules known as clinker and
discharge into the clinker cooler.
Figure 2.1: Cement manufacturing (dry) process (www.cemex.com)
Clinkerization occurs between 1350-1400 °C wherein fine coal, pulverized by coal
milling, is often used as heating fuel. The clinker cooler cools the hot granular mass of
clinker by quenching air into it bringing the temperature down to 100 °C. So air becomes
hot and clinker cold. This hot air is then utilized as combustion air for the firing system of
the kiln. Conveyors transport then the cooled clinker to the clinker storage silo.
Finish grinding- From the clinker silo, clinker is transferred to the clinker bin. It passes
through the weighing feeder, which regulates its flow in proportion with the additive
materials. At this stage, gypsum is added to the clinker and then fed to the finish grinding

Literature review 22
mills. Gypsum serves as a retarder in the too rapid setting or hardening of cement. Either
the mixture of clinker and gypsum for Type-1 cement or the mixture of clinker, gypsum
and pozzolan material for Type-P cement is pulverized in a closed circuit system in the
finish mills to the desired fineness, usually about 87% minimum passing 325 mesh sieves.
Cement is now piped to cement silos.
Packing and distribution- The cement from the cement silos are packed into bags by
rotary packers or loaded as bulk and are distributed either by land using forwarder trucks
and bulk trucks or by sea using barges or bulk ships.
2.6.3 Sand
Sand is loose material formed of quartz grains such as that of the beaches or dunes. Sand
grains are mostly siliceous; sometimes calcareous or of volcanic origin. Bangladesh is
quite rich in terms of sand and silt deposits. Extraction of sand keeps the river channels
clear for the free flow of water. The following steps are commonly used to process sand
and gravel for construction purposes.
Natural decomposition - Solid rock is broken down into chunks by natural mechanical
forces such as the movement of glaciers, the expansion of water in cracks during freezing,
and the impacts of rocks falling on each other. The chunks of rock are further broken
down into grains by the chemical action of vegetation and rain combined with mechanical
impacts as the progressively smaller particles are carried and worn by wind and water. As
the grains of rock are carried into waterways, some are deposited along the bank, while
others eventually reach the sea, where they may join with fragments of coral or shells to
form beaches. Wind-borne sand may form dunes.
Extraction - Extraction of sand can be as simple as scooping it up from the riverbank with
a rubber-tired vehicle called a front loader. Some sand is excavated from under water
using floating dredges. These dredges have a long boom with a rotating cutter head to
loosen the sand deposits and a suction pipe to suck up the sand. If the sand is extracted
with a front loader, it is then dumped into a truck or train, or placed onto a conveyor belt
for transportation to the nearby processing plant. If the sand is extracted from underwater
with a dredge, the slurry of sand and water is pumped through a pipeline to the plant.

Literature review 23
Figure 2.2: Sand Manufacturing Process (http://www.beneficiationchina.com)
Sorting - In the processing plant, the incoming material is first mixed with water, if it is
not already mixed as part of slurry, and is discharged through a large perforated screen in
the feeder to separate out rocks, lumps of clay, sticks, and other foreign material. If the
material is heavily bound together with clay or soil, it may then pass through a blade mill
which breaks it up into smaller chunks. The material then pass through several / perforated
screens or plates with different hole diameters or openings to separate the particles
according to size. The screens or plates measure up to 10 ft (3.1 m) wide by up to 28 ft
(8.5 m) long and are tilted at an angle of about 20-45 degrees from the horizontal. They
are vibrated to allow the trapped material on each level to work its way off the end of the
screen and onto separate conveyor belts. The coarsest screen, with the largest holes, is on
top, and the screens underneath have progressively smaller holes.
Washing - The material that comes off the coarsest screen is washed in a log washer
before it is further screened. The name for this piece of equipment comes from the early
practice of putting short lengths of wood logs inside a rotating drum filled with sand and
gravel to add to the scrubbing action. A modern log washer consists of a slightly inclined
horizontal trough with slowly rotating blades attached to a shaft that runs down the axis of

Literature review 24
the trough. The blades churn through the material as it passes through the trough to strip
away any remaining clay or soft soil. The larger gravel particles are separated out and
screened into different sizes, while any smaller sand particles that had been attached to the
gravel may be carried back and added to the flow of incoming material. The material that
comes off the intermediate screen(s) may be stored and blended with either the coarser
gravel or the finer sand to make various aggregate mixes. The water and material that pass
through the finest screen is pumped into a horizontal sand classifying tank. As the mixture
flows from one end of the tank to the other, the sand sinks to the bottom where it is
trapped in a series of bins. The larger, heavier sand particles drop out first, followed by the
progressively smaller sand particles, while the lighter silt particles are carried off in the
flow of water. The water and silt are then pumped out of the classifying tank and through a
clarifier where the silt settles to the bottom and is removed. The clear water is recirculated
to the feeder to be used again. The sand is removed from the bins in the bottom of the
classifying tank with rotating dewatering screws that slowly move the sand up the inside
of an inclined cylinder. The differently sized sands are then washed again to remove any
remaining silt and are transported by conveyor belts to stockpiles for storage.
Crushing - Some sand is crushed to produce a specific size or shape that is not available
naturally. The crusher may be a rotating cone type in which the sand falls between an
upper rotating cone and a lower fixed cone that are separated by a very small distance.
Any particles larger than this separation distance are crushed between the heavy metal
cones, and the resulting particles fall out the bottom.
2.6.4 Aggregate
Sandstones and granites are the main two types of aggregates mainly used in Bangladesh.
Granite is an intrusive igneous rock which is widely distributed throughout Earth’s crust at
a range of depths up to 31 mi (50 km). Many variations of granite appear on the
commercial market with white, gray, pink, and red being the most common primary
colors. Sandstone is a very common rock in the geological group-formations of
Bangladesh. Sandstone is often used as building material as blocks in the construction of
large buildings. Very small percentage of aggregates is quarried in Bangladesh.

Literature review 25
Quarrying- Most large commercial quarries produce aggregate as their primary product,
and any large-stone material is a subordinate by-product. The same is true for quarries
producing flux for iron ore reduction. This imbalance must be appreciated when
considering an aggregate or flux-stone quarry as a source of large stone. The production
and stockpiling of large stone usually is constrained rigidly by the production of the
primary product. Occasionally, a separate operation for large stone is established within
the quarry.
Figure 2.3: Secondary crushing plant
for gabbro with cone Crushers Plant
throughput:1000t/h.(www.sbmmp.at)
Figure 2.4: Four vertical shaft impact
crushers with vertical shafts for improving
aggregate shape after cone crushers, material
gabbro and through output 700 ton/h.
(www.sbm-mp.at)
Processing- Some processing is usually necessary to achieve the stone size distribution
required in the specifications. Processing usually involves the removal of oversize and
undersize material at the minimum but may also involve sophisticated means of
separating stone pieces into classes by size. When crushing hard stone, the selection of
the crushers to be used for the individual crushing steps is decisive for the productivity of
the equipment:
• Jaw crushers
• Cone crushers
• Horizontal shaft impact crushers (HSI)
Literature review 26
• Vertical shaft impact crushers (VSI)
Scheduling - The limitations imposed by the scale, methods, and principal product from
blasting and processing frequently impact on the availability of material on schedule.
2.6.5 Steel
Bangladesh imports 70% billets and other raw materials from foreign countries as scrap
ship import had been decreased. Sources of steel products include Australia, Belgium,
Canada, China, France, Germany, Greece, Hongkong, India, Indonesia, Italy, Japan,
Malaysia, Mexico, Netherlands, North Korea, Poland, Russia, Saudi Arabia, Singapore,
South Korea, Turkey, UK and the USA. But the major sources are India and South
Korea. So considering both the sources emission equations are developed. The history of
ship breaking is as nearly old as ship building. Generally 95% of a ships body is made of
mild steel (M.S.), 2% of stainless steel and 3% of miscellaneous metals, such as brass,
aluminium, copper, gun metal and other alloys which are important factors of ship
breaking . No sound technical system is used to recover valuable stores, spares, metals
and other items from the ships.
The main raw material in Billet Manufacturing process is mild steel scrap which is
procured from local and international markets. The scrap is mixed in pre-determined
proportions in the scrap yard and fed to the furnaces in charging buckets and melted by
Electric Arc using Graphite Electrodes. The molten metal is processed to remove the
impurities like sulphur and phosphorous and is subjected to slag off and further refining
by adding Ferro alloys and other fluxes to bring it to the required standard specifications.
Liquid metal samples are analyzed at frequent intervals to ensure quality if the product as
per I.S. The molten steel is tapped at the required temperature to the pre-heated ladles.
Steel ladles are equipped with latest slide gate opening system. Temperature of the
molten metal in the ladle is measured to ensure correct temperature at the continuous
casting machine. Currently, there are two main routes for the production of steel:
production of primary steel using iron ores and scrap and production of secondary steel
using scrap as the main raw material. A wide variety of steel products are produced by
the industry, ranging from slabs and ingots to thin sheets, which are used in turn by a

Literature review 27
large number of manufacturing industries. Steel production requires several steps that can
be accomplished with different processes.
Figure 2.5: Steel manufacturing process in rerolling mills (www.sussex.ac.uk)
Both the input material (Schumacher et al., 1998) of each step and the process
substantially affect the total energy consumed during production. The liquid metal is then
poured from ladle to the tundish and then to the water cooled copper mould on

Literature review 28
continuous casting machine. There takes place the billet formation by solidification of the
molten steel due to water cooling. Billets of 100 mm square coming out of the continuous
casting machine are cut to the required length by gas cutting and are again subjected to
stringent quality inspection and stacked according to color codes specified by BIS. The
Billets are further rolled and converted into constructional steel of various sections at
Rolling Mills.
2.6.6 Timber
Timber denotes structural wood. A study showed that embodied CO2 emissions of timber
were two to three times lower than for the steel or concrete building. Timber is
considered as an important structural member with less carbon footprint. The main source
of timber in Bangladesh is Sundarban .Thus, the life cycle of timber can be considered as
following stages in the figure 2.6.
Figure 2.6: Schematic flow chart of wood materials during the building lifecycle.
2.6.7 Concrete
Concrete is an artificial material obtained by mixing together cementing material, coarse
aggregate, fine aggregate and water. Concrete is a friend of the environment in all stages
of its life span, from raw material production to demolition, making it a natural choice for
sustainable home construction. Concrete can be classified as mud concrete, cement
concrete and lime concrete. Cement concrete is prepared by mixing together cement, sand

Literature review 29
and coarse aggregate. It is a very important structural material and should be carefully
designed, mixed, placed and cured.
Concrete production process:
The processes used vary dramatically, from hand tools to heavy industry, but result in the
concrete being placed where it cures into a final form. Wide range of technological
factors may occur during production of concrete elements and their influence to basic
characteristics may vary. When initially mixed together, Portland cement and water
rapidly form a gel, formed of tangled chains of interlocking crystals. These continue to
react over time, with the initially fluid gel often aiding in placement by improving
workability. As the concrete sets, the chains of crystals join and form a rigid structure,
gluing the aggregate particles in place. During curing, more of the cement reacts with the
residual water called hydration. This curing process develops physical and chemical
properties. Among these qualities are mechanical strength, low moisture permeability and
chemical and volumetric stability.
Mixing concrete- Thorough mixing is essential for the production of uniform, high
quality concrete. For this reason equipment and methods should be capable of
effectively mixing concrete materials containing the largest specified aggregate to
produce uniform mixtures of the lowest slump practical for the work. Separate paste
mixing has shown that the mixing of cement and water into a paste before combining
these materials with aggregates can increase the compressive strength of the resulting
concrete. The paste is generally mixed in a high-speed, shear-type mixer at a w/c (water
to cement ratio) of 0.30 to 0.45 by mass. The cement paste premix may include
admixtures such as accelerators or retarders, super plasticizers, pigments, or silica fume.
The premixed paste is then blended with aggregates and any remaining batch water and
final mixing is completed in conventional concrete mixing equipment.
Workability- Workability is the ability of a fresh (plastic) concrete mix to fill the
form/mold properly with the desired work (vibration) and without reducing the
concrete's quality. Workability depends on water content, aggregate (shape and size
distribution), cementitious content and age (level of hydration) and can be modified by

Literature review 30
adding chemical admixtures, like super plasticizer. Raising the water content or adding
chemical admixtures will increase concrete workability. Excessive water will lead to
increased bleeding (surface water) and/or segregation of aggregates (when the cement
and aggregates start to separate), with the resulting concrete having reduced quality. The
use of an aggregate with an undesirable gradation can result in a very harsh mix design
with a very low slump, which cannot be readily made more workable by addition of
reasonable amounts of water.
Curing-In all but the least critical applications, care needs to be taken to properly cure
concrete, to achieve best strength and hardness. This happens after the concrete has been
placed. Cement requires a moist, controlled environment to gain strength and harden
fully. The cement paste hardens over time, initially setting and becoming rigid though
very weak and gaining in strength in the weeks following.
Considering these phases of manufacturing procedures equations of life cycle CO2 and
energy cost has been developed in the next chapter.

31 Methodology
CHAPTER 3
METHODOLOGY
________________________________________________________________________
3.1 GENERAL
For this study, data has been collected from the secondary resources of public domain,
including journal articles, life cycle assessments, books, websites, conference papers, field
data etc. All the information has been used considering perspective of Bangladesh. Cradle
to gate has been the most common boundary condition although for some material, like
brick, timber etc study has been also continued for cradle to grave. For some recyclable
materials like steel; from both billet and scrap, total life cycle emission term has been used
other than the boundary condition cradle to grave. Uncertainty is unfortunately a part of
CO2 analysis and even the most reliable data carries a natural level of uncertainty.
3.2 METHODOLOGY OF DEVELOPING EQUATIONS OF LIFE CYCLE
CO2 EMISSION AND ENERGY COST OF BUILDING MATERIALS
The life cycle CO2 emission and energy cost equations have been developed for seven
most widely used construction materials of Bangladesh namely brick, cement, sand, steel;
both from billet and scrap, stone chips, timber and concrete. The total life cycle of the
materials has been considered from perspective of Bangladesh. For example; aggregates
are mainly processed in Bangladesh though very small amount can be quarried. Equations
have been developed for both cases. The carbon coefficients selected for the study has
been representative of typical materials employed in the Bangladeshi market. In order to
ensure that this data have been representative of typical products, taking timber as an
example; the consumption of most common types of timber was applied to estimate a
single ‘representative’ value that can be used in the absence of more detailed knowledge
of the specific type of timber.
3.2.1 Selection Criteria
The criteria needed to be flexible but maintain an ideal set of conditions due to the
difficulties that have been experienced in selecting emission values. Six criteria have been

Methodology 32
applied for the selection of CO2 emission values for individual materials. This ensures the
consistency of the data. They are given below.
• Compliance with approved methodologies
Preference has been given to data sources that complied with accepted methodologies and
manufacturing procedure. For example, about 90% of the brick fields use manual molding,
drying procedures. In this case, mechanical operations have not been considered.
• System boundaries
The system boundary has been adopted mainly as ‘cradle to gate’, but in case of some
materials ‘cradle to grave’ has been considered. Construction phase and demolition phase
have been taken into consideration. Steel is recycled as raw material after use in building.
In this case the term ‘total life cycle emission’ has been used other than cradle to get or
cradle to grave. For component materials like sand, aggregate and cement which will be
finally incorporated into concrete, cradle to gate emissions have been considered.
• Origin of data
Ideally the data used and the equations developed would have been restricted to that
emanating from Bangladesh. In case of some materials it has not been feasible due to lack
of available data and study. Data of CO2 emission from manufacturing process,
construction equipments etc from foreign sources have been considered only if the same
procedures are followed in Bangladesh. For energy cost calculations, life cycle of each of
the materials has been broken down in several phases in which energy has been consumed.
Each of the phases has been again broken down in to more specific forms for ease of
calculation. Primary fuel and input energy have only been considered. Loss of energy and
transfer of energy has not been considered. Coal, diesel, natural gas, electricity etc has
been considered as the sources of energy and conversion factors have been used to convert
the energy data in to cost.
• Age of data sources
Preference has been given to modern sources of data. Historical changes in fuel mix and
carbon coefficients associated with electricity generation give rise to greater uncertainty in
the carbon dioxide emission values.

Methodology 33
• Operating CO2 emission
In this study, operating CO2 emission of building material, thermal conductivity and
diffusivity has not been considered. No of times the material has been recycled do not
have any significant impact on CO2 emission calculation.
• Carbon dioxide emission factors
Petro chemicals as fuels have been considered for number of manufacturing process of
materials. In case of developing CO2 emission equations, the fuel consumption has been
converted to CO2 emission values by using CO2 emission factors. Emission factors have
been used from unit conversion fact sheet by MIT (2007) and Guidance for Voluntary,
Corporate Greenhouse Gas Reporting: Data by New Zealand (Fuel combustion emission
factors 2008). In addition to these selection criteria the data primarily focused on
construction materials.
In case of energy cost equation, several conversion methodologies have been adopted.
CO2 emission from fuel consumption has been calculated for several materials. In this
case CO2 emission has been converted to fuel consumption units by using CO2 emission
factors. Emission factors have been used from unit conversion fact sheet by MIT (2007)
and Guidance for Voluntary, Corporate Greenhouse Gas Reporting: Data by New
Zealand: Fuel combustion emission factors 2008 from table 1 of appendix A. In some
cases energy data has been converted to cost. Again due to lack of sufficient data energy
cost has been calculated using the fuel consumption of the particular machineries used in
production of the materials for the required unit.
3.2.2 Mode of Material Transport
In most of the previous researches of life cycle CO2 emission of construction materials the
boundary conditions were cradle to site. This was based on the assumption that in many
cases transport from the factory gate to construction site would be negligible (Cole et
al.1996). Whilst this may be true for many materials but this is not exclusively the case. In
the case of materials which have very low carbon dioxide emissions from their processing
such as sand and aggregate, emission from transportation is likely to be significant. For
these reasons the ideal boundaries have been modified to cradle to gate from the previous

Methodology 34
cradle to site. This decision will also encourage the user to be transport specific to their
case in hand. In these study two types of transportation has been considered. They are -
− Shipment of materials ( for steel billets)
− Transportation by road of raw materials and products within the country.
Emission from transportation has been used from the chart of Swedish Network for
Transport and the Environment (Maersk Line 2007) which gives emission of carbon
dioxide directly for mode of transportation. In case of shipment distance, nautical miles
(http://www.searates.com/reference/portdistance/) have been converted into miles to
calculate emission from shipment. Bangladesh imports raw materials from a number of
countries. In this case, maximum and minimum distances for raw material import have
been selected considering local market survey to give representative values.
3.2.3 Functional unit
Empirical equations have been developed which required input values in desired unit. It is
inappropriate to consider material solely on kilogram basis. Material must be represented
on their functional unit basis. For example, cement is represented in tons, sand in kilogram
(kg), bricks in single unit etc. The manufacture of 1 kg of product requires raw materials
more than 1 kg. The quantity of waste, volume decrease, shrinkage etc has been
considered in this study. The impacts of maintenance on life cycle emission of materials
have not been considered. Highly fabricated and intricate items require manufacturing
operations that are beyond the boundaries of the study. As the energy cost equations give
the cost of input energy in context of Bangladesh, Bangladeshi currency taka (BDT) has
been considered.

35 Methodology
CHAPTER 4
DEVELOPMENT OF LIFE CYCLE CO2 EMISSION AND ENERGY
COST EQUATIONS
________________________________________________________________________
4.1 GENERAL
In this chapter, empirical equations of life cycle CO2 emission and energy cost have been
developed considering the methodology adopted in chapter 3. The equations have been
developed for seven most widely used construction materials of construction industry of
Bangladesh and described in the following articles.
4.2 LIFE CYCLE CO2 EMISSION EQUATIONS OF MATERIALS
Life Cycle CO2 emission equations have been developed for brick, cement, steel from
billet and steel from scrap, aggregates, timber, sand and concrete. The materials are
categorized in two groups. First group comprises of brick, steel from scrap, locally
produced cement, aggregates, timber, sand and concrete which are produced within our
country. Second group consist of the materials for which raw materials are imported from
other countries such as cement clinker and steel billet.
4.2.1 Brick Profile
In aggregate starved Bangladesh, fired clay bricks form a significant portion of the
materials used in the construction industry. Brick making is considered to be the largest
contributor to green house gas emissions in Bangladesh in the order of 3.0 million tones of
CO2 emissions annually (World Green Building Council 2006). Currently, the brick
making sector in Bangladesh uses four types of technologies: Fixed Chimney Kilns
(FCK), Bull’s Trench Kilns (BTK), Zigzag Kilns and traditional Hoffman Kilns.
Prior to 2004, of the kilns in Bangladesh used the BTK design, a relatively primitive
design that is over 150 years old. After promulgation of the Brick Burning (Control) Act
in 2004, almost all of the BTKs have been converted to FCKs (UNFCC 2008). Stages
considered for brick have been - clay extraction, clay delivery to brick plant, mixing and
shaping, drying and burning, transportation, installation in site, recycling as brick chips

Development of life cycle CO2 emission and energy cost equations 36
and reuse. As fixed chimney kilns are majority according to table 4.1, for drying and
burning of bricks, emission data of FCK kiln has been used. In FCK kiln coal is mainly
considered as energy input (UNFCC 2008).
Table 4.1: Current market share of technologies in the brick making sector.
Source: Improving Kiln Efficiency for the Brick Making Industry - PDF B Phase (UNDP-GEF-
BGD/04/014)
Hence calculations can be summarized as
Stage: Drying and burning of bricks
Energy input: Coal
Emission of CO2 from FCK kiln: 760.49 ton per 20, 00,000 bricks
(Improving kiln efficiency, 2006).
Emission per brick: 380.25 gCO2/brick
Equations have been developed for a single brick as functional unit and both the boundary
conditions i.e. cradle to gate and cradle to grave. In all calculations, standard brick
dimension i.e. 9.5″x 4.5″x 2.75″ given by Public works department (PWD) Bangladesh
has been considered.
For transportation of brick heavy truck has been considered. From table A5 of appendix A
CO2 emission for this type of vehicle has been found as 50 g CO2/ton-km.
Hence, CO2 emission for heavy truck: 50 g CO2/ton-km (Maersk line, 2007)
Volume of one brick: 0.07 cft (considering PWD standard brick dimension)
Density of brick: 120 lb /cft or 0.06 ton /cft (common red brick)
1 brick = 0.07 x 0.06 = 0.0042 ton
Kiln type
Number Percentage of total
Annual brick production (billions)
Percentage of total production
FCK 3,138 76 6,276 75.9 BTK 797 19 1.59 19.3 Zigzag 198 5 0.40 4.79 Total 4,133 100 8.27 100
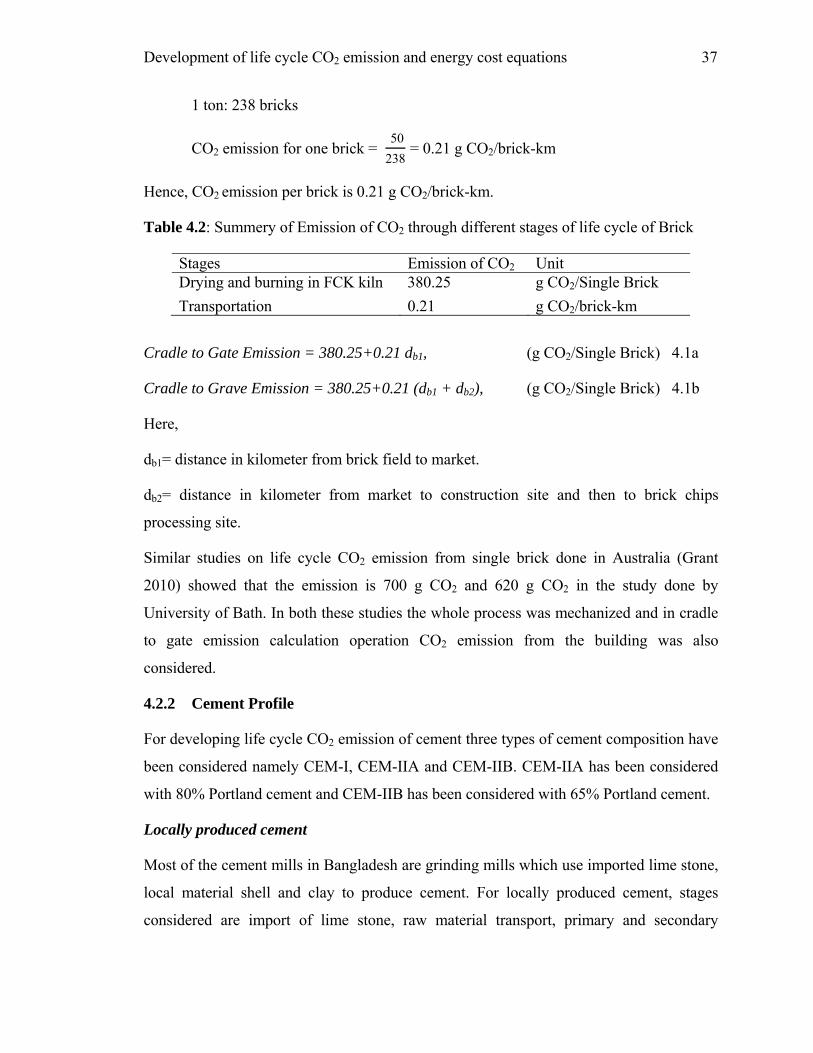
Development of life cycle CO2 emission and energy cost equations 37
1 ton: 238 bricks
CO2 emission for one brick = 50238
= 0.21 g CO2/brick-km
Hence, CO2 emission per brick is 0.21 g CO2/brick-km.
Table 4.2: Summery of Emission of CO2 through different stages of life cycle of Brick
Stages Emission of CO2 Unit Drying and burning in FCK kiln 380.25 g CO2/Single Brick Transportation 0.21 g CO2/brick-km
Cradle to Gate Emission = 380.25+0.21 db1, (g CO2/Single Brick) 4.1a
Cradle to Grave Emission = 380.25+0.21 (db1 + db2), (g CO2/Single Brick) 4.1b
Here,
db1= distance in kilometer from brick field to market.
db2= distance in kilometer from market to construction site and then to brick chips
processing site.
Similar studies on life cycle CO2 emission from single brick done in Australia (Grant
2010) showed that the emission is 700 g CO2 and 620 g CO2 in the study done by
University of Bath. In both these studies the whole process was mechanized and in cradle
to gate emission calculation operation CO2 emission from the building was also
considered.
4.2.2 Cement Profile
For developing life cycle CO2 emission of cement three types of cement composition have
been considered namely CEM-I, CEM-IIA and CEM-IIB. CEM-IIA has been considered
with 80% Portland cement and CEM-IIB has been considered with 65% Portland cement.
Locally produced cement
Most of the cement mills in Bangladesh are grinding mills which use imported lime stone,
local material shell and clay to produce cement. For locally produced cement, stages
considered are import of lime stone, raw material transport, primary and secondary
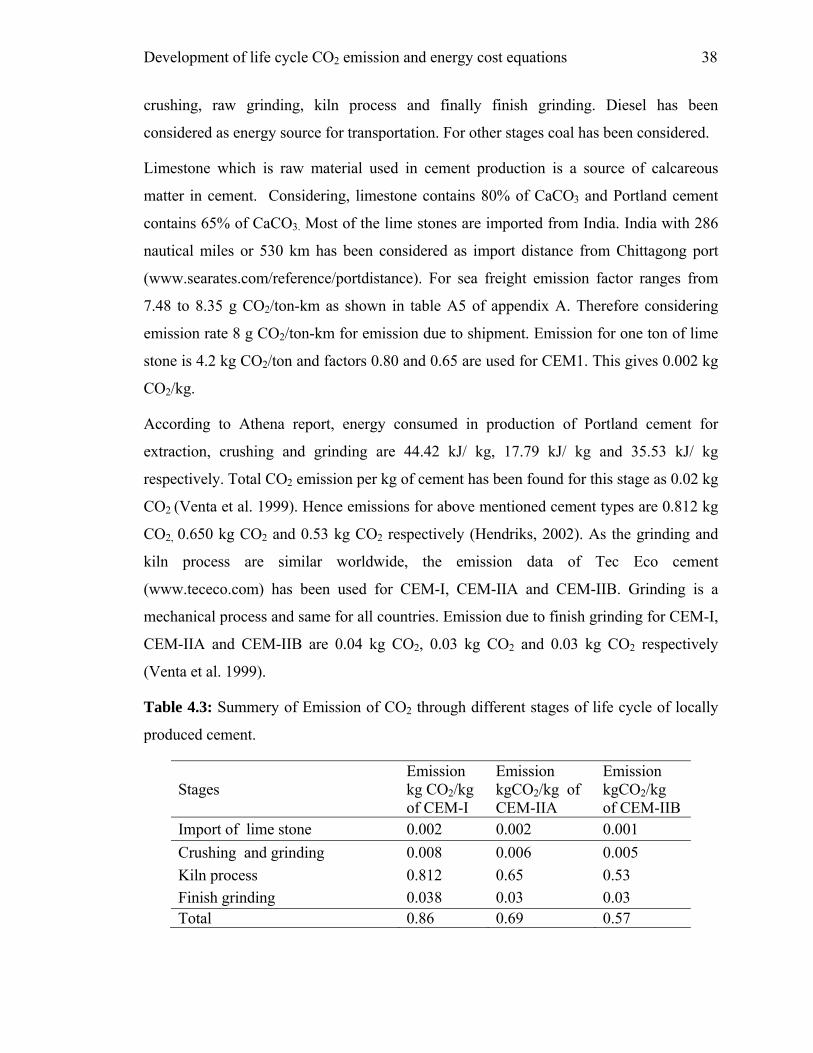
Development of life cycle CO2 emission and energy cost equations 38
crushing, raw grinding, kiln process and finally finish grinding. Diesel has been
considered as energy source for transportation. For other stages coal has been considered.
Limestone which is raw material used in cement production is a source of calcareous
matter in cement. Considering, limestone contains 80% of CaCO3 and Portland cement
contains 65% of CaCO3. Most of the lime stones are imported from India. India with 286
nautical miles or 530 km has been considered as import distance from Chittagong port
(www.searates.com/reference/portdistance). For sea freight emission factor ranges from
7.48 to 8.35 g CO2/ton-km as shown in table A5 of appendix A. Therefore considering
emission rate 8 g CO2/ton-km for emission due to shipment. Emission for one ton of lime
stone is 4.2 kg CO2/ton and factors 0.80 and 0.65 are used for CEM1. This gives 0.002 kg
CO2/kg.
According to Athena report, energy consumed in production of Portland cement for
extraction, crushing and grinding are 44.42 kJ/ kg, 17.79 kJ/ kg and 35.53 kJ/ kg
respectively. Total CO2 emission per kg of cement has been found for this stage as 0.02 kg
CO2 (Venta et al. 1999). Hence emissions for above mentioned cement types are 0.812 kg
CO2, 0.650 kg CO2 and 0.53 kg CO2 respectively (Hendriks, 2002). As the grinding and
kiln process are similar worldwide, the emission data of Tec Eco cement
(www.tececo.com) has been used for CEM-I, CEM-IIA and CEM-IIB. Grinding is a
mechanical process and same for all countries. Emission due to finish grinding for CEM-I,
CEM-IIA and CEM-IIB are 0.04 kg CO2, 0.03 kg CO2 and 0.03 kg CO2 respectively
(Venta et al. 1999).
Table 4.3: Summery of Emission of CO2 through different stages of life cycle of locally
produced cement.
Stages Emission kg CO2/kg of CEM-I
Emission kgCO2/kg of CEM-IIA
Emission kgCO2/kg of CEM-IIB
Import of lime stone 0.002 0.002 0.001 Crushing and grinding 0.008 0.006 0.005 Kiln process 0.812 0.65 0.53 Finish grinding 0.038 0.03 0.03 Total 0.86 0.69 0.57

Development of life cycle CO2 emission and energy cost equations 39
For transportation diesel powered heavy truck has been considered. From table A5 of
Appendix A, for transporting 1 ton freight per kilometer distance, emission of CO2 is 50 g
(Maersk line, 2007) or 0.05 kg CO2 /ton-km.
Life cycle CO2 emission equations have been developed for one ton of cement with cradle
to gate boundary condition.
Cradle to Gate Emission
CEM- I = 860 + 0.05 dc, (kg CO2/ton) 4.2 a
CEM-IIA = 690 + 0.05 dc, (kg CO2/ton) 4.2 b
CEM-IIB = 570 + 0.05 dc, (kg CO2/ton) 4.2 c
Here,
c = total distance in kilometer from cement factory to market
Cement from imported clinker
Again most of the cement factories of Bangladesh are the grinding mills. In this imported
clinker is used. Energy required for finish grinding is 194.51kJ/kg. Emission is 0.018 kg
CO2/kg. Clinkers are considered to be imported from India. For sea freight emission factor
ranges from 7.48 to 8.35 g CO2/ton-km as shown in table A5 of appendix A. Therefore
considering emission rate 8 g CO2/ton-km for emission due to shipment. Emission for one
ton of clinker is 4.2 kg CO2/ton. CEM-IIA has been considered with 80% Portland cement
and CEM-IIB has been considered with 65% Portland cement.
Table 4.4: Summery of Emission of CO2 through different stages of life cycle of cement
from imported clinker.
Stages Emission rate CEM-I kg CO2/ton
CEM-IIA kgCO2/ton
CEM-IIB kgCO2/ton
Import of clinker 0.008 kgCO2/ton-km 4.2 3.36 2.73
Finish grinding 18 kgCO2/ton 18 14.3 11.7 transportation 50 g/ton-km

Development of life cycle CO2 emission and energy cost equations 40
Cradle to Gate Emission
CEM- I = 22+ 0.05 dc, (kg CO2/ton) 4.2 c
CEM-IIA = 17.6 + 0.05 dc, (kg CO2/ton) 4.2 d
CEM-IIB = 14.3 + 0.05 dc, (kg CO2/ton) 4.2 e
According to University of bath, CO2 emission from Portland cement was found to be 830
kg CO2/ton; whereas CO2 emission from cement with 26% fly ash was 620 kg CO2/ton
and 50% fly ash was 420 kg CO2/ton (Hammond et al. 2008).
4.2.3 Steel Profile
Bangladesh imports 70% billets and other raw materials from foreign countries
(www.secbd.org/Prospectus_BSRMS.pdf) as scrap ship import had been decreased.
Sources of steel products include Australia, Belgium, Canada, China, France, Germany,
Greece, Hong Kong, India, Indonesia, Italy, Japan, Malaysia, Mexico, Netherlands, North
Korea, Poland, Russia, Saudi Arabia, Singapore, South Korea, Turkey, UK and the USA.
But the major sources are India and South Korea. So considering both the sources
emission equations have been developed.
From Billet
In developing life cycle CO2 emission equation for steel from billet, import of billet has
been considered as cradle, where the life cycle has been considered to be started. The
major stages considered are Shipment of billet, rerolling process (Das et al. 1997), erection
considering use of crane and welding, and transportation. As steel has recycling potential
the term total life cycle CO2 emission has been used along with the term cradle to gate. For
cradle to gate criteria stages considered have been shipment of billet, rerolling process and
transportation. Separate equations of minimum and maximum values of CO2 emission are
given for minimum and maximum shipment distance respectively. South Korea with a
distance of 3976 nautical miles or 7364 km has been considered as maximum import
distance and India with 286 nautical miles or 530 km has been considered as minimum
import distance from Chittagong port (www.searates.com/reference/portdistance). For sea
freight emission factor ranges from 7.48 to 8.35 g CO2/ton-km as shown in table A5 of

Development of life cycle CO2 emission and energy cost equations 41
appendix A. therefore considering emission rate 8 g CO2/ton-km for emission due to
shipment.
Equations have been developed for one ton of steel billet. As billets are imported to
Bangladesh, manufacturing process starts from rerolling process to cast steel into desired
shapes. Steel is highly resistant to shaping while cold and whatever may be the product
hot rolling process is the same. Rolls are driven by powerful electric motors. For hot
rolling process Coal and electricity is used as input energy. It involves 1.82 GJ/ton for coal
and 0.37 GJ/ton for electricity. Conversion factor 0.074 tCO2/GJ and 0.271 tCO2/ GJ have
been taken from table A4 of Appendix A.
Table 4.5: Summery of Emission of CO2 through different stages of life cycle of Billet
Phases Emission rate Emission kg CO2/ton
Import of billet
• From south Korea, distance -7364 km 0.008 kgCO2 /ton-km 60
• From India, distance -530 km 0.008 kgCO2 /ton-km 4.2 Hot rolling process
• Emission (coal) - 1.82 GJ/ton 0.074 tCO2/GJ 130
• Emission (electricity) - 0.37 GJ/ton 0.271 tCO2/GJ 100
Transportation 50 g CO2/ton-km
Total Emission (max) = 60 + 230 = 290 kg CO2/ton
Total Emission (min) = 4.2 + 230 = 234 kg CO2/ton
CO2 emission by diesel powered heavy truck due to transportation is same as article 4.2.2.
Hence, emission equations are,
Cradle to gate (min) = 234+0. 05 dst1 (kg CO2/ton) 4.3 a
Cradle to gate (max) = 290+0.05 dst1 (kg CO2/ton) 4.3 b
Here,
dst1= total distance in kilometer from port to rerolling mills and rerolling mills to market.

Development of life cycle CO2 emission and energy cost equations 42
As the steel elements such as bean, column etc are taken to the construction site emission
of CO2 occur during erection, crane operation and welding of the steel elements.
QTZ50 model tower crane has been considered for fuel consumption and operation
specification (http://www.cranescn.com/). According to the specification given in
Appendix B, this crane has jib length of 50 meter, height 37.5/33 meter ,tip load 0.9-1 ton
and max load of 4 ton. Considering hoisting capacity 9 meter per minute with capacity 2
ton and energy used is 4 kW, 9 meter of hoisting requires energy 120 kWh per ton.
Therefore, emission of CO2 for hoisting is calculated as 8.1 kg CO2 /ton-m.
(http://web.mit.edu/mit_energy). For derricking, with 2 ton capacity and 50 meter jib
length, one meter of derricking requires energy 1.69 kWh per ton-m. Therefore emission
for derricking is 1.03 kg CO2 /ton-m. Considering electric arc welding each square meter
of welding emits 0.04 kg CO2 (www.izumi-mfg.co.jp/english/outline.html).
Table 4.6: Emission of CO2 during construction with steel members made from Billet
Operation Emission rate Crane operation
• Hoisting 8.1 kgCO2/ton-m • Derricking 1.03 kgCO2/ton-m
Welding 0.04 kgCO2/m2
At the end of the operational period of the structure the steel elements are again taken to
the rerolling mill for recycling and the system continues. Hence, considering all the stages
starting from shipment of the billets and neglecting emission during the useful life of the
building life cycle CO2 emission has been calculated.
Total life cycle emission (min)
= 234+ 0.05 (dst1+dst2) + 8.1h + 1.03L + 0.04 AW
(kgCO2/ton) 4.3 c
Total life cycle emission (max) =
290 + 0.05 (dst1+dst2) + 8.1h + 1.03L + 0.04 (kgCO2/ton) 4.3 d
Here,
dst2= distance in kilometer from market to construction site.

Development of life cycle CO2 emission and energy cost equations 43
A = total area of weld for connection in square meter.
W = total weight of steel member and plates required to be weld in ton.
h = hoisting height of the crane in meter for one ton of steel element transfer.
L = derricking length of the crane in meter for one ton of steel element transfer.
From Scrap
The history of ship breaking is as nearly old as ship building. At present ship-breaking is
conducted by 20 Ship breaking yards in an area of about 8 km2 starting from a point near
Baro Awlia under police station, Sitakundu of Chittagong (Rahman et al.1999). All the
yards are located on the beach of the Bay of Bengal. There are 20 Ship breaking yards at
present in Kattoly-Kumira ship breaking areas (Rahman et al.1999). Generally 95% of a
ships body is made of mild steel (M.S.), 2% of stainless steel and 3% of miscellaneous
metals, such as brass, aluminium, copper, gun metal and other alloys which are important
factors of ship breaking . No sound technical system is used to recover valuable stores,
spares, metals and other items from the ships.
Thus, the main stages considered for steel produced from scrap are cutting procedure of
ship in ship breaking, rerolling process i.e. scrap melting and rerolling , use of crane and
welding in erection of steel member in building and transportation of steel into rerolling
mill and construction site. As steel has recycling potential along with the term cradle to
gate, total life cycle CO2 emission has been used. For cradle to gate criteria stages
considered has been ship breaking and rerolling process.
According to Gratsos (2005), Emission of CO2 in ship breaking activities involves cutting
of steel plates, of weight equal to the lightship. Data from specialized Greek repair
companies (e.g. NAVEP Ltd) indicate that cutting one ton of steel uses some 60 kg of
liquid propane (C3H8). That produces exactly 3 times as much CO2 in weight; therefore
the CO2 factor for cutting can be estimated to be 0.18 per ton of steel cut (Kameyama et al,
2004). Emission factor 2.96 from table A1of Appendix A has been used to calculate CO2
emission. In this factor emissions due to remelting the recycled steel are not taken into
account. For scrap melting electric arc furnace has been considered (Das and Kandpal)
with fuel energy consumed as 0.79 GJ/ton and electric energy 1.52 GJ/ton. Using

Development of life cycle CO2 emission and energy cost equations 44
conversion factors from table A3 of Appendix 1, CO2 emission has been calculated as
given in table 4.7.
Table 4.7: Emission of CO2 in different stages of life cycle of steel from scrap.
Stages Emission data Conversion factor Emission ton CO2/ton steel
Steel cut in ship breaking 60 kg LPG /ton of steel
2.96 kg CO2/kg of LPG 0.18
Scrap melting in electric arc furnace (EAF)
0.79 GJ/ton (coal)
0.074 ton CO2/GJ 0.06
1.52 GJ/ton (electricity)
0.271 ton CO2/GJ 0.41
Hot rolling 1.82 GJ/ton (coal)
0.095 ton CO2/GJ 0.17
0.37 GJ/ton (electricity)
0.271 ton CO2/GJ 0.10
Total 0.92
For transportation same considerations has been taken as article 4.4.2.
Cradle to gate = 920 + 0.05 dst1 (kgCO2/ton) 4.4a
Considering CO2 emission from crane operation and welding per ton of steel same as table
4.5.
Total life cycle emission =
920 + 0.05 (dst1+dst2) + 8.1h + 1.03L + 0.04 (kgCO2/ton) 4.4b
4.2.4 Sand Profile
Sand is loose material formed of quartz grains such as that of the beaches or dunes. Sand
grains are mostly siliceous; sometimes calcareous or of volcanic origin. Bangladesh is
quite rich in terms of sand and silt deposits. Extraction of sand keeps the river channels
clear for the free flow of water. Thus, the stages considered for life cycle CO2 emission of
sand are extraction by dredging, sand screening, transportation to construction site or
market. For calculation of CO2 emission form sand extraction and screening the
mechanical capacity of dredger and sand screening machine available in Bangladesh has
been considered. 1200 m3/hr capacity sand dredger and rotary screener with 1500 mm

Development of life cycle CO2 emission and energy cost equations 45
diameter have been considered (www.ecplaza.net) specifications of the dredger and
screener have been given in appendix B.
For 1200 m3/hr dredger,
Fuel consumption = 282 kg diesel = 331.76 liter diesel
(Density of diesel =0.85 kg/l)
331 liter diesel have suction capacity = 1200 m3 sand = 2304 ton sand
(Considering wet density of the sand as 1920 kg/m3)
1 ton sand =0.14 liter diesel.
For sand screening,
Output of the screener is 10 m3/ hr with power 3 kW.
Hence, considering unit weight of dry sand = 1600 kg /m3
Screening rate =3.33 m3/kWh or 5.3 ton/kWh
Electricity consumption = 0.19 kWh per ton of sand.
The fuel consumption capacity of the dredger and the mechanical capacity of the screener
were converted into CO2 emission with the conversion factor 1.34 lb/kWh
(http://web.mit.edu/mit_energy) for screener and 2.64 kg CO2/liter for sand dredger from
table A1 Appendix A.
Table 4.8: Emission of CO2 in different stages of life cycle of sand.
Stages Available data from calculation
Conversion factor
Emission kg CO2/ton
Sand extraction 0.14 liter diesel /ton of sand
2.64 kg CO2/liter 0.379
Sand screening 0.19 kWh electricity /ton of sand
1.34 lb /kWh 0.12
total 0.50
For transportation same considerations has been taken as article 4.2.2.
The boundary condition for sand has been set to cradle to gate.

Development of life cycle CO2 emission and energy cost equations 46
Cradle to gate emission = 0.50+0.05 ds (kg CO2/ ton) 4.5
Here, ds = total distance in km from sand processing unit to market
Aggregate Profile
Sandstones and granites are the main two types of aggregates mainly used in Bangladesh.
Granite is an intrusive igneous rock which is widely distributed throughout Earth’s crust at
a range of depths up to 31 miles (50 km). Many variations of granite appear on the
commercial market with white, gray, pink, and red being the most common primary
colors. Sandstone is a very common rock in the geological group-formations of
Bangladesh. Sandstone is often used as building material as blocks in the construction of
large buildings.
Very small percentage of aggregates is quarried in Bangladesh. Stages considered for this
study are mining and processing of aggregates, transport to market and construction site.
Most of aggregate manufacturing units are processing units. Equations have been
developed for two different life cycles, one starting from mining and the other starting
from processing for both sandstone and granite. Total life cycle emission of aggregates has
been calculated in two distinct phases. First phase starting from extraction or processing to
transportation to market, prior to use in building where the second phase starting from
the segregation of aggregates from concrete after their effective life used in building; also
considering reuse and disposal in landfill. As crushing is considered in life cycle of
concrete so it has not been included in life cycle of aggregates. Blasting is the common
procedure for mining. Hence the research data of SISTech (Crishna et al.2010) regarding
carbon emissions at each stage in the extraction, processing have been used in developing
equation.
Cradle to gate CO2 emission equations of aggregates have been developed considering
extraction and processing of granite and sandstone according to data provided by the
natural stone specialists (Crishna et al 2010). It is important to note that the estimates of
embodied carbon of imported stone presented in that study were conservative as they
assumed the simplest, shortest scenarios and routes from source to use. One of the

Development of life cycle CO2 emission and energy cost equations 47
assumptions was that the stone was processed at the same place as it is quarried. The
largest component of each stone footprint is attributable to the processing stage of the life
cycle, mostly due to the different stages of processing namely primary processing,
secondary processing, finishing etc. Results of the study gave CO2 emission in extraction
phase is 20 gCO2/ kg of stone and for processing is 70 gCO2/ kg. For sand stone the
amount of CO2 released are 10 gCO2 /kg and 55 gCO2/ kg respectively.
For transportation same considerations has been taken as article 4.2.2.
Cradle to Gate:
Granite (only processing) = 70 + 0.05 da (gCO2/kg) 4.6a
Granite (mining + processing) = 90 + 0.05 da (g CO2/kg) 4.6b
Sandstone (only processing) = 55 + 0.05 da (g CO2/kg) 4.6c
Sandstone (mining + processing) = 65+ 0.05 da (g CO2/kg) 4.6d
Hence, considering transportation to disposal site the cradle to grave equations can be
developed.
Life Cycle CO2 Emission:
Granite (only processing) =70 + 0.05(da + dad) (g CO2/kg) 4.7a
Granite (mining + processing) = 90 + 0.05 (da+ dad) (g CO2/kg) 4.7b
Sandstone (only processing) = 55 + 0.05 (da + dad) (g CO2/kg) 4.7c
Sandstone (mining + processing) = 65+ 0.05 (da + dad) (g CO2/kg) 4.7d
Here,
da = total distance in kilometer from processing unit to market .
dad = distance in kilometer from construction site to disposal site.
4.2.5 Timber profile
Timber denotes structural wood. A study (Page 2006) showed that embodied CO2
emissions of timber were two to three times lower than for the steel or concrete building.
Timber is considered as an important structural member with less carbon footprint. The

Development of life cycle CO2 emission and energy cost equations 48
main source of timber in Bangladesh is Sundarban. In developing equation of life cycle
CO2 emission of timber, stages considered are felling of tree with chain saw,
transportation from forest to wood processing unit, natural seasoning, wood processing in
saw mill, demolition and transportation.
Equations have been developed considering trees with log diameter 10-18 inch. Felling of
trees involves cutting of trees with chain saw. For this study, craftsman 4 horsepower
capacity and 18 inch blade size chain saw has been considered (www.sears.com).
According to available data this saw can cut about 15 trees in 4 hour of above mentioned
specification. Therefore energy required is 0.20 kWh /tree.
For transportation, diesel powered heavy truck has been considered with CO2 emission 50
g/ton –km from table A5 of Appendix A. Considering teak as the timber with density 880
kg /m3 for door and window. Therefore,
CO2 emission for transportation = 50 g/ton-km
Density of timber = 880 kg /m3
1 ton timber = 40 cft
CO2 emission = = 1.25 g/cft- km
For wood processing in Saw mill, field data has been considered which gives
approximately 70-80 cft of wood are sliced everyday considering eight working hours per
day and diesel consumption in saw mill is 1 liter per hour. Hence, approximately 0.106
liter of diesel is required for sawing 1 cft of timber. Therefore emission has been
calculated using conversion factor 2.64 kg CO2/ liter from table A1 of appendix A.
Table 4.9: Emission of CO2 in different stages of life cycle of timber
Stages Available data Conversion factor
Emission of CO2
Cutting of trees Electricity consumption 0.20 kWh/tree
1.34 lb/kWh 0.12 kgCO2/tree
Transportation of timber
1 ton timber = 40 cft 50 g/ton –km 0.0013 kg/cft-km
Wood processing Diesel used = 0.11 liter / cft 2.64 kg CO2/liter 0.28 kgCO2/cft Burning of wood Density of timber = 880 kg /m3
1.9 g CO2/g timber burnt
47.5 kgCO2/cft

Development of life cycle CO2 emission and energy cost equations 49
As natural seasoning is considered for the study there has been no energy cost. Equations
have been developed considering trees with log diameter 10-18 inch. As timber has
recycling potential it can be used number of times. After the demolition of the building
where timber was incorporated for the first time it can be used for land filling or it may be
burnt for cooking depending on the condition of the timber. Considering burning of timber
as the demolition criteria cradle to grave equation has been developed. Carbon dioxide
released when burning wood is about 1900g CO2 for each 1000 g of wood burnt
(http://transitionculture.org/wp-content/uploads/wood-pile.jpg).
Cradle to Gate Emission = 0.12 + (0.280+0.0013 d t1); (kg CO2/cft) 3.8a
Cradle to Grave Emission = 0.12 + 47.5+0.0013(d t1+d t2); (kg CO2/cft) 3.8b
Here,
t = no of trees cut
dt1= distance in kilometer from wood to saw mill and market.
dt2= distance in kilometer from market to construction site and construction site to disposal
site.
V= volume of timber cut in cubic feet.
4.2.6 Concrete Profile
Concrete is an artificial material obtained by mixing together cementing material, coarse
aggregate, fine aggregate and water. In this study stone chips have been considered as
coarse aggregate, CEM-I,CEMII A and CEM II B has been considered as cement types
and CO2 emission equations has been developed for three different mixing ratios. The
ratios are 1:2:4 with water cement ratio (w/c) 0.5, 1:3:6 with water cement ratio 0.65 and
1:1.5:3 with water cement ratio 0.45. The concrete mixes have been designed by absolute
volume basis (Singh et al.2005) and emission equations have been developed for one
cubic feet of concrete. The cradle to gate CO2 emission equations of the component
materials such as cement, sand and stone chips have been considered to develop the
equations of concrete. Emission of CO2 in mixing of component materials and due to

Development of life cycle CO2 emission and energy cost equations 50
casting of concrete has been considered. Concrete mixer of model JZC 350A
(www.ecplaza.net) driven by electricity has been considered for mixing. TMV28 model
vibrator (www.ecplaza.net) with rate of concrete placement 352.8 cft per hour has been
considered. Detail description of the product is given in appendix B.
For mixing of materials,
Rate of concrete placement =10 m3/hr
Concrete (less than 80 mm slump) = 352.8 cft /hr
= 0.0028 hr /cft
= 0.016 kWh /cft
= 0.0095 kg CO2/cft
Emission factor has been taken as 1.34 lb/ kWh (http://web.mit.edu/mit_energy).
For mixing ratio 1:2:4 and water- cement ratio 0.5 using CEMI, designing for 1 bag of
cement by absolute volume basis.
Cement = 0.02 m3 = 0.05 ton
Sand = 0.042 m3 = 67.2 kg
Aggregate = 0.075 m3 = 112.5 kg
Water = 0.025 m3
Volume of total mix = 0.162 m3 = 5.71 cft
For one cft concrete emission of CO2 from component material before mixing
Cement = 0.05(0.86+0.00005 dc) 1000
Sand = 67.2(0.00049+0.00005ds)
Aggregate = 112.5(0.07+0.00005da)
Total emission (5.71 cft) = 51.29+0.0025dc+0.00336ds+0.00563da
Total emission per cft = 8.98+0.00053dc+0.00059ds+0.00099da
Cradle to gate emission has been calculated considering emission of individual material
prior to mixing and the mixing procedure
Cradle to Gate Emission = 9+ 0.00053dc+0.00059ds+0.00099da kg CO2/cft

Development of life cycle CO2 emission and energy cost equations 51
= 9000+0.53dc+0.59 ds+0.99 da, gCO2/cft
Similarly, for all the mix ratios and water content CO2 emission can be calculated for
different cement as given in the following equations.
Cradle to Gate Emission
• For cement type: CEM I
For ratio 1:2:4 and w/c 0.5 = 9000 + 0.53dc + 0.59ds+ 0.99da, gCO2/cft 4.9a
For ratio 1:1.5:3 and w/c 0.45 = 10710 + 0.54dc + 0.58ds + 0.92da, gCO2/cft 4.9b
For ratio 1:3:6 and w/c 0.65 = 6010 + 0.304dc + 0.61ds +0.51da, gCO2/cft 4.9c
• For cement type: CEM IIA
For ratio 1:2:4 and w/c 0.5 = 7520+ 0.53dc + 0.59ds+ 0.99da, gCO2/cft 4.10a
For ratio 1:1.5:3 and w/c 0.45 = 8880 + 0.54dc + 0.58ds + 0.92da, gCO2/cft 4.10b
For ratio 1:3:6 and w/c 0.65 = 4990 + 0.304dc + 0.61ds +0.51da, gCO2/cft 4.10c
• For cement type: CEM IIB
For ratio 1:2:4 and w/c 0.5 = 6470 + 0.53dc + 0.59ds+ 0.99da, gCO2/cft 4.11a
For ratio 1:1.5:3 and w/c 0.45 = 7590 + 0.54dc + 0.58ds + 0.92da, gCO2/cft 4.11b
For ratio 1:3:6 and w/c 0.65 = 4260 + 0.304dc + 0.61ds +0.51da, gCO2/cft 4.11c
Here,
dc = distance in kilometer from cement factory to market and market to construction site
ds= distance in kilometer from sand processing unit to market
da= distance in kilometer from aggregate processing unit to market
The use phase of concrete in the effective life of the building is not considered. After
demolition of the building, concrete aggregate collected from demolition site is put into a
crushing machine. After crushing they can be used in land filling. Hence, the demolition

Development of life cycle CO2 emission and energy cost equations 52
of the concrete is considered and CO2 emission from the first stage to demolition can be
termed as cradle to grave CO2 emission.
4.3 LIFE CYCLE ENERGY COST EQUATIONS OF MATERIALS
Considering the same stages of life cycle, equations of life cycle energy cost construction
materials have been developed in the following articles.
4.3.1 Brick
Brick production in Bangladesh is labor intensive. Most of the bricks are still hand
molded. Almost all the operations are manual, ranging from bringing the clay to the pug
mill, to the molding and drying ground, to the kiln and from the kiln to the warehouse.
In manufacturing brick energy is primarily used in two stages. They are drying and
burning of bricks in kiln and transportation. For drying and burning of bricks, FCK (fixed
chimney kiln) has been considered because FCK kiln holds the largest market share. In
FCK kiln coal is mainly considered as energy input. Emission of CO2 from FCK kiln has
been found 760.49 ton per year whereas average 20,00,000 bricks are manufactured per
kiln per year (Improving kiln efficiency, 2006). Hence emission of CO2 is 0.380 kg CO2
per brick. The emission data has been used to convert the emission data into energy cost
data using the factor 1.97 kg CO2/ kg of coal from table A1 of appendix A.
For transportation diesel driven truck has been considered with CO2 emission 50 g/ton –
km from table A5 of appendix A.
Hence, CO2 emission for heavy truck: 50 gCO2/ ton-km (Maersk line, 2007)
1 ton: 238 bricks, calculated in article 4.2.2
CO2 emission for a brick = 50238
= 0.21 gCO2/brick-km = 0.00021 kgCO2/brick-km
Table 4.10: Energy cost in different stages of life cycle of brick
Stages Emission of CO2 Conversion factor Energy cost factor Drying and burning in FCK kiln
0.380 g CO2/Single Brick
1.97 kg CO2/ kg of coal
0.193 kg coal/brick
Transportation 0.00021 kg CO2 /brick-km
2.64 kg CO2/ liter
0.08 liter diesel /thousand brick-km

Development of life cycle CO2 emission and energy cost equations 53
Therefore the equation of energy cost for brick is
Cradle to gate = 193 Pc + 0.08 Pddb1 (BDT/ thousand brick) 4.12 a
Cradle to grave = 193 Pc + 0.08Pd (db1+ db2) (BDT/ thousand brick) 4.12 b
Where, Pd = price of 1 liter diesel in BDT
Pc = price of 1 kg coal in BDT
db1 = distance in kilometer from brick field to construction site.
db2 = distance in kilometer from construction site to brick chips processing site.
4.3.2 Timber
In developing equation of life cycle energy cost of timber, stages considered are felling of
tree with chain saw, transportation from forest to wood processing unit, natural seasoning,
wood processing in saw mill, demolition.
Equations have been developed considering trees with log diameter 10-18 inch. Felling of
trees involves cutting of trees with chain saw. For this study, craftsman 4 horsepower
capacity and 18 inch blade size chain saw (www.sears.com), operated by electricity has
been considered. According to available data this saw can cut about 15 trees in one hour of
above mentioned specification, which gives energy use 0.20 kWh per tree. Converting this
data into energy data energy cost has been calculated per tree.
For transportation diesel powered heavy truck has been considered with CO2 emission 50
g/ton –km from table A5 of Appendix A. For converting emission data into fuel data using
table A1 of Appendix A, conversion factor 2.64 has been selected.
Table 4.11: Energy cost in different stages of life cycle of timber
Stages Available data Conversion factor
Energy cost factor
Cutting of trees Electricity consumption 0.20 kWh/tree
0.20 kWh/tree
Transportation of timber 1.25 gCO2/cft-km (diesel fuel)
2.64 kgCO2/ liter
0.0005 liter /cft
Wood processing in saw mill
Diesel used= 0.11 liter/cft 0.11 liter /cft

Development of life cycle CO2 emission and energy cost equations 54
For wood processing in Saw mill, field data has been considered which gives saw mill
slices 70-80 cft wood per day (8-9 working hours) and diesel consumption of this mills are
1 liter per hour. Approximately 0.11 liter of diesel is required for sawing 1 cft of timber.
As natural seasoning is considered for the study there has been no energy cost.
Finally summing up all the stages, equation of energy cost for cradle to gate is given
below.
Cradle to gate energy cost = 0.20 e
+ 0.0005 Pd (220+dt1+dt2) (BDT/ cft) 4.13
Where,
Pe = Price of 1 kWh electricity in BDT
t = No of trees cut.
V= volume of timber cut in cft
Pd = price of 1 liter diesel in BDT
dt1 = distance in km from forest to timber processing unit.
dt2 = distance in km from timber market to construction site and construction site to
market.
As timber has recycling potential it can be used number of times. After the demolition of
the building where timber was incorporated for the first time it can be used for land filling
or it may be burnt for cooking depending on the condition of the timber. Burning of timber
does not involve any external energy input. So cradle to gate and cradle to grave equations
for energy cost will be same.
4.3.3 Steel
Steel is one of the most important building materials of our country and it has its
application in almost all spheres of engineering. In this study, two separate life cycle of
steel has been considered from imported billet and other from ship breaking scrap.
From Billet

Development of life cycle CO2 emission and energy cost equations 55
Billets are produced by the primary producers of steel. Billets are imported from other
countries as stated in article 4.2.3. For the simplification of study, maximum and
minimum import distance has been considered. South Korea with a distance 3976 nautical
miles has been considered as maximum import distance and India with a distance 286
nautical miles has been considered as minimum distance from Chittagong port
(www.searates.com/reference/portdistance). For sea freight emission of CO2 has been
calculated in article 4.2.3. Using conversion factor 2.64 kgCO2/ liter from table A1 of
Appendix A, minimum and maximum energy consumption has been calculated. For
transportation diesel powered heavy truck has been considered with CO2 emission 50
g/ton –km from table A5 of Appendix A. Converting emission data into fuel data from
table A1 of Appendix A , energy cost for transportation of billet has been calculated.
For hot rolling process Coal and electricity is used as input energy. CO2 emission of table
4.4 has been converted to energy cost data for coal using conversion factor of table A1 of
appendix A and for electricity conversion factor 1.34 lb/kWh or 2.95 kg CO2/kWh
(http://web.mit.edu/mit_energy) has been used
Table 4.12: Energy cost in different stages of life cycle of Billet
Stages CO2 emission Conversion factor Energy cost factor Shipment of billet • From South Korea 60 kgCO2/ton 2.64 kgCO2 /liter 22.73 liter diesel/ton • From India 4.2 kgCO2/ton 2.64 kgCO2 /liter 1.60 liter diesel/ton
Transportation 50 g/ton-km 2.64 kgCO2 /liter 0.02 liter diesel/ton-kmHot rolling process • Emission (coal) 130 kgCO2/ton 1.97 kgCO2 /kg 66 kg coal /ton • Emission (electricity) 100 kgCO2/ton 2.95 kgCO2 /kWh 34 kWh/ton
Cradle to gate equations:
Min = 0.02 Pd (80+dst1) + 66 Pc + 34Pe BDT/ ton 4.14a
Max =0.02 Pd (1137 + dst1) + 66 Pc + 34Pe BDT/ ton 4.14b
Here,
Pc = Price of 1 kg coal in BDT.

Development of life cycle CO2 emission and energy cost equations 56
dst1 = total distance in km from port to rerolling mills and rerolling mills to market.
To develop equations for total life cycle of steel additional phases required to be
considered is transportation from market to construction site, erection by crane operation,
welding etc. QTZ50 model tower crane (www.cranescn.com/products/tower-crane/tower-
crane-qtz50.html) has been considered for fuel consumption and tower crane operation
specification. According to the specification this crane has jib length of 50 meter , height
37.5/33 meter , tip load 0.9-1 ton and max load 4 ton. Considering hoisting capacity 9
meter per minute with capacity 2 ton and energy used is 4 kW. One meter of hoisting
requires 13.33 kWh/ ton-m. For derricking, with 2 ton capacity and 50 meter jib length
one meter of derricking requires energy 1.69 kWh /ton-m. Considering electric arc
welding, each square meter of welding requires 0.16 kWh of electricity (www.izumi-
mfg.co.jp/english/outline.html).
Table 4.13: energy cost in Crane operations and Welding
Operation Energy cost factor Crane operation
• Hoisting 13.33 kWh/ton • Derricking 1.69 kWh/ton-m Welding 0.16 kWh/m2
Therefore total life cycle energy cost of billet is given below
Total life cycle energy cost (minimum)
= 0.02 Pd (80+dst1+dst2) +66Pc+1.69Pe (20.12 +7.88 h+L+0.1 ) BDT/ton 4.15a
Total life cycle energy cost (maximum)
= 0.02 Pd (1135+dst1+dst2) +66 Pc+1.69Pe (20.12 +7.88 h+L+0.1 ) BDT/ ton 4.15b
Here,
Pd = price of 1 liter diesel in BDT
Pc = Price of 1 kg coal in BDT
Pe = Price of 1 kWh electricity in BDT

Development of life cycle CO2 emission and energy cost equations 57
A= total area of weld for connection in square meter.
W= total weight of steel member and plates required to be weld in ton.
h= hoisting height of the crane in meter for one ton of steel element transfer.
L= derricking length of the crane in meter for one ton of steel element transfer.
From scrap
The main stages considered for steel produced from scrap are cutting procedure of ship in
ship breaking, rerolling process i.e. scrap melting and rerolling , use of crane and welding
in erection of steel member in building and transportation of steel into rerolling mill and
construction site. As steel has recycling potential along with the term cradle to gate, total
life cycle CO2 emission has been used. For cradle to gate criteria stages considered has
been ship breaking and rerolling process.
To calculate energy cost due to ship breaking activities cutting of plates has been
considered mainly. Emission due to liquid propane gas (LPG) used in gas cutter has been
found 0.18 ton/ ton of steel as in article 4.2.3. Using Table A1of Appendix A factor is
2.96. Fuel factor is 60.81 kg of propane or 113.45 liter per ton of steel cut. For
transportation same considerations has been taken as article 4.2.3.
Scrap melting and hot rolling is considered in the rerolling process. According to world
coal organization, 29% of steel is produced in Electric Arc Furnaces (EAF); much of the
electricity used in this process is generated from coal-fired power stations. Using the
emission calculated in table 4.6, energy has been calculated. For scrap melting in electric
arc furnace emission refers to fuel used as charge carbon and the amount of charge carbon
can vary depending on each shop’s practice. Charge carbon is added to the bottom of the
furnace. This can be done by dumping the Charge Carbon into the furnace or putting the
Charge Carbon in the Charging Bucket.
Using the conversion factors 1.97 kg CO2/kg for coal and 2.95 kg CO2/kWh for electricity
and energy cost factors have been found as 30.5 and 139 respectively. For hot rolling
similar calculation is done as for billet. Considering energy cost of crane operation and
welding per ton of steel same as considered for billet.
Table 4.14: Energy cost in different stages of life cycle of steel from scrap

Development of life cycle CO2 emission and energy cost equations 58
Stages CO2 emission Conversion factor Energy cost factor Cutting of ship 60 kg propane
CO2/ton of steel cut
2.96 kgCO2 /kg 113.45 liter LPG/ ton of steel
Transportation 50 g/ton-km 2.64 kgCO2 /liter 0.02 liter diesel/ton-km Scrap melting
• Emission (coal) 60 kgCO2/ton 1.97 30.5 kg coal /ton • Emission
(electricity) 410 kgCO2/ton 2.95 139 kWh/ton
Hot rolling process • Emission (coal) 130 kgCO2/ton 1.97 kgCO2 /kg 66 kg coal /ton • Emission
(electricity) 100 kgCO2/ton 2.95 kgCO2 /kWh 34 kWh/ton
Cradle to gate energy cost
= 113. 5 PLPG+0.02Pd dst1+ 173Pe+96.5Pc (BDT/ton) 4.16
Total life cycle energy cost =
113. 5 PLPG + 0.02Pd (dst1+ dst2) + 96.5 Pc +1.69Pe (102+7.88 h+L+0.1
(BDT/ton) 4.17
Here,
PLPG = Price of 1 liter LPG in BDT
4.3.4 Aggregate
Cradle to gate CO2 emission equations of aggregates have been developed considering
extraction and processing of granite and sandstone according to data provided by the
natural stone specialists (Crishna et al 2010). It is important to note that the estimates of
embodied carbon of imported stone presented in that study were conservative as they
assumed the simplest, shortest scenarios and routes from source to use. One of the
assumptions was that the stone was processed at the same place as it is quarried. The
largest component of each stone footprint is attributable to the processing stage of the life
cycle, mostly due to the different stages of processing namely primary processing,
secondary processing, finishing etc. Results of the study gave CO2 emission in extraction
phase is 0.02 kg CO2 /kg of stone and for processing is 0.07 kg CO2 /kg. For sand stone

Development of life cycle CO2 emission and energy cost equations 59
the amount of CO2 released are 0.01 kg CO2 /kg and 0.055 kg CO2 /kg respectively.
Varieties of machinery are associated with each of the stages. Example of some
machineries commonly used are Jaw crushers, Cone crushers, Horizontal shaft impact
crushers (HSI), Vertical shaft impact crushers (VSI) etc used to run stone preparation
machinery ,dust extraction devices and water pumping machinery. All of these equipments
are electricity driven (www.sbm-mp.at). For simplified analysis, considering electricity to
be the main source of CO2 emission energy cost can be found converting CO2 into
electricity cost considering coal to be the source of electricity and emission factor 0.37 kg
CO2/kWh . For transportation same considerations has been taken as article 4.3.2. Hence,
considering both extraction and processing
For granite = 243 Pe+0.02 Pd da (BDT/ton) 4.18a
For sandstone = 176 Pe+0.02 Pd da (BDT/ton) 4.18b
And considering only processing,
For granite = 190 Pe+0.02 Pd da (BDT/ton) 4.19a
For sandstone = 149 Pe+0.02 Pd da (BDT/ton) 4.19b
Here, da = total distance in km from processing unit to market
4.3.5 Sand
Sand is a naturally occurring granular material composed of finely divided rock and
mineral particles. The composition of sand is highly variable, depending on the local rock
sources and conditions, but the most common constituent of sand in inland continental
settings and non-tropical coastal settings is silica (silicon dioxide, or SiO2), usually in the
form of quartz.
For calculation of energy cost from sand extraction and screening the mechanical capacity
of dredger and sand screening machine available in Bangladesh has been considered,
specification of the machines considered are given in appendix B. Fuel consumption of the
sand dredger is 282 kg per hour and suction capacity is 1200 cubic meter per hour. Hence,
the extraction of sand with this sand dredger is 6.96 ton per liter of diesel. Therefore the
fuel consumption of the dredger is 0.14 liter of diesel for per ton of sand extraction. For
sand screening, rotary and screener with 1500 mm diameter has been considered,

Development of life cycle CO2 emission and energy cost equations 60
specifications of the screener has been given in appendix B. Output of the screener is 10
cubic meter per hour with power 3 kW. Hence considering unit weight of sand as 1600 kg
per cubic meter electricity consumption is 0.19 kWh per ton of sand. For transportation
same considerations has been taken as article 4.2.3. Hence summing up all the
considerations energy cost equation for cradle to gate boundary condition is given below.
Table 4.15: Energy cost in different stages of life cycle of sand
Stages Energy cost factors Sand extraction 0.14 liter diesel/ton Sand screening 0.19 kWh / ton Transportation 0.02 liter diesel/ton -km
Hence, Cradle to gate energy cost = 0.14 Pd +0.19 Pe +0.02 Pd ds (BDT/ton) 4.20
Here, ds = total distance in km from processing unit to market.
4.3.6 Cement
For developing life cycle energy cost of cement, stages considered are extraction, raw
material transport, primary and secondary crushing, raw grinding, kiln process and finally
finish grinding for three types of cement namely CEM-I, CEM-IIA and CEM-IIB.
Diesel has been considered as energy source for extraction and transportation. For other
stages coal has been considered. According to Athena report (Venta et al. 1999), total CO2
emission per kg of cement have been found 0.002 kg CO2, 0.002 kg CO2 and 0.001 kg
CO2 for CEM-I, CEM-IIA and CEM-IIB respectively for raw material transport for
diesel as fuel. Using table 1 of appendix A, CO2 to diesel quantity conversion factor 2.64,
fuel consumption has been found as 3.4, 3 and 2.3 liter of diesel per ton of cement.
For crushing, raw grinding, kiln process coal has been considered as raw material. As
stated in section 4.2.3, Emission have been found, 0.858 kg CO2, 0.68 kg CO2 and 0.569
kg CO2 for CEM-I, CEM-IIA and CEM-IIB respectively and using 1.97 as conversion
factor for CO2 to coal used cost factor for above mentioned cement types are 440, 350
and 280 BDT per kg of coal respectively.

Development of life cycle CO2 emission and energy cost equations 61
Table 4.16: Energy cost in different stages of life cycle of cement
Type of cement
CO2 emission (kg CO2/kg)
Fuel Conversion factor
Energy cost factor
CEM-I 0.002 Diesel 2.64 0.8 0.858 Coal 1.97 440
CEM-IIA 0.002 Diesel 2.64 0.8 0.688 Coal 1.97 350
CEM-IIB 0.001 Diesel 2.64 0.4 0.569 Coal 1.97 280
For transportation same considerations has been taken as article 4.2.2. Life cycle energy
cost equations have been developed for one ton of cement with cradle to gate boundary
condition.
Cradle to Gate Emission
CEM- I = 0.8 Pd + 440 Pc + 0.02 Pddc, (BDT/ton) 4.21a
CEM-IIA = 0.8 Pd + 350 Pc + 0.02 Pddc, (BDT/ton) 4.21b
CEM-IIB = 0.4Pd + 280 Pc + 0.02 Pddc, (BDT/ton) 4.21c
Here, dc = total distance in kilometer from cement factory to market.
4.3.7 Concrete
Equations of concrete have been derived considering the same conditions as article 4.2.7.
The concrete mixes have been designed by absolute volume basis (Singh et al.2005) and
emission equations have been developed for one hundred cubic feet of concrete. The
energy cost of component materials derived earlier in this chapter has been combined for
different cement types, mix ratio and water content. Concrete mixer used for derivation of
equations and symbols are same as in article 4.2.7. Hence the equations are given below
for cradle to gate phase.
• For cement type: CEM I
For ratio 1:2:4 and w/c 0.5 = Pd+385Pc+347Pe, BDT/100cft 4.22a
For ratio 1:1.5:3 and w/c 0.45 = 3Pd+477Pc+325Pe, BDT/100cft 4.22b
For ratio 1:3:6 and w/c 0.65 = 0.7Pd+268Pc+181Pe, BDT/100cft 4.22c

Development of life cycle CO2 emission and energy cost equations 62
• For cement type: CEM II-A
For ratio 1:2:4 and w/c 0.5 = Pd+306Pc+347Pe, BDT/100cft 4.23a
For ratio 1:1.5:3 and w/c 0.45 = Pd+380Pc+325Pe, BDT/100cft 4.23b
For ratio 1:3:6 and w/c 0.65 = 0.7Pd+213Pc+181Pe, BDT/100cft 4.23c
• For cement type: CEM II-B
For ratio 1:2:4 and w/c 0.5 =0.5Pd+245Pc+347Pe, BDT/100cft 4.24a
For ratio 1:1.5:3 and w/c 0.45 =0.6Pd+304Pc+325Pe, BDT/100cft 4.24b
For ratio 1:3:6 and w/c 0.65 =0.4Pd+170Pc+181Pe, BDT/100cft 4.24c
Based on these equations total life cycle CO2 emission and energy cost will be determined
for different structural systems in the next chapter.

CHAPTER 5
COMPARATIVE STUDY ON LIFE CYCLE CO2 EMISSION OF
CONCRETE AND STEEL BUILDING
__________________________________________________________________
5.1 GENERAL
In this chapter, estimation of life cycle CO2 emission in different phases of concrete and
steel buildings have been done using the empirical equations and symbols derived from
article 4.2 of chapter 4 , for different materials commonly used in construction sector of
Bangladesh.
5.2 CASE STUDY
The study of life cycle CO2 emission has been done considering a project site in
Gulshan -1 and analyzing different phases of life cycle individually for both structural
systems namely ‘Concrete Building’ and ‘Steel Building’.
5.2.1 DESIGN OF BUILDING
This section introduces the development of the case studies on the buildings. Firstly it
will introduce the common architectural design of two buildings and then it will approach
on two buildings individual differences between two buildings.
For each of the two buildings this section discusses the structural configuration. The
concrete and steel buildings are used as model for comparison of life cycle CO2 emission
and energy cost. For simplification of study only superstructure has been considered.
The building plan considered for analysis in this research is a six-storey 9832 square feet
gross floor area per storey as shown in fig 5.1. It has been designed with reinforced
concrete as the main material for structure and also for steel. The buildings are considered
to be made for an educational institution with seven rooms, a corridor with two staircases
and a lift. The perspective views of both the buildings are given in fig. 5.2 and fig. 5.3.

Comparative study on life cycle CO2 emission of concrete and steel building 64
.
Figure 5.1 Plan of the Building for Both Concrete and Steel Structural Systems.
Figure 5.2: Perspective view of
Concrete building.
Figure 5.3: Perspective view of Steel
building.

Comparative study on life cycle CO2 emission of concrete and steel building 65
5.2.2 Concrete Building and Design Procedure
The concrete building is a reinforced concrete column and beam structure with 12 feet
typical storey height. It is consist of concrete with compressive strength 4 ksi and yield
strength 60 ksi as the main structural material for beams, columns, floors and roof
slabs, brick partition walls, and timber door - windows. The building is raised floor by
floor with shear concrete walls for lift core. Rectangular columns and beams form the
frame. Internal beams are supported on one internal row of columns. Fig 5.2 shows a
beam and column layout of the concrete building.
Figure 5.4 Beam and Column Layout of Concrete Building
The floors are supported by the frame beams. The thickness of the slabs is 6 inch.
Brick walls are considered for both the interior and exterior walls. Exterior walls are of
10 inch and the interior walls are of 5 inch thickness. For ease of calculations, 40%

Comparative study on life cycle CO2 emission of concrete and steel building 66
opening of the total volume of walls has been considered for doors and windows. All
the design procedures have been followed according to Bangladesh national building
code (BNBC) 1993 and the building has been designed with vertical and lateral loads
such as wind and earthquake considering the project site located in Gulshan1 in Dhaka.
Details calculations of the concrete building are given in appendix C.
5.2.3 Steel Building and Design Procedure
The steel building consists of a 6 inch concrete slab supported on steel beams and
columns. Both internal and external walls are brick walls as considered in concrete
building and stair and lift core are made of concrete. For ease of calculations, 40%
opening of the total volume of walls has been considered for doors and windows.
Figure 5.5 Beam and Column Layout of Steel Building

Comparative study on life cycle CO2 emission of concrete and steel building 67
Structurally the steel building is a column and beam steel structure braced by
Eccentrically Braced Frames (EBFs). EBFs have been used as this have a well-
established reputation as high-ductility systems and have the potential to offer cost-
effective solutions in moderate seismic region. The structural layout is shown in fig
5.5; there are four frames of columns and beams running along the building
longitudinally. Transverse secondary beams connect the four longitudinal frames. The
external frames are braced by EBFs. Beams and columns have been designed with W
sections and bracings are designed with HSS pipes. For the entire steel members 40
grade steel has been used. Extended end plate bolted connection has been considered
for beam - column and column - beam joints.
Steel building has been designed with the same loading conditions and project site as
considered for concrete building. AISC-ASD method has been followed for member
design. Therefore table 5.1 represents a brief summary of quantity of the materials
required for both the buildings.
Table 5.1: Comparison of Material Quantity in Concrete and Steel Building
Detail member detailing charts and sample of connection design are enclosed in
appendix C.
5.3 LIFE CYCLE CO2 EMISSION FROM CONCRETE BUILDING
For calculation of life cycle CO2 emission from Concrete building four stages of life
cycle have been considered namely
• Cradle to gate
• Transportation of raw materials to construction site
Material name Unit of Material
Total Quantity of Materials in concrete building
Total Quantity of Materials in Steel building
Brick Nos 327014 327014 Concrete cft 51856 26856 Timber cft 5977 5977 Steel from Billet ton 164 462 Steel from Scrap ton 164 462

Comparative study on life cycle CO2 emission of concrete and steel building 68
• Construction phase
• Demolition or reuse of materials.
5.3.1 Cradle to Gate CO2 Emission of Materials in Concrete Building
Three different types of cement has been considered for concrete namely CEM-I,
CEM-IIA and CEM-IIB. Also three different concrete mix ratios such as 1:2:4, 1:1.5:3
and 1:3:6 have been considered for each of the cement type.
Concrete with CEM-I
Table 5.2 shows CO2 emission calculations details for concrete building considering
CEM-I used in concrete.
Table 5.2: Emission of CO2 in Cradle to Gate Phase (Concrete With CEM-I)
Concrete with CEM-IIA
Table 5.3 shows CO2 emission calculations details for concrete building considering
CEM-IIA used in concrete.
Material Name Emission Rate
Emission Rate Unit
Total Quantity of Materials
Unit of Material Quantity
Emission of CO2 (kg)
Brick 380.25 gCO2/single brick 327014 Nos 124347
Concrete mix 1:2:4 9000 g CO2/ cft 51856 cft 466703 1:1.5:3 10710 g CO2/ cft 51856 cft 555377 1:3:6 6010 g CO2/ cft 51856 cft 311654 Timber 0.28 kg CO2/ cft 5977.2 cft 1674 From Billet 234 kg CO2/ ton 164 ton 38376
290 kg CO2/ ton 164 ton 47560 From Scrap 920 kg CO2/ ton 164 ton 150880

Comparative study on life cycle CO2 emission of concrete and steel building 69
Table 5.3: Emission of CO2 in Cradle to Gate Phase (Concrete with CEM-IIA)
Concrete with CEM-IIB
In table 5.4, CO2 emission calculation for Cradle to gate phase for concrete building
where concrete is considered to be composed of cement type CEM-IIB, which is the
most commonly used in construction sector of Bangladesh.
Table 5.4: Emission of CO2 in Cradle to Gate Phase (Concrete with CEM-II B)
Material name Emission Rate
Emission Rate Unit
Total Quantity of Materials
Unit of Material
Emission of CO2 (kg)
Brick 380.25 gCO2/single brick 327014 Nos 124347
Concrete Mix 1:2:4 7520 g CO2/ cft 51855.92 cft 389957 1:1.5:3 8880 g CO2/ cft 51855.92 cft 460481 1:3:6 4990 g CO2/ cft 51855.92 cft 258761 Timber 0.28 kg CO2/ cft 5977.2 cft 1674
From Billet 234 kg CO2/ ton 164 ton 38376
290 kg CO2/ ton 164 ton 47560
From Scrap 920 kg CO2/ ton 164 ton 150880
Material name Emission Rate
Emission Rate Unit
Total Quantity of Materials
Unit of Material
Emission of CO2 (kg)
Brick 380.25 gCO2/single brick 327014 Nos 124347
Concrete Mix ratio 1:2:4 6470 g CO2/ cft 51855.92 cft 335508 1:1.5:3 7590 g CO2/ cft 51855.92 cft 393586 1:3:6 4260 g CO2/ cft 51855.92 cft 220906
Timber 0.28 kg CO2/ cft 5977.2 cft 1674
From Billet 234 kg CO2/ ton 164 ton 38376 290 kg CO2/ ton 164 ton 47560
From Scrap 920 kg CO2/ ton 164 ton 150880

Comparative study on life cycle CO2 emission of concrete and steel building 70
Table 5.2, table 5.3 and table 5.4 shows emission of CO2 for different construction
materials used in a concrete building such as brick, timber, reinforcement and concrete
in cradle to gate phase.
According to tables, between two sources of steel, scrap gives maximum cradle to gate
emissions and concrete with 1:1.5:3 mix ratios gives maximum CO2 emission among
the three mix ratios considered in calculation of cradle to gate phase. Hence maximum
total emission have been found as 832 ton for CEM-I , 737 ton for CEM-IIA and 670
ton for CEM II-B considering steel from scrap, concrete mix 1:1.5:3 ,timber and brick
considering the core materials for the super structure of the building. Again,
considering billet, 1:3:6 as the concrete mix ratio, timber and brick minimum CO2
emission have been found as 476 ton for CEM-I, 423 ton for CEM-IIA and 385 ton for
CEM II-B.
Figure 5.6: Life cycle CO2 emission in cradle to gate phase of Concrete Building with
different cement type.
As shown in fig.5.6 maximum emission 832 ton in cradle to gate phase has been found
if CEM-I and have been used in concrete and minimum emission 476 ton has been
found if CEM IIB has been used in concrete.
832737
670
476423 385
0
200
400
600
800
1000
CEM-I CEM-IIA CEM-IIB
CO
2 em
issi
on (t
on)
Types of cement
Max CO2 Emission Min CO2 Emission
Max CO2 emission Min CO2 emission

Comparative study on life cycle CO2 emission of concrete and steel building 71
Figure 5.7: Life cycle CO2 emission in cradle to gate phase of different materials from
Concrete Building.
Fig. 5.7 shows cradle to gate emission of all the building materials. Results show that
concrete with mix ratio 1:1.5:3 emits maximum CO2 and timber emits minimum CO2
amongst the materials in cradle to gate phase. This may be because concrete is a
composite materials which involves cement, sand and coarse aggregate and each of the
materials is individually source of large share of CO2.
5.3.2 Emission of CO2 in Transportation Phase of Concrete Building
CO2 emission calculation in transportation phase involves selecting a particular project
site for concrete building. As project location Gulshan 1 has been considered.
Table 5.5: Distance of Different Material Source from Site
Location Distance (km) Distance from cement factory to site (Savar to Gulshan 1) dc = 27.4 Distance from aggregate processing unit to site, (Sylhet to Gulshan 1 ) da = 251
Distance from sand processing unit to site (Narayanganj to Gulshan 1) ds = 29
Distance from brick field to site (Ashulia to Gulshan 1) db = 21.6
Distance from Sundarban to site (Sundarban to Gulshan 1) dt1= 190 Distance from Chittagong port to site , ( from port to Gulshan 1) dst1+dst2 = 252
Source: RHD road network gazette, planning commission, Bangladesh (www.rhd.gov.bd).
124
466390
336
555
460394
311259
221
3848
151
0
100
200
300
400
500
600
700
800
900
Brick Concrete with CEM IA
Concrete with CEM II-A
Concrete with CEM II-B
Steel
CO
2em
issi
on (t
on)
Materials
Brick Mix ratio 1:2:4Mix ratio 1:1.5:3 Mix ratio 1:3:6Billet (min) Billet (max)Steel (scrap)

Comparative study on life cycle CO2 emission of concrete and steel building 72
Table 5.6: Emission of CO2 from Different Materials in Transportation Phase
Material name Emission Rate Emission
Rate Unit
Total Quantity Of Materials
Unit of Material Quantity
Emission of CO2(g)
Brick 0.21 db g CO2/ brick 327014 Nos 1483336
Concrete Mix 1:2:4 0.53 dc+0.59ds+0.99da g CO2/ cft 51856 cft 145259841:1.5:3 0.54 dc+0.58ds+0.92da g CO2/ cft 51856 cft 136140461:3:6 0.304dc+0.61ds+0.51da g CO2/ cft 51856 cft 7987347Timber 1.25dt1 g CO2/ cft 5977 cft 1419585Reinforcement Both from billet and scrap
50(dst1+dst2) g CO2/ ton-km 164 ton 2066400
From table 5.6, maximum total CO2 emission has been found as 18.58 ton and
minimum CO2 emission has been found as 12.96 ton.
Figure 5.8: Life cycle CO2 emission in transportation phase of different materials
from Concrete Building.
Figure 5.8 shows maximum emission of CO2 from transportation phase in life cycle
CO2 emission calculation of concrete building which indicates raw material
transportation for the construction of concrete building contributes significant amount
1.48
14.5313.61
7.98
1.42 2.07
02468
101214161820
Brick Concrete 1:2:4
Concrete 1:1.5:3
Concrete 1:3:6
Timber Steel
CO
2 em
issi
on (t
on)
Materials
Emission of CO2(ton) Emission of CO2

Comparative study on life cycle CO2 emission of concrete and steel building 73
of CO2. Although maximum transportation distance has been considered for timber
and minimum transportation distance has been considered for brick both of these
materials have similar amount of CO2 emission due to transportation. As different mix
ratios have been used, result indicates the greater amount of CO2 emission is from
cement mix ratio 1: 2: 4. Equations of concrete mixes and results indicate source of
sand has the major impact than the other two materials in concrete mix.
5.3.3 Emission of CO2 in Construction Phase of Concrete Building
Construction of a building involves several individual operations. In this study most
common and energy consuming operations in construction practice has been
considered. In construction phase of life cycle of concrete building mixing of concrete
with JZC350A model concrete mixer and casting of concrete with TMV28 concrete
vibrator have been considered as in developing the equations.
Table 5.7: Emission of CO2 from Different Materials in Construction phase
Operation Emission rate Unit
Total Quantity of Concrete in Building
Unit Emission of CO2(g)
Mixing of concrete 9.48 g CO2/ cft 51855.9 cft 491594 Casting of concrete 5.7 g CO2/ cft 51855.9 cft 2955799
From Table 5.7, total emission in construction phase has been found 0.79 ton.
In construction phase of concrete building mixing of concrete emits 492 kg whereas
casting of concrete emits 296 kg which indicates mixing of concrete emits almost 1.7
times CO2 than casting of concrete.
5.3.4 Emission of CO2 in Demolition Phase of Concrete Building
In demolition phase brick is considered to be converted into brick chips by manually
which is a common practice in Bangladesh and timber is considered to be used in
cooking which gives maximum emission after its repetitive use in building. Concrete is
considered to be crushed for demolition of the building using concrete crusher and
reinforcement to be transported to the rerolling mills for use in production of steel. The
details of calculation are presented in table 5.8.

Comparative study on life cycle CO2 emission of concrete and steel building 74
Table 5.8: Emission of CO2 from Different Materials in Demolition phase
Material Name
State of material after demolition of building
Emission rate Quantity Unit
Emission of CO2(kg)
Brick Brick chips by manual labor 0 327014 Nos 0
Concrete Crushing of concrete 0.04 kg/cft 51855.9 cft 2074
Timber After demolition used in cooking 47.5 kg/cft 5977.2 cft 283917
Steel Transportation to rerolling mill in Gazipur (dst2 = 47 km )
0.05dst2 (kg/ton-km) 164 ton 385
From table 5.8, total emission in demolition phase has been found 283.92 ton. Timber
contributes maximum 284 ton of CO2 in demolition phase. As manual procedure has
been considered for bricks, there is no emission of CO2 from brick in demolition
phase.
5.3.5 Total CO2 Emission from Concrete Building
Summary of total life cycle CO2 emission and individual emission in each of the
phases in life cycle of concrete building are presented in fig 4.8 and 4.9 respectively.
Figure 5.9: Maximum and minimum Total Life cycle CO2 emission from Concrete
Building using different cement type in concrete.
1,139 1,044977
783 730
385
0
200
400
600
800
1000
1200
1400
CEM-I CEM-IIA CEM-IIB
CO
2em
issi
on (t
on)
Type of cement in concrete building
Max CO2 Emission( ton)Min CO2 Emission( ton)Maximum CO2Minimum CO2

Comparative study on life cycle CO2 emission of concrete and steel building 75
From Fig 5.9, maximum total emission has been found for mix ratio 1:1.5:3 and
reinforcement from scrap and minimum for mix ratio 1:3:6 and reinforcement from
billet in cradle to gate although in transportation phase maximum CO2 emission has
been for concrete with mix ratio 1:2:4.
Figure 5.10: Maximum and minimum Life cycle CO2 emission in several phases of
different materials from Concrete Building.
Fig 5.10 shows, maximum and minimum emission from different phases of life cycle
of concrete building. Maximum CO2 is emitted in cradle to gate phase ranging value
between 385 to 832 tons and negligible amount in construction phase. Cradle to gate
phase emits about 73% of the total life cycle CO2 emission. Demolition phase of
concrete building have significant impact in total life cycle CO2 emission of concrete
building.
5.4 LIFE CYCLE CO2 EMISSION FROM STEEL BUILDING
Four stages of life cycle have been considered for analysis of life cycle CO2 emission
from steel building namely cradle to gate, transportation of raw materials to
construction site, construction phase and demolition or reuse of materials. Calculations
have been done considering the similar project site in Gulshan 1 as same as concrete
832
19
286
385
13
286
0
100
200
300
400
500
600
700
800
900
cradle to gate transportation to site
construction demolition
CO
2em
issi
on (t
on)
Phases of life cycle
Maximum emission
Minimum emission

Comparative study on life cycle CO2 emission of concrete and steel building 76
building. Detail calculations throughout several phases of life cycle of steel building
are presented and discussed in the following articles.
5.4.1 Emission of CO2 of Materials in Cradle to Gate Phase of Steel Building
For steel building, cradle to gate analysis have been done with similar conditions as
taken for concrete building.
Concrete with CEM-I in steel building
Table 5.9: Emission of CO2 from Different Building Materials in Cradle to Gate Phase
(Concrete With CEM-I)
Material Name
Emission Rate
Emission rate Unit
Total Material Quantity
Material Quantity unit
Emission of CO2
(kg)Steel Billet 234 kg CO2/ ton 462 ton 108155
290 kg CO2/ ton 462 ton 134038Scrap 920 kg CO2/ ton 462 ton 425224Concrete mix 1:2:4 9000 g CO2/ cft 26856 cft 2417001:1.5:3 10710 g CO2/ cft 26856 cft 287624
1:3:6 6010 g CO2/ cft 26856 cft 161402
Timber 0.28 kg CO2/ cft 5977 cft 1674Brick 380.25 g CO2/single brick 327014 Nos 124347
Concrete with CEM-IIA
Table 5.10: Emission of CO2 from Different Building Materials in Cradle to Gate
Phase (Concrete with CEM-IIA)
Material name
Emission Rate
Emission rate Unit
Total Material Quantity
Material Quantity unit
Emission of CO2(kg)
Steel Billet 234 kg CO2/ ton 462 ton 108155 290 kg CO2/ ton 462 ton 134038Scrap 920 kg CO2/ ton 462 ton 425224Concrete 1:2:4 7520 g CO2/ cft 26856 cft 2019551:1.5:3 8880 g CO2/ cft 26856 cft 2384781:3:6 4990 g CO2/ cft 26856 cft 134010Timber 0.28 kg CO2/ cft 5977 cft 1674Brick 380.25 g CO2/ brick 327014 Nos 124347

Comparative study on life cycle CO2 emission of concrete and steel building 77
Concrete with CEM-IIB
Table 5.11: Emission of CO2 from Different Building Materials in Cradle to Gate
Phase (Concrete with CEM-IIB)
Material name
Emission Rate
Emission Rate Unit
Total Material Quantity
Material Quantity unit
Emission of CO2 (kg)
Steel Billet 234 kg CO2/ ton 462 ton 108155 290 kg CO2/ ton 462 ton 134038 Scrap 920 kg CO2/ ton 462 ton 425224 Concrete 1:2:4 6470 g CO2/ cft 26856 cft 173756 1:1.5:3 7590 g CO2/ cft 26856 cft 203835 1:3:6 4260 g CO2/ cft 26856 cft 114405 Timber 0.28 kg CO2/ cft 5977.2 cft 1674 Brick 380.25 gCO2/ brick 327014 Nos 124347
According to table 5.9, 5.10 and 5.11, between two sources of steel, scrap gives
maximum cradle to gate emissions and concrete with 1:1.5: 3 mix ratios gives
maximum CO2 emission among the three mix ratios considered in calculation of cradle
to gate phase. Hence maximum total emission have been found as 838.86 ton for
CEM-I , 789.72 ton for CEM-IIA and 755.08 ton for CEM II-B considering steel from
scrap, concrete mix 1:1.5:3 ,timber and brick considering the core materials for the
super structure of the building. Again, considering billet, 1:3:6 as the concrete mix
ratio, timber and brick, minimum CO2 emission have been found as 395.58 ton for
CEM-I, 368.18 ton for CEM-IIA and 348.58 ton for CEM II-B.
Fig. 5.12 represents CO2 emission from individual construction materials in cradle to
gate phase. Results show that steel from scrap emits maximum CO2 in steel building
and timber has negligible contribution compared to other materials.

Comparative study on life cycle CO2 emission of concrete and steel building 78
Figure 5.11: Life cycle CO2 emission in cradle to gate phase of Steel Building with
different cement type.
Figure 5.12: Life cycle CO2 emission in cradle to gate phase of different materials of
Steel Building.
839 790 755
395 368 349
0
200
400
600
800
1000
1200
1400
CEM-I CEM-IIA CEM-IIB
CO
2em
issi
on(to
n)
Type of cement in steel building
Max Emission
Min Emission
124
242202 174
288238
204161
134 114 108134
425
0
100
200
300
400
500
600
700
800
Brick Concrete with CEM IA
Concrete with CEM II-A
Concrete with CEM II-B
Steel
CO
2em
issi
on (t
on)
Materials
Brick Mix ratio 1:2:4 Mix ratio 1:1.5:3Mix ratio 1:3:6 Billet (min) Billet (max)Steel (scrap)

Comparative study on life cycle CO2 emission of concrete and steel building 79
5.4.2 Emission of CO2 in Transportation of Material to Construction Site
Considering project location in Gulshan 1, transportation distances from several
sources of material used in superstructure of steel building is same as presented in
table 5.12.
Table 5.12: Emission of CO2 from Different Materials in Transportation Phase of
Steel Building
Material name
Emission Rate Emission rate Total Material Quantity
Unit Of Materials
Emission of CO2(g)
Steel 50(dst1+dst2) g CO2/ ton 462 ton 5823720 Brick 0.21 db g CO2/ brick 327014 Nos 1483336 Concrete 1:2:4 0.53 dc+0.59ds+0.99da g CO2/ cft 26856 cft 7522861
1:1.5:3 0.54 dc+0.58ds+0.92da g CO2/ cft 26856 cft 7050578 1:3:6 0.304 dc+0.61ds+0.51da g CO2/ cft 26856 cft 4136567
Timber 1.25dt1 g CO2/ cft 5977 cft 1419585
According to table 5.12, maximum total CO2 emission from transportation is 16.85 ton
whereas minimum total CO2 emission is 12.87 ton.
Figure 5.13: Life cycle CO2 emission in transportation phase of different materials of
Steel Building.
5.82
1.48
7.52 7.05
4.14
1.42
0
2
4
6
8
10
12
Steel Brick Concrete 1:2:4
Concrete 1:1.5:3
Concrete 1:3:6
Timber
CO
2em
issi
on (t
on)
Materials
Emission of CO2(ton) Emissionof CO2

Comparative study on life cycle CO2 emission of concrete and steel building 80
Figure 5.13 shows maximum CO2 emission in transportation phase is due to concrete
with mix ratio 1:2:4 and lowest is for timber.
5.4.3 Emission of CO2 in Construction of the Steel Building
In construction phase of steel building CO2 emission has been calculated for mixing of
concrete, casting of concrete, crane operations such as hoisting and derricking and
welding the connections of steel members. A QTZ50 model tower crane
(http://www.cranescn.com/) has been considered for crane operations. A detail
specification of this crane is given in Appendix B. Center point of the plan area given
in figure 5.1has been considered as the location of the tower crane and distances of the
members have been calculated from crane location for both hoisting and derricking. As
the emission of CO2 is in terms of kg CO2 / ton –m total weight of the steel members
have been calculated. Details of calculations are presented in table 5.13.
Table 5.13: Emission of CO2 in Construction Phase for Steel Building
Operation Emission Rate Unit Total Material
Quantity Unit of Materials
Emission of CO2(kg)
Mixing of concrete 9.48 g CO2/ cft 26856 cft 255
Casting of concrete 5.7 g CO2/ cft 26856 cft 1535
Hoisting by Crane 8.1h kg/ton -meter h =76.83, total wt = 403.57 ton m, ton 251151
Derricking by Crane 1.03L kg/ton -meter L = 405.1,total
wt = 403.57 ton m, ton 168391
Welding connections 0.04A kg/m2 199.2 m2 8
From table 5.13, emission due to concrete in construction phase is very small as
compared to steel. This is because concrete has a very small volume (used in slab, stair
and lift core) in steel building as compared to steel members. Hence, total CO2
emissions in construction phase have been found as 419.96 ton. In construction of steel
building maximum CO2 emission is due to hoisting of steel members by crane and
minimum CO2 emission is due to welding of connections.

Comparative study on life cycle CO2 emission of concrete and steel building 81
5.4.4 Emission of CO2 in Demolition of building
Table 5.14: Emission of CO2 in Demolition Phase for Steel Building
Material name
State of material after demolition of building
Emission rate Quantity Unit
Emission of CO2 (kg)
Brick Brick chips by manual labor 0 327014 no 0
Concrete Crushing of concrete 0.04 kg/cft 26856 cft 1074
Timber After demolition used in cooking 47.5 kg/cft 5977 cft 283908
Steel Hoisting by Crane 8.1h kg/ton -m
h =76.83, total wt = 403.57 ton
m, ton 251151
Derricking by Crane 1.03L kg/ton -m
L =405.1, total wt = 403.57 ton
m, ton 168391
Transportation to rerolling mill in gazipur (dst2 = 47 km from Gulshan 1 to gazipur)
0.05dst2 (kg/ton) 462 ton 1086
Summing up the CO2 emission data presented in table 5.14, total CO2 emission due to
demolition of steel building is found as 705.61 ton.
Figure 5.14: Life cycle CO2 emission in demolition phase of different materials of
Steel Building.
284
421
0
100
200
300
400
500
600
Brick Concrete Timber Steel
CO
2em
issi
on (t
on)
Materials
Emission of CO2(ton)Emissionof CO2

Comparative study on life cycle CO2 emission of concrete and steel building 82
Fig. 5.14 shows that maximum CO2 emission is from steel and mainly due to crane
operations.
5.4.5 Total CO2 Emission of Steel Building
Summary of total life cycle CO2 emission and individual emission in each of the
phases in life cycle of steel building are presented in figure 5.15 and 5.16 respectively
for three different types of cement. From fig 5.15, maximum total CO2 emission has
been found as 1981.27 ton for concrete mix ratio 1:1.5:3 with CEM-I and
reinforcement from scrap and minimum total CO2 emission has been found as 1457 ton
for mix ratio 1:3:6 and reinforcement from billet in cradle to gate although in
transportation phase maximum CO2 emission has been for concrete with mix ratio
1:2:4.
Figure 5.15: Maximum and minimum total life cycle CO2 emission from Steel
Building using different cement type in concrete.
According to Fig 5.16, maximum CO2 is emitted in cradle to gate phase ranging
between 395 ton to 838.86 ton and negligible amount in transportation phase
indicating 12.87 tons to 16.25 tons. Cradle to gate phase emits up to about 53.7% of
the total life cycle CO2 emission where as construction of steel building emits about
26.9% of the total emission.
1981 1933 1898
1533 1507 1457
0
500
1000
1500
2000
2500
3000
CEM I CEM IIA CEM IIB
CO
2em
issi
on (t
on)
Type of cement
Max CO2 EmissionMin CO2 Emission
Max CO2 emission Min CO2 emission

Comparative study on life cycle CO2 emission of concrete and steel building 83
Figure 5.16: Maximum and Minimum life cycle CO2 emission in different phases of
Steel Building.
5.5 COMPARISON OF CO2 EMISSION OF CONCRETE AND STEEL
BUILDING
Comparison of both steel and concrete structural systems based on CO2 emission is
presented in fig. 5.17 and fig.5.18.
Figure 5.17: Comparison of Steel and Concrete building for maximum life cycle CO2
emission for Concrete mix.
839
16
420
706
395
13
420
706
0
200
400
600
800
1000
1200
cradle to gate transportation to site
construction demolition
CO
2em
issi
on (t
on)
Phases of life cycle
Maximum emission Minimum emission
1981 1933 1898
1139 1044 977
0
500
1000
1500
2000
2500
3000
CEM-I CEM-IIA CEM-IIB
CO
2em
issi
on(to
n)
Type of cement in steel and concrete building
Steel building Concrete building

Comparative study on life cycle CO2 emission of concrete and steel building 84
According to fig.5.17, there is significant difference in total CO2emission from steel
and concrete building. Steel building emits 842 ton to 921 ton more CO2 than concrete
building based on different cement types.
Fig 5.18 shows, except construction phase life cycle CO2 emission in all other phases
of both the building are very close. As construction of steel building involves a number
of machineries and mechanical support, emission in construction of steel building is
huge, almost 531 times as compared to concrete building.
Figure 5.18: Maximum Life cycle CO2 emission in different phase of Steel and
Concrete Building.
It may be concluded that for the six storey 914 square meter (9833 square feet)
building total life cycle CO2 emission of concrete buildings ranges between 178 to 207
kg per square meter whereas that for steel building ranges between 346 to 361 kg per
square meter.
839
16
420
706832
19
286
0
200
400
600
800
1000
1200
1400
cradle to gate transportation to site
construction demolition
CO
2em
issi
on (t
on)
Phases of life cycle
Steel buildingConcrete building

CHAPTER 6
COMPARATIVE STUDY ON LIFE CYCLE ENERGY COST OF
CONCRETE AND STEEL BUILDING
__________________________________________________________________
6.1 GENERAL
In this chapter, life cycle energy cost in different phases of concrete and steel
buildings have been estimated using the equations developed in chapter 4 for different
materials commonly used in construction sector of Bangladesh.
Similar concrete and steel building described in article 5.1, 5.2 and 5.3 has been used
for the energy cost analysis. Both the building will be compared to determine more
energy intensive building between the two.
6.2 LIFE CYCLE ENERGY COST ANALYSIS OF CONCRETE BUILDING
For calculation of life cycle energy cost of Concrete building, four stages of life cycle
mentioned in article 5.3 have been considered. To determine the energy cost different
fuel cost has been considered as given in table 6.1.
Table 6.1: Price list of several fuels
Fuel Price Diesel BDT 61 per liter
Electricity BDT 5 per kWh unit
Coal BDT 80 per 60 kg bag
LPG Gas BDT 94 per cft
Source: Bangladesh Petroleum Corporation, March, 2012
A summary of material quantity required for both the buildings are given in table 5.1
6.2.1 Cradle to Gate Energy Cost of Materials Used in Concrete Building
Three different cement types have been considered for concrete namely CEM-I, CEM-
IIA and CEM-IIB. Comparison has been made for three different concrete mix ratios

Comparative study on life cycle Energy cost of Concrete and Steel Building 86
such as 1:2:4, 1:1.5:3 and 1:3:6 for each of the cement type. Aggregate (sandstones)
have been considered with its life cycle starting from processing unit Two different
sources of reinforcement have been studied; one from ship breaking scrap and other
from imported billet. All the empirical equations and symbols used for cradle to gate
energy cost calculations are derived from article 4.3 of chapter 4.
Concrete with CEM-I
Table 6.2 shows Energy cost calculations details for concrete building considering
CEM-I used in concrete.
Table 6.2: Energy Cost in Cradle to Gate Phase (Concrete With CEM-I)
Material Name Energy Cost Energy
Cost Unit
Total Quantity of Materials
Unit of Material
Total Cost
(BDT)
Brick 193 Pc BDT/1000 brick 327014 Nos 83941
Concrete 1:2:4 Pd+385Pc+347Pe BDT/100cft 51856 cft 11968621:1.5:3 3Pd+477Pc+325Pe BDT/100cft 51856 cft 12665361:3:6 0.7Pd+268Pc+181Pe BDT/100cft 51856 cft 676275Timber 0.11Pd BDT/cft 5977 cft 40107Steel (Billet) 22.74Pd+66 Pc+34 Pe BDT/ton 164 ton 269767Steel (Scrap) 113.5PLPG+96.5Pc+173 Pe BDT/ton 164 ton 1279748
Table 6.2 shows, concrete ratio 1:1.5:3 is more energy intensive among the mix ratios
and scrap consumes more energy than billet. Hence, maximum energy cost has been
found for concrete with mix ratio 1:1.5:3 and steel from scrap as 26.70 lac BDT and
minimum for concrete ratio 1:3:6 and billet as BDT 10.70 lac BDT
Concrete with CEM-IIA
Table 6.3 shows energy cost calculations details considering CEM-IIA used in
concrete.

Comparative study on life cycle Energy cost of Concrete and Steel Building 87
Table 6.3: Energy Cost in Cradle to Gate Phase (Concrete with CEM-IIA)
Material Name Energy Cost Energy Cost
Unit
Total Quantity of Materials
Unit of Materials
Total Cost
(BDT)
Brick 193 Pc BDT/1000 brick 327014 Nos 83941
Concrete mix 1:2:4 Pd+306Pc+347Pe BDT/100cft 51856 cft 11423771:1.5:3 Pd+380Pc+325Pe BDT/100cft 51856 cft 11363721:3:6 0.7Pd+213Pc+181Pe BDT/100cft 51856 cft 638342Timber 0.11Pd BDT/cft 5977 cft 40107Steel (Billet) 22.74Pd+66 Pc+34 Pe BDT/ton 164 ton 269767Steel (Scrap ) 113.5PLPG+96.5Pc+173 Pe BDT/ton 164 ton 1279748
According to Table 6.3, maximum energy cost has been found for concrete with mix
ratio 1:1.5:3 and steel from scrap as 25.40 lac BDT and minimum for concrete ratio
1:3:6 and billet as 10.32 lac BDT.
Concrete with CEM-IIB
Table 6.4 displays energy cost calculation results for cradle to gate phase of concrete
building where concrete is considered to be composed of cement type CEM-IIB, which
is the most commonly used in construction sector of Bangladesh.
Table 6.4: Energy Cost in Cradle to Gate Phase (Concrete with CEM-II B)
Material Name Energy Cost Energy Cost
Unit
Total Quantity of Materials
Unit of Material
Total Cost
(BDT)
Brick 193 Pc BDT/1000 brick 327014 Nos 83941
Concrete 1:2:4 0.5Pd+245Pc+347Pe BDT/100cft 51856 cft 10844901:1.5:3 0.6Pd+304Pc+325Pe BDT/100cft 51856 cft 10713031:3:6 0.4Pd+170Pc+181Pe BDT/100cft 51856 cft 599512Timber 0.11Pd BDT/cft 5977 cft 40107Steel (Billet) 22.74Pd+66 Pc+34 Pe BDT/ton 164 ton 269767Steel (Scrap ) 113.5PLPG+96.5Pc+173 Pe BDT/ton 164 ton 1279748

Comparative study on life cycle Energy cost of Concrete and Steel Building 88
From Table 6.4, maximum energy cost has been found for concrete with mix ratio
1:1.5:3 and steel from scrap as 24.75 lac BDT and minimum for concrete ratio 1:3:6
and billet as 9.93 lac BDT.
Figure 6.1: Life cycle Energy cost in cradle to gate phase of Concrete Building with
different cement type.
Figure 6.2: Life cycle Energy cost of different materials in cradle to gate phase of
Concrete Building.
2,670 2,540 2,475
1,070 1,032 993
0500
1,0001,5002,0002,5003,0003,5004,0004,5005,000
CEM- I CEM- IIA CEM- IIB
Ener
gy c
ost (
Tho
usan
d B
DT)
Materials
Maximum Energy Cost
Minimum Energy Cost
84
1197 1142 1084
12671136 1071
676 638 600
40
270
1280
0
500
1,000
1,500
2,000
Brick Concrete with CEM I
Concrete with CEM II-A
Concrete with CEM II-B
Timber Steel
Ener
gy c
ost (
thou
sand
BD
T)
Materials
Brick Concrete 1:2:4 Concrete 1:1.5:3Concrete 1:3:6 Timber Steel from BilletSteel from Scrap
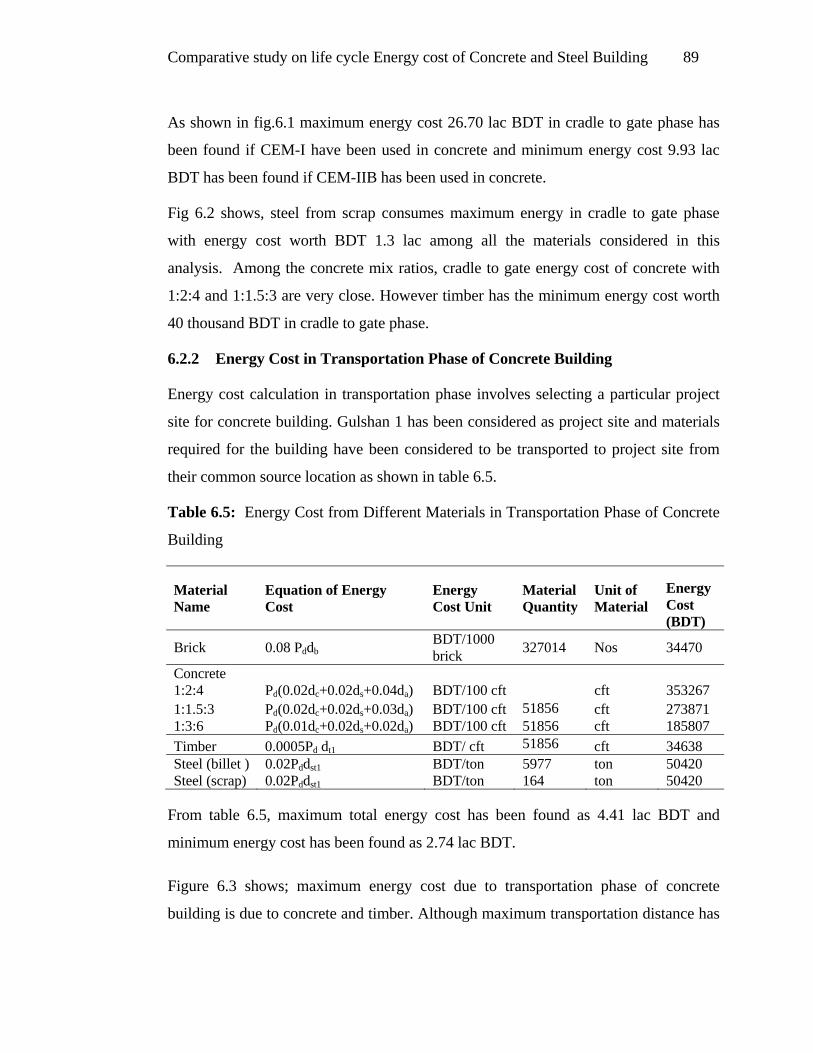
Comparative study on life cycle Energy cost of Concrete and Steel Building 89
As shown in fig.6.1 maximum energy cost 26.70 lac BDT in cradle to gate phase has
been found if CEM-I have been used in concrete and minimum energy cost 9.93 lac
BDT has been found if CEM-IIB has been used in concrete.
Fig 6.2 shows, steel from scrap consumes maximum energy in cradle to gate phase
with energy cost worth BDT 1.3 lac among all the materials considered in this
analysis. Among the concrete mix ratios, cradle to gate energy cost of concrete with
1:2:4 and 1:1.5:3 are very close. However timber has the minimum energy cost worth
40 thousand BDT in cradle to gate phase.
6.2.2 Energy Cost in Transportation Phase of Concrete Building
Energy cost calculation in transportation phase involves selecting a particular project
site for concrete building. Gulshan 1 has been considered as project site and materials
required for the building have been considered to be transported to project site from
their common source location as shown in table 6.5.
Table 6.5: Energy Cost from Different Materials in Transportation Phase of Concrete
Building
Material Name
Equation of Energy Cost
Energy Cost Unit
Material Quantity
Unit of Material
Energy Cost (BDT)
Brick 0.08 Pddb BDT/1000 brick 327014 Nos 34470
Concrete 1:2:4 Pd(0.02dc+0.02ds+0.04da) BDT/100 cft cft 353267 1:1.5:3 Pd(0.02dc+0.02ds+0.03da) BDT/100 cft 51856 cft 273871 1:3:6 Pd(0.01dc+0.02ds+0.02da) BDT/100 cft 51856 cft 185807 Timber 0.0005Pd dt1 BDT/ cft 51856 cft 34638 Steel (billet ) 0.02Pddst1 BDT/ton 5977 ton 50420 Steel (scrap) 0.02Pddst1 BDT/ton 164 ton 50420
From table 6.5, maximum total energy cost has been found as 4.41 lac BDT and
minimum energy cost has been found as 2.74 lac BDT.
Figure 6.3 shows; maximum energy cost due to transportation phase of concrete
building is due to concrete and timber. Although maximum transportation distance has

Comparative study on life cycle Energy cost of Concrete and Steel Building 90
been considered for timber, concrete with mix ratio 1:2:4 have maximum energy cost.
It may be due to the fact that concrete involves three component materials which have
been obtained from different source locations, the distances of which have direct
impact on energy cost.
Figure 6.3: Life cycle Energy cost in transportation phase of different materials of
Concrete Building.
The energy cost equations for concrete shows greater impact of distance of aggregate
source and distance considered for the said source is 251 km which is also quite high.
However timber showed minimum transportation cost.
6.2.3 Energy Cost in Construction Phase of Concrete Building
Construction of a building involves several individual operations. In this study most
common and energy consuming operations in construction practice has been
considered. In construction phase of life cycle energy cost analysis of concrete
building mixing of concrete and casting of concrete has been considered.
34
353
274
186
34 50 50
0
100
200
300
400
500
600
Brick Concrete 1:2:4
Concrete 1:1.5:3
Concrete 1:3:6
Timber Steel from Billet
Steel from Scrap
Ener
gy c
ost (
thou
sand
BD
T)
Materials
Energy Cost

Comparative study on life cycle Energy cost of Concrete and Steel Building 91
Table 6.6: Energy Cost from Different operations in Construction Phase of Concrete
Building
Operations Energy Cost Equation
Energy Cost
Material Quantity
Unit of Material
Energy Cost (BDT)
Mixing of concrete 0.016Pe BDT/ cft 51856 cft 4148 Casting of concrete 0.002 Pg BDT/ cft 51856 cft 9749
From table 6.6, total energy cost in construction phase has been found as 14 thousand
BDT.
6.2.4 Energy Cost in Demolition Phase of Concrete Building
In demolition phase, brick and timber do not worth any energy cost because for
conversion of bricks into brick chips manual labor has been considered which a
common practice in Bangladesh is and timber is considered to be used in cooking
which do not require any external energy input. Concrete is considered to be crushed
for demolition of the building using concrete crusher and reinforcement to be
transported to the rerolling mills for use in production of steel. The details of
calculation are presented in table 6.7.
Table 6.7: Energy Cost from Different Materials in Demolition phase
Material name State of material after demolition of building
Energy Cost Equation
Material Quantity
Unit of Material
Energy Cost (BDT)
Concrete Crushing of concrete 0.014Pd BDT/ cft 51855.92 cft 44285
Reinforcement
Transportation to rerolling mill in gazipur (dst2=47 km from Gulshan 1 to Gazipur)
0.02 Pddst2 (BDT/ton-km)
164 ton 9404
From table 6.7 energy cost in demolition phase has been found 54 thousand BDT.
Concrete contributes maximum energy cost, 44.3 thousand BDT in demolition phase.

Comparative study on life cycle Energy cost of Concrete and Steel Building 92
6.2.5 Total Energy Cost from Concrete Building
Summary of total life cycle energy cost and individual emission in each of the phases
in life cycle of concrete building are presented in figure 4.26 and 4.27 respectively for
three different types of cement.
Figure 6.4: Maximum and minimum total life cycle energy cost of Concrete Building
using different cement type used in concrete.
From fig 6.4, maximum total energy cost has been found for mix ratio 1:1.5:3 with
CEM-I and reinforcement from scrap worth 32 lac BDT and minimum for mix ratio
1:3:6 with CEM II-B and reinforcement from billet worth 13.4 lac BDT.
Fig.6.5 shows, maximum energy is consumed in cradle to gate phase. Both
construction and demolition phase of concrete building have less impact in total life
cycle energy cost of concrete building. Results shows negligible amount of energy cost
in construction phase indicating 14 thousand BDT. Energy cost in cradle to gate phase
is about 84% of the total life cycle energy cost.
3,049 2,984 2,475
1,412 1,374 1,335
0500
1,0001,5002,0002,5003,0003,5004,0004,5005,000
CEM- I CEM- IIA CEM- IIB
Ener
gy c
ost (
Tho
usan
d B
DT)
Materials
Maximum Energy Cost
Minimum Energy Cost

Comparative study on life cycle Energy cost of Concrete and Steel Building 93
Figure 6.5: Maximum and minimum life cycle energy cost in several phases of
Concrete Building.
6.3 LIFE CYCLE ENERGY COST OF STEEL BUILDING
Detail calculations of energy cost throughout several phases of life cycle of steel
building are presented and discussed in the following sections. Detail calculation
charts for Building design are enclosed in Appendix C of this thesis.
6.3.1 Energy Cost of Materials in Cradle to Gate Phase of Steel Building
For steel building, steel members have been studied considering their source both from
billet and ship breaking scrap. For billet minimum value in cradle to gate phase has
been for minimum shipment distance and maximum value has been for maximum
shipment distance. Cradle to gate analysis have been done for concrete with three
different mix ratios as considered for concrete building by absolute volume basis and
three different cement type: CEM I, CEM-IIA and CEM-IIB. Aggregates (sandstones)
have been considered with its life cycle starting from processing unit.
Concrete with CEM-I in steel building
Detail calculations of energy cost for the materials used in steel building are presented
in the following table 6.8.
2,670
441 54
993
274 540
500
1,000
1,500
2,000
2,500
3,000
3,500
4,000
Cradle to gate Transportation Construction Demolition
Ener
gy c
ost (
Tho
usan
d B
DT)
Materials
Maximum Energy Cost
Minimum Energy Cost
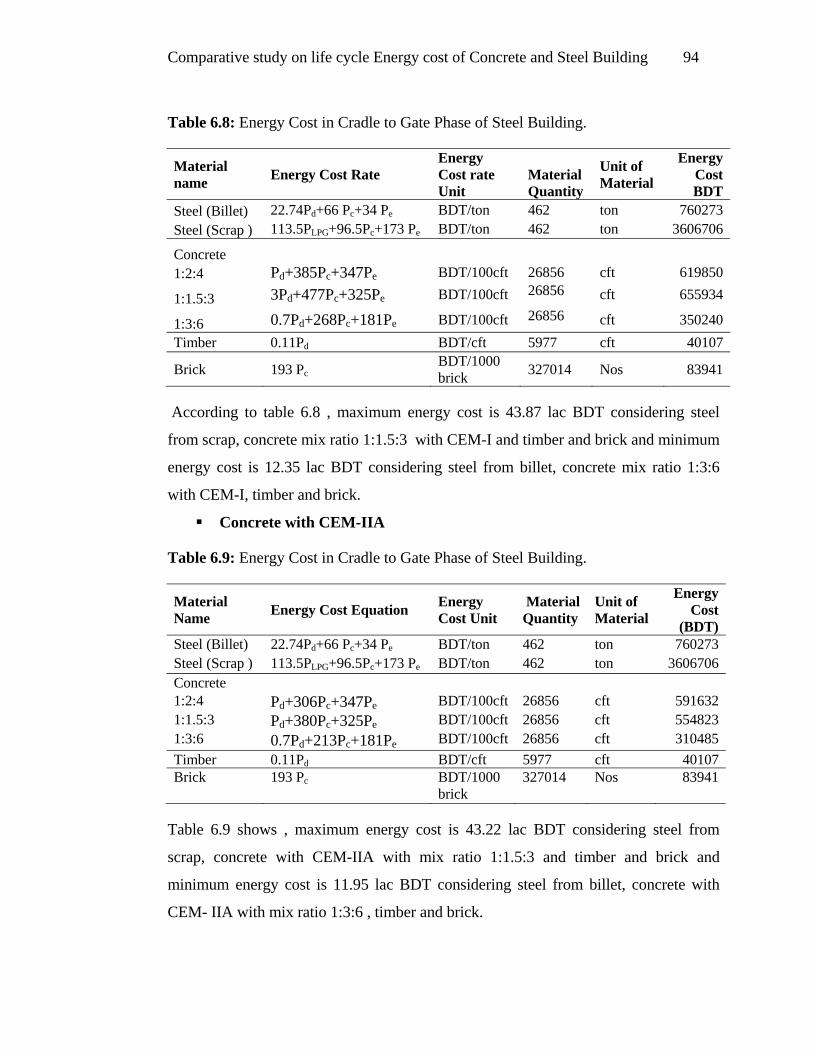
Comparative study on life cycle Energy cost of Concrete and Steel Building 94
Table 6.8: Energy Cost in Cradle to Gate Phase of Steel Building.
Material name Energy Cost Rate
Energy Cost rate Unit
Material Quantity
Unit of Material
Energy Cost BDT
Steel (Billet) 22.74Pd+66 Pc+34 Pe BDT/ton 462 ton 760273Steel (Scrap ) 113.5PLPG+96.5Pc+173 Pe BDT/ton 462 ton 3606706
Concrete 1:2:4 Pd+385Pc+347Pe BDT/100cft 26856 cft 619850
1:1.5:3 3Pd+477Pc+325Pe BDT/100cft 26856 cft 655934
1:3:6 0.7Pd+268Pc+181Pe BDT/100cft 26856 cft 350240Timber 0.11Pd BDT/cft 5977 cft 40107
Brick 193 Pc BDT/1000 brick 327014 Nos 83941
According to table 6.8 , maximum energy cost is 43.87 lac BDT considering steel
from scrap, concrete mix ratio 1:1.5:3 with CEM-I and timber and brick and minimum
energy cost is 12.35 lac BDT considering steel from billet, concrete mix ratio 1:3:6
with CEM-I, timber and brick.
Concrete with CEM-IIA
Table 6.9: Energy Cost in Cradle to Gate Phase of Steel Building.
Material Name Energy Cost Equation Energy
Cost Unit Material Quantity
Unit of Material
Energy Cost
(BDT)Steel (Billet) 22.74Pd+66 Pc+34 Pe BDT/ton 462 ton 760273Steel (Scrap ) 113.5PLPG+96.5Pc+173 Pe BDT/ton 462 ton 3606706Concrete 1:2:4 Pd+306Pc+347Pe BDT/100cft 26856 cft 5916321:1.5:3 Pd+380Pc+325Pe BDT/100cft 26856 cft 5548231:3:6 0.7Pd+213Pc+181Pe BDT/100cft 26856 cft 310485Timber 0.11Pd BDT/cft 5977 cft 40107Brick 193 Pc BDT/1000
brick 327014 Nos 83941
Table 6.9 shows , maximum energy cost is 43.22 lac BDT considering steel from
scrap, concrete with CEM-IIA with mix ratio 1:1.5:3 and timber and brick and
minimum energy cost is 11.95 lac BDT considering steel from billet, concrete with
CEM- IIA with mix ratio 1:3:6 , timber and brick.

Comparative study on life cycle Energy cost of Concrete and Steel Building 95
Concrete with CEM-IIB
Table 6.10: Energy Cost in Cradle to Gate Phase of Steel Building.
Material name Energy Cost Equation Energy Cost
Unit Material Quantity
Unit of Material
Energy Cost BDT
Steel (Billet) 22.74Pd+66 Pc+34 Pe BDT/ton 462 ton 760273Steel (Scrap ) 113.5PLPG+96.5Pc+173 Pe BDT/ton 462 ton 3606706Concrete 1:2:4 0.5Pd+245Pc+347Pe BDT/100cft 26856 cft 5616531:1.5:3 0.6Pd+304Pc+325Pe BDT/100cft 26856 cft 5548231:3:6 0.4Pd+170Pc+181Pe BDT/100cft 26856 cft 310485Timber 0.11Pd BDT/cft 5977 cft 40107
Brick 193 Pc BDT/1000 brick 327014 Nos 83941
According to table 6.10, maximum energy cost is 42.92 lac BDT, considering steel
scrap, concrete mix ratio 1:1.5:3 with CEM-IIB, timber and brick. Minimum energy
cost is 11.95 lac BDT for steel from billet, concrete mix ratio 1:3:6 with CEM-IIB,
timber and brick.
Figure 6.6: Life cycle energy cost in cradle to gate phase of Steel Building with
different cement type.
4,387 4,322 4,292
1,235 1,195 1,195
0
1,000
2,000
3,000
4,000
5,000
6,000
7,000
8,000
CEM I CEM II-A CEM II-B
Ener
gy c
ost (
thou
sand
BD
T)
Cement type
Maximumcost Minimum cost

Comparative study on life cycle Energy cost of Concrete and Steel Building 96
Fig.6.6 shows it will be most economical in terms of energy cost if CEM- IIB is used
in concrete.
Figure 6.7: Life cycle Energy cost in cradle to gate phase of Steel Building
As steel is the core material for the members and connection of steel building energy
cost steel is highest among all the materials used in steel building. Fig. 6.7 shows that
maximum energy cost is for steel from scrap as scrap melting and rerolling process
requires maximum fuel input amongst all the materials considered for superstructure of
steel building. Steel from scrap consumes maximum energy amongst all the materials.
Second highest is Billet which is mainly due to energy requirement in rerolling
process. Brick requires negligible amount of energy than other materials hence has the
lowest energy cost.
6.3.2 Transportation of Material to Construction Site
As the same project location in Gulshan 1 has been considered for steel building also,
transportation distances from several sources are same as table 6.11.
760
3,607
84 620 592561656 554 555
350 310 310
0
500
1,000
1,500
2,000
2,500
3,000
3,500
4,000
4,500
Steel Brick Concrete with CEM I
Concrete with CEM II-A
Concrete with CEM II-B
Timber
Ener
gy c
ost (
thou
sand
BD
T)
Cement type
Steel from Billet Steel from ScrapBrick Concrete 1:2:4Concrete 1:1.5:3 Concrete 1:3:6Timber

Comparative study on life cycle Energy cost of Concrete and Steel Building 97
Table 6.11: Energy Cost in Transportation Phase of Steel Building.
Material name
Energy Cost Equation Energy Cost Unit
Material Quantity
Unit of Material
Energy Cost BDT
Steel 0.02Pddst1 BDT/ton 462.2 ton 142099
Brick 0.08 Pddb BDT/1000 brick 327014 Nos 34470
Concrete 1:2:4 Pd(0.02dc+0.02ds+0.04da) BDT/100 cft 26855.66 cft 182954 1:1.5:3 Pd(0.02dc+0.02ds+0.03da) BDT/100 cft 26855.66 cft 141835 1:3:6 Pd(0.01dc+0.02ds+0.02da) BDT/100 cft 26855.66 cft 96228 Timber 0.0005Pd dt1 BDT/ton 5977.2 cft 34638
According to table 6.11, maximum total energy cost from transportation is 3.7 lac BDT
considering, 1:2:4 mix ratio for concrete and other materials whereas minimum total
energy cost is 2.80 lac BDT considering 1:3:6 mix ratio for concrete and other
materials listed in table.
Figure 6.8: Life cycle energy cost in transportation phase of different materials of
Steel Building.
Figure 6.8 shows maximum energy cost in transportation phase is due to transportation
of concrete as concrete is a composite material, component materials are obtained from
several locations.
142
34
183
142
96
35
0
50
100
150
200
250
300
Steel Brick Concrete 1:2:4
Concrete 1:1.5:3
Concrete 1:3:6
Timber
Ener
gy c
ost (
thou
sand
BD
T)
Materials
Energy Cost

Comparative study on life cycle Energy cost of Concrete and Steel Building 98
6.3.3 Construction phase of Steel Building
In this phase of steel building, energy cost has been calculated for mixing of concrete,
casting of concrete, crane operations such as hoisting and derricking and welding the
connections of steel members. Details of calculations are presented in table 4.24.
Table 6.12: Energy Cost in Construction Phase for Steel Building
Operation Energy Cost Equation
Energy Cost Unit
Material Quantity
Unit of Material
Energy Cost BDT
Mixing of concrete 0.016Pe BDT/ cft 26855.66 cft 2148Casting of concrete 0.002 Pg BDT/ cft 26855.66 cft 5049Hoisting steel members by crane 13.31Peh BDT/ ton h=76.83,total
wt=403.57 ton m,ton 2063468
Derricking steel members by crane 1.69PeL BDT/ ton L=405.1,total
wt=403.57 ton m,ton 1381458
Welding connections 0.17PeA BDT/m2 199.2 m2 169
From table 6.12, it can be said that construction phase of steel building has significant
energy consumption in construction phase. Concrete used in steel building has very
nominal quantity (used in slab, stair and lift core) as compared to steel members.
Hence, total energy costs in construction phase have been found as 34.5 lac BDT.
Figure 6.9: Life cycle energy cost in construction phase of Steel Building.
2,063,468
1,381,458
0
500,000
1,000,000
1,500,000
2,000,000
2,500,000
3,000,000
Mixing of concrete
Casting of concrete
Crane operation
Hoisting Derricking Welding connections
Ener
gy c
ost (
BD
T)
Materials
Energy Cost

Comparative study on life cycle Energy cost of Concrete and Steel Building 99
Fig. 6.9 shows that in construction of steel building, maximum energy cost is due to
hoisting of steel members by crane and minimum energy cost is due to welding of
connections.
6.3.4 Demolition of Steel Building
Table 6.13: Energy Cost in Demolition Phase of Steel Building
Material name
State of material after demolition of building
Energy Cost Equation
Material Quantity Unit
Energy Cost BDT
Brick Brick chips by manual labor 0 327014 no 0
Concrete Crushing of concrete 0.014 Pd BDT/ cft 26855.66 cft 22935
Steel Hoisting steel members by crane
13.31Peh BDT/ ton
h=76.83,total wt=403.57 ton
m,ton 2063468
Derricking steel members by crane
1.69PeL BDT/ ton
L=405.1,total wt=403.57 ton
m,ton 1381458
Transportation to rerolling mill in gazipur (dst2=47 km from Gulshan 1 to Gazipur)
0.02 Pddst2 462 ton 26491
Summing up the energy cost data presented in table 6.13, total energy cost due to
demolition of steel building is found as 34.94 lac BDT. Brick has no energy cost due
to conversion as brick has been considered to be converted as brick chips by manual
labor.
6.3.5 Total Energy cost from Steel Building
Figure 6.10 and 6.11 present summary of total energy cost and individual energy cost
in each of the phases in life cycle of steel building respectively. From Fig 6.10,
maximum total energy cost has been found as 117 lac BDT for concrete mix ratio
1:1.5:3 with CEM-I and reinforcement from scrap and minimum total energy cost has
been found as 84 lac BDT for mix ratio 1:3:6 and reinforcement from billet in cradle
to gate .

Comparative study on life cycle Energy cost of Concrete and Steel Building 100
Figure 6.10: Maximum and minimum total Life cycle Energy cost from Steel Building
using different cement type in concrete.
Figure 6.11: Maximum and Minimum Energy cost in different phases of Steel
Building.
According to Fig 6.10, difference in maximum total energy cost of steel building with
three cement types is not very significant. Fig.6.11 shows cradle to gate phase
11,701 11,636 11,606
8,459 8,419 8,419
02,0004,0006,0008,000
10,00012,00014,00016,00018,00020,000
CEM I CEM IIA CEM IIB
Ener
gy c
ost (
thou
sand
BD
T)
Type of cement
Maximum energy cost
Minimum energy cost
4,387
370
3,450 3,494
1,195
3,450 3,494
0
1,000
2,000
3,000
4,000
5,000
6,000
7,000
8,000
cradle to gate transportation to site
construction demolition
Ener
gy c
ost (
thou
sand
BD
T)
Phases of life cycle
Maximum energy costMinimum energy cost

Comparative study on life cycle Energy cost of Concrete and Steel Building 101
consumes largest share of energy cost of the total life cycle indicating 44 lac BDT.
Construction phase is the second largest phase in terms of energy cost.
6.4 COMPARISON OF CONCRETE AND STEEL BUILDING BASED ON
ENERGY COST
In this section life cycle energy cost of steel and concrete building is compared.
According to fig. 6.12, there is significant difference in total energy cost of steel and
concrete building. Energy cost of steel building ranges from 84.19 lac BDT to 117.01
lac BDT where as total energy cost of concrete building ranges from 132.35 lac BDT
to 31.79 lac BDT. Hence, considering maximum energy cost for both the structural
system, steel building has energy cost 3.7 times that of concrete building.
Figure 6.12: Comparison of Steel and Concrete building for maximum life cycle
Energy cost for Concrete mix.
Energy cost of 914 square meter six storey concrete building ranges from 243 to 580
BDT per square meter and that for steel building ranges from minimum 1535 to 2134
BDT per square meter.
Comparison has been made in several phases of their life cycle namely cradle to gate ,
transportation, construction and demolition separately in fig 6.13, fig 6.14, fig 6.15,
fig 6.16.
3,217
1,462
8,267
4,993
0
2000
4000
6000
8000
10000
12000
Maximum cost Minimum cost
Ener
gy c
ost (
thou
sand
BD
T) Concrete building
Steel building

Comparative study on life cycle Energy cost of Concrete and Steel Building 102
.
Figure 6.13: Life cycle Energy cost of materials in cradle to gate phase of Steel and
Concrete Building.
Figure 6.14: Life cycle Energy cost in transportation phase of Steel and
Concrete Building.
270
1280 1197 1267
676
40 84
760
3607
656 620350
40 840
500
1000
1500
2000
2500
3000
3500
4000
4500
5000
steel(billet) steel (scrap) concrete 1:2:4
concrete 1:1.5:3
concrete 1:3:6
timber brick
Ener
gy c
ost (
thou
sand
BD
T)
Materials
Concrete buildingSteel building
50
353
274
186
34.6 34.5
142183
14296
34.6 34.5
0
100
200
300
400
500
600
steel(billet) concrete 1:2:4
concrete 1:1.5:3
concrete 1:3:6
timber brick
Ener
gy c
osat
(tho
usan
d B
DT)
Material
Concrete building
Steel building

Comparative study on life cycle Energy cost of Concrete and Steel Building 103
Figure 6.15: Life cycle Energy cost in construction phase of Steel and Concrete
Building.
Figure 6.16: Life cycle Energy cost in several phases of Steel and Concrete Building.
9,749
2,063,468
1,381,458
0
500000
1000000
1500000
2000000
2500000
mixing of concrete
casting of concrete
hoisting by crane
derricking by crane
welding connections
Ener
gy c
osat
(BD
T)
Operations in construction
Concrete building
Steel building
4,398
370
3,450 3,4942,694
44114 54
0
1,000
2,000
3,000
4,000
5,000
6,000
7,000
8,000
cradle to gate transportation to site
construction demolition
Ener
gy c
ost (
thou
sand
BD
T)
Phases of life cycle
Steel BuildingConcrete Building

Comparative study on life cycle Energy cost of Concrete and Steel Building 104
According to the figures it can be said that except demolition phase, difference in life
cycle energy cost in all other phases of both the building are very significant. The
largest difference has been found in cradle to gate phase and construction phase. This
is because; production of steel is very energy intensive which requires huge fuel input
as compared to concrete and construction of steel building involves a number of
machineries and mechanical support.
.

Conclusion 105
CHAPTER 7
CONCLUSION AND RECOMMENDATIONS
______________________________________________________________________
7.1 GENERAL
This research work emanated with an aim to develop empirical equations of the life
cycle CO2 emission and energy cost of selected building materials of the construction
industry of Bangladesh and also to make a comparative study of medium size buildings
with different structural systems.
Empirical equations have been developed for the materials steel, cement, sand,
aggregate, timber, brick and concrete. Four stages of life cycle have been considered;
they are cradle to gate, transportation, construction and demolition of the building.
Operation phase of the building has not been considered as the building materials do not
emit any significant amount of CO2 and also do not require any external energy after
incorporating into a building. Uncertainty is unfortunately a part of CO2 analysis and
even the most reliable data carries a natural level of uncertainty. When describing
buildings by materials, there is a tendency to label according to the main material used,
however, the vast majority of buildings use a large number of materials. Hence it is not
clear which materials or combinations of materials can achieve the best performance, in
terms of life–cycle carbon dioxide emissions and energy cost.
In order to develop a set of ‘benchmarks’, this research modeled the performance of two
similar medium sized buildings, located in Dhaka city of Bangladesh, each designed by
finite element analysis using primarily Concrete and Steel. The models were based on a
six-storey 9833 square feet or 914 square meter floor area building. The analysis of each
case study includes the calculation of life cycle energy cost and carbon dioxide
emission. After completing the analysis a good number of graphs have been drawn for
different phases of life cycle of each of the buildings with the previously derived
equations. One can easily obtain the total energy cost and life cycle CO2 emission by
putting values in these equations and assess the environmental implications of several

Conclusion and Recommendations 106
building projects of Bangladesh. Thus the objective of this research comes out
successfully.
7.2 FINDINGS OF THE RESEARCH WORK
The outcomes of the research work are summarized as follows.
Empirical equations of life cycle CO2 emission and energy cost have been
developed for brick, cement, sand, steel; both from billet and scrap, stone chips,
timber and concrete which are very usable equations for the engineers for
decision making in choosing materials.
Two similar buildings have been modeled separately for steel and concrete
structural systems and compared on the basis of empirical equations developed in
four phases of life cycle namely cradle to gate, transportation of raw materials,
construction and demolition.
On the basis of analysis of life cycle CO2 emission and energy cost on two
individual case studies of Steel and Concrete building it can be said that-
Steel produced from ship breaking scrap emits the maximum life cycle CO2
and consumes maximum energy in its life cycle as compared to other
materials considered in this study. Imported billets have less energy cost even
smaller than concrete in cradle to gate phase.
Among three different type of cement CEM-IIB emits less life cycle CO2 and
is more economical in terms of life cycle energy cost.
Concrete with mix ratio 1:1.5:3 emits maximum life cycle CO2 in cradle to
gate phase and concrete with mix ratio 1:2:4 emits maximum life cycle CO2
in transportation phase. However, concrete with mix ratio 1:3:6 have
minimum energy cost and emits minimum CO2 in both the phases.
Concrete emits maximum CO2 in transportation phase among all the
construction materials considered in this study. This may be due to the fact
that concrete is a composite material which has three core materials such as
cement, sand and coarse aggregate, all of these are obtained from different
source locations.

Conclusion and Recommendations 107
Energy cost of timber in transportation phase is highest among all the materials.
Comparing both the structural system of 914 square meter floor area six storey mid
rise building it can be concluded that-
In cradle to gate phase, concrete building emits 73 % of the total life cycle
CO2 where as steel building emits 53.7% CO2 in this phase.
In construction phase emission of CO2 of concrete building is very
negligible indicating a value less than one ton. On the other hand 26.9% of
total life cycle CO2 of steel building is due to construction phase. Although
cradle to gate emissions of both the buildings are almost same, construction
phase of steel building emits 531 times CO2 of that of concrete building.
Total life cycle CO2 emission of concrete buildings ranges between 178 to
207 kg per square meter whereas that for steel building ranges between 346
to 361 kg per square meter. Steel building emits 1.7 times CO2 per square
meter as compared to concrete buildings considering maximum total life
cycle CO2 emission.
Energy cost of concrete building ranges from 243 to 580 BDT per square
meter and that for steel building ranges from minimum 1535 to 2134 BDT
per square meter. Considering maximum total energy cost, steel building has
3.7 times energy cost per square feet of concrete building.
7.3 RECOMMENDATIONS FOR FUTURE STUDIES
The following recommendations for the future work may be suggested:
In this study empirical equations have been developed for seven most widely
used materials of Bangladesh namely brick, cement, sand, and aggregate, timber
steel and concrete. However, the study can be extended considering more
materials such as glass, plastic, aluminium and other finishing materials.

Conclusion and Recommendations 108
The present study considers only superstructure of both the buildings. Life cycle
CO2 emission and energy cost may be studied for buildings considering
foundation also.
Empirical equations may be developed for several materials to assess variations
of structural systems and further comprehensive investigation can be made.