Estimation of electric charge in sprites from optical and radio ...
13
Estimation of electric charge in sprites from optical and radio observations Jingbo Li 1 and Steven Cummer 1 Received 22 February 2010; revised 6 September 2010; accepted 14 October 2010; published 8 January 2011. [1] Measurements of very low frequency radio emissions indicate that substantial electric current flows inside some sprites. This charge motion, with presently unknown location and distribution, is related to the detailed internal microphysics of sprite development that is in turn connected to the impact sprites have on the mesosphere. Assuming that sprite streamers propagate along the direction of local electric fields, we combine lightning‐ driven background electric fields computed from electromagnetic measurements and simulations with streamer timing and propagation direction measured from high‐speed images to estimate the total ambient electric field at the locations of upward streamers. From this total field, we are able to establish a lower bound on the electric charge in six observed sprites driven by positive lightning. We find that individual bright sprite cores contain significant negative space charge between −0.01 C and −0.03 C. Accounting for the uncertainty caused by using different vertical charge distribution profiles, these values could be as much as 50% higher. This charge, when spread over the observed sizes of several hundred meters in diameter and approximately 10 km in length, results in a local electric field close to the breakdown field and that the relatively long duration (several milliseconds) optical emissions from this region are driven predominantly by instantaneous local electric fields, in agreement with published simulation results. Given the significant negative charge, we interpret the sprite core region as the partial and perhaps dominant sink of the negative charge created by the downward positive polarity streamers. This further suggests that when downward streamers supply more charge than can be absorbed by the sprite core, slightly delayed upward negative streamers initiate from the sprite core to disperse this charge. This is consistent with observations that show that the subsequent upward streamers are not always present, especially in smaller sprites. Assuming that the sprite core balances all of the positive charge in the downward streamers, we find that the average streamer contains a typical charge of at least 2–4 × 10 −3 dC. Observed sprite current in one bright sprite suggests a positive charge in each distinct downward streamer of only 2.5 times larger than this lower bound, indicating that our estimate of the positive charge in downward sprite streamers and the negative charge in the sprite core is physically reasonable. Citation: Li, J., and S. Cummer (2011), Estimation of electric charge in sprites from optical and radio observations, J. Geophys. Res., 116, A01301, doi:10.1029/2010JA015391. 1. Introduction [2] Sprites are structured optical emissions caused by lightning discharges and are observed at altitudes of ∼40– 90 km above thunderstorms [Sentman, 1995]. Previous studies involving measurements of sprite optical and radio emissions have revealed many important features of the phe- nomena. Images recorded by high‐speed cameras [Stanley et al., 1999; Stenbaek‐Nielsen et al., 2000; Cummer et al., 2006; McHarg et al., 2007; Stenbaek‐Nielsen and McHarg, 2008] and telescopes [Gerken et al., 2000] have shown the fine streamer‐based structure of sprites [Pasko, 2007]. Observed distinct features in sprites typically include down- ward streamers, an upper bright core in the region where the downward streamers initiated, and in some sprites upward streamers that develop approximately 1 ms after the down- ward streamers [Stanley et al., 1999; Cummer et al., 2006]. [3] Laboratory experiments [Ebert et al., 2006; Luque et al., 2008; Briels et al., 2008] and numerical models [Liu and Pasko, 2004, 2005; Sentman et al. , 2008; Luque and Ebert, 2009, 2010] have shown that upward and downward streamers are formed by the motion of electrons in an ambient electric field. The polarity of these streamers is defined by a sign of the charge in its head and related to the polarity of the sprite‐producing lightning discharge [Liu and 1 Department of Electrical and Computer Engineering, Duke University, Durham, North Carolina, USA. Copyright 2011 by the American Geophysical Union. 0148‐0227/11/2010JA015391 JOURNAL OF GEOPHYSICAL RESEARCH, VOL. 116, A01301, doi:10.1029/2010JA015391, 2011 A01301 1 of 13
Transcript of Estimation of electric charge in sprites from optical and radio ...

Estimation of electric charge in sprites from opticaland radio observations
Jingbo Li1 and Steven Cummer1
Received 22 February 2010; revised 6 September 2010; accepted 14 October 2010; published 8 January 2011.
[1] Measurements of very low frequency radio emissions indicate that substantial electriccurrent flows inside some sprites. This charge motion, with presently unknown locationand distribution, is related to the detailed internal microphysics of sprite developmentthat is in turn connected to the impact sprites have on the mesosphere. Assuming that spritestreamers propagate along the direction of local electric fields, we combine lightning‐driven background electric fields computed from electromagnetic measurements andsimulations with streamer timing and propagation direction measured from high‐speedimages to estimate the total ambient electric field at the locations of upward streamers.From this total field, we are able to establish a lower bound on the electric charge in sixobserved sprites driven by positive lightning. We find that individual bright spritecores contain significant negative space charge between −0.01 C and −0.03 C. Accountingfor the uncertainty caused by using different vertical charge distribution profiles, thesevalues could be as much as 50% higher. This charge, when spread over the observed sizesof several hundred meters in diameter and approximately 10 km in length, results in alocal electric field close to the breakdown field and that the relatively long duration(several milliseconds) optical emissions from this region are driven predominantly byinstantaneous local electric fields, in agreement with published simulation results. Giventhe significant negative charge, we interpret the sprite core region as the partial andperhaps dominant sink of the negative charge created by the downward positive polaritystreamers. This further suggests that when downward streamers supply more charge thancan be absorbed by the sprite core, slightly delayed upward negative streamers initiatefrom the sprite core to disperse this charge. This is consistent with observations that showthat the subsequent upward streamers are not always present, especially in smaller sprites.Assuming that the sprite core balances all of the positive charge in the downward streamers,we find that the average streamer contains a typical charge of at least 2–4 × 10⁻³ dC.Observed sprite current in one bright sprite suggests a positive charge in each distinctdownward streamer of only 2.5 times larger than this lower bound, indicating that ourestimate of the positive charge in downward sprite streamers and the negative charge in thesprite core is physically reasonable.
Citation: Li, J., and S. Cummer (2011), Estimation of electric charge in sprites from optical and radio observations, J. Geophys.Res., 116, A01301, doi:10.1029/2010JA015391.
1. Introduction
[2] Sprites are structured optical emissions caused bylightning discharges and are observed at altitudes of ∼40–90 km above thunderstorms [Sentman, 1995]. Previousstudies involving measurements of sprite optical and radioemissions have revealed many important features of the phe-nomena. Images recorded by high‐speed cameras [Stanleyet al., 1999; Stenbaek‐Nielsen et al., 2000; Cummer et al.,2006; McHarg et al., 2007; Stenbaek‐Nielsen and McHarg,
2008] and telescopes [Gerken et al., 2000] have shown thefine streamer‐based structure of sprites [Pasko, 2007].Observed distinct features in sprites typically include down-ward streamers, an upper bright core in the region where thedownward streamers initiated, and in some sprites upwardstreamers that develop approximately 1 ms after the down-ward streamers [Stanley et al., 1999; Cummer et al., 2006].[3] Laboratory experiments [Ebert et al., 2006; Luque
et al., 2008; Briels et al., 2008] and numerical models [Liuand Pasko, 2004, 2005; Sentman et al., 2008; Luque andEbert, 2009, 2010] have shown that upward and downwardstreamers are formed by the motion of electrons in anambient electric field. The polarity of these streamers isdefined by a sign of the charge in its head and related to thepolarity of the sprite‐producing lightning discharge [Liu and
1Department of Electrical and Computer Engineering, Duke University,Durham, North Carolina, USA.
Copyright 2011 by the American Geophysical Union.0148‐0227/11/2010JA015391
JOURNAL OF GEOPHYSICAL RESEARCH, VOL. 116, A01301, doi:10.1029/2010JA015391, 2011
A01301 1 of 13

Pasko, 2004]. Chemical processes during sprite develop-ment have been studied to explain the brightness of spritestreamers [Morrill et al., 1998; Stenbaek‐Nielsen et al.,2007; Sentman et al., 2008]. The longer‐duration opticalemissions from the bright sprite core are less understood andcould reflect either slow local chemical processes [McHarget al., 2007] or long duration local electric fields.[4] Studies from remote measured low‐frequency radio
emissions indicate that substantial electric current can flowinside the sprite body during an optical emission [Cummeret al., 1998]. This electric current, known as “sprite cur-rent,” is related to internal microphysics of sprite develop-ment and is also connected with the effects sprites create inthe mesosphere. However, it has been difficult to determinewhere this current flows inside a sprite. Numerical modelshave been used to predict the sprite properties includingcurrent flows and charge motion in sprites. Raizer et al.[1998] modeled the sprite streamer propagation in aninhomogeneous atmosphere by treating the lightning sourceas an electrical dipole. Including the internal chemical andphotoionization processes, Liu and Pasko [2004, 2005] havedeveloped a model to simulate the propagation of spritestreamers in uniform electric fields and air densities. Luqueand Ebert [2009, 2010] reported simulation results ofstreamer propagation in a varying air density. Besides prop-erties of propagating positive streamers, recent simulationresults from Liu [2010], Luque and Ebert [2010] also revealedthe mechanism of the glowing trail behind, which is pro-duced by the accumulation of negative charges. All thesemodels have been proven to be useful in predicting the spritedynamics at the beginning stage of the sprite developmentand have been confirmed with observations from high‐speedvideos [McHarg et al., 2007; Cummer et al., 2006; Li andCummer, 2009; Liu et al., 2009b; Luque and Ebert, 2009].However, model predictions depend very sensitively on theinput parameters and initial conditions. Furthermore, it canbe difficult to simulate the sprite properties at the stage offull development due to the limitations imposed by com-putation resources. Thus measurements of or bounds on thetotal charge in sprites are needed to help constrain detailedstreamer models and thus improve predictions of the phys-ical and chemical impact of sprites on the mesosphere.[5] In this work, we estimate the total electric charge in
sprites using a measurement‐based approach. First, weestimate the lightning‐driven background electric fields inthe mesosphere by combining measurements of lightningradiated magnetic fields and detailed electromagnetic simu-lations [Hu et al., 2007; Li et al., 2008]. We then measurefrom high‐speed video observations the propagation direc-tion of upward streamers that initiate from the bright coreregion of sprites. Assuming the streamers propagate alongthe direction of local electric fields, and that the localelectric fields are modified by space charge present in thesprite core, the above analysis approach enables us to inferthe total electric charge in the bright core region that is con-sistent with the observed streamer propagation directions.[6] We apply this analysis approach to six sprites that
were driven by positive lightning. We find that individualbright sprite cores contain significant negative space chargethat ranges over a factor of 4 between −0.009 C and −0.034 C.Considering the uncertainty caused by using different chargedistribution profiles, this charge may be as much as 50%
larger and thus should be considered a lower bound. Detailedelectrostatic simulations show that this amount of charge,when spread over the observed sizes of several hundredmeters in diameter and approximately 10 km in length,results in a local electric field at the outer edges of the spritecore close to the air breakdown field. This is consistent withthe recent simulation results reported by Luque and Ebert[2010]. Moreover, this indicates that the relatively longduration (several milliseconds) optical emissions typicallyobserved from sprite cores [Cummer et al., 2006] are drivenpredominantly by instantaneous local electric fields andnot by long‐duration chemistry initiated by previous energyinput.[7] Given the significant negative charge, we interpret the
sprite core region as the partial and perhaps dominant sinkof the negative charge created by the downward positivepolarity streamers. This notion is supported by numericalsimulations which show that only a weak or nonexistentelectrical connection between the ionosphere and the down-ward streamer results in significant negative charge at thetop of the streamer channel. This further suggests that sub-sequent negative polarity upward streamers that appear insome sprites a few milliseconds after initiation are createdwhen the downward positive sprite streamers require morecharge than can be supplied by this sprite core. This isconsistent with observations that show the subsequentupward streamers are not always present, especially in smallersprites.[8] Assuming that the sprite core balances all of the
positive charge in the downward streamers, we find that theaverage downward streamer contains a charge of at least2–4 × 10⁻³ C. Observed sprite current in one bright spritesuggests a positive charge in each distinct downwardstreamer that is only 2.5 times larger than this lower bound.This indicates that our estimate of the positive charge indownward sprite streamers and the negative charge in thesprite core is physically reasonable, and also that the chargemotion from the sprite core to the downward streamers is alikely source of sprite current.
2. Instrumentation
[9] In 2005 we simultaneously measured high‐altitudesprite optical emissions and broadband electromagneticradiation from sprite parent lightning at the Yucca RidgeField Station (40.702°N,‐105.031°E) near Fort Collins,Colorado, USA. The magnetic sensors continuously sampledsignals with a flat response from ∼2 Hz to 30 kHz. Addi-tionally, the National Lightning Detection Network (NLDN)data provided all of the return stroke locations. The lightninglocation and two orthogonal horizontal measurements of themagnetic field from each pair of the coils enabled us toderive the azimuthal magnetic field (the magnetic field inazimuthal (�̂) direction defined by a cylindrical coordinatesystem with the origin at the lightning location). The cameraused was a Vision Research Phantom 7.1 monochrome high‐speed imager coupled to an ITT Gen III image intensifier, andduring the campaign we recorded high‐speed TLE images upto 10,000 frames per second. An external GPS‐synchronizedIRIG time code has been used to provide the absolute timingfor both systems with an accuracy better than 10 micro-seconds. Thus the resulting data set comprises synchronized,
LI AND CUMMER: ESTIMATION OF ELECTRIC CHARGE IN SPRITES A01301A01301
2 of 13

high time resolution images and broadband magnetic fieldmeasurements. More details about these instruments werepresented by Cummer et al. [2006] and Li et al. [2008].
3. Method of Analysis
[10] The main element of our analysis is inferring the totalcharge in the sprite core region from observations of thedirection of travel of upward streamers that emanate fromthe core. To do this we must separately estimate the con-tributions to the total mesospheric electric field at the locationof these upward streamers from the low‐altitude lightning‐driven fields and from local charge inside the sprite core.
3.1. Lightning‐Driven Mesospheric Electric Fields
[11] We first estimate the lightning‐driven electric fieldsby applying a method introduced by Hu et al. [2007] andLi et al. [2008], which combines a deconvolution technique[Cummer and Inan, 1997; Cummer, 2003] and finite dif-ference time domain (FDTD) simulations [Hu et al., 2006].The deconvolution technique is used to infer the lightningcurrent moment waveform from the remotely measuredmagnetic fields. This source current is then used as an inputto the FDTD model. The FDTD model computes electricfields as a function of both time and location above thethundercloud. Parameterized nonlinear heating, attachment,and ionization processes [Pasko et al., 1997] are includedin this model and are essential for accurately estimatinglightning‐driven mesospheric electric fields. Strong lightning‐driven fields create significant electron attachment thatreduces the local electron density and thus increases the localelectric field by reducing relaxation currents. Not includingthese nonlinearities can result in predicted field differencesas big as a factor of two near the ∼70–80 km altitude ofinterest. All of the sprites analyzed here are produced bypositive cloud‐to‐ground lightning discharges (+CGs), andwe use one example to illustrate our approach. Figure 1shows one example of lightning generated electric fieldsusing the technique described byHu et al. [2007] and Li et al.[2008]. Figure 1 (left) shows the measured magnetic fieldsand extracted current moment waveform. Figure 1 (right)shows a snapshot of lightning produced electric fields at a
typical sprite delay time (5 ms in this case) after the returnstroke. The color intensity represents the normalized electricfield, which is the ratio between the true electric field E andair breakdown field Ek. The black arrows represent thedirection of this lightning induced electric field. The directionof the lightning‐driven field after the return stroke is notsensitive to the delay time due to its quasi‐electrostatic nature.In the examples that follow, the time at which the backgroundelectric field is computed is the time at which the upwardstreamer develops according to high‐speed images.[12] In this way we can realistically estimate the lightning‐
driven mesospheric electric field for each observed sprite.As shown in this case, it is generally true that at locationsabove the lightning discharge above approximately 60 km,the lightning‐driven electric field is very nearly vertical andin the analysis that follows, we neglect the small horizontalcomponent. The essentially vertical lightning‐generatedfield means that any deviations from vertical in upwardstreamer development must be created by local charge in themesosphere.
3.2. Local Mesospheric Electric Fields From Sprites
[13] If we assume that streamers propagate along thedirection (or opposite direction for negatively chargedstreamers) of the total electric field, the total electric field andelectric fields caused by charges in sprites can be computedby knowing the lightning‐driven fields and streamer propa-gation directions, which can be measured from high‐speedvideos. Figure 2a shows a single still image acquired at7200 frames per second of a typical and relatively smallsprite caused by a +CG with labeled downward streamers,bright core, and upward streamers. The upper part of thissprite is zoomed in Figure 2b to show the detailed structure.[14] The upward streamers are negative polarity since they
move opposite to the general electric field direction [Stanleyet al., 1999; Cummer et al., 2006]. However, as seen in theimage, upward streamers propagate with a significant hori-zontal component [Cummer et al., 2006; McHarg et al.,2007] that we assume is produced by a horizontal compo-nent of the local electric field. Since the lightning‐drivenfield is vertical, this horizontal field has to be generated bylocal electric charge associated in some way with the sprite.
Figure 1. An example of background electric field computation. (a) Magnetic field measured from asprite‐producing +CG. (b) Extracted current moment and charge moment change. (c) FDTD simulationresults of lightning‐driven electric field at 5 ms after the return stroke. The color intensity represents thenormalized electric field (E/Ek). The arrows represent the direction of the electric fields.
LI AND CUMMER: ESTIMATION OF ELECTRIC CHARGE IN SPRITES A01301A01301
3 of 13

The closest and brightest sprite feature is the bright core, andwe thus assume that this region is the source of the neededcharge. It will be shown below that this assumption isconsistent with the size and brightness of this particularsprite feature. This general model is summarized in Figure 2(right), in which the bright core and upward streamers arenegatively charged and represented by a 3‐D cylinder andthe two gray curves. Ez, Eh and Etot represent the verticalelectric field, the horizontal electric field, and the totalelectric field. Note that in Figure 2 (right) the arrows pointopposite to the electric field to indicate the direction ofnegative polarity streamer motion. With this model, thehorizontal electric field can be computed by knowing thevertical lightning‐driven field and the streamer propagationdirection.
3.3. Estimating Charge in the Sprite Core
[15] By knowing the horizontal electric field along thepath of the upward streamers, we can bound the totalamount of charge in the bright core from which the negativestreamers initiate. In our model, this region is approximatedby a thin, negatively charged circular cylinder with avarying charge in both the radial direction (or horizontaldirection) and the vertical direction. The charge distributionin the radial direction and the radius of this charge distributionare not that important because for distance greater than theradius of the thin cylinder, the thin cylinder is nearly equiv-alent to a line source. Previous studies have revealed that theglowing trail after positive streamers is close to a conductor[Luque and Ebert, 2010]. Thus, more negative chargeshould appear at a surface layer of the bright conductingcore than in the center. To approximate that, we choose anexponential distribution in the horizontal direction with zerocharge at the center and more than 50% in a 50 m thicksurface layer. Determining the vertical charge distribution isa challenge since there is no existing charge distributionreported for the stage when the entire sprite is fully devel-oped. Thus we combine sprite optical emissions and previoussimulation results at the beginning stage of sprite develop-ment [Luque and Ebert, 2010] to determine this vertical
charge distribution. Features of the optical emissions enableus to estimate a reasonable vertical charge distribution alongthe sprite core. Figure 2b shows that significant opticalemissions are present along the entire vertical extent of thesprite core (except near its very top portion where the opticalemission transitions to highly diffuse [Pasko and Stenbaek‐Nielsen, 2002]). This indicates that normalized electric field(E/Ek) is not significantly less than unity at all altitudes. Wethus choose an exponential function to approximate thevertical charge distribution in the bright core so that thecharge density and Ek decay equally with altitude to ensure anearly constant normalized field at different altitudes. Sincethe inverse scale height of air density drop is 0.15 km−1
[Pasko et al., 1997], the charge density is thus given by
�core hð Þ ¼ �0 exp �0:15hð Þ: ð1Þ
Luque and Ebert [2010] has reported numerical simulationresults at the beginning stage of the sprite development, atwhich the glowing trail expands during the propagation ofdownward streamers. These simulation results show that at2 ms after the initiation of a positive streamer, the negativecharge amount in the glowing trail along the altitude isbetween uniform and exponential decay with an inversescale height of 0.25 km−1. In this work, we focused on thestage of full development, at which the bright core is static.Although not at the same stage of sprite development, theinverse scale height estimated from the optical emission isbetween the values from the simulation results. In this work,we choose the exponential delay with an inverse scale heightof 0.15 km−1 as the vertical charge distribution to estimatethe amount of charge in the bright core in the followingexamples. However, the uncertainty in the amount of chargecaused by a uniform or an exponential charge distributionwith the inverse scale height of 0.25 km−1 will be discussedin detail in section 4.1.1. With the assumed distribution, thetotal charge amount can be expressed by
Qcore ¼Z htop
hbot
�core hð Þdh; ð2Þ
Figure 2. (a) Image of a typical sprite including downward streamers, a bright core, and upward strea-mers. (b) Zoomed sprite upper part to show the bright core region and upward streamers. (c) A schematicshowing the model applied and the electric field components at upward streamer locations. Eh, Ez, and Etot
represent the horizontal, vertical, and total electric field. The arrow lines represent the opposite directionof electric fields, which is the moving direction for negative charges.
LI AND CUMMER: ESTIMATION OF ELECTRIC CHARGE IN SPRITES A01301A01301
4 of 13

where rcore is the vertical charge density in C/m, h is thealtitude in km. The altitudes of the top (htop) and the bottom(hbot) of the sprite core are measured from high‐speedimages. With the charge distribution known, we can com-pute the electric fields in radial and vertical directions pro-duced by static charges inside the bright core. In our model,a conducting ionosphere is set at 90 km altitude. Thus theimage of the bright core has been included when computingthe fields. The electric fields caused by the bright core arelinearly proportional to the total core charge Qcore that wewish to estimate.[16] By varying the one free parameter in the above
model, r0 or equivalently Qcore, we match the radial electricfield estimated from the streamer propagation direction andthereby obtain the total amount of charge in the sprite core.Table 1 shows the total sprite core charge Qcore required tomatch the inferred horizontal electric fields at the fourdifferent streamer tip locations shown in Figure 2. Despitethe inevitable noise in the measurements, the four inde-pendently computed values of Qcore for this one upwardstreamer agree extremely well. The total sprite core chargeis negative, as expected and discussed above, and isapproximately −0.02 C. The one measurement that dis-agrees slightly (a factor of 2) with the others is based on thelocation where the upward streamer initiates, which is veryclose to the bright core and thus the assumptions made inour model are expected to be the least valid in this location.However, for horizontal distances at least a few km awayfrom the bright core, the three measurements of the totalcharge agree within 25%, which validates the basic approachused. It should be mentioned that the bright core regionalso produces a vertical electric field, which contributes tothe total electric field at the streamer locations. However,in our examples, the vertical field produced by the core isless than 20% of the lightning‐driven fields at streamerlocations. Although less important when comparing to thelightning‐driven field, this field is still included by iterat-ing the computations until a match is found between thetotal electric field direction and the streamer propagationdirection.[17] This approach is easiest to apply to relatively simple
sprites in which individual cores and upward streamers arewell‐defined. In big and complex sprites it is difficult toapply. However, those sprites often contain measurablesprite current [Cummer, 2003] enabling an estimate of thecharge involved. In section 4.2, these two approaches arecompared.
3.4. Source of Electric Charge in Sprites
[18] Having established a method to estimate the negativespace charge present in the core region of sprites, we nowdiscuss the possible origin of this charge and the connectionbetween charges in the upper bright core and in the lowerdownward streamers. Some previous models [e.g., Raizeret al., 1998; Liu and Pasko, 2004, 2005] treat the con-ducting ionosphere as an electrode so that the electric chargein the sprite body is provided by the ionosphere through theionized channels and the channels themselves, i.e., the spritecore, is charge neutral. The example above shows that thisregion is not charge neutral. However, our model illustratedin Figure 2 simply enables computation of this charge anddoes not assume anything about the degree of electricalconnection to the ionosphere and thus does not directlyrelate the negative charge in the core to the positive chargein the downward streamers. Here we examine this issuethrough numerical simulations.[19] Figure 3a shows a scenario after a +CG lightning
return stroke but before the initiation of sprites. The simu-lation domain is a 2‐D cylinder with axial symmetry.Between 40 km and 90 km altitudes, the electrical potentialis set as 1100 kV, which is computed from a measuredlightning signal and FDTD simulations. To simplify theproblem, we use free space as the environment instead ofthe inhomogeneous mesosphere, which will not qualita-tively change the results. The color intensity represents theelectric potential and the arrow lines represent directions of
Table 1. Estimated Horizontal Electric Field and Total Amount ofCharges in the Bright Corea
StreamerLocation
Altitude(km)
Distance(km)
Ez (Lightning)(V/m)
Er (Core)(V/m) Qcore (C)
0 73.1 0.6 48.2 32.1 −0.0101 75.0 1.9 38.4 23.6 −0.0262 76.7 2.9 29.3 8.0 −0.0203 78.1 3.3 25.3 5.4 −0.023
aEz, the vertical electric field caused by lightning discharge; Er, theestimated horizontal electric fields produced by charges in the brightcore; Q, the total amount of charge inside the bright core.
Figure 3. The electrical potential and electric field direc-tion: (a) without a 3‐D conducting cylinder; (b) the con-ducting cylinder is perfectly connected to the ionosphereboundary; (c) the conducting cylinder is not connected tothe ionosphere boundary; (d) the conducting cylinder ispartially connected to the ionosphere boundary through aresistor.
LI AND CUMMER: ESTIMATION OF ELECTRIC CHARGE IN SPRITES A01301A01301
5 of 13

the local electric field. Similar to the results shown inFigure 2a, the electric fields point downward due to thefact that lower altitude has lower potential (negativelycharged thundercloud).[20] We next approximate the sprite body by a 30 km long
conducting cylinder and insert it into the computationdomain. Figure 3b shows the scenario when this cylinder isperfectly connected to the ionosphere boundary at 90 kmaltitude. Under this condition, the conducting cylinder willhave the same electrical potential as the ionosphere due toits high conductivity. Thus, current flows from the iono-sphere to the cylinder and leaves it positively charged in theentire region. Since the cylinder is approximated by a con-ductor, the electric charges are distributed on the surfaceof the cylinder. The shape of the triangle schematicallyrepresents the amount of charge along the surface of thecylinder. The polarity is also represented by the sign inside.The horizontal electric field created by these surface chargespoints away from the center. However, as shown earlier, theupward streamer propagation requires the local electric fielddirection pointing to the sprite. Therefore this disagreementimplies that the sprite cannot be perfectly connected to theionosphere.[21] Next we show the scenario where the conducing
cylinder is not connected to the ionosphere. In Figure 3c,there is no charge transfer between the cylinder and theionosphere, so the sprite has a zero net charge. However,free charges inside the cylinder will redistribute to maintaina zero electric field inside. This results in the top half thecylinder being negatively charged to form the bright coreregion while the bottom half the cylinder being positivelycharged to form the region of downward streamers. Theelectric field direction changes from pointing inward topointing outward along the cylinder from the top to thebottom. In the vicinity of the bright core, the electric fielddirection can satisfy the upward streamer motion direction.[22] We also examine a scenario between the two cir-
cumstances of perfectly connected and unconnected above.Figure 3d shows the simulation result when the sprite ispartially connected to the ionosphere through a resistor. Inthis case, current still flows from the ionosphere to theconducting cylinder but with a smaller amplitude due to theresistance. This results in positive net charges in the entirecylinder. However, before reaching the steady state, the toppart of the cylinder still contains negative charges to formthe bright core and the bottom part of the cylinder containspositive charges to form the region of downward streamers.Thus the electric field direction close to the bright core stillcan match the upward streamer motion direction.[23] These simulation results indicate that there must be
negative charges at the top part of the sprites to produceelectric field in the opposite direction of streamer motion.This negatively charged region is the bright core in sprites.To accomplish that, the sprite has to be unconnected(Figure 3c) or partially connected (Figure 3d) to the iono-sphere. For a given sprite , our method introduced abovecan be used to infer the amount of negative charge withinthe bright core no matter if the real situation is 3c or 3d. Ifthe scenario in Figure 3c is true, the amount of this negativecharge is the total charge inside the sprite body since the netcharge is zero. While if the scenario in Figure 3d is the realsituation, the amount of this negative charge is the lower
bound of the total charge since there are current flows fromthe conducting ionosphere, which can neutralize part of thenegative charge in the core region.
4. Results
4.1. Simple Sprites
[24] We now apply our approach to estimate charge inrelatively simple sprite elements produced by four differentlightning discharges. Figure 4 shows the full analysis of thesprite observed on 13 August 2005, 0343 UT. Althoughthis event has been partially described as the example insection 3.3, we provide the full details of this event in Figure 4for completeness. Figure 4 (top) shows the portions of thehigh‐speed sprite images recorded at 7200 frames per sec-ond that show just the upper part of the sprite. The timedelay in milliseconds from the parent lightning return strokeis labeled at the bottom of each image. This sprite containsonly one upward streamer on the left side of the bright core,and there is likely minimal interaction with streamers on theright side. Although the structure is relatively simple, it stillcontains all the features of a typical sprite like downwardstreamers and the bright upper core that develop simulta-neously, and upward streamers that develop about 1 ms later.[25] During the development of the upward streamer, the
shape and size of the sprite core do not change appreciably,and we thus assume the charge distribution in the core isstatic. The bright core has a height of 8 km and an apparentradius of 300 m in these high‐speed images, although weemphasize that the core radius does not affect our calcula-tion of the total core charge. The upward streamer initiatesabout 37 degrees from vertical and then bends toward thevertical direction during propagation. Figures 4b and 4cshow the measured azimuthal magnetic field, extractedcurrent moment waveform and charge moment change his-tory. The impulse charge moment change (iCMC) within thefirst 2 ms of lightning return stroke is ∼310 C km, which isconsistent with observations of the charge moment changein modest short delayed sprites [Cummer and Lyons, 2005;Hu et al., 2007]. Based on the extracted lightning sourcecurrent, we computed lightning‐driven electric fields, hori-zontal electric fields produced by the sprite core, and totalamount of charge, which have been shown in Table 1. Afteriterations with initial values, a best match between electricfield direction and streamer motion direction is achieved atQcore = −0.02 C. Figure 4d shows the total electric fields inthe vicinity of the bright core. Since the upward streamersare negative polarity, the direction opposite to the localelectric field is shown to indicate streamer propagationdirection. At each location of streamer tips, the streamerpropagates along this opposite direction of the total electricfields.[26] Figure 5 shows the simulation results for three more
sprites that occurred on different days. Figure 5 (top) showsindividual high‐speed images to show the relatively simpleupward streamer development. Figure 5 (bottom) shows theamplitude and direction of the inferred total electric field.These three sprites are morphologically similar to theexample shown in Figure 4. From each we extract spritecore charges of −0.009, −0.011, and −0.016 C. The overallrange from these four sprites varies by only a factor of 2.
LI AND CUMMER: ESTIMATION OF ELECTRIC CHARGE IN SPRITES A01301A01301
6 of 13

[27] In our simulations, sprite core altitude extent is animportant parameter determined from the images. Coreradius is not essential and can be used to check the consis-tency of the inferred sprite core charge. Figure 6 shows thenormalized electric fields in the radial direction (Figure 6a),vertical direction (Figure 6b) and the total electric fields(Figure 6c) produced by the lightning discharge and thesprite core with a total charge of −0.02 C over the entire300 m radius. In Figure 6a, a normalized field of Er/Ek = 0.9is observed at the surface throughout the entire altituderange of the sprite core. It should be noted that at a locationdirectly above the lightning discharge, the horizontal fieldproduced by the lightning is close to zero. Thus the hori-zontal electric fields are mainly produced by the charges insprites. Figure 6b shows the normalized fields in the verticaldirection. A maximum normalized field about 1.2 Ek appearsat the upper end of the cylinder. Luque and Ebert [2010] haspointed out that an ionization wave will be launched at thelocation where the field exceeds the breakdown field.However, this effect is not included in our results due to theelectrostatic model applied. Figure 6c shows the total electricfields. The maximum total electric fields appear at the surfaceof the sprite core and slightly vary from 1 to 1.2 Ek. This valueis consistent with the total field at the surface of the glowingtrail reported by Luque and Ebert [2010] and slightlygreater than the spectroscopic measurements reported by
Morrill et al. [2002]. However, this is still reasonable sincethe spectroscopic measurement can be the field inside thestreamer, where plenty of electrons exist. Both Liu [2010]and Luque and Ebert [2010] have reported that the totalfield inside is approximately Ek along most of the glowingtrail and quickly decay at the bottom part to the transitionpoint. Interestingly, despite the fact that our simple elec-trostatic model does not include the ionization wave anduses an approximate charge distribution profile, a similarpattern has been observed in Figure 6c. The total field ismore than 0.5 Ek in the upper half of the bright core andquickly decreases at the bottom part. The consistencybetween our measurement‐based results with independentresults from numerical simulations validates the approach.The strong field close to Ek at the outer surface also suggeststhat the persistent optical emission of the bright core is likelycaused by the local electric fields instead of chemical pro-cesses. Although, in a streamer, the strong optical emissionsdo not necessarily appear at the high field regions, theelectric field level does indicate the overall brightness of thestreamer [Liu and Pasko, 2004; Liu et al., 2009a].4.1.1. Measurement Sensitivity[28] As mentioned earlier, we have chosen an altitude‐
dependent charge distribution with the same scale height asair density. According to the simulation results reported byLuque and Ebert [2010], the charge amount along the alti-
Figure 4. Estimated charge and electric fields for a sprite that occurred at 0343 UT on 13 August 2005.(a) Sprite images recorded at 7200 frames per second showing upward streamer development. Thestreamer tip locations are labeled with diamonds. (b) Measured azimuthal magnetic field. (c) Extractedlightning current moment and charge moment change waveforms. (d) Total electric fields in the vicinityof the bright core with Qcore = −0.02 C. The color intensity represents the amplitude of the electric fields.The arrow lines represent the opposite direction of the total electric field (or motion direction of negativestreamers). A streamline from the streamer initiation location is drawn as a reference.
LI AND CUMMER: ESTIMATION OF ELECTRIC CHARGE IN SPRITES A01301A01301
7 of 13

tude is between uniform and an exponential decay with aninverse scale height of 0.25 km−1. Here we examine theuncertainty of the estimated charge amount caused byapplying different vertical profiles. Figure 7 shows theamplitude and the direction of total electric fields for threevertical charge distributions and estimated amount of charge.In Figure 7a, the amount of negative charge is −0.018 C andis uniformly distributed along the bright core. Figure 7bshows the results of exponential charge distribution withan inverse scale height of 0.15 km−1 and a total amountcharge of −0.02 C. Figure 7c shows the results of expo-nential charge distribution with an inverse scale height of0.25 km−1 and a total amount charge of −0.03 C. For all thethree simulation results, the total field direction agrees wellwith the upward streamer propagation direction. The threedifferent charge amounts indicate that the inverse scaleheight of 0.15 km−1 could result in an under estimation by asmuch as 50%. Thus, the amount of charge estimated withthis distribution profile is a lower bound.[29] For a fixed vertical distribution, we next examine the
sensitivity of our measurement by analyzing how the totalelectric field direction is affected by the amount of charge inthe bright core. Figure 8a again shows the developmenthistory of the upward streamer in Figure 4 but in a singleimage. Figures 8b, 8c, and 8d show the total electric fieldcaused by the same lightning discharge but three differentamount of charge in the bright core region. Figure 8b againshows the local electric field with the estimated Qcore =−0.02 C, in which the streamer propagation direction agreewell with the opposite local electric field direction. In the
results of Figures 8c and 8d, we varied Qmcore up and downby a factor of four to test the sensitivity between the fielddirection and the amount of charge in the core. It is clear thatelectric fields from neither of the two settings match theobserved direction of streamer propagation. The fielddirection is too vertical for Q = −0.005 C and is too hori-zontal for Q = −0.08 C. This indicates that the total electricfield direction is sensitive to the total charge in the core, andour approach can be used to reliably infer the total spritecore charge by significantly less than a factor of four. How-ever, several observational uncertainties can also influence
Figure 5. Streamer development history and simulated electric field for three dim sprites. (top) Streamerdevelopment history. (bottom) Amplitude and opposite direction of total electric fields.
Figure 6. Normalized electric fields (E/Ek) caused by light-ning and sprite. (a) Electric fields in the horizontal direction.(b) Electric fields in the vertical direction. (c) Total electricfields.
LI AND CUMMER: ESTIMATION OF ELECTRIC CHARGE IN SPRITES A01301A01301
8 of 13
the results. The first is the measured altitude of the sprite core.In our model, the entire altitude extent of the sprite core ismeasured from the high‐speed images. On those images, thebottom boundary of the bright core is sharp and can be clearlydetermined. The very top region of the bright core is muchdimmer and diffuse [Pasko and Stenbaek‐Nielsen, 2002],which is not included in the charge estimation. Thus, inFigures 2 and 4, the 8 km height is the lower bound for thecharge region. Although the altitude extent of the sprite coreis used in the calculation, the resulting total sprite corecharge does not depend sensitively on it. In our model, thesimulation result is not very sensitive to the maximumaltitude of the bright core. This is because most of the chargeis in the bottom part of the cylinder due to the exponentialcharge distribution profile applied. For example, in Figure 4,if we increase the height of the cylinder by 50% (to 12 km)but keep the bottom and the total charge amount the same,the horizontal fields at the streamer locations vary about10%–30%. Thus, excluding the dimmer and diffuse topregion does not significantly change the estimated amount ofcharge. When estimating the sprite core altitude, we assumedthat sprites occurred directly above their parent lightningdischarge. The unknown offset between them (perhaps a fewtens of km [Wescott et al., 2001]) contributes an overallaltitude uncertainty of approximately ±3 km. This uncertaintyis constant in the entire altitude extent of the bright core. Byshifting the entire core up or down by 3 km, our results showthat the estimated amount of charge can vary up to 50%.[30] The second is the viewing angle. Due to the fact the
propagation direction of upward streamers on the high‐speed images is actually the 2‐D projection of a 3‐D sprite,the horizontal component of upward streamer propagationcan be greater than appearing on the images, which impliesa higher field in horizontal direction and more charge in theupper bright core. These limitations can only be removed bytriangulation of sprite locations. It should be noted thatthe above estimated charge amount in the bright core is atthe stagewhere upward streamer become fully developed. Thisis close to the stage of sprite maximum brightness. The
charge motion after the analyzing time is not included. Alsoduring the propagation of upward streamers, we haveassumed that the charge distribution in the core is static anddoes not change. In reality, downward streamers may stilldevelop and introduce moving charges in the bright core andupward streamers. This may introduce an error in the esti-mated amount of charge. However, due to the fact that thesize and shape of the bright core do not vary appreciably, the
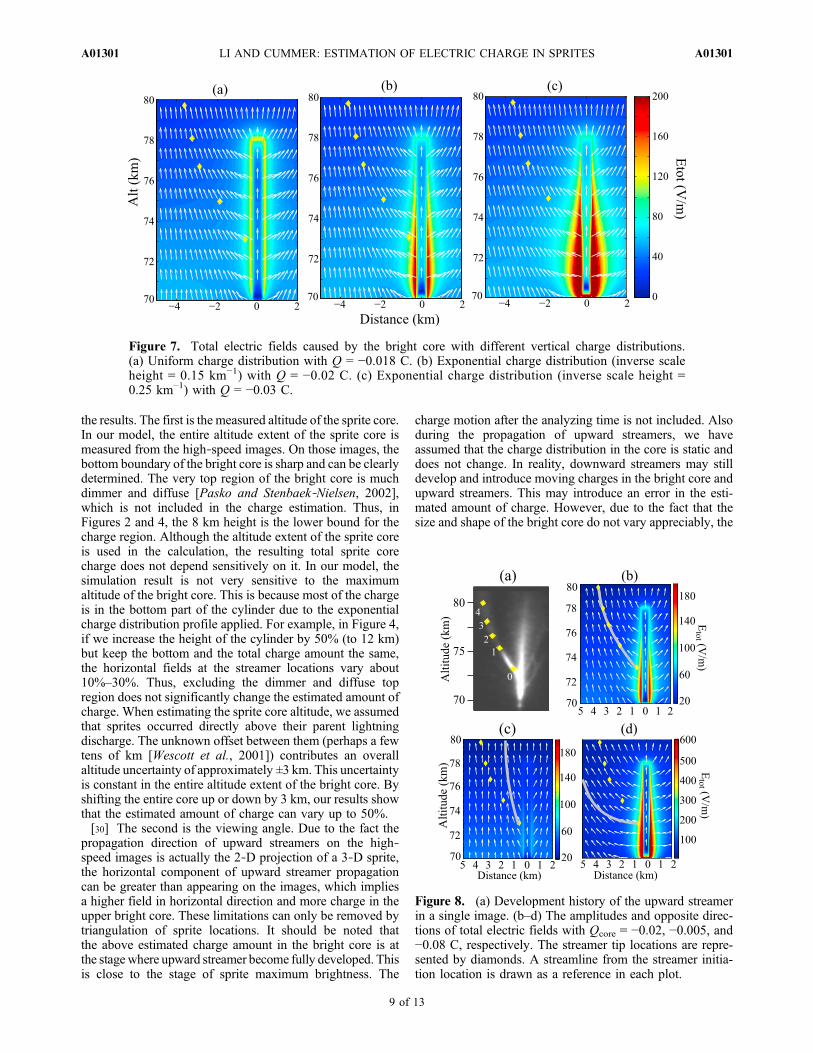
Figure 7. Total electric fields caused by the bright core with different vertical charge distributions.(a) Uniform charge distribution with Q = −0.018 C. (b) Exponential charge distribution (inverse scaleheight = 0.15 km−1) with Q = −0.02 C. (c) Exponential charge distribution (inverse scale height =0.25 km−1) with Q = −0.03 C.
Figure 8. (a) Development history of the upward streamerin a single image. (b–d) The amplitudes and opposite direc-tions of total electric fields with Qcore = −0.02, −0.005, and−0.08 C, respectively. The streamer tip locations are repre-sented by diamonds. A streamline from the streamer initia-tion location is drawn as a reference in each plot.
LI AND CUMMER: ESTIMATION OF ELECTRIC CHARGE IN SPRITES A01301A01301
9 of 13

amount of these moving charges should be much smallercomparing to the amount of existing charge in the brightcore.4.1.2. Estimated Downward Streamer Charge[31] Because the sprite cores develop as the top part of the
downward moving positive streamers in sprites [Stanleyet al., 1999; Cummer et al., 2006; Stenbaek‐Nielsen andMcHarg, 2008], it is physically plausible to interpret thenegative sprite core charge as the source of at least some ofthe positive charge in the downward streamers. Section 3.4above discussed the implications of the degree of electricalconnection of the sprite core to the ionosphere and showedthat this connection cannot be too strong, otherwise negativespace charge could not persist. Moreover, the subsequentupward streamers in sprites generally form in bright, fastmoving sprites [Cummer et al., 2006], which suggests thepossibility that these upward streamers form because thedownward positive streamers require more charge thanthe sprite core can provide, and the subsequent negativestreamers are how the system can provide more positivecharge to the lower‐altitude sprite features. These streamersare further evidence that the electrical connection between
the sprite core and the ionosphere is not strong. If it were,the ionosphere could provide any needed charge and thenegative streamers would not be needed.[32] We acknowledge that some positive charge to the
downward streamers may be supplied by the ionosphere.However, if we assume that sprites are not connected to theconducting ionosphere, we can obtain a lower bound on theaverage charge in each downward streamer simply throughcounting the downward streamer tips and combining theresult with the inferred sprite core charge. Figure 9 showsthe bottom part of the first sprite analyzed. There are a totalof 11 discernable downward streamers terminating in the50–60 km altitude range. Thus the average charge in eachdownward streamer tip is about 0.02/11 = 1.8 × 10⁻³ C. Itshould be emphasized again that if the sprite is partiallyconnected to the ionosphere (as shown in Figure 3d), thisestimated amount of charge in the bright core and downwardstreamers is the lower bound due to the positive chargesprovided by the ionosphere. Based on the number ofobserved downward streamers at the time of the upwardstreamer in all four events analyze here, the estimated lowerbound on the charge in each downward streamer at fulldevelopment varies over the relatively small range of 1.8–5.5 × 10⁻³ C. These calculations for each observed sprite aresummarized below in Table 2.
4.2. Bright Sprites
[33] Applying the above approach to big and bright spritesis more challenging because individual upward streamersare not always easy to identify, and downward streamers canbe too numerous to easily count. However, sprites withstrong optical emissions are sometimes accompanied withdetectable radio emissions, which allows us to estimate thetotal charge transfer in sprites by extracting the sprite currentand charge moment waveforms [Cummer et al., 1998]. Inthis section we apply both of these approaches to estimatethe charge in two bright sprites.[34] Figure 10 shows a close‐up of a bright, multielement
sprite recorded on 13 August 2005 at 0414 UT. There areapproximately 10 individual sprite elements at the time ofmaximum brightness, but only one of them produced anysubsequent upward streamers at the time of maximumbrightness. The total lightning charge moment change at thetime of peak brightness was 400 C km. In this event, theheight of the bright core is about 8 km with the bottom at70 km altitude. The measured core radius is about 440 m.Figure 10b shows the total electric field in the vicinity of the
Table 2. Summary of the Six Events Analyzeda
EventNumber
CMC(C km)
Upward StreamerAngle (deg) hcore (km) rcore (m) Qcore (C)
Downward StreamerNumber Average Qdown (C)
SpriteCurrent
Q (C)(Sprite Current)
1 300 30 12 <350 −0.009 3 3.0 × 10⁻³ no N/A2 330 31 11 240 −0.011 2 5.5 × 10⁻³ no N/A3 330 28 13 <350 −0.016 4 4.0 × 10⁻³ no N/A4 410 37 8 300 −0.020 11 1.8 × 10⁻³ no N/A5 440 36 8 400 −0.028 7 4.0 × 10⁻³ no N/A6 540 22 ∼10 420 −0.034 >10 3.4 × 10⁻³ yes −0.08
aIncludes lightning charge moment change, upward streamer departure angle, bright core height and radius, total charge in the bright core estimated fromupward streamers, number of downward streamers, average charge in each downward streamer, detectable radio emissions from the sprite (sprite current),and total charge estimated from the sprite current. The lightning charge moment change (CMC) is computed up to the time of the upward streamerdevelopment.
Figure 9. Image of downward streamers for sprite detectedat 0343 UT on 13 August 2005. There are a total of 11downward streamers terminating between 50 and 60 kmaltitudes.
LI AND CUMMER: ESTIMATION OF ELECTRIC CHARGE IN SPRITES A01301A01301
10 of 13

bright core, and we infer a total sprite core charge of −0.028 C.Figure 10c shows the normalized total electric field as aconsistency check. At the surface of the cylinder, the maxi-mum normalized electric field is about 1.1–1.3 Ek, which issimilar to the event shown in Figure 6. In this sprite element,there are seven distinct downward streamers observed. Thusthe average charge in each downward streamer is ∼4 × 10⁻³ C,still in excellent agreement with the simpler sprites analyzedin section 4.1. Lastly, we analyze in detail a sprite for whichwe can clearly detect sprite currents but still identify indi-vidual sprite elements from the images. Figure 11 shows abright sprite detected on 13 August 2005 at 0325 UT. Thehigh‐speed image (Figure 11a) shows that there are at least 17identifiable sprite elements, each with a single sprite core, inthis bright sprite. Accounting for some elements that areprobably obscured because they are in front of or behind thebright elements in the middle, we estimate that there areabout 30 distinct cores in this sprite. Figure 11b shows theremotely measured magnetic field in the azimuthal direction.This magnetic field includes the radiation from both light-ning discharge and current flows inside the sprite body. Thetwo black lines represent the time of sprite initiation andmaximum brightness. The second peak in the measuredmagnetic field is the radiation from the sprite. After applyingthe deconvolution technique, we separate the current momentand charge moment history from the two different sources.Figure 11c shows the lightning current moment and chargemoment change. The impulse charge moment change of thelightning discharge is close to 500 C km, which is consistentwith the observed bright and short delayed sprite [Hu et al.,2007]. Figure 11d shows the current moment waveform ofcurrent flows in the sprite. At the time of maximum spritebrightness, the total sprite charge moment change is about75 C km. Since the downward streamers on average travelfrom ∼75 km to ∼45 km altitude, and spreading this chargeequally over 30 cores, the average charge transfer in eachsprite element over this distance is about −0.08 C. If nocharge is supplied by the ionosphere, this is also the averagenegative charge present in a single sprite core.[35] We now estimate the same value from the upward
streamer directions. Figure 12a shows the upward streamerdevelopment history for a sprite element. From the high‐speed images, the upward streamer travels from 69 to 73 km
altitude. The bottom of the bright core is at 67 km altitude.The top of the bright core cannot be clearly determined dueto the fact that it merged into optical emissions from othersprite elements, but lies between 74 and 78 km. However,as mentioned earlier, the total amount charge in the brightcore is not very sensitive to the height of the bright core.Thus we choose a length of 10 km, which falls in the aboverange and is a typical value for the length of the bright core.
Figure 10. (a) Upward streamer development history for one of the sprite elements detected at 0414 UTon 13 August 2005. (b) Total electric field in the vicinity of the bright core with Q = −0.028 C. (c) Nor-malized total electric fields in the vicinity of the bright core.
Figure 11. (a) High‐speed video for a bright sprite detectedat 0325 UT on 13 August 2005. (b) Measured azimuthalmagnetic field. (c) Current moment and charge momentchange history of the sprite‐producing lightning. (d) Currentmoment and charge moment change history of the sprite.The black lines represent the time of sprite initiation andmaximum brightness.
LI AND CUMMER: ESTIMATION OF ELECTRIC CHARGE IN SPRITES A01301A01301
11 of 13

The radius of the bright core is 420 m measured from high‐speed images. A best match between the streamer propa-gation direction and the total electric field is achievedwhen the total sprite core charge is −0.034 C. This is withinapproximately a factor of 2.5 of the completely independentestimate obtained from the sprite current measurements.Figure 12b shows the amplitude and direction of the totalelectric field. A consistency check is also performed bylooking at the normalized electric field at the boundary ofthe 3‐D cylinder. In this event, the maximum normalizedelectric field (Etot/Ek) is 0.75‐1.1 Ek at r = 420 m, perfectlyin line with expectations from the events shown in Figures 6and 10. Again, the high field level at the surface of the brightcore indicates that the persistent optical emission is likelyproduced by instantaneous electric fields instead of long‐duration chemical processes. Due to the complexity of thesprite structure, the number of downward streamers inthis sprite element cannot be accurately determined whenmerging with streamers from other sprite elements. How-ever, at least 10 downward streamers can be identified in theimages. Thus the average charge amount in each downwardstreamer is about 3.4 × 10⁻³ C, still completely in line with theestimated charge per positive streamer in the other events.
4.3. Measurement Summary
[36] Here we summarize our results for all the six eventsanalyzed in Table 2. These events are listed in the order ofincreasing lightning charge moment change at the time ofthe upward streamer development, which is a good indicatorof the background lightning‐driven electric field. Thesecharge moment changes are consistent with results reportedby Hu et al. [2007] for short delayed [Li et al., 2008] dimand bright sprites. Table 2 immediately reveals some con-nections between different features. Except for the lastevent, the upward streamer departure angles are close to 30–35 degrees from vertical. This indicates at the location ofstreamer tips, the horizontal electric field produced by thebright core is about 60.[37] The radius of the bright core also appears to be
related to the amount of charge inside, with a larger radiusimplying more total charge. It should be emphasized that theradius in events 1 and 3 are probably overestimated due tothe spatial resolution of the image. More downward strea-mers from a single sprite core are also observed in those
events with more charge in the core. This indicates that theamount of charge in the bright core is also connected to thebranching of downward streamers. This in turn is consistentwith the idea that the downward streamers dictate how muchcharge is pulled from the sprite core and whether or notsubsequent upward negative streamers are required to sup-ply this charge.
5. Conclusions
[38] In this work, we have estimated the total electriccharge in sprites using a measurement‐based approach thatbuilds on model and measurement based estimates of thelightning‐driven background electric fields in the meso-sphere and observations from high‐speed video of thepropagation direction of upward streamers that initiate fromthe bright core region of sprites. Assuming the streamerspropagate along the direction of local electric fields, and thatthe local electric fields are modified by space charge presentin the sprite core, we have inferred the total electric chargein the observed sprite cores that is consistent with theobserved streamer propagation directions.[39] In six separate sprites we find that individual bright
sprite cores contain significant negative space charge thatranges between −0.009 C to −0.034 C. Accounting for theuncertainties caused by using different vertical charge dis-tributions, these values could be as much as 50% higher.Detailed electrostatic simulations show that this amount ofcharge, when spread over the observed core sizes of severalhundred meters in diameter and approximately 10 km inlength, results in a local electric field at the outer edges ofthe sprite core close to the breakdown field. This is con-sistent with the recent simulation results reported by Luqueand Ebert [2010] and provides an independent validation ofour inferred charges. Moreover, this indicates that the rela-tively long duration (several milliseconds) optical emissionstypically observed from sprite cores [Cummer et al., 2006]are driven predominantly by instantaneous local electricfields and not by long‐duration chemistry initiated by pre-vious energy input.[40] Given this significant negative charge, we interpret
the sprite core region as the partial and perhaps dominantsink of the negative charge created by the downward positivepolarity streamers. This notion is supported by numerical
Figure 12. (a) Upward streamer development history for one sprite element. (b) Total electric field in theadjacent region of the bright core with Q = −0.034 C. (c) Normalized total electric field.
LI AND CUMMER: ESTIMATION OF ELECTRIC CHARGE IN SPRITES A01301A01301
12 of 13

simulations that show that only a weak or nonexistent elec-trical connection between the ionosphere and the downwardstreamer results in significant negative charge at the top ofthe streamer channel. This further suggests that subsequentnegative polarity upward streamers that appear in somesprites a few milliseconds after initiation are created whenthe downward positive sprite streamers require more chargethan can be supplied by this sprite core. This is consistentwith observations that show the subsequent upward strea-mers are not always present, especially in smaller sprites.[41] Assuming that the sprite core is the source of all of
the positive charge in the downward streamers, we find thatthe average downward streamer contains a charge of at least2–4 × 10⁻³ C. Observed sprite current in one bright spritesuggests a positive charge in each distinct downwardstreamer that is only 2.5 times larger than this lower bound.This indicates that our estimate of the positive charge indownward sprite streamers and the negative charge in thesprite core is physically reasonable, and also that the chargemotion from the sprite core to the downward streamers is alikely source of sprite current. Although our detailed resultsare partially influenced by the assumptions in the electro-static model and the uncertainties in the measurements, theprimary conclusions regarding the charge magnitude and theorigin of the sprite core optical emission are not significantlyaffected. This work can be a step to further constrain thedetailed physical and chemical models that can predict theimpact of sprites on the mesosphere.
[42] Acknowledgments. Robert Lysak thanks the reviewers for theirassistance in evaluating this paper.
ReferencesBriels, T. M. P., J. Kos, G. J. J. Winands, E. M. van Veldhuizen, and U. Ebert(2008), Positive and negative streamers in ambient air: Measuring diame-ter, velocity and dissipated energy, J. Phys. D Appl. Phys., 41, 234004,doi:10.1088/0022-3727/41/23/234004.
Cummer, S. A. (2003), Current moment in sprite‐producing lightning,J. Atmos. Sol. Terr. Phys., 65, 499–508.
Cummer, S. A., and U. S. Inan (1997), Measurement of charge transfer insprite‐producing lightning using ELF radio atmospherics, Geophys. Res.Lett., 24(14), 1731–1734, doi:10.1029/97GL51791.
Cummer, S. A., and W. A. Lyons (2005), Implications of lightning chargemoment changes for sprite initiation, J. Geophys. Res., 110, A04304,doi:10.1029/2004JA010812.
Cummer, S. A., U. S. Inan, T. F. Bell, and C. P. Barrington‐Leigh (1998),ELF radiation produced by electrical currents in sprites, Geophys. Res.Lett., 25(8), 1281–1284, doi:10.1029/98GL50937.
Cummer, S. A., N. Jaugey, J. Li,W.A. Lyons, T. E. Nelson, and E. A. Gerken(2006), Submillisecond imaging of sprite development and structure,Geophys. Res. Lett., 33, L04104, doi:10.1029/2005GL024969.
Ebert, U., C. Montijn, T. M. P. Briels, W. Hundsdorfer, B. Meulenbroek,A. Rocco, and E. M. van Veldhuizen (2006), The multiscale nature ofstreamers, Plasma Sources Sci. Technol., 15, s118–s129.
Gerken, E. A., U. S. Inan, and C. P. Barrington‐Leigh (2000), Telescopicimaging of sprites, Geophys. Res. Lett., 27(17), 2637–2640, doi:10.1029/2000GL000035.
Hu, W., S. A. Cummer, W. A. Lyons, and T. E. Nelson (2006), An FDTDmodel for low and high altitude lightning‐generated EM fields, IEEETrans. Antennas Propag., 54(5), 1513–1522.
Hu, W., S. A. Cummer, and W. A. Lyons (2007), Testing sprite initiationtheory using lightning measurements and modeled electromagneticfields, J. Geophys. Res., 112, D13115, doi:10.1029/2006JD007939.
Li, J., and S. A. Cummer (2009), Measurement of sprite streamer acceler-ation and deceleration, Geophys. Res. Lett., 36, L10812, doi:10.1029/2009GL037581.
Li, J., S. A. Cummer, W. A. Lyons, and T. E. Nelson (2008), Coordinatedanalysis of delayed sprites with high‐speed images and remote electromag-netic fields, J. Geophys. Res., 113, D20206, doi:10.1029/2008JD010008.
Liu, N. (2010), Model of sprite luminous trail caused by increasingstreamer current, Geophys. Res. Lett., 37, L04102, doi:10.1029/2009GL042214.
Liu, N., and V. P. Pasko (2004), Effects of photoionization on propagationand branching of positive and negative streamers in sprites, J. Geophys.Res., 109, A04301, doi:10.1029/2003JA010064.
Liu, N., and V. P. Pasko (2005), Molecular nitrogen LBH band systemfar‐UV emissions of sprite streamers, Geophys. Res. Lett., 32,L05104, doi:10.1029/2004GL022001.
Liu, N., V. P. Pasko, H. U. Frey, S. B. Mende, H.‐T. Su, A. B. Chen, R.‐R.Hsu, and L.‐C. Lee (2009a), Assessment of sprite initiating electric fieldsand quenching altitude of a 1Pg state of N2 using sprite streamer model-ing and ISUAL spectrophotometric measurements, J. Geophys. Res.,114, A00E02, doi:10.1029/2008JA013735.
Liu, N. Y., V. P. Pasko, K. Adams, H. C. Stenbaek‐Nielsen, and M. G.McHarg (2009b), Comparison of acceleration, expansion, and brightnessof sprite streamers obtained from modeling and high‐speed video obser-vations, J. Geophys. Res., 114, A00E03, doi:10.1029/2008JA013720.
Luque, A., and U. Ebert (2009), Emergence of sprite streamers fromscreening‐ionization waves in the lower ionosphere, Nat. Geosci., 2,757–760, doi:10.1038/NGE0662.
Luque, A., and U. Ebert (2010), Sprites in varying air density: Charge con-servation, glowing negative trails and changing velocity, Geophys. Res.Lett., 37, L06806, doi:10.1029/2009GL041982.
Luque, A., V. Ratushnaya, and U. Ebert (2008), Positive and negativestreamers in ambient air: Modeling evolution and velocities, J. Phys.D Appl. Phys., 41, 234005, doi:10.1088/0022-3727/41/23/234005.
McHarg, M. G., H. C. Stenbaek‐Nielsen, and T. Kammae (2007), Observa-tions of streamer formation in sprites, Geophys. Res. Lett., 34, L06804,doi:10.1029/2006GL027854.
Morrill, J. S., E. J. Bucsela, V. P. Pasko, S. L. Berg, M. J. Heavner, D. R.Moudry, W. M. Benesch, E. M. Wescott, and D. D. Sentman (1998),Time resolved N2 triplet state vibrational populations and emissionsassociated with red sprites, J. Atmos. Sol. Terr. Phys., 60, 811–829.
Morrill, J. S., et al. (2002), Electron energy and electric field estimates insprites derived from ionized and neutral N2 emissions, Geophys. Res.Lett., 29(10), 1462, doi:10.1029/2001GL014018.
Pasko, V. P. (2007), Red sprite discharges in the atmosphere at high altitude:The molecular physics and the similarity with laboratory discharges, PlasmaSources Sci. Technol., 16, s13–s29, doi:10.1088/0963-0252/16/1/S02.
Pasko, V. P., and H. C. Stenbaek‐Nielsen (2002), Diffuse and streamerregions of sprites, Geophys. Res. Lett., 29(10), 1440, doi:10.1029/2001GL014241.
Pasko, V. P., U. S. Inan, and T. F. Bell (1997), Sprite produced by quasi‐electrostatic heating and ionization in the lower ionosphere, J. Geophys.Res., 102(A3), 4529–4561, doi:10.1029/96JA03528.
Raizer, Y., G. Milikh, M. Shneider, and S. Novakovski (1998), Longstreamer in the upper atmosphere above thundercloud, J. Phys. D Appl.Phys., 31, 3255–3264.
Sentman, D. D. (1995), Preliminary results from the Sprites94 aircraftcampaign: 1. Red sprite, Geophys. Res. Lett., 22(10), 1205–1208,doi:10.1029/95GL00583.
Sentman, D. D., H. C. Stenbaek‐Nielsen, M. G. McHarg, and J. S. Morrill(2008), Plasma chemistry of sprite streamers, J. Geophys. Res., 113,D11112, doi:10.1029/2007JD008941.
Stanley, M. S., P. Krehbiel, M. Brook, C. Moore, W. Rison, and B. Abrahams(1999), High‐speed video of initial sprite development, Geophys. Res.Lett., 26(20), 3201–3204, doi:10.1029/1999GL010673.
Stenbaek‐Nielsen, H., and M. G. McHarg (2008), High time‐resolutionsprite imaging: Observations and implications, J. Phys. D Appl. Phys.,41, 234009.
Stenbaek‐Nielsen, H., D. R. Moudry, E. M. Wescott, D. D. Sentman, andF. T. S. Sabbas (2000), Sprites and possible mesospheric effect, Geophys.Res. Lett., 27(23), 3829–3832, doi:10.1029/2000GL003827.
Stenbaek‐Nielsen, H., M. G. McHarg, T. Kanmae, and D. D. Sentman(2007), Observed emission rates in sprite streamer heads, Geophys.Res. Lett., 34, L11105, doi:10.1029/2007GL029881.
Wescott, E. M., H. C. Stenbaek‐Nielsen, D. D. Sentman, M. J. Heavner,D. R. Moudry, and F. T. S. Sabbas (2001), Triangulation of sprites,associated halos and their possible relation to causative lightning andmicrometeors , J . Geophys. Res. , 106 (A6), 10,467–10,477,doi:10.1029/2000JA000182.
S. Cummer and J. Li, Department of Electrical and ComputerEngineering, DukeUniversity, Durham, NC 27708, USA. ([email protected])
LI AND CUMMER: ESTIMATION OF ELECTRIC CHARGE IN SPRITES A01301A01301
13 of 13