Estimation of condensate mass flow rate during purging ... OnLine-First/0354... · Estimation of...
15
1 Estimation of condensate mass flow rate during purging time in heat recovery steam generator of combined cycle power plant Ehyaei,M.A (1) (1) Assistant Professor of Islamic Azad University, Pardis Branch, P.O. Box 16555/135, Pardis New City, Tehran,Iran, Tel:+98-21-88092344 E-mail: [email protected] Abstract: In this paper the transient modeling of HRSG (Heat recovery steam generator) in purging time was considered. In purging time, compressed air from the gas turbine was used to purge a combustible gas from HRSG. During this time; steam condensate was formed in the superheater stage which should be drained completely to avoid some problems such as deformation of superheaters. Because of this reason, estimation of drain formation is essential to avoid this problem. In this paper an energy model was provided and this model was solved by MATLAB software. Average model error is about 5%. Results show that, during purge time, steam temperature was decreased from 502 ( o C) (Superheater 2), 392 ( o C) (Superheater1) and 266 ( o C) (Evaporators 1&2) to 130 ( o C), 130 ( o C) and 220 ( o C), respectively and also steam pressure was decreased from 52 (bar) to 23(bar) during purge time. At end of purge time, condensate formation was about 220 (l) when inlet gas temperature was equal to 100 ( o C) and purge gas mass flow rate was equal to 386.86 (kg/s). Keywords: purging, condensate, heat, recovery 1- Introduction Heat recovery steam generator or (HRSG) is an energy recovery heat exchanger that recovers heat from a hot gas stream. It produces steam that can be used in a process or used to drive a steam turbine. A common application for an HRSG is in a combined-cycle power station, where hot exhaust from a gas turbine is fed to a HRSG to generate steam which in turn drives a steam turbine. This combination produces electricity more efficiently than either the gas turbine or steam turbine alone [1]. Heat recovery steam generation has three different operation modes, normal, startup and shutdown that in a combined-cycle, startup procedure is separated into three primary phases, purging of HRSG; gas turbine speed-up, synchronization, and loading; and steam turbine speed-up, synchronization, and loading [2]. In purging time, compressed air from the gas turbine is used to purge combustible gases from HRSG, during this time; condensate is formed in the superheater . Purging required as a precondition to start the gas turbine through the boiler, is a common requirement of all boiler codes to ensure safety operation of the plant. This rule is historically evolved, since in the beginning of boiler operation severe accidents occurred [3-4]. During purging time,
Transcript of Estimation of condensate mass flow rate during purging ... OnLine-First/0354... · Estimation of...
1
Estimation of condensate mass flow rate during purging time in heat recovery steam
generator of combined cycle power plant
Ehyaei,M.A (1)
(1) Assistant Professor of Islamic Azad University, Pardis Branch, P.O. Box 16555/135,
Pardis New City, Tehran,Iran, Tel:+98-21-88092344
E-mail: [email protected]
Abstract: In this paper the transient modeling of HRSG (Heat recovery steam generator) in
purging time was considered. In purging time, compressed air from the gas turbine was used
to purge a combustible gas from HRSG. During this time; steam condensate was formed in
the superheater stage which should be drained completely to avoid some problems such as
deformation of superheaters. Because of this reason, estimation of drain formation is essential
to avoid this problem. In this paper an energy model was provided and this model was solved
by MATLAB software. Average model error is about 5%. Results show that, during purge
time, steam temperature was decreased from 502 (oC) (Superheater 2), 392 (
oC)
(Superheater1) and 266 (oC) (Evaporators 1&2) to 130 (
oC), 130 (
oC) and 220 (
oC),
respectively and also steam pressure was decreased from 52 (bar) to 23(bar) during purge
time. At end of purge time, condensate formation was about 220 (l) when inlet gas
temperature was equal to 100 (oC) and purge gas mass flow rate was equal to 386.86 (kg/s).
Keywords: purging, condensate, heat, recovery
1- Introduction
Heat recovery steam generator or (HRSG) is an energy recovery heat exchanger that recovers
heat from a hot gas stream. It produces steam that can be used in a process or used to drive a
steam turbine. A common application for an HRSG is in a combined-cycle power station,
where hot exhaust from a gas turbine is fed to a HRSG to generate steam which in turn drives
a steam turbine. This combination produces electricity more efficiently than either the gas
turbine or steam turbine alone [1]. Heat recovery steam generation has three different
operation modes, normal, startup and shutdown that in a combined-cycle, startup procedure is
separated into three primary phases, purging of HRSG; gas turbine speed-up,
synchronization, and loading; and steam turbine speed-up, synchronization, and loading [2].
In purging time, compressed air from the gas turbine is used to purge combustible gases
from HRSG, during this time; condensate is formed in the superheater . Purging required as
a precondition to start the gas turbine through the boiler, is a common requirement of all
boiler codes to ensure safety operation of the plant. This rule is historically evolved, since in
the beginning of boiler operation severe accidents occurred [3-4]. During purging time,
2
condensate is formed in the superheater . If the condensate is not completely drained from
all superheater tubes before steam flow is established during the start up, two adverse
consequences are result [5]:
First, condensate that often is still sub-cooled is ejected in large quantity into the
outlet header and pipe manifold where it quench-cools hotter material. On hot starts
after trips, the outlet header and manifold can be more than 200 oC above saturation
temperature. During warm starts, the outlet header will be close to saturation
temperature but the outlet manifold temperature will still be substantially higher.
Second, tubes have different average temperatures at different times because they do
not clear of condensate simultaneously. Some tubes will be clear of condensate and
therefore will be cooled by steam flow, while others will have part of the tube filled
with condensate at saturation or lower temperature. Still other tubes will be stagnant
and therefore at the purge air or exhaust gas temperature. Designs that have stiff tube
arrangements connected to headers at each end develop. Thus, the unit will develop
large stresses at tube-attachment welds when other tubes in the same row are at
different temperature.
To eliminate both of these effects, the condensate needs to be removed from the lower
headers at the peak rate at which it forms. But that is not easily accomplished. Many
researchers have been conducted about modeling of HRSG [6-11]. Dechamps described a
method used to compute the transient performances of assisted circulation heat recovery
steam generators. In his mathematical modeling bundle of tubes in each part of HRSG
replaced with ‘equivalent’ linear heat exchanger [6]. Valdes et.al proposed a methodology to
identify the most relevant design parameters that impact on the thermal efficiency and the
economic results of combined cycle gas turbine power plants in full and part loads [7].
Mohagheghi et.al developed a new method for modeling a steam cycle in advanced combined
cycles by organizing non-linear equations and their simultaneous solutions by use of the
hybrid Newton methods [8]. Godoy et.al proposed Optimal designs of a CCGT power plant
characterized by maximum second law efficiency values. These thermodynamic optimal
solutions were found within a feasible operation region by means of a non-linear
mathematical programming (NLP) model, where decision variables (i.e. transfer areas, power
production, mass flow rates, temperatures and pressures) could vary freely [9] . Woudstra
et.al investigated internal exergy efficiency for combined cycles used the same gas turbine
but have different steam bottoming cycles. Differences did originate from the number of
3
pressure levels at which steam is generated in the HRSG (Heat Recovery Steam Generator).
The evaluation includes respectively a single pressure, double pressures and triple pressures
HRSG. The steam pressures were optimized with regard to overall plant efficiency using a
multi-parameter optimization procedure. They showed that internal exergy evaluation was
useful method to cycle performance promotion [10]. Bahadori et.al provided a simple model
to estimation of the percent of blowdown that is flashed to steam as a function of flash drum
pressure and operating boiler drum pressure followed by the calculation of the amount of heat
recoverable from the condensate [11].
Due to literature survey, no research has been conducted the HRSG during purging time. In
this paper, transient modeling of HRSG to estimate of condensate mass flow rate during
purging time was conducted. For this purpose, a transient analytical modeling of HRSG was
prepared and the effect of cooling gas temperature and mass flow rate on condensate was
investigated. In addition effect of purge time on condensate was also considered. In
summary, the followings are the specific contribution of this study in the subject matter area:
Transient modeling of heat recovery steam generator (HRSG), especially during
purge time
Comparing the numerical output of the model with the actual measurements at a real
power plant,
A computer program code was developed in the MATLAB which could be applied
for simulation of any types of HRSG,
2- System description
The typical power and steam generation plant, which we considered in this research consists
of the followings items:
Gas turbine and generator: Four 4 V94.2 gas turbine generator and auxiliaries,
HRSG : Two 2 Single pressure level waste heat recovery steam generators,
Common system: Two 2 spray tray type deaerators, Seven 7 boiler feed water pumps
(six 6 electric motor driven and one 1 steam turbine driven), Two 2 recirculation
pumps, Four 4 Booster pumps, Two 2 fuel oil pump, blow down system, sampling
system and dosing system
Waste heat from gas turbine exhaust heat passes through the individual HRSG will generate
steam. Each HRSG generates HP steam to HP steam common header. Also LP steam is
4
produced through let down station which its source is HP steam extracted from HP common
header. Demine water is supplied to external deaerators through preheater which its
temperature shall be increased before enters to preheater by recirculation pumps. Feed water
to the HRSG and Auxiliary Boiler economizer shall be fed by a common feed pumps, which
shall take their suction from the feed water storage tank.
This HRSG has the following condition:
Each HRSG maximum capacity : 340000 kg/h (gross),
Installation: Outdoor,
Type : Fired, Natural circulation,
Operating mode : Constant pressure,
Duct & casing will be insulated for surface temperature below 60 °C at ambient
temperature 37 °C,
Gas pressure drop: 300.00 mmH2O based on static head,
HRSG configuration: Length (From Diverter center to Outlet Stack Center): 34.32 m
And Inlet Duct Angle: 51 Deg,
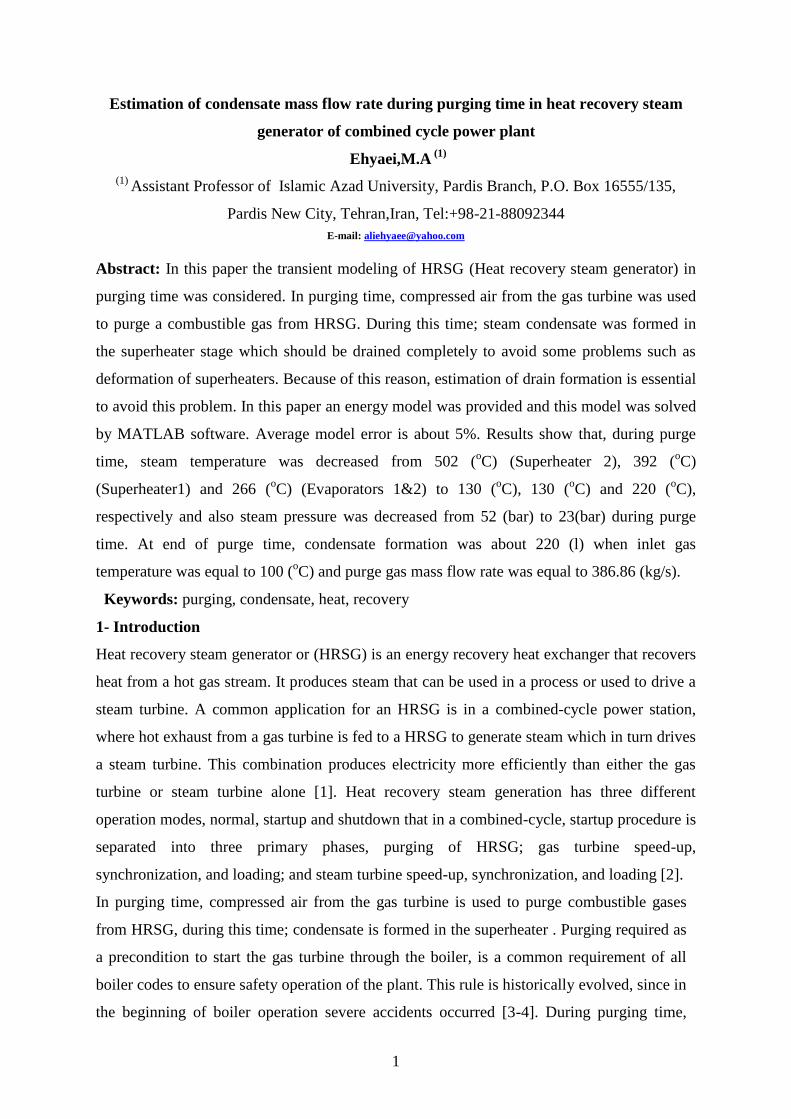
Figure (1) shows the schematic diagram of system. For mathematical modeling, three control
volumes are considered. These control volumes are two superheaters 1, 2 and evaporator,
which are shown in Figure (1). During purging time, inlet HP steam drum and attemperator
are closed. Purging time is about 300 (s), which condensate is formed in superheaters 1, 2 and
evaporator are drained through a drain which is located below superheaters.
Specification of HRSG heating surface is shown in Table (1). Steam conditions in evaporator
and superheaters 1 and 2 are shown in Table (2). The purge gas specification is shown in
Table (3).

5
Figure (1): Schematic diagram of system.
Table (1): Specification of HRSG heating surface
Component
Geometry Data Fin Data Weight
SL ST STN SLN HS
No
Tube
s
OD Thick Finned
Length
No
Fins Thk Height Type Tube Fin Total
(mm) (mm) (-) (-) (m^2) (-) (mm) (mm) (m) (/m) (mm) (mm) (-) (Ton) (Ton) (Ton)
SH-HP2 101.6 114.3 64 3 1647 192 50.8 2.7 17.0 100 1.2 9.0 SOLID 10.5 5.2 15.7
SH-HP1 101.6 114.3 64 2 2206 128 50.8 2.7 17.0 142 1.0 11.0 SOLID 7.0 5.2 12.1
EV-HP2 90.0 96.0 78 6 13797 468 38.1 2.4 17.0 260 1.0 19.0 SERRATED 16.8 43.2 60.0
EV-HP1 90.0 96.0 78 12 27594 936 38.1 2.4 17.0 260 1.0 19.0 SERRATED 33.6 86.3 119.9
Table (2): Steam conditions in evaporator and superheaters 1 and 2
Component Pressure
(bar)
Temperature
(oC) Steam condition
SH-HP2 52.00 502.00 Superheat
SH-HP1 52.00 392.00 Superheat
EV-HP2 52.00 266.00 Saturate
EV-HP1 52.00 266.00 Saturate
6
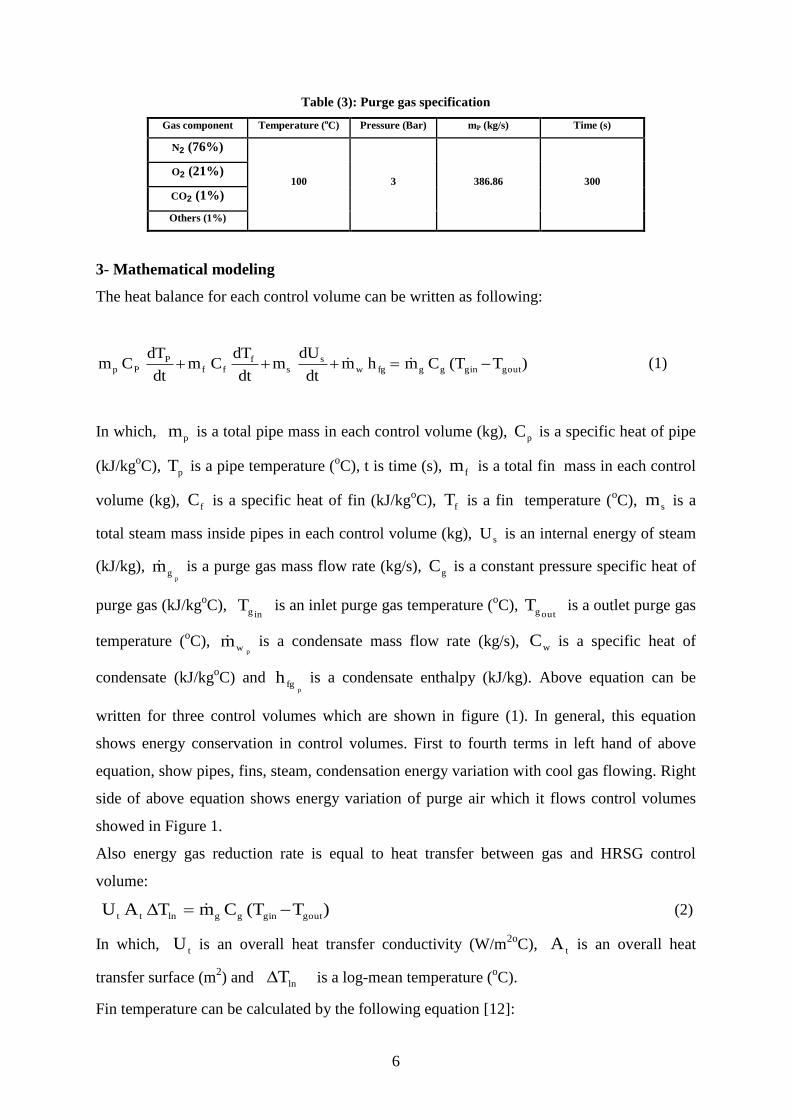
Table (3): Purge gas specification
Gas component Temperature (oC) Pressure (Bar) mP (kg/s) Time (s)
N2 (76%)
100 3 386.86 300 O2 (21%)
CO2 (1%)
Others (1%)
3- Mathematical modeling
The heat balance for each control volume can be written as following:
)TT(Cmhmdt
dUm
dt
dTCm
dt
dTCm goutginggfgw
s
sf
ffP
Pp (1)
In which, p
m is a total pipe mass in each control volume (kg), p
C is a specific heat of pipe
(kJ/kgoC),
pT is a pipe temperature (
oC), t is time (s),
fm is a total fin mass in each control
volume (kg), f
C is a specific heat of fin (kJ/kgoC),
fT is a fin temperature (
oC),
sm is a
total steam mass inside pipes in each control volume (kg), sU is an internal energy of steam
(kJ/kg), p
gm is a purge gas mass flow rate (kg/s),
gC is a constant pressure specific heat of
purge gas (kJ/kgoC),
ingT is an inlet purge gas temperature (
oC),
outgT is a outlet purge gas
temperature (oC),
pw
m is a condensate mass flow rate (kg/s), w
C is a specific heat of
condensate (kJ/kgoC) and
pfg
h is a condensate enthalpy (kJ/kg). Above equation can be
written for three control volumes which are shown in figure (1). In general, this equation
shows energy conservation in control volumes. First to fourth terms in left hand of above
equation, show pipes, fins, steam, condensation energy variation with cool gas flowing. Right
side of above equation shows energy variation of purge air which it flows control volumes
showed in Figure 1.
Also energy gas reduction rate is equal to heat transfer between gas and HRSG control
volume:
)TT(CmTAUgoutgingglntt
(2)
In which, t
U is an overall heat transfer conductivity (W/m2o
C), t
A is an overall heat
transfer surface (m2) and
lnT is a log-mean temperature (
oC).
Fin temperature can be calculated by the following equation [12]:
7
ttii
goutttsii
fAUAU
TAUTAUT
(3)
In which i
U is an inside tubes overall heat transfer coefficient (W/m2o
C) and i
A is an
internal surface (m2).
Overall heat transfer coefficient can be calculated by the following equation [12]:
ii
t
i
o
m
t
i
t
i
o
o
thA
A)
d
d(ln
k2
A
A
Aff
h
1ff
U
1
(4)
In which, oi
ff,ff are fouling factors inside and outside of tubes (m2o
C/W), m
k is a thermal
conductivity of tube wall (W/moC),
iod,d are outlet and inlet pipe diameters (m),
ioh,h
are outlet and inlet heat convection coefficient (W/m2o
C) and is a fin effectiveness. Inlet
and outlet overall heat transfer coefficients can be calculated by the following equations [12]:
)d
d(ln
k2
Aff
U
1
i
o
m
i
i
i
(5)
o
o
oh
1ff
U
1
(6)
Outlet overall heat transfer coefficient can be calculated by the following equation [12]:
67.0
pm
f
gm
o
o
531oPrCG)
15.273T
15.273T()
d
h2d(CCCh
(7)
In which, 531
C,C,C are constants, do is outlet pipe diameter (m), h is a fin height (m), Tgm
is an average purge gas temperature (oC), G is a gas mass velocity (kg/m
2s), Cpm is a mixture
gas heat capacity (kJ/kgoC) and Pr is a prandtl number. G gas mass velocity can be calculated
by the following equation:
nbh2dSLN
mG
oTW
g
(8)
Nw is a number of pipes wide, L is a effectiveness length of pipe (m), ST is a transverse pitch
(m), n is a number of fins per meter (NO/m), b is a fin thickness (m) and h is a fin height (m).
C1, C2 and C3 are obtained from Table (4). In this table ST and SL are transverse and
longitudinal pitches (m) and s is a fin clearance (m), which can be calculated by the following
equation:
bn
1s (9)
8
And Reynolds number:
GdRe (10)
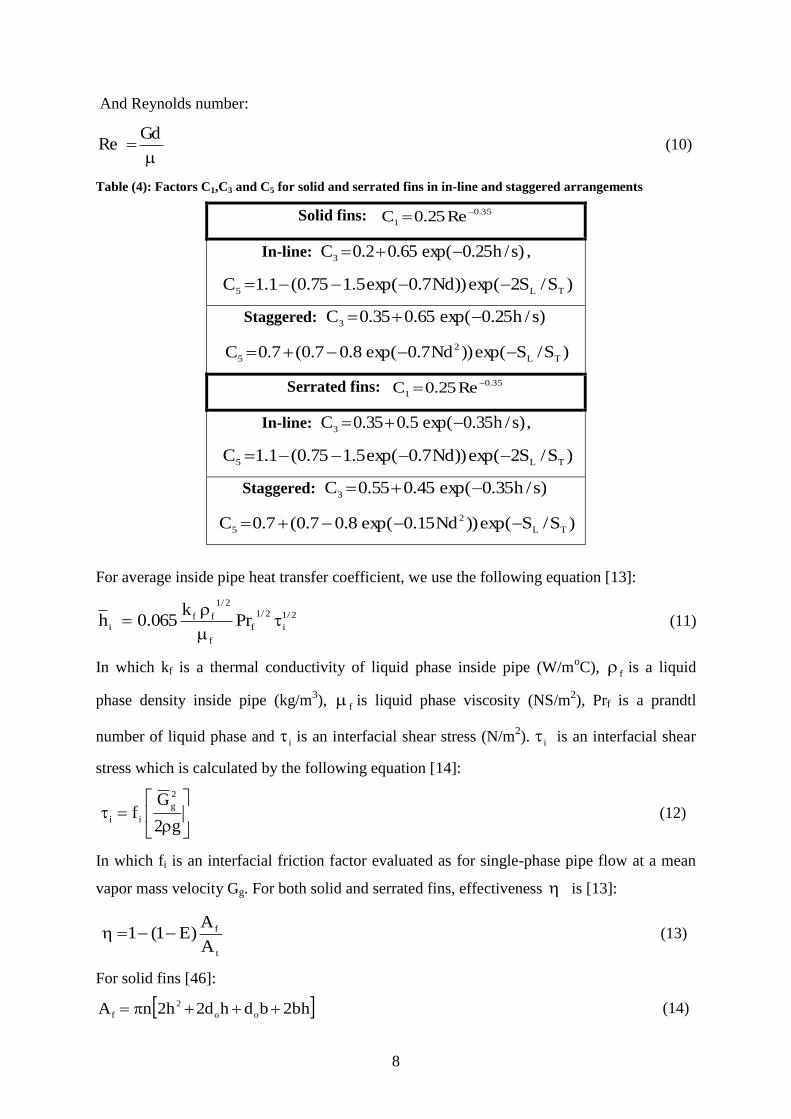
Table (4): Factors C1,C3 and C5 for solid and serrated fins in in-line and staggered arrangements
Solid fins: 35.0
1Re25.0C
In-line: )s/h25.0exp(65.02.0C3
,
)S/S2exp())Nd7.0exp(5.175.0(1.1CTL5
Staggered: )s/h25.0exp(65.035.0C3
)S/Sexp())Nd7.0exp(8.07.0(7.0CTL
2
5
Serrated fins: 35.0
1Re25.0C
In-line: )s/h35.0exp(5.035.0C3
,
)S/S2exp())Nd7.0exp(5.175.0(1.1CTL5
Staggered: )s/h35.0exp(45.055.0C3
)S/Sexp())Nd15.0exp(8.07.0(7.0CTL
2
5
For average inside pipe heat transfer coefficient, we use the following equation [13]:
2/1
i
2/1
f
f
2/1
ff
iPr
k065.0h
(11)
In which kf is a thermal conductivity of liquid phase inside pipe (W/moC),
f is a liquid
phase density inside pipe (kg/m3),
f is liquid phase viscosity (NS/m
2), Prf is a prandtl
number of liquid phase and i is an interfacial shear stress (N/m
2). i is an interfacial shear
stress which is calculated by the following equation [14]:
g2
Gf
2
g
ii (12)
In which fi is an interfacial friction factor evaluated as for single-phase pipe flow at a mean
vapor mass velocity Gg. For both solid and serrated fins, effectiveness is [13]:
t
f
A
A)E1(1 (13)
For solid fins [46]:
bh2bdhd2h2nAoo
2
f (14)
9
)nb1(dAAoft
(15)
E is fin efficiency can be calculated by the following equation [13]:
5.0
o
o22
d
h2dhm330034.01
1E
(16)
m is a factor which can be calculated by the following equation [14]:
5.0
o
kb
h2m
(17)
In which k is a fin thermal conductivity (W/moC). For serrated fins [13]:
ws
bh2hb5.0ndA
of (18)
In which, ws is a fin width (m).
Factor m can be calculated by the following equation [14]:
5.0
o
kbws
)wsb(h2m
(19)
The calculation process is as following:
1- Equation (1) which shows energy balance between cool gas (purge air) and control
volumes is coupled with equation (2) which shows heat transfer between purge air
and HRSG.
2- Parameters included in equations (1) and (2) are calculated by equations (3) to (19)
3- One second is considered as step calculation.
4- Results and discussion
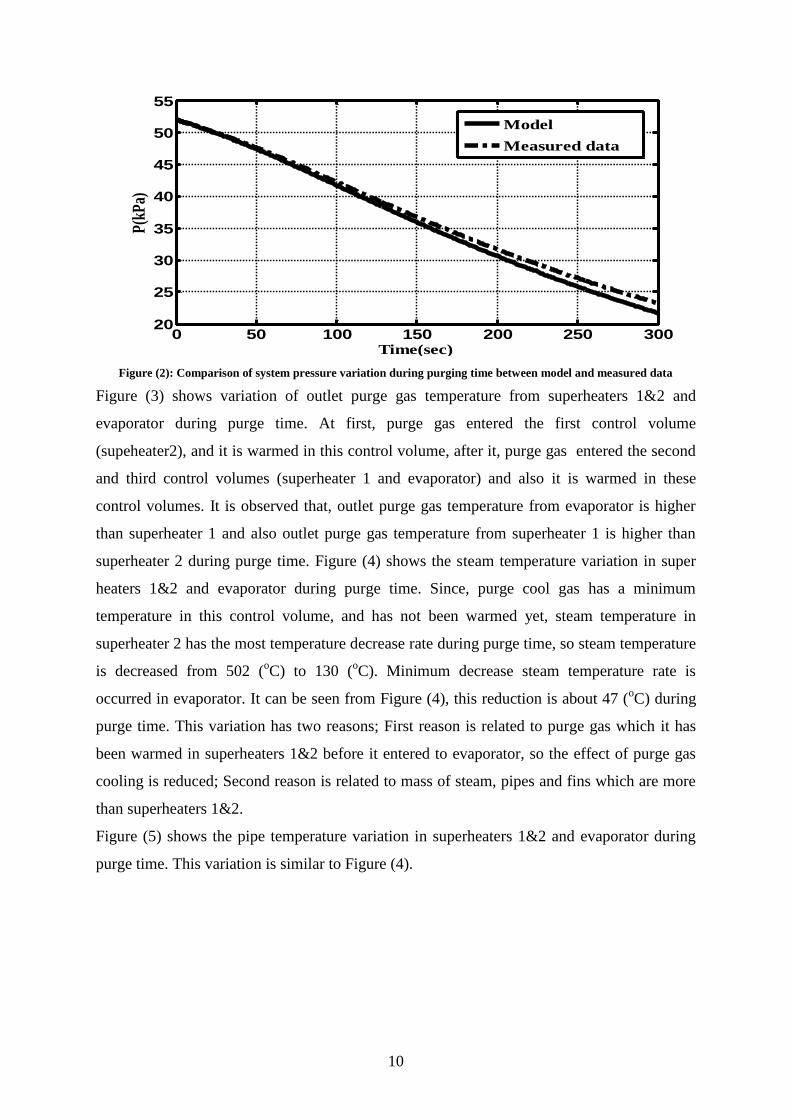
For validation the results, the comparison between model and experimental data is applied.
Figure (2) shows comparison of system pressure variation during purging time between
model and measured data. A good agreement between model and measured data is observed.
10
Figure (2): Comparison of system pressure variation during purging time between model and measured data
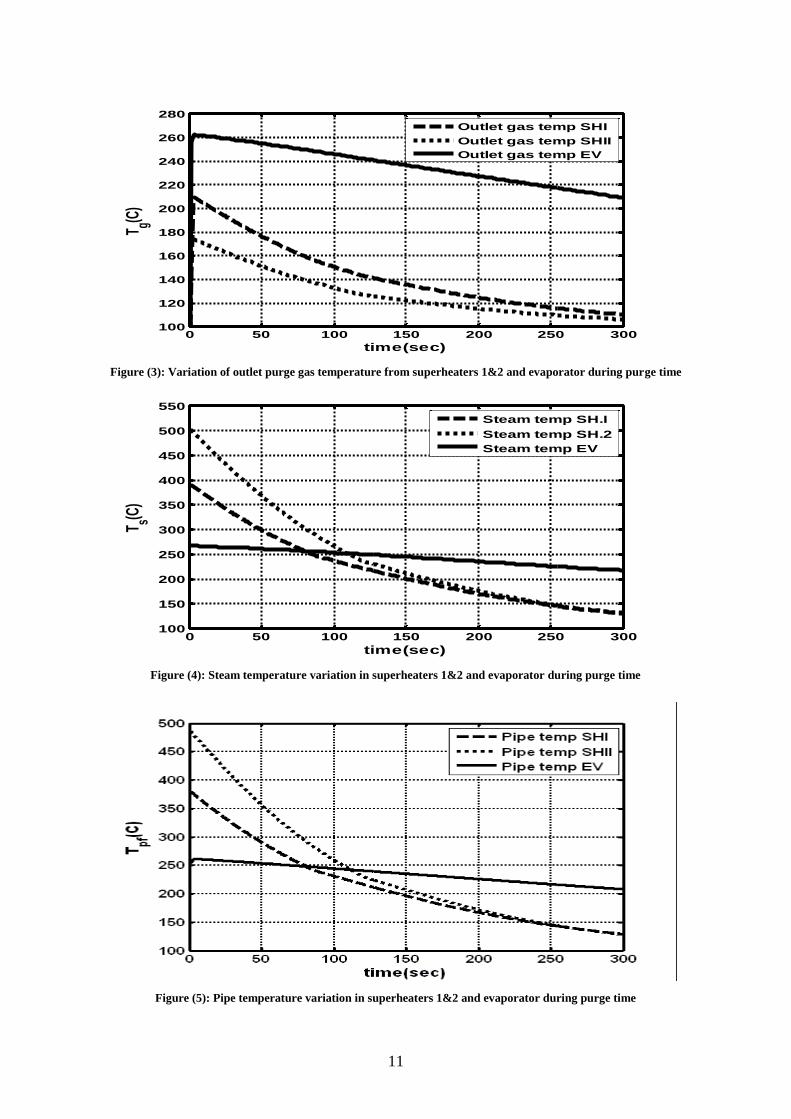
Figure (3) shows variation of outlet purge gas temperature from superheaters 1&2 and
evaporator during purge time. At first, purge gas entered the first control volume
(supeheater2), and it is warmed in this control volume, after it, purge gas entered the second
and third control volumes (superheater 1 and evaporator) and also it is warmed in these
control volumes. It is observed that, outlet purge gas temperature from evaporator is higher
than superheater 1 and also outlet purge gas temperature from superheater 1 is higher than
superheater 2 during purge time. Figure (4) shows the steam temperature variation in super
heaters 1&2 and evaporator during purge time. Since, purge cool gas has a minimum
temperature in this control volume, and has not been warmed yet, steam temperature in
superheater 2 has the most temperature decrease rate during purge time, so steam temperature
is decreased from 502 (oC) to 130 (
oC). Minimum decrease steam temperature rate is
occurred in evaporator. It can be seen from Figure (4), this reduction is about 47 (oC) during
purge time. This variation has two reasons; First reason is related to purge gas which it has
been warmed in superheaters 1&2 before it entered to evaporator, so the effect of purge gas
cooling is reduced; Second reason is related to mass of steam, pipes and fins which are more
than superheaters 1&2.
Figure (5) shows the pipe temperature variation in superheaters 1&2 and evaporator during
purge time. This variation is similar to Figure (4).
0 50 100 150 200 250 30020
25
30
35
40
45
50
55
Time(sec)
P(k
Pa)
Model
Measured data
11
Figure (3): Variation of outlet purge gas temperature from superheaters 1&2 and evaporator during purge time
Figure (4): Steam temperature variation in superheaters 1&2 and evaporator during purge time
Figure (5): Pipe temperature variation in superheaters 1&2 and evaporator during purge time
0 50 100 150 200 250 300100
120
140
160
180
200
220
240
260
280
time(sec)
T g(C)
Outlet gas temp SHI
Outlet gas temp SHII
Outlet gas temp EV
0 50 100 150 200 250 300100
150
200
250
300
350
400
450
500
550
time(sec)
T s(C)
Steam temp SH.I
Steam temp SH.2
Steam temp EV
12
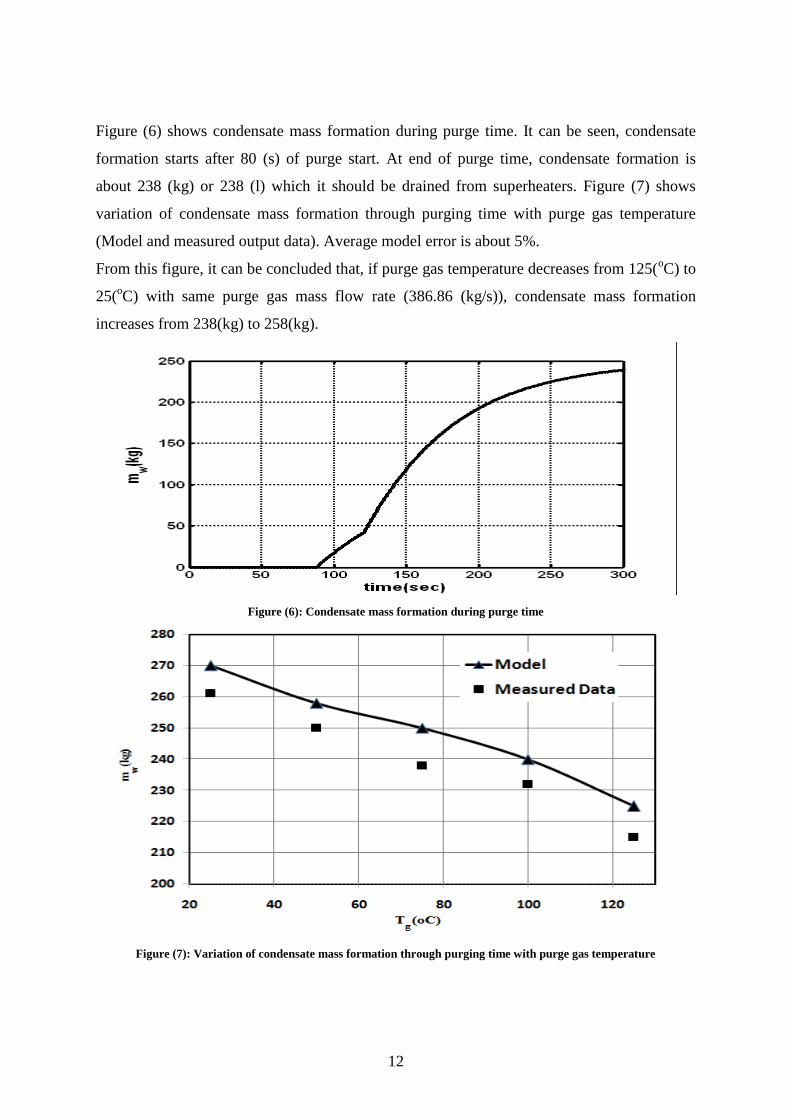
Figure (6) shows condensate mass formation during purge time. It can be seen, condensate
formation starts after 80 (s) of purge start. At end of purge time, condensate formation is
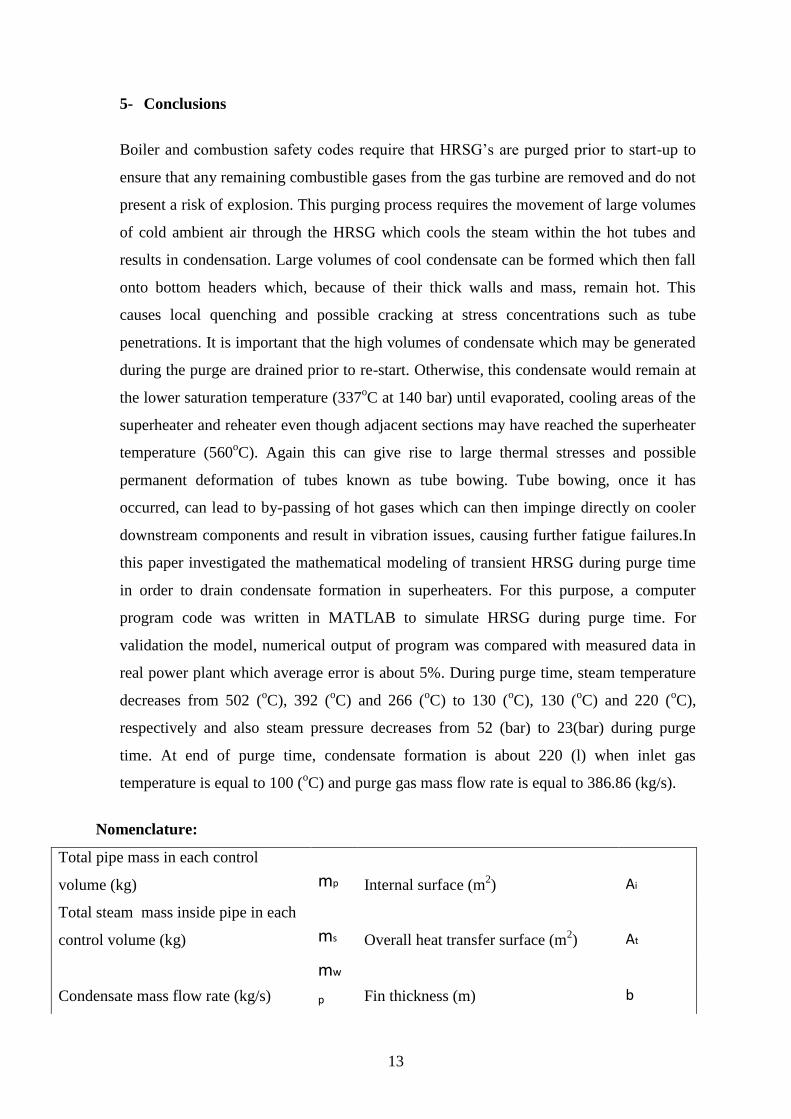
about 238 (kg) or 238 (l) which it should be drained from superheaters. Figure (7) shows
variation of condensate mass formation through purging time with purge gas temperature
(Model and measured output data). Average model error is about 5%.
From this figure, it can be concluded that, if purge gas temperature decreases from 125(oC) to
25(oC) with same purge gas mass flow rate (386.86 (kg/s)), condensate mass formation
increases from 238(kg) to 258(kg).
Figure (6): Condensate mass formation during purge time
Figure (7): Variation of condensate mass formation through purging time with purge gas temperature
13
5- Conclusions
Boiler and combustion safety codes require that HRSG’s are purged prior to start-up to
ensure that any remaining combustible gases from the gas turbine are removed and do not
present a risk of explosion. This purging process requires the movement of large volumes
of cold ambient air through the HRSG which cools the steam within the hot tubes and
results in condensation. Large volumes of cool condensate can be formed which then fall
onto bottom headers which, because of their thick walls and mass, remain hot. This
causes local quenching and possible cracking at stress concentrations such as tube
penetrations. It is important that the high volumes of condensate which may be generated
during the purge are drained prior to re-start. Otherwise, this condensate would remain at
the lower saturation temperature (337oC at 140 bar) until evaporated, cooling areas of the
superheater and reheater even though adjacent sections may have reached the superheater
temperature (560oC). Again this can give rise to large thermal stresses and possible
permanent deformation of tubes known as tube bowing. Tube bowing, once it has
occurred, can lead to by-passing of hot gases which can then impinge directly on cooler
downstream components and result in vibration issues, causing further fatigue failures.In
this paper investigated the mathematical modeling of transient HRSG during purge time
in order to drain condensate formation in superheaters. For this purpose, a computer
program code was written in MATLAB to simulate HRSG during purge time. For
validation the model, numerical output of program was compared with measured data in
real power plant which average error is about 5%. During purge time, steam temperature
decreases from 502 (oC), 392 (
oC) and 266 (
oC) to 130 (
oC), 130 (
oC) and 220 (
oC),
respectively and also steam pressure decreases from 52 (bar) to 23(bar) during purge
time. At end of purge time, condensate formation is about 220 (l) when inlet gas
temperature is equal to 100 (oC) and purge gas mass flow rate is equal to 386.86 (kg/s).
Nomenclature:
Ai Internal surface (m2) mp
Total pipe mass in each control
volume (kg)
At Overall heat transfer surface (m2) ms
Total steam mass inside pipe in each
control volume (kg)
b Fin thickness (m)
mw
p Condensate mass flow rate (kg/s)
14
C1,C2,C3,C5 Constants n Number of fins per meter (NO/m)
Cf Specific heat of fin (kJ/kgoC) Nw Number of pipes wide
Cg Specific heat of purge gas (kJ/kgoC) Pr Prandtl number
Cp Specific heat of pipe (kJ/kgoC) Prf Prandtl number of liquid phase
Cs Specific heat of steam (kJ/kgoC) Re Reynolds number
Cw Specific heat of condensate (kJ/kgoC) s Fin clearance (m)
Cpm
The mixture gas heat capacity
(kJ/kgoC) SL Longitudinal pitch (m)
di Inlet pipe diameters (m) ST Transverse pitch (m)
do Outlet pipe diameters (m) t Time (s)
E Fins efficiency Tf Fin temperature (oC)
fi Interfacial friction factor Tp Pipe temperature (oC)
ffi
Fouling factors inside of tubes
(m2o
C/W) Ts Steam temperature (oC)
ffo
Fouling factors outside of tubes
(m2o
C/W) Tg in Inlet purge gas temperature (oC)
G Gas mass velocity (kg/m2s)
Tg
out Outlet purge gas temperature (oC)
Gg mean vapor mass velocity Tgm Average purge gas temperature (oC)
h Fin height (m)
∆T
Ln log-mean temperature (oC)
hi
Inlet heat convection coefficient
(W/m2o
C) Ut
Overall heat transfer conductivity
(W/m2o
C)
ho
Outlet heat convection coefficient
(W/m2o
C) Ui
Inside tubes overall heat transfer
Steam internal energy (kJ/kg) Us
coefficient (W/m2o
C)
hfg p Condensate enthalpy (kJ/kg) ws Fin width (m).
k Fin thermal conductivity (W/moC) Greek symbols
kf
Thermal conductivity of liquid phase
inside pipe (W/moC) ρf
Liquid phase density inside pipe
(kg/m3)
km
Thermal conductivity of tube wall
(W/moC) ɳ Fin effectiveness
15
L Length of pipe (m) Liquid phase viscosity (NS/m2)
mf
Total fin mass in each control volume
(kg) τi Interfacial shear stress (N/m2)
mg p Purge gas mass flow rate (kg/s)
References:
[1] J.H.Horlock. "Combined power plants—past, present, and future". ASME Journal of Engineering for Gas
Turbines and Power 117 (1995) 608–16.
[2] S.Sanaye,S. and M.Rezazadeh, " Transient thermal modeling of heat recovery steam generators in combined cycle
power plants", International journal of energy research 122 (2006) 547-556.
[3] M.Pearson. and R.W.Anderson " Reliability and Durability from Large Heat Recovery Steam Generators".
Proceeding Institute Mechanical Engineering 1999: 213 Part A.
[4] R.Krowech, R.; L.Stanley; LLC Deltak Avoid damage from HRSG cycling; Power Magazine, March/April 1998
[5] "HRSG Users Handbook, "Design Operation and Maintenance", R.C.Swankekamp , HRSG Users Group,2006
[6] P.J.Dechamps. "Modeling the transient behavior of heat recovery steam generators". Journal of Power and Energy
209 (1995) 265–273.
[7]: M. Valdes, A. Rovira, M.D. Duran, Influence of the heat recovery steam generator design parameters on the
thermoeconomic performances of combined cycle gas turbine power plants, Int, Journal of Energy Research 28
(2004) 1243-1254.
[8]: M. Mohagheghi, J. Shayegan, Thermodynamic optimization of design variable and heat exchangers layout in
HRSGs for CCGT using genetic algorithm, Applied Thermal Engineering 29 (2009) 290-299.
[9]: E. Godoy, N.J. Scenna, S.J. Benz, Families of optimal thermodynamic solutions for combined cycle gas turbine
(CCGT) power plants, Applied Thermal Engineering 30 (2010) 569-576.
[10]: N. Woudstra, T. Woudstra, A. Pirone, T. van der Stelt, Thermodynamic evaluation of combined cycle plants,
Energy Conversion and Management 51 (2010) 1099-1110.
[11]: A. Bahadori*, H.B.Vuthaluru. A method for estimation of recoverable heat from blow down systems during
steam generation. Energy 35 (2010) 3501-3507.
[12]: ESCOA Corp. ESCOA Fintube Manual. Tulsa, OK: ESCOA, 1979.
[13]: Carpenter, E.F. and Colburn , A.P., 1951." The effect of velocity on condensation inside tubes", Proc. Of
General Discussion on Heat Transfer,20-26, IMechE/ASME.
[14]: Collier, J.G., "Convective boiling and condensation", Second edition, 1981.
f