Estimation of Clarks Instantaneous Unit Hydro Graph in GIS
9
Estimation Of Clark’s Instantaneous Unit Hydrograph In GIS Abstract Determinati on of the unit hydrograph of a basin is very important for the design of hydraulic structures. These structures are obtained by using the observed rainfall- runoff data for the storms, but when there is no observed data availabl e they are obtained by using synthetic unit hydrograph metho ds. In this study one such method is used, together with Geographic al Information Systems techniques. Application of Clark’s synthetic unit hydrograph technique with GIS technology requires time-area histogram is determined from the Digital Elevation Model of the basin. The translation hydrograp h is then derived from time-area graph by applying a unit excess rainfall over the basin. After performing a linear reservoir routing of the translation hydrograph to the basin outlet, the Instantaneous Unit Hydrograph of the basin is obtained. It can be used to obtain any duration unit hydrograph and consequently storm hydrographs in this basin for the design purposes. This technique has been applied to a ungauged basin in Narmada basin in a GIS environment. Key words: Instantaneous Unit Hydrograph, Clark’s method, GIS, Narmada Basin Introduction Main consideration of hydrology is the rainfall-runoff relationship of a watershed. The response of a watershed to rainfall is observed as the runoff at the basin outlet. For the gauged basins this is recorded as hydrograph (discharge vs. time graph). The unit hydrograp h of a basin is the surface runoff hydrograp h caused by a unit excess rainfall distributed uniformly over the area, its determination is significant in hydrology. For gauged basins, unit hydrographs are determined from observed storm data, hyetographs and corresponding hydrographs. For the ungauged basins there are several techniques for derivation of unit hydrographs synthetically. Clark’s synthetic unit graph method (Clark, 1945) is one of these techniques. Different to other techniques, flexibility of Clark’s methodology enab les it to be adapted to new technolog ies such as Geographi c Information Systems (GIS), which has been widely used in water resources. Clark’s methodology requires estimation of three basin parameters for the derivation of unit hydrograph: time of concentration (T c) , storage attenuation coefficient (R), and time-area histogram of the basin. By applying unit excess rainfall over the basin, precipitation is conveyed to basin outlet through two steps: obtaining a translation hydrograph and then performing a linear reservoir routing. Time of concentration (T c ) is the time that it takes to flow from the remotest point in the basin to reach the watershed outlet. In this study the Soil Conservation Service (SCS) lag equation is used to determine T c value. SCS equation requires main channel length, average Curve Number and slope of the basin, which are evaluated by the tools of GIS. GIS software, ESRI’s ArcView 3.2, ArcInfo and HEC-GeoHMS extension are extensively used in this study.
-
Upload
sudharsananprs -
Category
Documents
-
view
221 -
download
0
Transcript of Estimation of Clarks Instantaneous Unit Hydro Graph in GIS

8/6/2019 Estimation of Clarks Instantaneous Unit Hydro Graph in GIS
http://slidepdf.com/reader/full/estimation-of-clarks-instantaneous-unit-hydro-graph-in-gis 1/9
Estimation Of Clark’s Instantaneous Unit Hydrograph In GIS
AbstractDetermination of the unit hydrograph of a basin is very important for the design of hydraulic structures. These structures are obtained by using the observed rainfall-runoff data for the storms, but when there is no observed data available they areobtained by using synthetic unit hydrograph methods. In this study one such method isused, together with Geographical Information Systems techniques. Application of Clark’s synthetic unit hydrograph technique with GIS technology requires time-areahistogram is determined from the Digital Elevation Model of the basin. The translationhydrograph is then derived from time-area graph by applying a unit excess rainfall over the basin. After performing a linear reservoir routing of the translation hydrograph tothe basin outlet, the Instantaneous Unit Hydrograph of the basin is obtained. It can beused to obtain any duration unit hydrograph and consequently storm hydrographs in
this basin for the design purposes. This technique has been applied to a ungaugedbasin in Narmada basin in a GIS environment.
Key words: Instantaneous Unit Hydrograph, Clark’s method, GIS, Narmada Basin
IntroductionMain consideration of hydrology is the rainfall-runoff relationship of a watershed. Theresponse of a watershed to rainfall is observed as the runoff at the basin outlet. For the gauged basins this is recorded as hydrograph (discharge vs. time graph). The unithydrograph of a basin is the surface runoff hydrograph caused by a unit excess rainfalldistributed uniformly over the area, its determination is significant in hydrology. For gauged basins, unit hydrographs are determined from observed storm data,hyetographs and corresponding hydrographs. For the ungauged basins there areseveral techniques for derivation of unit hydrographs synthetically.
Clark’s synthetic unit graph method (Clark, 1945) is one of these techniques. Differentto other techniques, flexibility of Clark’s methodology enables it to be adapted to newtechnologies such as Geographic Information Systems (GIS), which has been widelyused in water resources. Clark’s methodology requires estimation of three basinparameters for the derivation of unit hydrograph: time of concentration (Tc), storageattenuation coefficient (R), and time-area histogram of the basin. By applying unitexcess rainfall over the basin, precipitation is conveyed to basin outlet through twosteps: obtaining a translation hydrograph and then performing a linear reservoir
routing.
Time of concentration (Tc) is the time that it takes to flow from the remotest point in thebasin to reach the watershed outlet. In this study the Soil Conservation Service (SCS)lag equation is used to determine Tc value. SCS equation requires main channellength, average Curve Number and slope of the basin, which are evaluated by thetools of GIS. GIS software, ESRI’s ArcView 3.2, ArcInfo and HEC-GeoHMS extensionare extensively used in this study.

8/6/2019 Estimation of Clarks Instantaneous Unit Hydro Graph in GIS
http://slidepdf.com/reader/full/estimation-of-clarks-instantaneous-unit-hydro-graph-in-gis 2/9
Reservoir storage coefficient (R) is the second parameter of the methodologyreflecting the storage effects of the stream channels. R is computed graphically froman observed storm hydrograph of the basin. The coefficient is then used to route thetranslation hydrograph to the basin outlet. The time-area histogram represents thearea of the basin, contributing to the flow at the basin outlet at any given time, after theapplication of unit excess rainfall. Reflecting the shape and drainage properties of thebasin, it is the most important parameter for derivation of the translation hydrograph.
The Digital Elevation Model (DEM) of the basin, which are the 10x10 meter cell sizedgrids having elevation values, is used for this purpose. Thereafter, to determine thetime-area graph the travel distance of each cell to the outlet is determined byestimating cell flow lengths. Then travel distance of each cell to the determined outlet(in time units) is derived from cell flow lengths. Translation hydrograph is derived fromtime-area graph by instantly applying unit excess rainfall over the basin. Thetranslation hydrograph, which reflects the travel time of runoff to outlet, is then routedby linear reservoir, and Instantaneous Unit Hydrograph (IUH) of the basin isdetermined.
Instantaneous unit hydrograph is the result of a unit depth of rainfall occurred in an
infinitely small time interval over the basin. Since the duration of rainfall is assumed aszero, shape of the hydrograph depends only on the basin characteristics.
Study AreaThe Narmada River, on which the Indian government plans to build large number of dams, flows through three states: Madhya Pradesh, Maharashtra, and Gujarat. Ninetypercent of the river flows through Madhya Pradesh; it skirts the northern border of Maharashtra, then flows through Gujarat for about 180 kilometers before merging intothe Arabian Sea at Bharuch.
Figure 1. Location of Narmada Basin
HEC-GeoHMS was used to delineate the basin into sub-basins. Hydro1k DEM wasused in the delineation process. Details of delineation are discussed elsewhere (HEC-

8/6/2019 Estimation of Clarks Instantaneous Unit Hydro Graph in GIS
http://slidepdf.com/reader/full/estimation-of-clarks-instantaneous-unit-hydro-graph-in-gis 3/9
GeoHMS user manual 2000). Seamless Hydro1k DEM and Delineated sub-basins areshown in Figure 2 and 3 respectively. A test sub-basin used for estimating Clark’s IUHis shown in Figure 5 a.
Application Of Clark’s Technique
Clark’s synthetic unit hydrograph methodology involves the application of a unit excessrainfall (1 mm) over the watershed. As mentioned, the precipitation is conveyed to thebasin outlet by translation hydrograph and linear reservoir routing. For this purpose,the time of concentration value (Tc), the storage attenuation coefficient (R) and thetime area histogram of the basin are necessary. The methodology is summarized inFigure 4.
Figure 2. Seamless Hydro 1k DEM for Narmada basin.
Figure 3. Delineated Narmada basin.
Flowlength GridTo obtain the time-area graph of Narmada Basin, the flowlength grid (FlGrid) wasderived for the sub-basin under study. The FlGrid represents for each cell, the totaltravel length of the water droplet from a cell to the basin outlet along the direction of flow. Velocity of flow in an area will differ depending on the topography and landuse

8/6/2019 Estimation of Clarks Instantaneous Unit Hydro Graph in GIS
http://slidepdf.com/reader/full/estimation-of-clarks-instantaneous-unit-hydro-graph-in-gis 4/9
conditions. Water will move slowly in a mild slope or over a dense pasture area andfaster on a bare land. To represent the impedance or resistance of the cell to the flow,a grid can be prepared. The value at each cell in the grid represents the resistance per unit distance to flow through the cell or weight of the cell. The grid containing valuesrepresenting the weight of each cell is termed as weight grid (WGrid).
The flowdirection grid was used for calculation, where the weight of each cell was
accepted as same and equal to 1. Selected basin and Velocity contours for three sets(1m/s, 2m/s and 3m/s ) are shown in figure 5 b, c and d respectively.

8/6/2019 Estimation of Clarks Instantaneous Unit Hydro Graph in GIS
http://slidepdf.com/reader/full/estimation-of-clarks-instantaneous-unit-hydro-graph-in-gis 5/9
Figure 4. Flowchart of the methodology

8/6/2019 Estimation of Clarks Instantaneous Unit Hydro Graph in GIS
http://slidepdf.com/reader/full/estimation-of-clarks-instantaneous-unit-hydro-graph-in-gis 6/9
Figure 5. Test sub-basin and travel time contours for three velocities.
Time Area HistogramThe area of the basin is divided into travel time zones. Each zone represents the partof basin, which drains the unit excess rainfall to the outlet at a certain time interval.The plot of these areas with respect to corresponding time intervals determines thetime-area histogram of the basin. It is the most important parameter of themethodology, since it reflects the runoff response of the basin to the rainfall at theoutlet.
The digital elevation model of the basin is used for determination of time-areahistogram. First, the direction of flow from each cell is found. Second, by tracing theflowdirection, travel distance of flow from each cell to the basin outlet is calculated.These distances are converted to travel time values. Finally, by selecting contours of 1h intervals on the travel time grid and converting the number of cells to area, thetime-area histogram is derived.
b . Travel time contours with vel. 1m/sa . Test basin
c . Travel time contours with vel. 2m/s d . Travel time contours with vel. 4m/s
8/6/2019 Estimation of Clarks Instantaneous Unit Hydro Graph in GIS
http://slidepdf.com/reader/full/estimation-of-clarks-instantaneous-unit-hydro-graph-in-gis 7/9
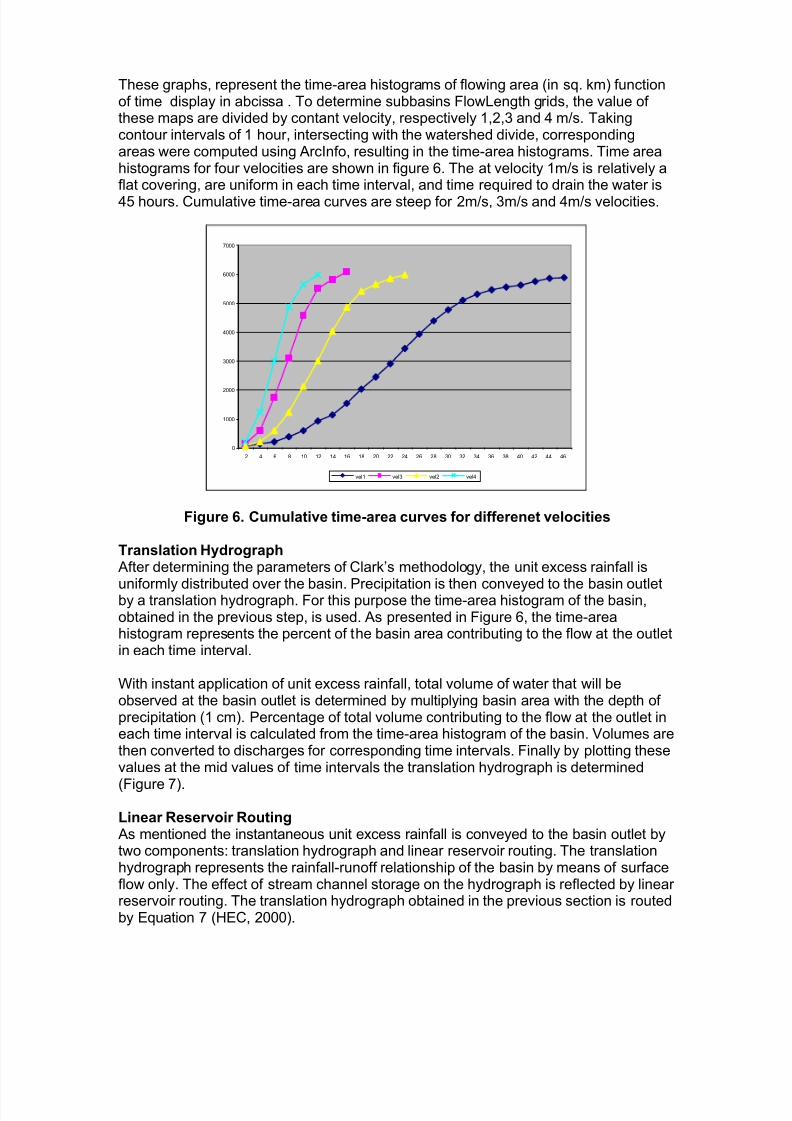
These graphs, represent the time-area histograms of flowing area (in sq. km) functionof time display in abcissa . To determine subbasins FlowLength grids, the value of these maps are divided by contant velocity, respectively 1,2,3 and 4 m/s. Takingcontour intervals of 1 hour, intersecting with the watershed divide, correspondingareas were computed using ArcInfo, resulting in the time-area histograms. Time areahistograms for four velocities are shown in figure 6. The at velocity 1m/s is relatively aflat covering, are uniform in each time interval, and time required to drain the water is
45 hours. Cumulative time-area curves are steep for 2m/s, 3m/s and 4m/s velocities.
0
1000
2000
3000
4000
5000
6000
7000
2 4 6 8 10 12 14 16 18 20 22 24 26 28 30 32 34 36 38 40 42 44 46
vel1 vel3 vel2 vel4
Figure 6. Cumulative time-area curves for differenet velocities
Translation HydrographAfter determining the parameters of Clark’s methodology, the unit excess rainfall is
uniformly distributed over the basin. Precipitation is then conveyed to the basin outletby a translation hydrograph. For this purpose the time-area histogram of the basin,obtained in the previous step, is used. As presented in Figure 6, the time-areahistogram represents the percent of the basin area contributing to the flow at the outletin each time interval.
With instant application of unit excess rainfall, total volume of water that will beobserved at the basin outlet is determined by multiplying basin area with the depth of precipitation (1 cm). Percentage of total volume contributing to the flow at the outlet ineach time interval is calculated from the time-area histogram of the basin. Volumes arethen converted to discharges for corresponding time intervals. Finally by plotting thesevalues at the mid values of time intervals the translation hydrograph is determined
(Figure 7).
Linear Reservoir RoutingAs mentioned the instantaneous unit excess rainfall is conveyed to the basin outlet bytwo components: translation hydrograph and linear reservoir routing. The translationhydrograph represents the rainfall-runoff relationship of the basin by means of surfaceflow only. The effect of stream channel storage on the hydrograph is reflected by linear reservoir routing. The translation hydrograph obtained in the previous section is routedby Equation 7 (HEC, 2000).

8/6/2019 Estimation of Clarks Instantaneous Unit Hydro Graph in GIS
http://slidepdf.com/reader/full/estimation-of-clarks-instantaneous-unit-hydro-graph-in-gis 8/9
In Equation 7, I(t) is the calculated translation hydrograph, R is the storage attenuationcoefficient and t is the selected time interval for routing. Q(t) which is obtained after routing is the instantaneous unit hydrograph of the basin. The routing process iscontinued till an excess flow depth of 1 cm is obtained under the hydrograph.Instantaneous Unit Hydrograph of Basin is obtained. Figure 8 shows the inflow-outflow, average flow hydrographs for IUH for thee sets of velocities. Large attenuationcan be seen when the velocity is 3 m/s and 4m/s, attenuation is small for velocity of 1m/s and is moderate for 2m/s.
(a) (b)
(c) (d)Figure 8. Clark’s IUH for test basin.
After linear reservoir routing for the sub-basin, the Instantaneous Unit Hydrograph isobtained:What can be observed in the first look is, as velocity rises, the inflow peaks are higher,
and more concentrated over time. As runoff flows faster towards the outlet, the amountof water getting in and out in a specific lag of time rises. With velocities 1 and 2 m/s,outflow sustains up to 60 hours after the rainfall, whereas with velocities 3 and 4m/s,this would end after about 40 hours. It is also observed that peak is reached veryrapidly (more or less 8 hours) after the rainfall for a velocity of 4m/s, as compared to1m/s (28 hours). Among all the IUH, the velocities of 2m/s and storage coefficient of 4hrs appears to be realistic for the test basin. This needs to be verified with theobserved hydrograph.
8/6/2019 Estimation of Clarks Instantaneous Unit Hydro Graph in GIS
http://slidepdf.com/reader/full/estimation-of-clarks-instantaneous-unit-hydro-graph-in-gis 9/9
ConclusionThe study presents the estimation of Instantaneous Unit hydrograph using Clark’smethod for an ungaged basin using GIS techniques. These techniques will be veryuseful for water resource planning in the basin for estimating design flood, water availability etc suitable for countries especially like India, where limited amount of observed flow data is available.
ReferencesESRI, 1997: ArcView Watershed Delineator User’s Manual, ESRI Publ., USA.ESRI, 1998: ArcView User’s Manual, ESRI Publ., USA.ESRI, 1999: Arc/Info User’s Manual, ESRI Publ., USA.HEC, 1982: Hydrologic Engineering Center: HEC-1 Training document No.15, U.S.Army Corps of Engineers, Davis, California, USA.HEC, 2000: Hydrologic Engineering Center HEC-HMS User’s Manual, Davis,California.Kull, D. W. and Feldman, A. D., 1998: Evaluation of Clark’s Unit Graph Method toHydrologic Engineering Center Spatially Distributed Runoff, Journal of HydrologicEngineering.
Usul, N., 2002: A Pilot Project for Flood Analysis by Integration of Hydrologic-HydraulicModels and Geographic Information Systems (in Turkish), METU, Ankara, Turkey