
Estimation of carcass and growth composition in the ...
18
Netherlands Journal of Agricultural Science 32 (1984) 301-318 Estimation of carcass and growth composition in the growing pig S. H. M. Metz 1 , M. W. A. Verstegen 2 , R. O. de Wilde 3 , H. A. Brandsma 2 , W. van der Hel 2 , E. W. Brascamp 4 , N. P. Lenis 1 and E. Kanis 5 1 Institute for Livestock Feeding and Nutrition Research (IVVO), Lelystad, Ne- therlands 2 Department of Animal Husbandry, Agricultural University, Wageningen, Ne- therlands 3 Laboratory of Animal Nutrition, Faculty of Veterinary Medicine, Gent, Belgium 4 Research Institute of Animal Production 'Schoonoord', Zeist, Netherlands 5 Department of Animal Breeding, Agricultural University, Wageningen, Nether- lands Received 16 October 1984; accepted 20 November 1984 Key-words: pig, carcass composition, body composition, growth composition, N deposition, backfat parameters, balance technique, comparative slaughter tech- nique Summary Two experiments, with 80 and 32 growing pigs respectively, were performed in or- der to evaluate some methods for the estimation of body and carcass composition or composition of growth. During the growth period of 25 to 105 kg energy and N bal- ances were measured frequently. Backfat thickness was measured ultrasonically in the live pigs, before slaughtering. After slaughtering, at 65, 85 or 105 kg live weight, the animals were commercially dissected and most animals were also ana- tomically dissected according to the EC reference method. Chemical analysis of to- tal body and carcass were made for each animal. In the first experiment backfat samples were analysed for chemical composition and fat cell size. Rate of gain in lean tissue, fat tissue, protein and fat were estimated from its final content in each growing pig and its initial content as estimated from 8 littermate animals which were slaughtered and analysed at the start of each experiment. The results indicate that in the live animal body composition is best estimated from ultrasonically measured backfat thickness (R 2 = 0.6), with a residual standard deviation (r.s.d.) for muscle % of 1.9. Other parameters of the subcutaneous back- fat (dry matter or fat content and fat cell size) which also can be obtained adequate- ly from the live animal, are inferior in accuracy as compared with backfat thickness. Carcass composition can be estimated with a reasonable accuracy (r.s.d. for muscle % 0.9-1.0) routinely, using (ham + loin) % as a parameter. Both backfat % and 301
Transcript of Estimation of carcass and growth composition in the ...

Netherlands Journal of Agricultural Science 32 (1984) 301-318
Estimation of carcass and growth composition in the growing pig
S. H. M. Metz1, M. W. A. Verstegen2, R. O. de Wilde3, H. A. Brandsma2, W. van der Hel2, E. W. Brascamp4, N. P. Lenis1 and E. Kanis5
1 Institute for Livestock Feeding and Nutrition Research (IVVO), Lelystad, Netherlands 2 Department of Animal Husbandry, Agricultural University, Wageningen, Netherlands 3 Laboratory of Animal Nutrition, Faculty of Veterinary Medicine, Gent, Belgium 4 Research Institute of Animal Production 'Schoonoord', Zeist, Netherlands 5 Department of Animal Breeding, Agricultural University, Wageningen, Netherlands
Received 16 October 1984; accepted 20 November 1984
Key-words: pig, carcass composition, body composition, growth composition, N deposition, backfat parameters, balance technique, comparative slaughter technique
Summary
Two experiments, with 80 and 32 growing pigs respectively, were performed in order to evaluate some methods for the estimation of body and carcass composition or composition of growth. During the growth period of 25 to 105 kg energy and N balances were measured frequently. Backfat thickness was measured ultrasonically in the live pigs, before slaughtering. After slaughtering, at 65, 85 or 105 kg live weight, the animals were commercially dissected and most animals were also anatomically dissected according to the EC reference method. Chemical analysis of total body and carcass were made for each animal. In the first experiment backfat samples were analysed for chemical composition and fat cell size. Rate of gain in lean tissue, fat tissue, protein and fat were estimated from its final content in each growing pig and its initial content as estimated from 8 littermate animals which were slaughtered and analysed at the start of each experiment.
The results indicate that in the live animal body composition is best estimated from ultrasonically measured backfat thickness (R2 = 0.6), with a residual standard deviation (r.s.d.) for muscle % of 1.9. Other parameters of the subcutaneous backfat (dry matter or fat content and fat cell size) which also can be obtained adequately from the live animal, are inferior in accuracy as compared with backfat thickness. Carcass composition can be estimated with a reasonable accuracy (r.s.d. for muscle % 0.9-1.0) routinely, using (ham + loin) % as a parameter. Both backfat % and
301

S. H. M. METZ ETAL.
hamfat % and chemical composition of the carcass or of the total body estimate carcass composition less accurate than (ham + loin) %, with an r.s.d. of about 2.0. For growth composition over long periods two methods were evaluated: N deposition according to the balance technique and N deposition according to the comparative slaughter technique. There were considerable differences in level of N deposition by the two methods, the latter being the most realistic. However, for estimating daily muscle growth no clear differences in accuracy between the two methods were observed.
Introduction
The estimation of body composition in the pig has drawn attention since many years. The main reasons for this are efforts to breed pigs with an anatomical composition yielding a higher proportion of edible parts and the search for a better efficiency of the conversion of animal feeds to edible products, especially meat. Knowledge on growth composition is a prerequisite to find the nutrient requirements and to achieve the optimal feeding and management strategies for an efficient pig meat production.
So far, several methods to estimate body composition have been used. The ultra-sonically measured backfat thickness is a common method and easy to perform on live pigs. Variation in ultrasonically measured backfat thickness explains about 50% of the variance in lean-to-fat ratio in the slaughter pig (Kempster et al., 1982). Other parameters for body composition on live pigs are body water and fat compartments as estimated by dilution techniques or 40K counting (Hörnicke, 1959), activities of lipogenic enzymes (Rogdakis, 1972), chemical and histological adipose tissue characteristics (Aberle et al., 1977; Metz et al., 1980). So far these other parameters have been used mainly on an experimental scale. For estimating body composition of the slaughtered pig both chemical analysis and anatomical dissection are reliable indices, although these methods have their limitations (Hedrick, 1983). In general, commercial evaluation of carcasses needs simpler tools like backfat thickness or other linear parameters and specific gravity. At the moment measurement of backfat thickness, over or at a fixed distance from the mid-line of split carcasses, often together with classification of type (shape), have main importance in grading carcasses for commercial purposes.
Estimation of growth composition has been done with other tools. Cöp (1974) calculated for several sets of data from literature protein and fat deposition in growing pigs, only using parameters that always have to be measured in growth studies, namely body weight gain and feed intake. The relationship between the calculated protein deposition and the deposition of protein as measured by the authors varied highly between sets of data and was, with correlation coefficients between 0.84 and 0.05, moderate on average. Cöp concluded that more data on N- and energy balances for individually fed pigs at variable levels of feed intake were necessary. No further studies on this topic have been published since. Another approach for estimating growth composition is the balance method, measuring either the N and energy balances or the N balance and the live weight gain. The N balance method is
302 Netherlands Journal of Agricultural Science 32 (1984)

ESTIMATION OF CARCASS AND GROWTH COMPOSITION IN GROWING PIG
based upon the rather constant proportion of deposited N that in growing animals is retained as meat, as shown for pigs by Oslage (1965). The N balance method allows measurement of protein deposition during each stage of postnatal life, within an animal in a short time interval. However, the N balance generally overestimates N retention considerably and to a variable extent, depending upon experimental design and accuracy of work (Just et al., 1982). For purposes of correct estimation of protein deposition over a longer period the adequately performed comparative slaughter technique has to be considered as the most reliable in estimating protein deposition (Just Nielsen, 1970); it neither suits for the individual animal nor for the living animal however. The method is very useful as a reference method in feed evaluation studies and as a reference for other parameters which in turn are handsome tools for other purposes such as genetic selection (de Wilde, 1977).
Although many methods have been used to determine composition of body mass and growth in the pig, only part of them are in use for practical or research purposes at the moment. This paper deals with a number of these methods (N balance, ultra-sonically measured backfat thickness, commercial dissection of carcasses, chemical analysis of the body, histological and chemical backfat characteristics). Both their interrelationships and their accuracy for estimation of carcass and growth composition have been studied in the two experiments, with growing pigs, presented in this paper. The anatomical dissection data of carcasses have always been used as reference for carcass and growth composition. The two experiments deal also with nutritional and other environmental factors affecting growth in pigs, being discussed in a further series of papers.
Material and methods
Animals
Experiment 1. Eighty castrated male piglets (Dutch Large White x Dutch Land-race) were used in this study. The animals belonged to 16 litters: 4, 8 and 4 litters delivered 6, 5 and 4 littermates each respectively. In general the piglets had been weaned at 5-6 weeks of age and arrived at the experimental farm at 10-11 weeks of age (mean liveweight 21.6 kg). The animals were assigned to one of 14 treatment groups then (see Table 1 for the experimental data on housing system, dietary treatments and live weight interval of the animals).
Experiment 2. Thirty-two Dutch Landrace piglets (16 males and 16 females) were used in this experiment. The animals belonged to 4 litters. All piglets were born by surgical removal from the uterus. Half of each litter was reared artificially, under specific-pathogen-free (SPF) conditions. The other piglets were suckled by a host sow and reared under normal, practical farm conditions. At an age between 6 and 8 weeks both groups of animals were transferred to two identical calorimeters. Four SPF piglets and four control piglets were slaughtered then. The others were grown under highly controlled conditions in order to maintain the SPF piglets specific-pathogen-free.
Netherlands Journal of Agricultural Science 32 (1984) 303

S. H. M. METZ ETAL.
Table 1. Summary of the experimtental details of the animals in Exp. 1.
Treatment Housing Number of Liveweight Feeding level Relationship' system pigs interval (kg) (% of ad lib.)
0 - 8 slaughtered - 2A, 2B, 2C, 2D at 25 kg
1 cage 4 25-65 74 2A,2C 2 cage 4 25-65 85 2A,2C 3 cage 4 65-105 74 4F 4 cage 4 65-105 85 4F 5 calorimeter 4 25-65 74 2C, 2D 6 calorimeter 4 25-65 85 2A,2B 7 calorimeter 4 25-85 74 2A, 2B 8 calorimeter 4 25-85 85 2C, 2D 9 calorimeter 8 25-105 74 2C,2D,4E
10 calorimeter 8 25-105 85 2A,2B,4E 11 pen 8 25-105 74 4E,4F 12 pen 8 25-105 85 4E,4F 13 pen 8 25-105 100 4E,4F
1 The same letter means full sibs. Numbers before letters refer to the number of litters.
Housing
All animals were continuously kept under conditions of thermoneutrality.
Experiment 1. Animals were continuously housed in one of 3 systems (Table 1): restraint in metabolism cages, housed in groups in a calorimeter or housed individually in a pen. Two calorimeters were used. Per calorimeter there were two pens of 3 m x 3 m, with 8, 6 or 4 (depending upon liveweight) animals per pen. The size of the pen for the individually housed pigs was 1.5 m x 2 m.
Experiment 2. The pigs were housed in groups in the calorimeters of Experiment 1: the SPF pigs in one calorimeter, the conventionally reared pigs in the other.
Feeding
Experiment 1. Dietary composition was the same for all animals. The diet was composed of 61 % cereals (maize, barley and milo), 18 % wheat middlings, 8.5 % solvent-extracted soya bean meal, 1.2 % skimmed milk powder, 4 % fish meal, 5 % lucerne and some additional minerals and vitamins. The diet contained lysine 8.1 g/kg, crude protein 165 g/kg and net energy (according to Nehring et al., 1969) 8.96 MJ/kg. All animals were fed dry feed, individually. From each of 8 litters (E and F litters, see Table 1) one animal, individually housed in a pen, was fed ad libitum, with continuous access to feed. Its feed intake was considered as the intake capacity of the restrictedly fed littermates. The restrictedly fed littermates, housed individually in a pen or in a cage, received either 85 % or 74 % of the feed consumed by the partner fed ad libitum, on a liveweight scale basis. The littermates in the calorime
304 Netherlands Journal of Agricultural Science 32 (1984)

ESTIMATION OF CARCASS AND GROWTH COMPOSITION IN GROWING PIG
ters were fed individually and received either 85 % or 74 % of the average feed consumption of the 4 E pigs of treatment group 13 at the same weight. The same amounts of feed were also given to the restrictedly fed animals, from the 85 % and 74 % groups, which had no littermates in the ad libitum groups (A, B, C and D litters). So all animals within one calorimeter received the same amount of feed daily, based upon the average individual liveweight. For the restrictedly fed pigs, adjustment of feed intake to liveweight was done daily on the basis of expected weight gain. The pigs were weighed once a week. The feed was offered to the restrictedly fed animals in two meals of equal size per day; during the whole experimental period feed residues were collected, weighed and analysed for dry matter in order to estimate feed intake accurately.
Experiment 2. Dietary composition was the same as in Exp. 1. The feed was irradiated with 10 mGy (1 mrad), in order to prevent any infection of the pigs through the feed. The animals were fed restrictedly according to liveweight twice a day, individually, at a daily intake of about 95 g feed per kg« liveweight. This was about 80% of the mean intake capacity, as estimated from Exp. 1. All animals within a calorimeter received the same amount of feed daily, as dry feed.
Measurement of N balance
Animals in cages. After a preliminary period of 1-2 weeks (depending upon live-weight of the animals), the N balance was measured during 7-day periods. Normally, two weeks of measurement were interchanged by one week of rest. In each animal, the N balance was measured 5 or 6 times between 25 and 65 kg liveweight and 5-7 times between 65 and 105 kg. N balance measurements included washing of cages with HCl-acidified water at the start and the end of balance periods together with analysis of the water at the end. Faeces was collected in bags attached to a har-nass. Bags were removed twice dayly and stored in the refrigerator, after adding 2 ml formaline, until analysis. Urine was collected in HCl solution in order to maintain pH <2, sampled and stored until analysis.
Animals in calorimeters. The same system was used for both experiments. After a preliminary period of one week the N balance was measured per calorimeter, during 7-day periods (M. W. A. Verstegen et al., in preparation). The measurements occurred continuously, in the whole growing/fattening period, except for 1-3 times one week of rest. Faeces and urine were collected as a mixture, weighed and analysed per week. At the end of each 7-day period the chambers were cleaned carefully and the washwater was added to the urine and faeces. Therefore the faeces and urine mixture also contained some feed residue and skin debris. Condensation water and air were collected separately for measuring N outflow by them. For all animals the nitrogen intake was measured by sampling the feed weekly and analysing it for dry matter. Composite samples of feed over weeks were made for N analysis.
Netherlands Journal of Agricultural Science 32 (1984) 305

S. H. M. METZ ET AL.
Comparative slaughter technique
Experiment 1. Both at the start, during and at the end of the experiments animals were slaughtered and chemically analysed. The number of animals slaughtered per treatment and their interrelationships are shown in Table 1. The 8 piglets killed at the start of the experiment, and full sibs of animals put on cages or in calorimeters, were analysed for both tissue and chemical composition. Crude protein, fat, muscle, bone and adipose tissue deposition were estimated for the remaining pigs in the different treatments assuming that at the same liveweight their initial body composition was equal to that of the slaughtered animals (as observed by de Wilde, 1977). Slaughtering of pigs occurred always after 24 hours' deprivation of feed and water. The pigs were weighed before leaving the experimental station and at the slaughterhouse immediately after killing by electroshock. Blood and entrails were collected and weighed, after which the gastro-intestinal tract was emptied, cleaned and weighed again. The carcass was weighed and divided carefully in two equal halves, which could be used separately for measuring different parameters. A summary of observations per slaughtered pig in each group is given in Table 2. Complete anatomical dissection of carcasses occurred according to the EC reference method (Commission of the European Communities, 1979) always on the right carcass half. Commercial dissection according to the IVO standard method (method 1; Bergström & Kroeske, 1968) was also performed on the right carcass half. Commercial dissection method 2 (Merelbeke dissection; de Wilde, 1977) was performed
Table 2. Summary of observations per slaughtered pig in Exp. 1.
Treatment1 Anatomical carcass composition2 Chemical Ultrasonic Adipose tissue ; composition backfat thickness composition
complete commercial dissection
dissection ; r~ ; 7T~ method 1 method 2
0 X - - X - X 1 X X X X X X 2 X X X X X X 3 X X - X X X 4 X X - X X X 5 X X X X X X 6 X X X X X X 7 X X X X X X 8 X X X X X X 9 X(4) X X X X X
10 X(4) X X X X X 11 X(4) X - X X X 12 X(4) X - X X X 13 X(4) X X(4) X X X
1 For further details, see Table 1. 2 Numbers in parenthesis represent numbers of animals if the method was applied to some animals in a
treatment group. For further details, see text.
306 Netherlands Journal of Agricultural Science 32 (1984)

ESTIMATION OF CARCASS AND GROWTH COMPOSITION IN GROWING PIG
on the complement carcass half. Chemical composition was based upon analysis of entrails, blood and one carcass half (without hair and claws). The amount of hair and claws was assumed to be 9.15 g dry matter per kgy" liveweight (de Wilde, 1977) and to consist purely of protein (N x 6.25). Adipose tissue composition was measured in backfat samples taken from the shoulder at the caudal side of the scapula, 3-7 cm from the median line (distance from the median line depending upon the live-weight). Measurements of dry matter (DM) and fat (diethyl ether extract) content were performed in both backfat layers, after removing the connective tissue layers covering the adipose tissues. Fat cell diameter measurements were performed only on the inner backfat layer.
Experiment 2. Eight pigs were slaughtered at the start and the remaining twenty-four at the end of the experiment. The procedures of slaughtering were similar to the procedures in Exp. 1. The pigs were not deprived of feed and water before slaughtering. Complete anatomical carcass dissection was done in all pigs and commercial dissection according to the IVO standard method was done for the 24 pigs slaughtered at the end. Chemical analysis of the whole body was made for all pigs.
Sampling and sample-processing
Samples of the feed were analysed for DM and crude protein (Nx6.25). Fresh samples of faeces and feaces + urine mixtures, acidified urine, acidified condensation water and acidified solution of NH3 from the air outflow were analysed for nitrogen. Blood, entrails and carcasses were frozen at -25 °C until homogenization and sampling. Samples were analysed for DM, ash, crude protein, and fat (as diethyl ether extract). Samples of adipose tissues from the backfat were analysed for DM and fat (diethyl ether extract) content, and fat cell size.
Analyses for fat, crude protein, ash and DM were carried out according to NEN methods (Nederlands Normalisatie Instituut, 1965, 1966, 1969 and 1974). Fat cell size was measured as the mean diameter of 200 osmium-fixed cells (according to Hirsch & Gallian, 1968) per sample of adipose tissue.
Statistics
Statistical analyses of the data consisted of computation of partial correlation coefficients with carcass weight constant and regression analyses.
Results
Carcass composition. In Table 3 the mean values of weight at slaughter and characteristics for carcass composition are shown for the groups of pigs slaughtered at about 105 kg live-weight. In Exp. 1 a considerable variation in carcass composition between groups of pigs, associated with feeding level, exists. The variation in carcass composition is rather small in Exp. 2. Generally the results indicate that with increasing propor-
Netherlands Journal of Agricultural Science 32 (1984) 307

S. H. M. METZ ETAL.
> u
h O M ri M iri oi ri O
O C\>
> e o o •b
(N \C Ó 00
rf O in On oc
c D B
'û <u a x UJ
0+ lu Dh
b Un OH
On r-•rr
o
a. x UJ
o o o <n r-vo od wo -t H
On t/~> CO CO
CO LT) m NO in ON °) <N O 0 NO NO (N 00 CO
O O
CO 0
On iri •^t
<N ^t CO
OO vi Tf-co 0 ON rj ON
CO ON
Ö ON
<N 0 O \D co O r-H Tt CO co -TJ- 00 r- co NO O ON NO <N ITi OO <N O ON 00 co Ö TT 00 NO V) NO
es 0 0 CO
ON ON ON 00 00
00 co NO r- ^î- r-> c-i 0 (N r- •^t r- LT) CO
^t "3" r-- •"t 0 On ö VO
NO co TT \6 NO uo CO ON On co
ON ON ON 00 00
l/-> m V") 00 00 r- 0 TJ- CO co -3-<N co <N p
1—1 tf 85
0 r--' •rf 0 Tt
ON CO \D \6 ITl Ö CO Ö 0 CO ON ON
(N Os
ON 00
Tj- 0 On "O <n) _ r- Tt CO O NO
CN V~- (N O O 00 Tj-ON *3" 74
00 0 V) u-) co Ti NO \Ô nd
rf 00 NO <rj
<N ON <N Os Ö
ON ON OO NO
O0
0 0 nO co •O cs! (N NO NO «/"i (N
rj <N TÎ; On 00 Tf TJ- 85
0 On ^f •^t On co ON no ""t ^î" CO On (N ON On O
On
l O CM r-- co p r-p Tt 00 ON O NO ON
CO 74
0 f-' 0 m r-»* co 00 NO in On
(N CO 0 Tf
On oi ON
ri On ON 00
<u
OD O 3" I £-3 g ü « O « " in ÔÛ '53
•S s
Ù0
x> S 3 Z
<L>
"a c o
B ü n
§ 'I ' 5 .« +
"3 M o S
S -S- B 3 « ca ro aj < K 03 X 3C J
E B
•H î£ s s •« ï£ s? ^ .y g vo g S x u o z o
Ü 11 ̂ ̂ • S. U r<° S r10 •g c d< ü il. ^ «
i£ i£
•V & tu
& S -
308 Netherlands Journal of Agricultural Science 32 (1984)
ESTIMATION OF CARCASS AND GROWTH COMPOSITION IN GROWING PIG
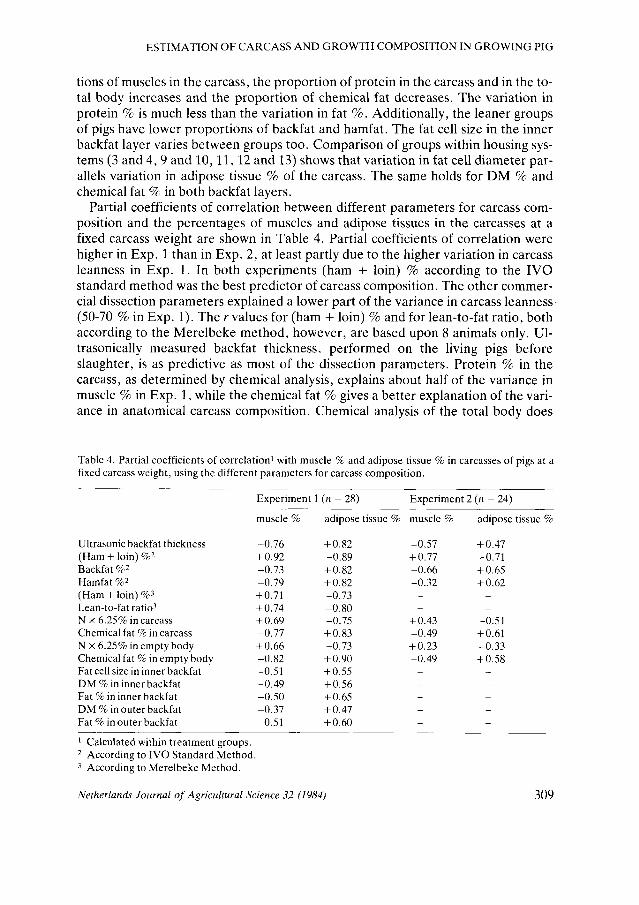
tions of muscles in the carcass, the proportion of protein in the carcass and in the total body increases and the proportion of chemical fat decreases. The variation in protein % is much less than the variation in fat %. Additionally, the leaner groups of pigs have lower proportions of backfat and hamfat. The fat cell size in the inner backfat layer varies between groups too. Comparison of groups within housing systems (3 and 4, 9 and 10,11,12 and 13) shows that variation in fat cell diameter parallels variation in adipose tissue % of the carcass. The same holds for DM % and chemical fat % in both backfat layers.
Partial coefficients of correlation between different parameters for carcass composition and the percentages of muscles and adipose tissues in the carcasses at a fixed carcass weight are shown in Table 4. Partial coefficients of correlation were higher in Exp. 1 than in Exp. 2, at least partly due to the higher variation in carcass leanness in Exp. 1. In both experiments (ham + loin) % according to the IVO standard method was the best predictor of carcass composition. The other commercial dissection parameters explained a lower part of the variance in carcass leanness' (50-70 % in Exp. 1). The r values for (ham + loin) % and for lean-to-fat ratio, both according to the Merelbeke method, however, are based upon 8 animals only. Ul-trasonically measured backfat thickness, performed on the living pigs before slaughter, is as predictive as most of the dissection parameters. Protein % in the carcass, as determined by chemical analysis, explains about half of the variance in muscle % in Exp. 1, while the chemical fat % gives a better explanation of the variance in anatomical carcass composition. Chemical analysis of the total body does
Table 4. Partial coefficients of correlation1 with muscle % and adipose tissue % in carcasses of pigs at a fixed carcass weight, using the different parameters for carcass composition.
Experiment 1 (n = 28) Experiment 2 (n = 24)
muscle % adipose tissue % muscle % adipose tissue %
Ultrasonic backfat thickness (Ham + loin) %2
Backfat %2
Hamfat %2
(Ham + loin) %3
-0.76 + 0.92 -0.73 -0.79 + 0.71 + 0.74 + 0.69 -0.77 + 0.66 -0.82 -0.51 -0.49 -0.50 -0.37 -0.51
+ 0.82 -0.89 + 0.82 + 0.82 -0.73 -0.80 -0.75 + 0.83 -0.73 + 0.90 + 0.55 + 0.56 + 0.65 + 0.47 + 0.60
-0.57 + 0.77 -0.66 -0.32
+ 0.47 -0.71 + 0.65 + 0.62
Lean-to-fat ratio3
N x 6.25% in carcass Chemical fat % in carcass N x 6.25% in empty body Chemical fat % in empty body Fat cell size in inner backfat
+ 0.43 -0.49 + 0.23 -0.49
-0.51 + 0.61 -0.33 + 0.58
DM % in inner backfat Fat % in inner backfat DM % in outer backfat Fat % in outer backfat
1 Calculated within treatment groups. 2 According to IVO Standard Method. 3 According to Merelbeke Method.
Netherlands Journal of Agricultural Science 32 (1984) 309

S. H. M. METZ ETAL.
Table 5. Regression of carcass composition on different parameters1.
R2 r.s.d. Experiment 1 Muscle % = c + 1.50(H + L)% + 0.017CW 0.94 0.94 (s.d. =3.28) = C-0.91BFT+0.145 CW 0.77 1.89
= c + 2.36CP% +0.023 CW 0.76 1.93 = c- 0.55CF% + 0.102 CW 0.78 1.83
Adipose tissue % = c-1.66(H+L)% + 0.042 CW 0.90 1.41 (s.d. =3.73) = c+ 1.12BFT-0.091 CW 0.82 1.91
= c-2.92CP% +0.061 CW 0.75 2.23 = c + 0.67CF%-0.039 CW 0.81 1.97
Experiment 2 Muscle %
(s.d. = 2.78) = c + 1.62(H+L)% +0.031 CW 0.91 0.95 Adipose tissue %
(s.d. = 3.03) = c- 1.61(H+L)% + 0.013 CW 0.90 1.08
1 Explanation of symbols: (H+L)% = ham + loin % (IVO Standard Method); CW = carcass weight (kg); BFT = backfat thickness (mm); CP% = carcass protein %; CF% = carcass fat %.
not give a better explanation of the variance in muscle and adipose tissue content in the carcass than chemical analysis of the carcass. Fat cell size in the inner backfat and DM % or fat % in either the inner or the outer backfat correlate moderately with muscle % and adipose tissue %. The coefficient of correlation was of the same level for cell size and DM or fat %. No clear differences were observed between the two backfat layers.
Regression analysis (Table 5) indicates that the muscle % in the carcass can be estimated very well from a linear combination of (ham + loin) % and carcass weight, with a residual standard deviation of 0.9 (residual coefficient of variation of about 1.5-2 %). Other characteristics like backfat thickness, carcass protein % and carcass fat % estimate carcass muscle % less accurate, with a coefficient of variation of about twice as much. For both experiments the results indicate that an increase in (ham + loin) % with 1 unit represents an increase of about 1.5 % in muscle % and a decrease of about the same size in adipose tissue % (Table 5). Per millimetre alteration in backfat thickness, muscle % alters with 1 unit and per % alteration in N x 6.25, muscle % alters with about 2.5 units. The relationship of different parameters with adipose tissue % is just opposite to that with muscle %, with slightly higher regression coefficients.
Composition of growth
Table 6 shows for both experiments growth composition for the different groups of pigs. The data show that on average the growth composition is somewhat leaner in Exp. 2 than in Exp. 1. Flowever, a considerable variation in the composition of carcass growth exists between groups of pigs within the experiments, due to variation in level of feed intake and variation in weight range (Exp. 1) and sex (Exp. 2). In
310 Netherlands Journal of Agricultural Science 32 (1984)

ESTIMATION OF CARCASS AND GROWTH COMPOSITION IN GROWING PIG
ON m V) CQ CO CO ri h
• m \D tJ- <N VC O O ON ro ^ ai o a d
i n O O O O r J - ( N h - t C O \ D r i O N ^ N ^
a ^ o o h T j - h m ^ H c c o N v O f n o a ^ O O O O N O N O O O N O O O N O O C N g
c/5 qj £ VI / M o u " ^ 5 r"? '"3 S3 U 03 W
o J h ^ T t o o w i O ^ H ^ T t c o i r i n o o o o D t n i J i ^ H O ^ N ^ t r j f o
U £ ' T i r i N ^ O O h r J O N O C C a ' T ' t ^ t ^ o u n t ^ ( N O r ^ j ' 0 ^ f ^ t r ~ - o o O L n ( N ( N N ( N ( N ( N r J M ( N M M ( N n M
IT) \0 O O <N oo r- o r-(N N N N OJ
£ <U a> tJj.—s > C M "1 M ^
l/~l IT) L/n IT) IT) I/-) >Vi i o i n o o > o i n i o > o o o o o o 0 ^ r i r H * Û > Û X M H n r H H H
X) £ ' z ' •O "O VD >0 I
<D :2 Jaä — <—! CS "O
O •£ 03 I £ o j Ä £ r - o o r ^ o o t ^ c o r > - o o r » - o o r ^ c o o
t) 0+ O
"3 o n t i o ^ M i o a o
c ben g
-o c
6.L [L c c S® ^ Cu CU O O ^
•i) cfl w u u S
Netherlands Journal of Agricultural Science 32 (1984) 311

S. H. M. METZ ET AL.
Table 7. Prediction of carcass tissue growth (g day-1) in the individual pig, from the deposition in g day1
of total body protein, fat or ash, measured by the comparative slaughter technique.
s.d. R2 r.s.d. n>
DMG2 (s.d. = 39) = -3 + 2.56 (± 0.26) x protein retention 0.66 23 (1) (s.d. = 24) = 106 + 1.51 (± 0.50) x protein retention 0.47 18 (2) (s.d. = 29) = 29 + 2.35 (± 0.96) x protein retention 0.38 24 (3)
DFTG2 (s.d. = 54) = 36 + 0.96 (± 0.03) x fat retention 0.95 12 (1) (s.d. = 31) = 62 + 0.93 (± 0.14) x fat retention 0.82 14 (2) (s.d. = 37) = 34 + 1.00 (± 0.12) x fat retention 0.93 14 (3)
DBG2 (s.d. = 6.9) = 3 + 0.41 (± 0.05) x protein retention 0.56 4.6 (1) (s.d. = 4.5) = 18 + 0.27 (± 0.10) x protein retention 0.44 3.5 (2) (s.d. = 4.6) = 0 + 0.43 (± 0.13) x protein retention 0.51 3.4 (3)
= 28 + 0.84 (± 0.20) x ash retention 0.26 6.0 (1) = 24 + 1.17 (± 0.55) x ash retention 0.56 3.9 (2) = 28 + 0.83 (± 0.67) x ash retention 0.13 4.5 (3)
1 (1) = Exp. 1, 52 castrated animals; (2) = Exp. 2,12 males; (3) = Exp. 2,12 females. 2 Explanation of symbols: DMG = daily carcass muscle growth; DFTG = daily carcass adipose tissue
growth; DBG = daily carcass bone growth.
most treatment groups carcass muscle growth is higher than adipose tissue growth; exceptions are the 100 % and some 85 % feed intake groups in Exp. 1. The N deposition according to the balance method shows always higher values than the N deposition as measured by the comparative slaughter technique does, with on average the highest discrepancies for the pigs on cages (groups 1-4 from Exp. 1).
The estimation of carcass tissue growth can be done adequately by measuring total body protein or fat retention by using the comparative slaughter technique (Table 7). Variation in protein retention explains the biggest part of variation in daily muscle or bone growth in the experimental period in Exp. 1, while the explanation is somewhat lower in Exp. 2. In both experiments residual coefficient of variation is about 6-9 % for daily muscle growth and 8-10 % for daily bone growth. Fat retention explains most of the variation in daily carcass adipose tissue growth, with a residual coefficient of variation of 5-7 %. Ash retention is inferior to protein retention as parameter for daily bone growth. Protein retention is of no value for explaining variation in fatty tissue growth and fat retention does not significantly explain variation in muscle or bone growth (not shown in Table 7).
The results in Table 7 show also that for 52 animals in Exp. 1 per gram of deposited total body protein slightly more than 2.5 g of carcass muscles (standard deviation 0.26) is deposited and about 0.4 g of bones (standard deviation 0.05). The regression coefficients are somewhat different for the animals in Exp. 2, with a much higher standard deviation however. Per gram of fat deposition slightly less than 1 g of carcass fatty tissue was deposited in Exp. 1 (standard deviation 0.03). Similar regression coefficients were found in Exp. 2.
Comparison of N balance technique with N retention according to the comparative slaughter technique reveals that in the animals on cages the prediction of daily
312 Netherlands Journal of Agricultural Science 32 (1984)
ESTIMATION OF CARCASS AND GROWTH COMPOSITION IN GROWING PIG
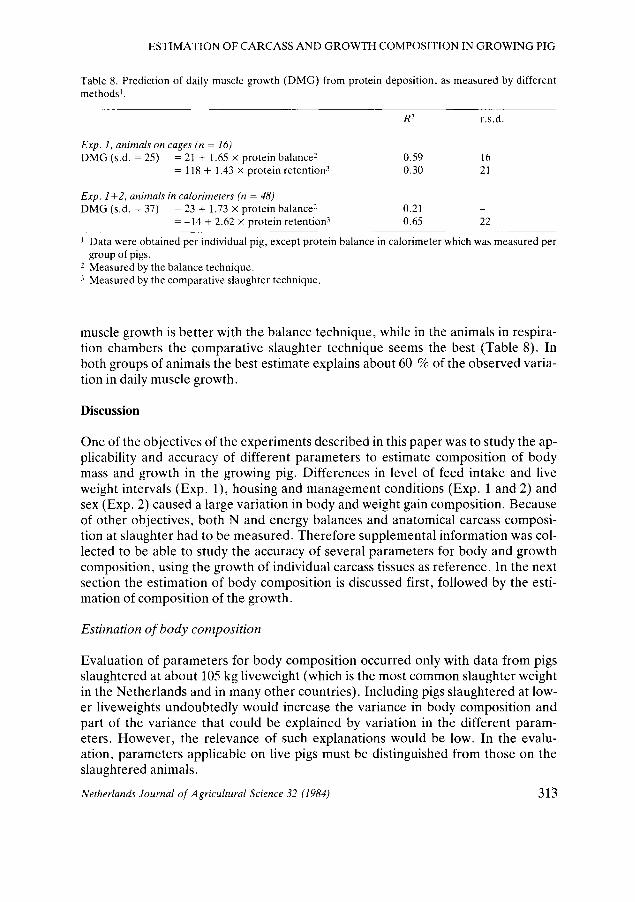
Table 8. Prediction of daily muscle growth (DMG) from protein deposition, as measured by different methods1.
R2 r.s.d.
Exp. 1, animals on cages (n = 16) DMG (s.d. = 25) = 21 + 1.65 x protein balance2 0.59 16
= 118 + 1.43 x protein retention-1 0.30 21
Exp. 1+2, animals in calorimeters (n = 48) DMG (s.d. = 37) = 23 + 1.73 x protein balance2 0.21 -
= -14 + 2.62 x protein retention3 0.65 22
1 Data were obtained per individual pig, except protein balance in calorimeter which was measured per group of pigs.
2 Measured by the balance technique. 3 Measured by the comparative slaughter technique.
muscle growth is better with the balance technique, while in the animals in respiration chambers the comparative slaughter technique seems the best (Table 8). In both groups of animals the best estimate explains about 60 % of the observed variation in daily muscle growth.
Discussion
One of the objectives of the experiments described in this paper was to study the applicability and accuracy of different parameters to estimate composition of body mass and growth in the growing pig. Differences in level of feed intake and live weight intervals (Exp. 1), housing and management conditions (Exp. 1 and 2) and sex (Exp. 2) caused a large variation in body and weight gain composition. Because of other objectives, both N and energy balances and anatomical carcass composition at slaughter had to be measured. Therefore supplemental information was collected to be able to study the accuracy of several parameters for body and growth composition, using the growth of individual carcass tissues as reference. In the next section the estimation of body composition is discussed first, followed by the estimation of composition of the growth.
Estimation of body composition
Evaluation of parameters for body composition occurred only with data from pigs slaughtered at about 105 kg liveweight (which is the most common slaughter weight in the Netherlands and in many other countries). Including pigs slaughtered at lower liveweights undoubtedly would increase the variance in body composition and part of the variance that could be explained by variation in the different parameters. However, the relevance of such explanations would be low. In the evaluation, parameters applicable on live pigs must be distinguished from those on the slaughtered animals.
Netherlands Journal of Agricultural Science 32 (1984) 313
S. H. M. METZETAL.
Live pigs In this study the most interesting characteristic for carcass muscle appears to be backfat thickness, measured ultrasonically. The observed level of accuracy for backfat thickness fits very well with data from other studies (Kempster et al., 1981). Its interest is based upon both a reasonable accuracy and the possibility to obtain that parameter quite easily (by a trained person) on the live animal. The latter argument is rather important for practical applicability (Hedrick, 1983). In practical conditions, large variations in carcass composition of pigs at slaughter weight exist (Schön, 1973; Nijeboer, 1979), so that the residual CV of about 4 % is satisfactory. For breeding and experimental purposes one would wish an even more accurate method than backfat thickness for getting reliable information on the leanness of individual animals; this method should not be too expensive. However, one may doubt whether such methods become available. Addition of information on adipose tissue area does not increase the accuracy of prediction of carcass composition and information on the longissimus dorsi area does only to a small extent (Kempster et al., 1982). Recent results by Molenaar (1984) indicate that combining the ultrasonically measured longissimus dorsi area with backfat thickness may substantially improve the accuracy of estimating body composition as compared with backfat thickness alone. Measurement of the longissimus dorsi area is, however, a more time-consuming and expensive method. The other parameters in our study applicable to live animals, chemical and histological adipose tissue parameters, are inadequate as predictors for carcass composition as they are both only half as accurate as backfat thickness, more harmful to the pig and more laborious. The low predictive value of dry matter and fat content in adipose tissue agrees with the observation of Metz et al. (1980) that the variation in DM or fat content in adipose tissue from the backfat of slaughter pigs is rather small relative to the variation in carcass adipose tissue mass. The results from Exp. 1 confirm this observation as can be seen from the much lower coefficients of variation (CV) for adipose tissue chemical composition data than for muscle % and adipose tissue % in the carcass (Table 3). Due to the low variation in adipose tissue composition, the methodological standard errors of the determination of DM or fat content are rather high in proportion to the variation in DM or fat content in backfat, preventing the latter of being a tool for accurate estimation of carcass composition. The observed low accuracy of the relationship between fat cell size and composition of the carcass in experiment 1 (r = 0.5-0.6; see Table 4) was comparable to that observed by Wood et al. (1978) in Large White pigs. This low accuracy confirms the inadequacy of fat cell size for estimating carcass composition. This seems somewhat surprising as it is generally believed that variation in fat cell size, and not variation in fat cell number, is mainly responsible for variation in fatness of the pig carcass (Anderson, 1972; Wood et al., 1978). However, the accuracy of estimating fat cell number of by far too low to exclude the possibility that variation in fat cell number explains a substantial part of the variation in fatness between pigs within a population. Additionally, fat cell size varies considerably between different locations in the body, even at low distances (Metz, unpublished results), which makes it almost impossible to sample adipose tissue from different animals routinely at comparable sites.
314 Netherlands Journal of Agricultural Science 32 (1984)

ESTIMATION OF CARCASS AND GROWTH COMPOSITION IN GROWING PIG
Pigs after slaughter Carcass muscle % and adipose tissue % can be estimated quite accurately by a commercial dissection method, with the trimmed ham + loin as parameter: the residual s.d. is less than 2 % of the mean muscle % and 3-4 % of the mean adipose tissue % (Table 5). Although muscle % in a carcass and (ham + loin) % are not fully independent (ham + loin contain about Vâ of total carcass muscle), it does not restrict the value of (ham + loin) % as a handsome tool for estimating carcass composition in slaughtered pigs, both for experimental and for practical purposes. A commercial dissection normally occurs on carcasses and (ham + loin) % can easily be measured precisely. Additionally, a commercial dissection may even estimate the commercial value better than a complete dissection. But still, in that situation, for scientific and breeding purposes, the latter has to be considered as most important for accurate estimation of carcass leanness. In estimating the amount of carcass muscles, backfat % or hamfat % appear inadequate as they are inferior to (ham + loin) % and give no better information than the ultrasonically measured backfat thickness, which has other advantages (as mentioned before). The published data for the Me-relbeke dissection parameters were only based upon 8 animals and are therefore insufficient to evaluate this method; it can be said that the observed relationships with carcass muscle % and adipose tissue % are promising.
Chemical analysis of carcasses does not appear to estimate carcass muscle better than commercial dissection. In order to estimate under experimental conditions the value of pig carcasses for human consumption, therefore, chemical analysis of carcasses is inefficient as it is rather laborious and expensive. However, that does not restrict the value of comparative slaughter technique plus chemical analysis for feed evaluation purposes since, if performed adequately, it estimates in the most reliable way the deposition of organic substances in the pig.
Several other parameters for body composition have been evaluated in the past (Kempster et al., 1982; Hedrick, 1983; Shields, 1983), but it falls beyond the scope of this paper to discuss these.
It can be concluded that for estimating body composition in the live animal ultrasonically measured backfat thickness combined with live weight is most adequate and for the slaughtered animal (ham + loin) % estimated by commercial dissection is very promising. Only if most precise information is needed, complete anatomical dissection, used as reference in this study, or eventually chemical analyses are needed.
Estimation of growth composition
Estimates of growth composition in the pig are of great interest for both scientific and practical purposes. As far as carcass muscle growth is concerned N retention is an excellent parameter because protein (=N x 6.25) deposition is a fixed part of lean tissue growth, rather independent from the amount of body fat (Hörnicke, 1959). Within a category of pigs, for example growing/fattening pigs, variation in lean tissue growth parallels variation in carcass muscle growth and a fairly constant part of the protein deposition during growth is deposited in the edible tissues (Os-
Netherlands Journal of Agricultural Science 32 (1984) 315

S. H. M. METZ ET AL.
lage, 1965). By far the most widespread method for measuring protein deposition is the N balance technique. The N balance technique allows to measure the protein deposition during each stage of life, continuously or at intervals, without disturbing the animal seriously. However, it has been recognized for a long time that N balance measurements may overestimate protein deposition in the pig considerably as compared with the comparative slaughter technique (Just Nielsen, 1970; van Es, 1975). The latter method has to be considered as the most reliable, if performed adequately, but the method is expensive and unsuitable for short growth periods. As long as relative differences between treatments are the main goal, the N balance technique may be applicable; for obtaining absolute values, in long-term experiments one should use the comparative slaughter technique (Just, 1982).
The results with 16 animals in cages in Exp. 1 indicate (Table 8) a quite close relationship between N balance and muscle growth (R2 = 0.59). The regression equation showing the relationship between daily muscle growth and N balance for 48 animals in calorimeters (DMG = 23 + 1.73 x N balance) is, despite a much lower R2, almost identical to the equation for the animals in cages (DMG = 21 + 1.65 x N balance). However, the R2 (=0.21) underestimates the accuracy of the relationship for the 48 animals, as the protein balance data were mean values for groups of pigs per calorimeter (inevitable, due to methodological procedures), and the DMG values were from the individual animals. The data from the experiments presented in this paper do not quantify the reliability of the N balance method for measuring variation in daily muscle growth. But its value for estimating relative differences in protein retention or meat growth, as mentioned by Just, is certainly supported by the results in this paper.
Translation of N balance data in absolute lean deposition data is impossible. Comparison of relative lean deposition data is only possible within restricted time periods within locations, where in all steps the same balance technique is used accurately.
Protein and fat retention according to the comparative slaughter technique predicts variance in carcass muscle, adipose tissue or bone growth with a reasonable accuracy (Table 7). The R2 indicates that most of the variation in carcass muscle, adipose tissue or bone growth can be explained by the comparative slaughter technique. The regression equations in Tables 7 and 8 indicating that 1 g of protein deposition leads to about 2.5 g of carcass muscle growth, seems from a physiological point of view quite reliable as several authors indicate that per gram of protein deposition 4 to 5 g of fat-free tissue is deposited (Kotarbinska, 1969; Metz et al., 1980) and about 55 % of total body protein is deposited in carcass muscles (Just & Peder-sen, 1976). Additionally, the regression equations indicating that per gram of fat deposition almost 1 g of adipose tissue growth is observed seems also physiologically quite reliable. Fat deposition is as physiological process not accompanied by water deposition; adipose tissues as isolated by anatomical dissection mainly exist of chemical fat (about 70 %; Metz et al., 1980) and most of the total body fat deposition occurs in carcass adipose tissues (Metz et al., 1980).
Thus the results in this paper seem to present from both statistical and physiological point of view a reliable relationship between N, fat and, to a lesser extent, ash
316 Netherlands Journal of Agricultural Science 32 (1984)
ESTIMATION OF CARCASS AND GROWTH COMPOSITION IN GROWING PIG
deposition as measured by the comparative slaughter technique with carcass tissue growth. In that way its applicability for some practical purposes, like feed evaluation as mentioned by others (Just Nielsen, 1970; de Wilde, 1977) is confirmed.
A comparison between the balance technique and the comparative slaughter technique based upon the results in this study is not easy. The comparative slaughter technique seems adequate, but gives only one datum per animal and the animal has to be killed for getting that datum. The comparative slaughter technique may be vitiated with errors due to differences in composition between control and experimental animals at the start of experiment, especially when the deposition of body mass is small relative to the initial amount, and is very sensitive to accuracy of work. A similar sensitivity to accuracy of procedures holds for the N balance method, which allows measurements of protein deposition during each stage of postnatal life, repeatedly within an animal. However, the results in this paper confirm the general observation (Just et al., 1982) that the N balance overestimates N deposition; unfortunately to a rather high and variable extent between the different treatment groups. The results presented in Table 8 indicate that despite this disadvantage of overestimating N deposition the balance technique may allow an as accurate estimation of variation in carcass tissue growth as comparative slaughter technique does. It must be emphasized, however, that the overestimation of protein deposition in balance experiments deserves continuous concern in order to get the real values.
In conclusion, composition of growth in the pig can be estimated by measuring N retention by the balance technique or N and fat retention by the comparative slaughter technique, the latter being necessary when absolute information on growth composition is needed. The balance technique seems applicable if relative differences between pigs or groups of pigs are the aim, despite its overestimation of N deposition.
Acknowledgements
The authors thank E. Maes, P. N. de Groot and R. A. Dekker for assistance in performing the experiments and the analyses.
References
Aberle, E. D., T. D. Etherton & C. E. Allen, 1977. Prediction of pork carcass composition using subcutaneous adipose tissue moisture or lipid concentration. Journal of Animal Science 45: 449-456.
Anderson, D. B., 1972. The cellular development of adipose tissues. Proceedings 25th Annual Reciprocal Meat Conference of the American Meat Science Association, 9-39.
Bergström, P. L. & D. Kroeske, 1968. Methods of carcass assessment in research on carcass quality in the Netherlands. I. Description of methods. I. V.O. Report C-123.
Commission of the European Communities, 1979. Development of uniform methods for pig carcass classification in the EC. Information on Agriculture, No 70.
Cöp, W. A. G., 1974. Protein and fat deposition in pigs in relation to bodyweight gain and feeding level. Mededelingen Landbouwhogeschool, Wageningen 74-18.
Es, A. J. H. van, 1975. Interpretation of N-balance experiments. Proceedings 9th International Congress on Nutrition (Mexico, 1972) Vol. 3: 107-113.
Netherlands Journal of Agricultural Science 32 (1984) 317

S. H. M. METZ ET AL.
Hedrick, H. B., 1983. Methods of estimating live animal and carcass composition. Journal of Animal Science 57: 1316-1327.
Hirsch, J. & E. Gallian, 1968. Methods for the determination of adipose cell size in man and animals. Journal of Lipid Research 9: 110-119.
Hörnicke, H., 1959, Methoden zur Bestimmung der Körperzusammensetzung lebenden Schweine. Habilitationsschrift, Tierärtzlichen Hochschule, Hannover.
Just, A. & O. K. Pedersen, 1976. Danish investigations concerning body composition of pigs in relation to nutrition, sex and slaughter weight. Livestock Production Science 3: 271-284.
Just, A., J. A. Fernandez & H. Jörgensen, 1982. Nitrogen balance studies and nitrogen retention. In: Laplace et al. (Eds.), Digestive physiology in the pig. Les Colloques de 1'INRA No. 12, pp. 111-122.
Just Nielsen, A., 1970. The energy value of balanced feed rations for growing pigs determined by different methods. Beretning fra Forsogslaboratoriet 381.
Kempster, A. J., A. Cuthberson & G. Harrington, 1982. Carcass evaluation in livestock breeding, production and marketing. Granada Publishing Ltd., London etc..
Kempster, A. J. & A. Cuthbertson, 1981. Prediction of carcass composition using backfat thickness. 32nd Annual Meeting of the EAAP, Paper PIV-1.
Kotarbinska, M., 1969. Badania nad przemiana energii u rosnacych swin. Institut Zootechniki, Wydaw-nictwa Wlasma No 238.
Metz, S. H. M., P. L. Bergström, N. P. Lenis, M. de Wijs & R. A. Dekker, 1980. The effect of daily energy intake on growth rate and composition of weight gain in pigs. Livestock Production Science 7: 79-87.
Metz, S. H. M., M. de Wijs & R. A. Dekker, 1980. The composition of adipose tissue and its usefulness as a parameter for carcass composition in growings pigs. Livestock Production Science 7: 291-296.
Molenaar, B. A. J., 1984. Results of real time ultrasonic scanning in estimating lean tissue ratios in live pigs. 35th EAAP Annual Meeting, P5.15.
Nederlands Normalisatie Instituut, 1965, 1966, 1969 and 1974. Test methods for feeding stuffs: Determination of fat content, NEN 3148; Determination of protein content, NEN 3145; Determination of ash content, NEN 3329; Determination of moisture content, NEN 3332.
Nehring, K., R. Schiemann & L., Hoffmann, 1969. A new system of energetic evaluation of food on the basis of net energy for fattening. In K. L. Blaxter et al. (Eds.), Energy metabolism of farm animals. EAAP Publication No 12: 41-50.
Oslage, H. J., 1965. Untersuchungen zum Stoff- und Energieumsatz wachsenden Mastschweine. Landbauforschung Volkenrode 15: 1-20; 107-138.
Nijeboer, H., 1979. Vleespercentagebepalingen met de Deense KSA-meter bij Nederlandse slachtvar-kens. IVO-rapport B-153.
Rogdakis, E., 1972. Untersuchungen über die Aktivität von NADP-abhängigen Dehydrogenasen im Fettgewebe des Schweines als Index for den Fettansatz. Dissertation, Universität Hohenheim.
Schön, L., 1973. Handelsklassen für Schweinehälften. A.I.D., Bonn-Bad Godesberg No 248 (revised). Shields Jr., R. G. & D. C. Mahan, 1983. Evaluation of ground carcass, sawdust residue and specific
gravity methods for estimating body composition of reproducing swine. Journal of Animal Science 57: 604-608.
Wood, J. D., M. B. Enser & D. J. Restall, 1978. The cellularity of backfat in growing pigs and its relationship with carcass composition. Animal Production 27: 1-10.
Wilde, R. de, 1977. Studie van een methode ter bepaling van eiwit- en energieretenties bij mestvarkens gebaseerd op karkasanalyse. Mededelingen Faculteit Diergeneeskunde, R. U. Gent No 3-4.
318 Netherlands Journal of Agricultural Science 32 (1984)