Estimation of axial curvature of anterior sclera...
11
RESEARCH ARTICLE Open Access Estimation of axial curvature of anterior sclera: correlation between axial length and anterior scleral curvature as affected by angle kappa Sang-Mok Lee 1,2 , Hyuk Jin Choi 2,3 , Heejin Choi 4 , Mee Kum Kim 2,3 and Won Ryang Wee 2,3* Abstract Background: Though the development and fitting of scleral contact lenses are expanding steadily, there is no simple method to provide scleral metrics for scleral contact lens fitting yet. The aim of this study was to establish formulae for estimation of the axial radius of curvature (ARC) of the anterior sclera using ocular biometric parameters that can be easily obtained with conventional devices. Methods: A semi-automated stitching method and a computational analysis tool for calculating ARC were developed by using the ImageJ and MATLAB software. The ARC of all the ocular surface points were analyzed from the composite horizontal cross-sectional images of the right eyes of 24 volunteers; these measurements were obtained using anterior segment optical coherence tomography for a previous study (AS-OCT; Visante). Ocular biometric parameters were obtained from the same volunteers with slit-scanning topography and partial coherence interferometry. Correlation analysis was performed between the ARC at 8 mm to the axis line (ARC[8]) and other ocular parameters (including age). With ARC obtained on several nasal and temporal points (7.0, 7.5, 8.0, 8.5, and 9.0 mm from the axis line), univariate and multivariate linear regression analyses were performed to develop a model for estimating ARC with the help of ocular biometric parameters. Results: Axial length, spherical equivalent, and angle kappa showed correlations with temporal ARC[8] (tARC[8]; Pearson’s r = 0.653, −0.579, and −0.341; P = 0.001, 0.015, and 0.015, respectively). White-to-white corneal diameter (WTW) and anterior chamber depth (ACD) showed correlation with nasal ARC[8] (nARC[8]; Pearson’s r = −0.492 and −0. 461; P = 0.015 and 0.023, respectively). The formulae for estimating scleral curvatures (tARC, nARC, and average ARC) were developed as a function of axial length, ACD, WTW, and distance from the axis line, with good determinant power (72 − 80 %; SPSS ver. 22.0). Angle kappa showed strong correlation with axial length (Pearson’s r = −0.813, P <0. 001), and the different correlation patterns of nasal and temporal ARC with axial length can be explained by the ocular surface deviation represented by angle kappa. Conclusions: Axial length, ACD, and WTW are useful parameters for estimating the ARC of the anterior sclera, which is important for the haptic design of scleral contact lenses. Angle kappa affects the discrepancies between the nasal and temporal scleral curvature. Keywords: Sclera, Biometry, Radius, Optical coherence tomography, Regression analysis, Contact lenses * Correspondence: [email protected] Part of this study was presented at the annual congress of the European Society of Cataract and Refractive Surgeons, Barcelona, Spain, September 2015. 2 Laboratory of Corneal Regenerative Medicine and Ocular Immunology, Seoul Artificial Eye Center, Seoul National University Hospital Biomedical Research Institute, Seoul, Republic of Korea 3 Department of Ophthalmology, Seoul National University College of Medicine, 101 Daehang-ro, Jongno-gu, Seoul 110-744, Republic of Korea Full list of author information is available at the end of the article © 2016 The Author(s). Open Access This article is distributed under the terms of the Creative Commons Attribution 4.0 International License (http://creativecommons.org/licenses/by/4.0/), which permits unrestricted use, distribution, and reproduction in any medium, provided you give appropriate credit to the original author(s) and the source, provide a link to the Creative Commons license, and indicate if changes were made. The Creative Commons Public Domain Dedication waiver (http://creativecommons.org/publicdomain/zero/1.0/) applies to the data made available in this article, unless otherwise stated. Lee et al. BMC Ophthalmology (2016) 16:176 DOI 10.1186/s12886-016-0355-5
Transcript of Estimation of axial curvature of anterior sclera...

RESEARCH ARTICLE Open Access
Estimation of axial curvature of anteriorsclera: correlation between axial length andanterior scleral curvature as affected byangle kappaSang-Mok Lee1,2, Hyuk Jin Choi2,3, Heejin Choi4, Mee Kum Kim2,3 and Won Ryang Wee2,3*
Abstract
Background: Though the development and fitting of scleral contact lenses are expanding steadily, there is nosimple method to provide scleral metrics for scleral contact lens fitting yet. The aim of this study was to establishformulae for estimation of the axial radius of curvature (ARC) of the anterior sclera using ocular biometricparameters that can be easily obtained with conventional devices.
Methods: A semi-automated stitching method and a computational analysis tool for calculating ARC were developed byusing the ImageJ and MATLAB software. The ARC of all the ocular surface points were analyzed from the composite horizontalcross-sectional images of the right eyes of 24 volunteers; these measurements were obtained using anterior segment opticalcoherence tomography for a previous study (AS-OCT; Visante). Ocular biometric parameters were obtained from the samevolunteers with slit-scanning topography and partial coherence interferometry. Correlation analysis was performed between theARC at 8 mm to the axis line (ARC[8]) and other ocular parameters (including age). With ARC obtained on several nasal andtemporal points (7.0, 7.5, 8.0, 8.5, and 9.0 mm from the axis line), univariate and multivariate linear regression analyses wereperformed to develop a model for estimating ARC with the help of ocular biometric parameters.
Results: Axial length, spherical equivalent, and angle kappa showed correlations with temporal ARC[8] (tARC[8];Pearson’s r = 0.653, −0.579, and −0.341; P = 0.001, 0.015, and 0.015, respectively). White-to-white corneal diameter(WTW) and anterior chamber depth (ACD) showed correlation with nasal ARC[8] (nARC[8]; Pearson’s r = −0.492 and −0.461; P = 0.015 and 0.023, respectively). The formulae for estimating scleral curvatures (tARC, nARC, and average ARC)were developed as a function of axial length, ACD, WTW, and distance from the axis line, with good determinantpower (72 − 80 %; SPSS ver. 22.0). Angle kappa showed strong correlation with axial length (Pearson’s r = −0.813, P <0.001), and the different correlation patterns of nasal and temporal ARC with axial length can be explained by the ocularsurface deviation represented by angle kappa.
Conclusions: Axial length, ACD, and WTW are useful parameters for estimating the ARC of the anterior sclera, which isimportant for the haptic design of scleral contact lenses. Angle kappa affects the discrepancies between the nasal andtemporal scleral curvature.
Keywords: Sclera, Biometry, Radius, Optical coherence tomography, Regression analysis, Contact lenses
* Correspondence: [email protected] of this study was presented at the annual congress of the EuropeanSociety of Cataract and Refractive Surgeons, Barcelona, Spain, September2015.2Laboratory of Corneal Regenerative Medicine and Ocular Immunology,Seoul Artificial Eye Center, Seoul National University Hospital BiomedicalResearch Institute, Seoul, Republic of Korea3Department of Ophthalmology, Seoul National University College ofMedicine, 101 Daehang-ro, Jongno-gu, Seoul 110-744, Republic of KoreaFull list of author information is available at the end of the article
© 2016 The Author(s). Open Access This article is distributed under the terms of the Creative Commons Attribution 4.0International License (http://creativecommons.org/licenses/by/4.0/), which permits unrestricted use, distribution, andreproduction in any medium, provided you give appropriate credit to the original author(s) and the source, provide a link tothe Creative Commons license, and indicate if changes were made. The Creative Commons Public Domain Dedication waiver(http://creativecommons.org/publicdomain/zero/1.0/) applies to the data made available in this article, unless otherwise stated.
Lee et al. BMC Ophthalmology (2016) 16:176 DOI 10.1186/s12886-016-0355-5

BackgroundThe sclera is a dense, fibrous, and viscoelastic connectivetissue that covers approximately 85 % of the surface areaof the eyeball [1, 2]. The connective tissue matrix is com-posed of bundles of parallel-aligned collagen fibrils andprovides the strength and resilience needed for optical sta-bility during eye movement [1]. Although the sclera stillremains an under-researched area, it has recently drawnattention in investigations of ocular disease and pathologybecause of the importance of scleral properties and bio-mechanics [1–3]. In addition, recent studies haveattempted to measure scleral metrics by anterior segmentoptical coherence tomography (AS-OCT) [4–6].The development and fitting of scleral contact lenses are
expanding steadily owing to their unique therapeutic rolein ocular surface diseases and corneal ectasia, with recentadvancements in rigid contact lens materials [7, 8]. Unlikethe fitting of smaller, conventional rigid gas permeablelenses that can be assisted by corneal metrics easily ac-quired using conventional imaging devices, the fitting ofscleral lenses is still time-consuming and experiencedependent because no conventional devices have yet beendeveloped that can primarily provide scleral metrics [3, 9].Therefore, the trial fitting of its haptic (scleral) part beginsusually based on the corneal metrics, which is already wellknown to be poorly correlated with scleral metrics [3, 6].To improve the difficult fitting process that limits wideruse of scleral lenses, measurement of scleral metrics andpost-fitting assessments using AS-OCT have drawn atten-tion recently [3, 8, 10]. As one of these attempts, we havedeveloped a manual method to calculate the axial radiusof curvature (ARC), by 1) incorporating three horizontalcross-sectional AS-OCT images into a composite imageusing Microsoft PowerPoint (version 2007, Redmond,WA, USA), 2) identifying the x and y coordinates of sixscleral points (three nasal and three temporal) on thecomposite image, and 3) calculating the ARC with aspreadsheet or radius of a best-fit circle with commercialimage analysis software [9]. Although this method demon-strated excellent reliability and accuracy, it requires exten-sive training to get repetitive results. Further, it is time-consuming, and requires an expensive image processingsoftware and an AS-OCT machine.Therefore, the aim of this study was to establish a sim-
pler and more automated method for calculating ARC ofthe anterior sclera using AS-OCT images and to developformulae to estimate ARC using more easily measurableocular biometric parameters.
MethodsSubjectsThe images of the right eyes of healthy volunteers whowere enrolled in our previous study were reanalyzed forthe ARC using a newly developed automated method.
The volunteers were enrolled after thorough history tak-ing and a full ophthalmic examination [9]. The subjectswith the following history and findings were excludedfrom enrollment: previous scleral or conjunctival dis-eases, ocular surgeries involving the sclera or conjunc-tiva, current conjunctival degenerative changes includingpinguecula or pterygium, or current contact lens wearer.Twenty-four Asian participants were enrolled, includ-
ing 12 women and 12 men, with a mean age of 31.3 ±6.5 years (Table 1). Only data from the right eye wereused for the analysis. Subgroup analysis was performedby grouping the 24 eyes into four groups according toaxial length, two groups according to white-to-whitecorneal diameter (WTW), and four groups according toanterior chamber depth (ACD), to demonstrate thechanges in ARC in the wider nasal and temporal scleralareas (7.0, 7.5, 8.0, 8.5, and 9.0 mm from the axis line)according to the parameters.
Acquisition of the ocular biometric data and anteriorsegment tomographic imagesAfter the full ophthalmic examination using a slit lamp,each subject underwent the following ocular biometricdata measurements: refractive status (spherical equivalent)with an autorefractor/keratometer (RK-F1; Canon, Tokyo,Japan); angle kappa, simulated keratometric value (Sim K),WTW, thinnest corneal thickness, ACD (from endothe-lium) with slit-scanning topography (Orbscan II, Bauschand Lomb, Rochester, NY, USA); and axial length withpartial coherence interferometry (IOLMaster Version 5.4;Carl Zeiss Meditech Inc., Dublin, CA, USA).The cross-sectional ocular images obtained in the pre-
vious study from the same volunteers were used for anew analytical method [9]. Briefly, three horizontal im-ages, each centered on the visual axis, temporal cornea,and nasal cornea were obtained by using AS-OCT
Table 1 Mean values and ranges of the age and ocularbiometric parameters
Parameter Unit Mean SD Range
Age years 31.3 6.5 24 − 54
Sim Kmax D 44.1 1.2 42.4 − 47.0
Sim Kmin D 42.6 1.4 40.7 − 46.7
SE D −3.34 3.13 −8.88 − +1.13
WTW mm 11.6 0.3 11.1 − 12.3
Thinnest corneal thickness μm 530 42 477 − 607
ACD mm 2.99 0.30 2.28 − 3.47
Angle Kappa degree 4.3 1.3 1.68 − 6.39
Axial length mm 25.0 1.5 21.9 − 27.6
Sim Kmax maximum simulated keratometric value, Sim Kmin minimumsimulated keratometric value, SE spherical equivalent, WTW white-to-white cor-neal diameter, ACD anterior chamber depth from endothelium, D diopters, SDstandard deviation
Lee et al. BMC Ophthalmology (2016) 16:176 Page 2 of 11

(Visante OCT, Carl Zeiss Meditec Inc, Dublin, CA) withnasal and temporal external targets that were located ap-proximately 15° from the primary position to align thethree images on the same horizontal plane [9].
Analysis of the scleral curvatureTo analyze the ARC in the sclera, composite center,nasal, and temporal tomographic images were neededbecause the current AS-OCT scanner provides imageswith a maximum width of 16 mm, which cannot includethe cornea and enough scleral area together in a singleimage, which is mandatory to analyze axial curvaturesby definition (Fig. 1).After rotating the nasal and temporal horizontal im-
ages by using the image rotate function of a public do-main Java-based image processing program ImageJ(Version 1.49p; National Institutes of Health, Bethesda,MD), the composite images were created semi-automatically using the MosaicJ plugin (Additional file 1:Figure S1). MosaicJ is a plugin for ImageJ that stitchesoverlapping images together with fine adjustments tocorrect for the small degrees of horizontal, vertical, androtational misalignment [11].The concept of ARC is shown in Fig. 1, and the axis line
was defined as a bright vertical flare line that passes thecorneal apex and is parallel to the visual axis [9]. Aftermanually removing the strong reflection background fromthe corneal apex of the composite image of the AS-OCT
by using ImageJ, the ARC was automatically calculatedwith the image processing and optimization toolbox ofMATLAB (MathWorks, Natick, MA). In other words, theimage was preprocessed to remove background noise withthe simple thresholding filter in MATLAB differentiatingthe intensity between the background noise and the signalfrom the ocular surface. The shape of the outermost layerof the ocular surface was subsequently extracted andcurve-fitted using an eighth-order polynomial. The orderof polynomial function was determined to identify the bestapproximation to the shape of the ocular surface. Theocular surface typically has three convex curves that cor-respond to temporal sclera, cornea, and nasal sclera. Inaddition, the shape of the ocular surface can be approxi-mated as a smooth curve without any sharp point. Thus,the ocular surface has at least four inflection points, andthe minimum polynomial order that satisfies this condi-tion is six. We also noticed that the R2 value further de-creased as the order increased to higher even order andwe chose the eighth order for this study. A mathematicalformula based on the definition of the axial curvature wasderived, and can be expressed as follows:
RA x1ð Þ ¼ d
ffiffiffiffiffiffiffiffiffiffiffiffiffiffiffiffiffiffiffiffiffiffi
1þ 1
f0x1ð Þ2
s
; d ¼ x1−xaj j
where RA is the ARC, xa is the position of the axis line,f(x) is the eighth-order polynomial representing the
Fig. 1 Concept of the axial radius of curvature (ARC) of the anterior sclera. The ARC of a certain ocular surface point is calculated on the basis ofthe following concept: for an ocular surface point (P) where the distance from the axis line is d (distance of PP’), a line can be drawn that passespoint P and is perpendicular to the line tangential to the ocular surface at point P. Point A is the point where the perpendicular line meets theaxis line. The distance of PA is ARC(d). If point P is temporal to the axis line, it will be designated as tARC(d). If the point is nasal to the axis line, itwill be designated as nARC(d). The axis line is defined as a bright vertical flare line that passes the corneal apex and is parallel to the visual axis
Lee et al. BMC Ophthalmology (2016) 16:176 Page 3 of 11

shape of the outermost layer of the cornea and sclera,and f ’(x) represents the slope of the ocular surface atposition x (Fig. 2). With this method, the ARC can becalculated for every pixel point of the ocular surface as afunction of normal distance from the axis line (d, Fig. 1).Several points on the temporal and nasal sclera (d = 7.0,7.5, 8.0, 8.5, and 9.0 mm) were selected for statisticalanalysis and model fitting. The ARC of a point where dequals 8 mm was used for the correlation analysis (nasal:nARC[8], temporal: tARC[8], and average: aARC[8],Fig. 2) because this point is approximately 1.8 − 2.4 mmfrom the limbus, which is clinically important for fittingscleral lenses and suction rings in LASIK as the centerof the contact area [9, 12, 13].
Statistical analysesPaired t-tests were used for the comparison of nasal andtemporal scleral curvatures. Mann-Whitney U tests andone-way analysis of variance (ANOVA) were used for
the subgroup analysis. The Pearson correlation analysiswas used to reveal the correlation among the ocular bio-metric parameters, including ARC and age. Althoughage is a demographic parameter, it was included in thecorrelation and regression analyses owing to its knowncorrelation with the tangential scleral curvature [5]. Uni-variate and multivariate linear regression analyses wereperformed to develop the model for estimating ARC(forward stepwise method: probability-of-F-to-enter≤0.05 and probability-of-F-to-remove ≥0.10, excludingthe outliers over 2 standard deviations). The followinginput variables were used in the univariate linear regres-sion analysis: age, spherical equivalent, maximum andminimum Sim K, WTW, thinnest corneal thickness,ACD, angle kappa, axial length, and d. The best-fitmodel for tARC, nARC, and aARC were determinedusing multivariate linear regression analysis with the in-put variables identified as significant in the univariatelinear regression analysis (criteria: P <0.05). All the
Fig. 2 Analysis of the axial radius of curvature (ARC) from a composite anterior segment tomographic image. After removing the backgroundnoise, the shape of the outermost layer of the ocular surface was automatically extracted and curve-fitted using the image processing andoptimization toolbox of MATLAB (MathWorks, Natick, MA) (bottom left). The axial curvature was then calculated mathematically as a function ofthe distance from the axis line (d, bottom right). The nARC[8] and tARC[8] were used for the correlation analysis
Lee et al. BMC Ophthalmology (2016) 16:176 Page 4 of 11

analyses were performed using SPSS Version 22.0 forWindows (SPSS Inc., Chicago, IL), and a P value <0.05was considered statistically significant.
ResultsComparison of nasal and temporal scleral curvaturesThe curvature of the nasal sclera was significantly flatterthan that of the temporal sclera, where d equals 7.0, 7.5,8.0, 8.5, and 9.0 mm (P <0.001 for every point, Pairedsamples t-test; Fig. 3). As a center of this area, thenARC[8] (13.68 ± 0.71 mm) was significantly flatter thanthe tARC[8] (11.73 ± 0.61 mm) which was similar to ourprevious report but with reduced variation (nasal: 13.33± 1.12 mm, temporal: 12.32 ± 0.77 mm) [9]. In addition,the differences in nasal and temporal scleral curvaturesgradually increased as the distance from the axis lineincreased.
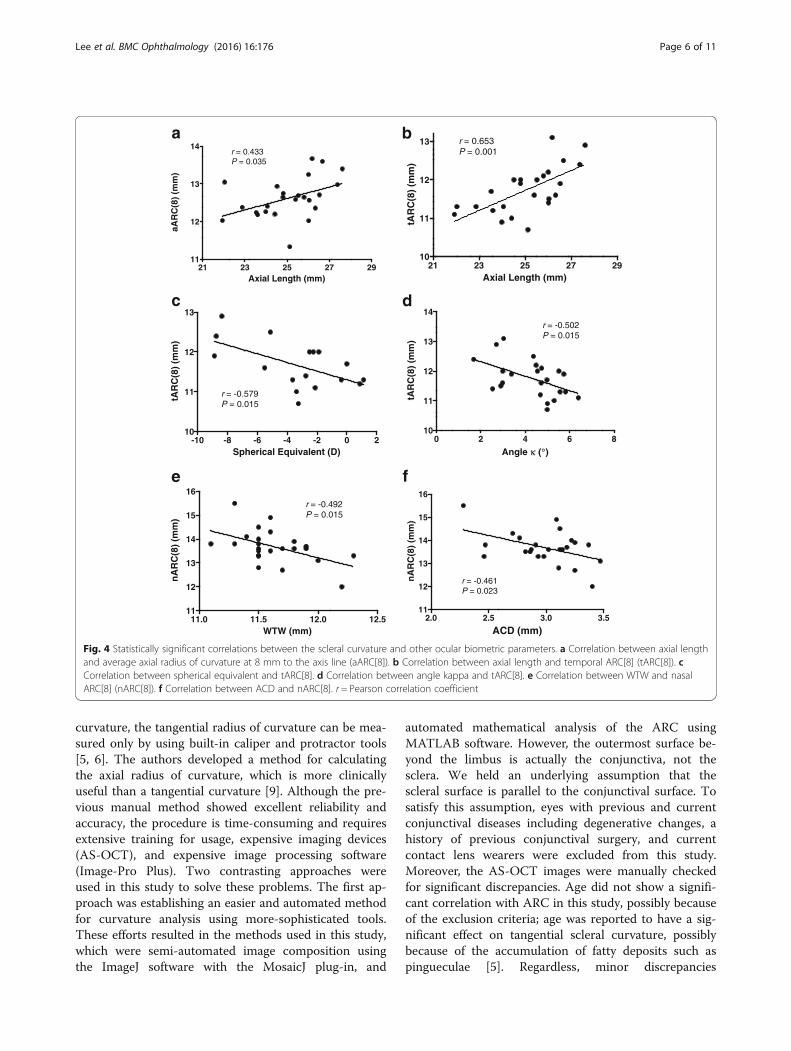
Correlation between scleral curvature and ocularbiometric parameters including ageThe mean value and range of the ages and ocular biometricparameters of the 24 involved eyes are listed in Table 1.Among the parameters, only axial length showed a signifi-cant correlation with aARC[8] (Pearson correlation coeffi-cient r = 0.433, P = 0.035 by Pearson correlation analysis,Fig. 4a). When the nARC[8] and tARC[8] were analyzedseparately, they showed completely different correlationpatterns (Table 2). The tARC[8] showed statistically signifi-cant correlations with axial length (Pearson’s r = 0.653, P =0.001, Fig. 4b), spherical equivalent (Pearson’s r= −0.579, P= 0.015, Fig. 4c), and angle kappa (Pearson’s r = −0.502, P =0.015, Fig. 4d). The nARC[8] showed statistically significantcorrelations with WTW (Pearson’s r = −0.492, P = 0.015,Fig. 4e) and ACD (Pearson’s r = −0.461, P = 0.023, Fig. 4f).
Models for estimating scleral curvatureThe results of the univariate and multivariate linear re-gression analysis for tARC, nARC, and aARC are listedin Table 3. As a result, the following formulae of thebest-fit model were developed for d = 7.0, 7.5, 8.0, 8.5,and 9.0 mm.
tARC dð Þ ¼ −0:846þ 0:225� axial lengthð Þ þ 0:860� d
(Adjusted coefficient of determination (R2a) = 0.718, Stand-ard error of the estimate (Std. Error) = 0.454, P <0.001)
nARC dð Þ ¼ 15:039−0:947� WTWð Þ−0:756� ACDð Þ þ 1:486� d
(R2a = 0.796, Std. Error = 0.568, P <0.001)
aARC dð Þ ¼ 8:507þ 0:124� axial lengthð Þ−0:686� WTWð Þ þ 1:118� d
(R2a = 0.767, Std. Error = 0.466, P <0.001)
Subgroup analysis for wider scleral areas (d = 7.0, 7.5, 8.0,8.5, and 9.0 mm)When the 24 eyes were grouped according to axial length(<24.0, 24.0 − 25.2, 25.2 − 26.1, and ≥26.1 mm; n = 6 foreach group), only the mean scleral curvature in all fivetemporal scleral points showed significant differences(temporal 7.0 mm: P = 0.001; temporal 7.5 mm: P = 0.001;temporal 8.0 mm: P = 0.002; temporal 8.5 mm: P = 0.004;temporal 9.0 mm: P =0.008, one-way ANOVA; Fig. 5). Nosignificant differences were found in any of the five nasalscleral points that were analyzed.The subgroup analysis for the WTW (<11.6 and
≥11.6 mm; n = 12 for each group) and ACD (<2.85, 2.85 −3.05, 3.05 − 3.20, and ≥3.20 mm; n = 6 for each group) didnot show any statistically significant differences in eitherthe nasal or the temporal sclera.
Changes in coefficient of determination (R2) according todistance from the axis lineThe R2 of the correlation between the axial length andaARC gradually increased, and that between the WTW andaARC gradually decreased as the distance from the axis lineincreased, which means that in the peripheral portions ofthe sclera, the scleral curvature correlates more with theaxial length and less with the WTW (Table 4).
DiscussionAS-OCT has been used to measure the anterior seg-ment, anterior chamber, and angle biometry includingcorneal pachymetry, corneal diameter, corneal sagittalheight, corneoscleral junction angle, scleral curvature,angle-to-angle width, iris diameter, ACD, angle openingdistance, angle recess area, trabeculo-iris space area, andanterior chamber angle in degrees [5, 14, 15]. For scleral
7.0* 7.5* 8.0* 8.5* 9.0*9
10
11
12
13
14
15
16
nasalsclera
temporalsclera
Distance from Axis Line (mm)
Axi
al R
adiu
s o
f C
urv
atu
re (
mm
)
Fig. 3 Comparison of the nasal and temporal scleral curvature. Themean nasal axial radius of curvature (nARC) values were significantlyhigher than the corresponding temporal ARC (tARC) values at all the5 points analyzed (d = 7.0, 7.5, 8.0, 8.5, and 9.0 mm). The differencesin nARC and tARC gradually increased as the distance from the axisline (d) increased. * P <0.001, Paired samples t-test
Lee et al. BMC Ophthalmology (2016) 16:176 Page 5 of 11
curvature, the tangential radius of curvature can be mea-sured only by using built-in caliper and protractor tools[5, 6]. The authors developed a method for calculatingthe axial radius of curvature, which is more clinicallyuseful than a tangential curvature [9]. Although the pre-vious manual method showed excellent reliability andaccuracy, the procedure is time-consuming and requiresextensive training for usage, expensive imaging devices(AS-OCT), and expensive image processing software(Image-Pro Plus). Two contrasting approaches wereused in this study to solve these problems. The first ap-proach was establishing an easier and automated methodfor curvature analysis using more-sophisticated tools.These efforts resulted in the methods used in this study,which were semi-automated image composition usingthe ImageJ software with the MosaicJ plug-in, and
automated mathematical analysis of the ARC usingMATLAB software. However, the outermost surface be-yond the limbus is actually the conjunctiva, not thesclera. We held an underlying assumption that thescleral surface is parallel to the conjunctival surface. Tosatisfy this assumption, eyes with previous and currentconjunctival diseases including degenerative changes, ahistory of previous conjunctival surgery, and currentcontact lens wearers were excluded from this study.Moreover, the AS-OCT images were manually checkedfor significant discrepancies. Age did not show a signifi-cant correlation with ARC in this study, possibly becauseof the exclusion criteria; age was reported to have a sig-nificant effect on tangential scleral curvature, possiblybecause of the accumulation of fatty deposits such aspingueculae [5]. Regardless, minor discrepancies
21 23 25 27 2911
12
13
14r = 0.433P = 0.035
Axial Length (mm)
aAR
C(8
) (m
m)
21 23 25 27 2910
11
12
13 r = 0.653P = 0.001
Axial Length (mm)
tAR
C(8
) (m
m)
-10 -8 -6 -4 -2 0 210
11
12
13
r = -0.579P = 0.015
Spherical Equivalent (D)
tAR
C(8
) (m
m)
0 2 4 6 810
11
12
13
14
r = -0.502P = 0.015
Angle κ (°)
tAR
C(8
) (m
m)
11.0 11.5 12.0 12.511
12
13
14
15
16r = -0.492P = 0.015
WTW (mm)
nA
RC
(8)
(mm
)
2.0 2.5 3.0 3.511
12
13
14
15
16
r = -0.461P = 0.023
ACD (mm)
nA
RC
(8)
(mm
)
a b
c d
e f
Fig. 4 Statistically significant correlations between the scleral curvature and other ocular biometric parameters. a Correlation between axial lengthand average axial radius of curvature at 8 mm to the axis line (aARC[8]). b Correlation between axial length and temporal ARC[8] (tARC[8]). cCorrelation between spherical equivalent and tARC[8]. d Correlation between angle kappa and tARC[8]. e Correlation between WTW and nasalARC[8] (nARC[8]). f Correlation between ACD and nARC[8]. r = Pearson correlation coefficient
Lee et al. BMC Ophthalmology (2016) 16:176 Page 6 of 11

between the conjunctival and scleral curvature can existand could possibly limit this method. Another limitationis that only horizontal ARC could be determined withthis method. We attempted this process with vertical im-ages but failed because of difficulties in acquiring wideimages due to the tightness of the eyelid in our Asianvolunteers. However, on the basis of the results of previ-ous studies on tangential curvature, we can assume thatthe superior and inferior curvatures lie within the tem-poral and nasal curvatures [5, 6].The second approach entailed developing formulae to
estimate the scleral curvature using more easily availableocular biometric parameters. As a result, the formulae toestimate the scleral curvature were developed as a func-tion of axial length, ACD, WTW, and distance from theaxis line with good determinant power (72 − 80 %). The
formulae were developed for the wider area of the sclera(7.0, 7.5, 8.0, 8.5, and 9.0 mm from the axis line) to becompatible with various diameter scleral lenses and toassist the design of the multi-curve haptic of the sclerallenses. As a limitation, the formulae themselves cannotbe directly applied to the eyes of non-Asian groups be-cause ocular biometric parameters vary widely accordingto ethnic groups [16]. However, the relationship betweenthese parameters may not actually change much accord-ing to the ethnic groups. For example, a scleral lens witha flatter haptic (scleral part) design can be tried as aninitial trial lens for an eye with longer axial length orsmaller WTW. With this ocular-parameter-based ap-proach for the selection of an initial trial lens, patientscan benefit by the decreased discomfort and anxietycaused by a poorly fitted initial trial lens and the
Table 2 Correlation between scleral curvature and other ocular biometric parameters including age
Parameters tARC[8] nARC[8] aARC[8]
Pearson’s r P-value (two-tailed) Pearson’s r P-value (two-tailed) Pearson’s r P-value (two-tailed)
Age −0.197 0.356 −0.141 0.511 −0.199 0.351
Sim Kmax −0.216 0.406 −0.055 0.833 −0.163 0.532
Sim Kmin −0.380 0.133 −0.154 0.554 −0.327 0.201
SE −0.579 0.015* −0.52 0.843 −0.396 0.116
WTW −0.166 0.438 −0.492 0.015* −0.360 0.084
Thinnest corneal thickness −0.292 0.256 −0.126 0.631 −0.258 0.317
ACD −0.116 0.590 −0.461 0.023* −0.310 0.140
Angle Kappa −0.502 0.015* 0.058 0.792 −0.301 0.163
Axial length 0.653 0.001** −0.018 0.934 0.433 0.035*
tARC[8] axial radius of curvature at 8 mm temporal to the axis line, nARC[8] axial radius of curvature at 8 mm nasal to the axis line, aARC[8] average values oftARC[8] and nARC[8], Sim Kmax maximum simulated keratometric value, Sim Kmin minimum simulated keratometric value, SE spherical equivalent, WTW white-to-white corneal diameter, ACD anterior chamber depth from endothelium*P <0.05, **P <0.01, Pearson’s correlation analysis
Table 3 Univariate and Multivariate Analysis of ARC
Curvature Inputvariables
Unit Univariate analysis Multivariate analysis
Beta coefficient Std. error P-value Beta coefficient Std. error P-value
tARC d Per mm increase 0.846 0.079 <0.001 0.860 0.072 <0.001
Axial length Per mm increase 0.258 0.046 <0.001 0.225 0.029 <0.001
SE Per D increase −0.109 0.028 <0.001
Angle kappa Per ° increase −0.250 0.061 <0.001
Sim Kmin Per D increase −0.168 0.066 0.013
nARC d Per mm increase 1.486 0.089 <0.001 1.486 0.073 <0.001
WTW Per mm increase −1.186 0.405 0.004 −0.947 0.197 <0.001
ACD Per mm increase −1.015 0.378 0.008 −0.756 0.183 <0.001
aARC d Per mm increase 1.123 0.069 <0.001 1.118 0.071 <0.001
Axial length Per mm increase 0.153 0.057 0.008 0.124 0.030 <0.001
WTW Per mm increase −0.666 0.313 0.036 −0.686 0.167 <0.001
SE Per D increase −0.069 0.034 0.044
ARC axial radius of curvature, Std. Error standard error of the estimate, d distance from the axis line, SE spherical equivalent, Sim Kmin minimum simulatedkeratometric value, WTW white-to-white corneal diameter, ACD anterior chamber depth from endothelium
Lee et al. BMC Ophthalmology (2016) 16:176 Page 7 of 11

clinician can benefit by decreased chair time for fitting.However, these formulae could be validated more firmlyby comparing the predicted ARC values with the ana-lyzed values in an independent cohort.In this study, axial length, ACD, and WTW were found
to be useful parameters for estimating scleral curvature. Inthe univariate linear regression analysis, the temporalscleral curvature showed significant correlations with axiallength, spherical equivalent, angle kappa, and minimumSim K. However, only axial length remained as a signifi-cant parameter for the model-fitting in the multivariateregression analysis owing to the collinearity caused by thestrong correlation between axial length and sphericalequivalent (Pearson’s r = −0.828, P <0.001), angle kappa(Pearson’s r = −0.813, P <0.001, Fig. 6), and minimum SimK (Pearson’s r = −0.635, P = 0.006). By contrast, the nasal
scleral curvature showed significant correlations withWTW and ACD in the univariate and multivariate linearregression analyses (Table 3). To summarize, temporalscleral curvature correlated with axial length, and nasalscleral curvature correlated with ACD and WTWindependently.Increased axial length can affect the scleral curvature by
leading to an accompanying increase in the width (coronaldimension) of the eyeball [17]. We expected ACD to correl-ate well with scleral curvature because ACD is partially de-termined according to corneal curvature, particularly theperipheral corneal curvature that is just adjacent to thescleral curvature [18]. However, the predictive power itselfwas relatively low. ACD did not show any significant correl-ation with maximum Sim K (Pearson’s r= 0.255, P = 0.323),minimum Sim K (Pearson’s r= 0.244, P = 0.344), WTW(Pearson’s r = 0.294, P = 0.163), or axial length (Pearson’s r= 0.215, P = 0.314), contrary to several previous reports[19–21]. However, similar results were reported in a largepopulation-based cross-sectional study, which alludes tothe complexity of ACD determination [15]. The scleralcurvature is flatter than the corneal curvature and becomesmore flat with the increase in the distance from the axisline (Figs. 2 and 3). Hence, the curvature of the sclera canbe affected by the WTW because the distance from thelimbus (transition zone) varies according to the WTW. Thenasal sclera showed correlation only with the WTW, whichmay be caused by the larger change in curvature in thenasal limbus compared with the temporal limbus (Fig. 2,bottom left) [5, 6, 9]. However, the correlation disappearsrapidly with increasing distance from the axis line (Table 4).Ocular parameters affect scleral curvature in different pat-terns according to the distance from the axial line as shownin Table 4. A significant correlation was observed betweenWTW and aARC only at the point where d is 7.0 mm
Fig. 6 Correlation between axial length and angle kappa. Angle kappashowed a strong correlation with axial length (Pearson’s r = −0.813 andP <0.001), stronger than the spherical equivalent correlation (Pearson’sr = 0.685 and P = 0.003)
Nasal
9.0
Nasal
8.5
Nasal
8.0
Nasal
7.5
Nasal
7.010
11
12
13
14
15
16
Temp 7.
0*
Temp 7.
5*
Temp 8.
0*
Temp 8.
5*
Temp 9.
0*
AXL ≥ 26.1
25.2 ≤ AXL < 26.1
24.0 ≤ AXL < 25.2
AXL < 24.0
Distance from Axis Line (mm)
Axi
al R
adiu
s o
f C
urv
atu
re (
mm
)
Fig. 5 The effect of axial length on axial radius of curvature (ARC) indifferent points of the sclera. When the 24 eyes were grouped accordingto axial length (<24.0, 24.0− 25.2, 25.2− 26.1, and ≥26.1 mm; n= 6 foreach group), only the mean ARC in each of the five temporal scleralpoints showed significant differences (temporal 7.0 mm: P= 0.001;temporal 7.5 mm: P= 0.001; temporal 8.0 mm: P= 0.002; temporal8.5 mm: P= 0.004; temporal 9.0 mm: P =0.008). No significant differenceswere found among the five nasal scleral points. AXL axial length; Temptemporal. *P <0.05, One-way analysis of variance test
Table 4 Coefficient of determination (R2) along the distancefrom the axis line
Distancefrom theaxis line
Axial length vs aARC WTW vs aARC
R2 P-value R2 P-value
7.0 mm 0.165 0.049* 0.175 0.042*
7.5 mm 0.176 0.041* 0.156 0.056
8.0 mm 0.187 0.035* 0.130 0.084
8.5 mm 0.203 0.027* 0.102 0.129
9.0 mm 0.230 0.017* 0.069 0.217
aARC average axial radius of curvature*P < 0.05, Pearson’s correlation analysis
Lee et al. BMC Ophthalmology (2016) 16:176 Page 8 of 11

(Table 4). This could possibly explain the reason whyWTW was added to the formula of aARC(d), even thoughno significant correlation was found between WTW andaARC[8]. The WTW did not show any significant correl-ation with axial length (Pearson’s r = −0.054, P = 0.802) andACD (Pearson’s r = 0.294, P = 0.163).Two interesting findings were observed with regard to
angle kappa in this study. The first finding was the strongrelationship between angle kappa and axial length (Pear-son’s r = −0.813, P <0.001; Fig. 6). Angle kappa is defined asthe angle between the pupillary axis (the line perpendicularto the cornea that passes through the center of the en-trance pupil) and the visual axis (line connecting the fix-ation point with the fovea), although it can be also referredto as angle lambda [22, 23]. Angle kappa has clinical sig-nificance in measuring the angle of strabismus and thecentration issues during refractive surgeries [23–25]. Inaddition, angle kappa has recently drawn attention for itspotential influence on the effect of complex optical devicessuch as multifocal intraocular lenses and on postoperativevisual satisfaction [26, 27]. Several clinical reports haveshown that hyperopic or emmetropic eyes have a tendencyto have a larger angle kappa than myopic eyes owing to theclinical experiences of the refractive surgeries [23–25, 28].
However, there are conflicting results regarding the valueof angle kappa between emmetropic and hyperopic eyes[23, 24]. In our study, the angle kappa showed strongercorrelation with axial length (Pearson’s r = −0.813, P<0.001) than with spherical equivalent (Pearson’s r = 0.685,P = 0.003). This study suggests that axial length is a moreappropriate predictor of angle kappa than spherical equiva-lent, which has been studied so far. However, a larger-scalestudy is necessary to confirm this suggestion.The second interesting finding was that the different cor-
relation patterns of nasal and temporal scleral curvatureswith axial length can be mediated by angle kappa. The nasalscleral curvature is flatter (with a larger ARC) than the tem-poral sclera, which can be partially explained by the sharpcorneoscleral junction angle in the nasal meridian [5, 6].However, this could not fully explain why the axial lengthshows completely different correlation patterns with thenasal and temporal sclera.A likely explanation may be provided by considering the
relationship between angle kappa and axial length. Thecomposite images of the anterior surface in this study showthat angle kappa is the angle between the visual axis andtotal anterior segment, including the cornea, iris, lens, andsclera, as shown in Fig. 7. The angle kappa is actually a
Fig. 7 Ocular surface alignment (angle kappa) and scleral curvature changes along with axial length. a The composite anterior segmenttomographic image of an eye with shorter axial length (21.93 mm) and larger angle kappa (6.39°); the extracted ocular surface outline from thisimage is the red line in d. b The composite image of an eye with medium axial length (25.40 mm) and medium angle kappa (4.72°); theextracted ocular surface outline is the green line in d. c The composite image of an eye with longer axial length (27.38 mm) and smaller anglekappa (1.68°); the extracted ocular surface outline is the blue line in d. d The overlap of the lines extracted from the outermost layer of the ocularsurface using the MATLAB software. The red line represents the eyes with shorter axial length (Fig. 7a), the green line represents medium axiallength (Fig. 7b), and the blue line represents longer axial length (Fig. 7c). The nasal scleral curvature flattens considerably less than the temporalside owing to the flattening of the scleral curvature with longer axial length, counteracted by the steepening effect of the accompanyingdecreased angle kappa
Lee et al. BMC Ophthalmology (2016) 16:176 Page 9 of 11
misalignment between the functional axis of the eye, whichis represented by the “visual axis,” and the anatomical axisof the anterior eye, which is represented by the “pupillaryaxis” [22]. If the anterior surface shows no deviation, boththe nasal and temporal sclera should be flattened (increas-ing both nARC and tARC) together with the increased axiallength. However, the positive angle kappa induces flattercurvature in the nasal sclera (higher nARC) and steepercurvature in the temporal sclera (lower tARC). In the nasalsclera, the direct flattening effect (thereby increasing nARC)induced by the longer axial length is compensated by theindirect steepening effect (thereby decreasing nARC) by theaccompanying decreased angle kappa. Meanwhile, in thetemporal sclera, the direct flattening effect by the longeraxial length is enhanced by the indirect flattening effect bythe decreased angle kappa. This synergy resulted in a stron-ger correlation between the temporal scleral curvature andthe axial length. The axial length showed relatively constantsignificant correlations with curvature in the wider-rangetemporal sclera (d = 7.0, 7.5, 8.0, 8.5, and 9.0 mm), but notin the wider-range nasal sclera (Fig. 5).Another possible hypothesis for this difference is the
asymmetric growth of sclera during the myopic eye growth.If the temporal sclera is assumed to expand more than theother quadrants, the close correlation of axial length withthe temporal scleral curvature and angle kappa can be ex-plained simultaneously. This hypothesis can be supportedby the tangential curvature differences between the tem-poral sclera and the other quadrants [5, 6]. However, thescope of this study is limited to the anterior sclera, and awell-designed follow-up study is required to prove this hy-pothesis, including the analyses of the shape of the poster-ior sclera and longitudinal observation.
ConclusionsThe authors developed an automated method of calculatingthe axial curvature of the anterior sclera, and formulae toestimate the scleral curvature by incorporating axial length,ACD, WTW, and the distance from the axis line, with gooddeterminant power (72 − 80 %). In addition, angle kappathat represents ocular surface alignment was rediscoveredin this study for its strong correlation with axial length, andfor its notable role in the discrepancy between the nasaland the temporal sclera. We hope these results can deepenour knowledge on the anatomical and functional misalign-ments of the anterior eye and provide practical informationfor designing and fitting of scleral lens haptics.
Additional file
Additional file 1: Figure S1. The process of making a compositeimage covers a wide area of the anterior ocular surface from threehorizontal tomographic images. After rotating the nasal and temporalhorizontal images using the image rotate function of ImageJ, the
composite image is created semi-automatically using the MosaicJ pluginof ImageJ. (TIF 1672 kb)
AbbreviationsACD: Anterior chamber depth (from endothelium); ARC: Axial radius ofcurvature; tARC: Temporal ARC; tARC[8]: ARC at 8 mm temporal to the axisline; nARC: Nasal ARC; nARC[8]: ARC at 8 mm nasal to the axis line;aARC: Average ARC; aARC[8]: Average values of tARC[8] and nARC[8]; AS-OCT: Anterior segment optical coherence tomography; d: Distance from theaxis line; SE: Spherical equivalent; Sim Kmax: Maximum simulatedkeratometric value; Sim Kmin: Minimum simulated keratometric value; Std.Error: Standard error of the estimate; WTW: White-to-white corneal diameter
AcknowledgementsPart of this study was presented at the annual congress of the EuropeanSociety of Cataract and Refractive Surgeons, Barcelona, Spain, September2015.
FundingThis study was supported by a grant of the Korean Health Technology R&DProject, Ministry of Health & Welfare, Republic of Korea (Project No. A084496& A120018).
Availability of data and materialsThe data will not be made available in order to protect the participant’sidentity.
Authors’ contributionsSL, HJC and WRW were responsible for the conception and design of thisstudy. HJC and MKK acquired the data. HC developed MATLAB software forthe analysis. SL, HJC and HC analyzed and interpreted the data. SL and HJCdrafted the manuscript. HJC, MKK and WRW revised the manuscript criticallyfor important intellectual content. All authors have read and approved thefinal manuscript and agree to be accountable for all aspects of the work inensuring that questions related to the accuracy or integrity of any part ofthe work are appropriately investigated and resolved.
Competing interestsThe authors declare that they have no competing interests.
Consent for publicationNot applicable.
Ethics approval and consent to participateThe study protocol was approved by the Institutional Review Board of SeoulNational University Hospital (B-1008-107-328) and informed consent wasobtained from all participants before enrollment.
Author details1Department of Ophthalmology, Hallym University Sacred Heart Hospital,Hallym University College of Medicine, Anyang, Republic of Korea.2Laboratory of Corneal Regenerative Medicine and Ocular Immunology,Seoul Artificial Eye Center, Seoul National University Hospital BiomedicalResearch Institute, Seoul, Republic of Korea. 3Department of Ophthalmology,Seoul National University College of Medicine, 101 Daehang-ro, Jongno-gu,Seoul 110-744, Republic of Korea. 4Institute for Medical Engineering andScience (IMES), Massachusetts Institute of Technology, Cambridge, MA, USA.
Received: 22 December 2015 Accepted: 29 September 2016
References1. Watson PG, Young RD. Scleral structure, organisation and disease. A review.
Exp Eye Res. 2004;78(3):609–23.2. McBrien NA, Gentle A. Role of the sclera in the development and pathological
complications of myopia. Prog Retin Eye Res. 2003;22(3):307–38.3. Sorbara L, Maram J, Fonn D, Woods C, Simpson T. Metrics of the normal
cornea: anterior segment imaging with the Visante OCT. Clin Exp Optom.2010;93(3):150–6.
Lee et al. BMC Ophthalmology (2016) 16:176 Page 10 of 11

4. Ebneter A, Haner NU, Zinkernagel MS. Metrics of the normal anterior sclera:imaging with optical coherence tomography. Graefes Arch Clin ExpOphthalmol. 2015;253(9):1575–80.
5. Hall LA, Hunt C, Young G, Wolffsohn J. Factors affecting corneoscleraltopography. Invest Ophthalmol Vis Sci. 2013;54(5):3691–701.
6. Hall LA, Young G, Wolffsohn JS, Riley C. The influence of corneoscleraltopography on soft contact lens fit. Invest Ophthalmol Vis Sci. 2011;52(9):6801–6.
7. Smith GT, Mireskandari K, Pullum KW. Corneal swelling with overnight wearof scleral contact lenses. Cornea. 2004;23(1):29–34.
8. Luo ZK, Jacobs DS. Current and potential applications of anterior segmentoptical coherence tomography in contact lens fitting. Semin Ophthalmol.2012;27(5–6):133–7.
9. Choi HJ, Lee SM, Lee JY, Lee SY, Kim MK, Wee WR. Measurement of anteriorscleral curvature using anterior segment OCT. Optom Vis Sci. 2014;91(7):793–802.
10. Gemoules G. A novel method of fitting scleral lenses using high resolutionoptical coherence tomography. Eye Contact Lens. 2008;34(2):80–3.
11. Thevenaz P, Unser M. User-friendly semiautomated assembly of accurateimage mosaics in microscopy. Microsc Res Tech. 2007;70(2):135–46.
12. Arevalo JF, Ramirez E, Suarez E, Cortez R, Antzoulatos G, Morales-Stopello J,et al. Rhegmatogenous retinal detachment in myopic eyes after laser in situkeratomileusis. Frequency, characteristics, and mechanism. J Cataract RefractSurg. 2001;27(5):674–80.
13. Lavaque AJ, Di Marco S, Yilmaz T, Liggett PE. Scleral curvature and LASIK.Ophthalmology. 2006;113(1):157.
14. Ramos JL, Li Y, Huang D. Clinical and research applications of anteriorsegment optical coherence tomography - a review. Clin ExperimentOphthalmol. 2009;37(1):81–9.
15. Sng CC, Foo LL, Cheng CY, Allen Jr JC, He M, Krishnaswamy G, et al.Determinants of anterior chamber depth: the Singapore Chinese Eye Study.Ophthalmology. 2012;119(6):1143–50.
16. Leung CK, Palmiero PM, Weinreb RN, Li H, Sbeity Z, Dorairaj S, et al.Comparisons of anterior segment biometry between Chinese andCaucasians using anterior segment optical coherence tomography. Br JOphthalmol. 2010;94(9):1184–9. doi:10.1136/bjo.2009.167296.
17. Song HT, Kim YJ, Lee SJ, Moon YS. Relations between age, weight, refractiveerror and eye shape by computerized tomography in children. Korean JOphthalmol. 2007;21(3):163–8.
18. Olsen T. Calculation of intraocular lens power: a review. Acta OphthalmolScand. 2007;85(5):472–85.
19. Nemeth G, Hassan Z, Szalai E, Berta A, Modis Jr L. Comparative analysis ofwhite-to-white and angle-to-angle distance measurements with partialcoherence interferometry and optical coherence tomography. J CataractRefract Surg. 2010;36(11):1862–6.
20. Fotedar R, Wang JJ, Burlutsky G, Morgan IG, Rose K, Wong TY, Mitchell P.Distribution of axial length and ocular biometry measured using partialcoherence laser interferometry (IOL Master) in an older white population.Ophthalmology. 2010;117(3):417–23.
21. Park SH, Park KH, Kim JM, Choi CY. Relation between axial length and ocularparameters. Ophthalmologica. 2010;224(3):188–93.
22. Tabernero J, Benito A, Nourrit V, Artal P. Instrument for measuring themisalignments of ocular surfaces. Opt Express. 2006;14(22):10945–56.
23. Hashemi H, KhabazKhoob M, Yazdani K, Mehravaran S, Jafarzadehpur E,Fotouhi A. Distribution of angle kappa measurements with Orbscan II in apopulation-based survey. J Refract Surg. 2010;26(12):966–71.
24. Basmak H, Sahin A, Yildirim N, Papakostas TD, Kanellopoulos AJ.Measurement of angle kappa with synoptophore and Orbscan II in anormal population. J Refract Surg. 2007;23(5):456–60.
25. Moshirfar M, Hoggan RN, Muthappan V. Angle Kappa and its importance inrefractive surgery. Oman J Ophthalmol. 2013;6(3):151–8.
26. Prakash G, Prakash DR, Agarwal A, Kumar DA, Agarwal A, Jacob S. Predictivefactor and kappa angle analysis for visual satisfactions in patients withmultifocal IOL implantation. Eye (Lond). 2011;25(9):1187–93.
27. Karhanova M, Pluhacek F, Mlcak P, Vlacil O, Sin M, Maresova K. Theimportance of angle kappa evaluation for implantation of diffractivemultifocal intra-ocular lenses using pseudophakic eye model. ActaOphthalmol. 2015;93(2):e123–8.
28. Choi SR, Kim US. The correlation between angle kappa and ocular biometryin Koreans. Korean J Ophthalmol. 2013;27(6):421–4.
• We accept pre-submission inquiries
• Our selector tool helps you to find the most relevant journal
• We provide round the clock customer support
• Convenient online submission
• Thorough peer review
• Inclusion in PubMed and all major indexing services
• Maximum visibility for your research
Submit your manuscript atwww.biomedcentral.com/submit
Submit your next manuscript to BioMed Central and we will help you at every step:
Lee et al. BMC Ophthalmology (2016) 16:176 Page 11 of 11