Estimating Uninsured Vehicle & Unregistered Vehicle Rates ......Estimating Uninsured Vehicle &...
85
Estimating Uninsured Vehicle & Unregistered Vehicle Rates: Sensitivity to Data and Assumptions Lyn Hunstad California Department of Insurance July 1999 ABSTRACT This paper contains a detailed review of a model that is believed to be one of the most accurate methods for estimating the uninsured vehicle (UV) rate: comparing the number of insured vehicles to the total number of vehicles. The difficulty in obtaining accurate data is discussed. A detailed model is presented that shows the assumptions and different inputs that are necessary to produce an estimated UV rate. An analysis of the sensitivity of the UV rate to the model inputs found that the estimate for the percent of unregistered vehicles and the percent of vehicles used for business purposes had the most effect on the variability of the estimated UV rate. Five different methods were used to estimate the unregistered vehicle rate. The UV rate for 1996 in California was estimated to be 28.1%. The 95% confidence interval was estimated to range from 25.5% to 30.9%. THIS REPORT IS SOMEWHAT TECHNICAL IN NATURE AND ASSUMES SOME STATISTICAL BACKGROUND. COMMENTS AND INTERPRETATIONS IN THIS REPORT ARE THOSE OF THE AUTHOR AND DO NOT REPRESENT OFFICIAL POLICY OF THE COMMISSIONER OR THE DEPARTMENT.
Transcript of Estimating Uninsured Vehicle & Unregistered Vehicle Rates ......Estimating Uninsured Vehicle &...

Estimating Uninsured Vehicle & Unregistered Vehicle Rates:
Sensitivity to Data and Assumptions
Lyn Hunstad
California Department of Insurance
July 1999
ABSTRACT
This paper contains a detailed review of a model that is believed to be one of the most accurate methods for estimating the uninsured vehicle (UV) rate: comparing the number of insured vehicles to the total number of vehicles. The difficulty in obtaining accurate data is discussed. A detailed model is presented that shows the assumptions and different inputs that are necessary to produce an estimated UV rate. An analysis of the sensitivity of the UV rate to the model inputs found that the estimate for the percent of unregistered vehicles and the percent of vehicles used for business purposes had the most effect on the variability of the estimated UV rate. Five different methods were used to estimate the unregistered vehicle rate. The UV rate for 1996 in California was estimated to be 28.1%. The 95% confidence interval was estimated to range from 25.5% to 30.9%.
THIS REPORT IS SOMEWHAT TECHNICAL IN NATURE AND ASSUMES SOME STATISTICAL BACKGROUND. COMMENTS AND INTERPRETATIONS IN THIS REPORT ARE THOSE OF THE AUTHOR AND DO NOT REPRESENT OFFICIAL POLICY OF THE COMMISSIONER OR THE DEPARTMENT.

ACKNOWLEDGMENTS
Many people contributed information, ideas, and constructive criticisms to this paper. I would
like to thank and acknowledge the contributions of: Jerry Turem, Robert Bernstein, Luciano
Gobbo, and Maria Teruya with the California Department of Insurance; Len Marowitz, Jim
Mendendall, Chris Terwilliger, Judith Fischer, Steven Crimit, Steven Westerman, Richard Right,
Gurbaguah Singh, and Karman Rio with the California Department of Motor Vehicles; Gary
Occhiuzzo and Robert Cenzar with the California Energy Commission; Bev Christ with the
California Highway Patrol; Luk Lee and Denis Azevedo with the California Department of
Transportation; Daniel Khazzoom with the San Jose State University; Grace Hazzard, Marge
Saccoccio, and Barry Isman with the U. S. Department of Transportation, National Highway
Traffic Safety Administration.
Any errors or inaccuracies are the responsibility of the author. As can be seen in this paper, there
are many ways to improve the methods and data used to estimate the rate of uninsured vehicles.
Any suggestions for improvement or criticism of the material presented would be most
appreciated.
Lyn Hunstad
July 7, 1999
e-mail: [email protected]
i

Table of Contents
ACKNOWLEDGMENTS............................................................................................................ i
EXECUTIVE SUMMARY.........................................................................................................1
INTRODUCTION ......................................................................................................................4
TOTAL NUMBER OF VEHICLES.......................................................................................... 10 Differences Between the Reports ................................................................................... 12 Trends in Vehicle Counts............................................................................................... 15 Other Factors to Consider ............................................................................................. 18 Unregistered Vehicles Estimates.................................................................................... 20
CEC Estimates:.................................................................................................. 20 Early DMV Estimates: ....................................................................................... 26 Estimates Based on CHP Violations:.................................................................. 27 DMV Drivers License Records: ......................................................................... 33 Estimates Based on Survey Research: ................................................................ 39 Fatal Accident Reporting System: ...................................................................... 40 Summary of Unregistered Estimates:.................................................................. 47
Business vs. Personal Use of Vehicles ........................................................................... 49
VEHICLES WITH INSURANCE............................................................................................. 53 Other Issues .................................................................................................................. 56
MODEL SPECIFICATIONS .................................................................................................... 58 Initial Results ................................................................................................................ 59 Probability Distribution of UV Rate .............................................................................. 66
CONCLUSIONS ...................................................................................................................... 68
REFERENCES ......................................................................................................................... 70
ATTACHMENT A: CHP Citation Data ................................................................................... 73
List of Tables
Table 1: Vehicle Counts From Different Sources ...................................................................... 14
Table 2: Summary of Tracing Vehicles with Expired Registrations: 8/96 to 10/97..................... 21
Table 3: Summary of Tracing Vehicles with Expired Registrations: 10/97 to 4/98..................... 24
Table 4: CHP Citations for Unregistered Vehicle...................................................................... 28
ii

Table 5: Drivers Cited for Unregistered Vehicle ....................................................................... 36
Table 6: Characteristics of Unregistered Vehicle Drivers .......................................................... 38
Table 7: Not At Fault Vehicles in Fatal Accidents..................................................................... 44
Table 8: Weighted Average of Estimated Percent Unregistered Vehicles................................... 49
Table 9: Estimated Under Reporting Level .............................................................................. 57
Table 10: Number of Years of Insurance Coverage................................................................... 57
Table 11: Initial Model Inputs and UV Rates............................................................................ 61
Table 12: Estimated Confidence Intervals for the Input Parameters........................................... 62
Table 13: Sensitivity of UV Rate to Individual Parameters........................................................ 63
Table 14: Model Parameter Sensitivity Estimates I ................................................................... 65
Table 15: Model Parameter Sensitivity Estimates II .................................................................. 68
Table A-1: CHP Citation Data:................................................................................................. 76
Table A-2: CHP Citation Data: Percentages ............................................................................ 77
Table A-3: Number of CHP Traffic Officers in the Field by Year .............................................. 78
List of Figures
Figure 1: Estimated UV Rate Model...........................................................................................9
Figure 2: Number of Autos and Commercially Registered Vehicles........................................... 15
Figure 3: Number of Registered Motorcycles ........................................................................... 17
Figure 4: Variations in Vehicle Counts under Steady or Increasing States ................................. 20
Figure 5: Time of Accident: Fatal vs. Injury............................................................................. 46
Figure 6: Estimates of Unregistered Vehicles............................................................................ 48
Figure 7: Results of Monte Carlo Simulation ............................................................................ 67
Figure A-1: CHP: Number of Citations vs. Number of Officers................................................ 79
Figure A-2: CHP Citations for Unregistered Vehicle as a Percent of Total Citations and Number of Officers in the Field ..................................................................................... 80
iii

EXECUTIVE SUMMARY
In order to intelligently select and develop a policy response to the uninsured vehicle (UV)
problem, it is necessary to accurately assess the magnitude of the problem. However, the illegal
nature of operating a vehicle without insurance makes obtaining a direct, accurate measure of the
UV rate almost impossible. The most promising approach to accurately estimating the UV rate
involves estimating the total number of vehicles on-the-road and the total number of vehicles with
insurance. While this approach is straight forward, obtaining and processing the required data is
not.
Insurance is generally linked to a specific vehicle. An individual can fluctuate between being
insured and being uninsured depending on the vehicle he or she is operating. Because of this, the
UV rate as it is used in this paper refers to the rate of uninsured vehicles, not the rate of uninsured
individuals or uninsured motorists. To emphasize the fact that we are dealing with vehicles, not
individuals, throughout this paper we have used the abbreviation UV rather than the more
commonly used UM abbreviation. The definition of the UV rate is further restricted to only apply
to vehicles that are not used for business1.
In determining the total number of vehicles, the first problem that one encounters is picking the
correct report from the Department of Motor Vehicles (DMV). A difference of up to 1.5 million
vehicles can occur between the different reports. The “official” report released by DMV and cited
by most other reports as the number of vehicles, counts registrations, not vehicles. Using this
report results in an inflated estimate for the number of registered vehicles. Fortunately, a more
accurate (though not perfect) report is available to estimate the number of registered vehicles. In
1996, the total number of vehicles registered in California as auto or commercial on 7-1-96 was
estimated to be 21.6 million.
1This is due to insurer's practice of dividing insurance into personal and commercial lines. Insurance data on vehicles covered by commercial policies is very limited and of poor quality.
1

The next issue encountered in estimating the total number of vehicles, is estimating the number of
vehicles that lack a current registration but are still being operated. Estimating the number of
unregistered vehicles is a problem that is just about as difficult as estimating the UV rate. One
approach to estimating the unregistered rate involves analyzing violation data from law
enforcement agencies. Another approach examines the number of vehicles with recently expired
registrations. Still another approach analyzes the not at fault vehicles involved in fatal accidents.
There are problems with each of these and the other approaches used in this paper, but each
perspective adds a unique insight. Combining the findings from five different approaches, it was
estimated that the total number of registered vehicles should be increased by about 8½% in 1996
to reflect unregistered but currently operated vehicles.
In order to make the estimated total vehicle count comparable with the insurance data (that only
reflects personal use vehicles that are not motorcycles) it is necessary to remove the motorcycles
from the count and adjust the remaining balance. The need for this adjustment is created by
California's requirement that virtually all small trucks be registered as commercial vehicles,
regardless of their actual use. About 6% of all commercially registered vehicles are not trucks
and these vehicles are assumed to be used for business. There are two approaches for the
estimated business use of trucks. The first is a survey conducted by the U.S. Census Bureau.
This survey estimated the percent to be 32%. The second approach is an analysis of the owner's
name and the number of vehicles owned. This approach was used by the California Energy
Commission (CEC). Their analysis estimated the percent to be 33%. The CEC analysis is the
only source of data for the estimated business use of vehicles registered as autos. The estimated
business use of autos was 7%.
Compared to the data on the total vehicle count, the data on the count of insured vehicles needs
little adjusting. The only adjustment to the data on the number of insured vehicles is an
adjustment for the estimated amount of under reporting. In 1996, the unadjusted insurance
2

vehicle count was 14.6 million vehicles. Using data collected as part of a separate system by the
National Association of Insurance Commissioners, it was possible to estimate that the number of
insured vehicles needs to be increased by about ½% in 1996 to adjust for under reporting.
Once the total vehicle count and the number of insured vehicles count have been adjusted to be as
accurate as possible, an estimated UV rate can be calculated. In 1996, the estimated UV rate was
28%. This was down one percentage point from the estimated UV rate in 1995.
In order to estimate the effects of the different adjustments on the final estimated UV rate two
approaches were explored. The first approach analyzed each adjustment factor separately. Using
a minimum and maximum value for the adjustment, two different estimated UV rates were
calculated. The second approach analyzed all the adjustment factors simultaneously. This
approach used a technique called Monte Carlo simulation to randomly vary the adjustment
factors. The results of these simulations indicated that 95% of the time the estimated 1996 UV
rate was between 26% and 31%.
Two approaches were used to evaluate the sensitivity of the estimated UV rate to the different
factors. Both approaches ranked the estimates for unregistered vehicles and the percent of
vehicles used for business purposes to be the most influential. Both of these factors are difficult
to accurately measure. It is hoped that future research will help to increase the overall precision
of these factors and the resulting estimated UV rate.
Given the variety of reasonable values that could be used for the several factors that are necessary
to prepare an estimate of the UV rate, it is not surprising that estimates of the UV rate, prepared
by different analysts, should result in different values. Analysts developing estimates of the UV
rate need to clearly document the data and assumptions they used. Users of these estimates need
to be aware of the impact that the data and assumptions have on the resulting estimated UV rate.
3

INTRODUCTION
The general public does not have a very favorable attitude toward uninsured drivers. In order to
promote personal responsibility and crack down on uninsured drivers, there is broad support for a
variety of measures to penalize uninsured drivers and limit their ability to collect damages.
(Insurance Research Council, 1996 and Parker, 1997) Determining the most appropriate policy
to deal with the uninsured motorists (UM) problem is closely related to the magnitude of the
problem. However, estimating the number of vehicles that do not have insurance, but should, is a
difficult task. Operating a vehicle on public roads without insurance is illegal. Individuals
involved in illegal behavior often prefer to keep their identity hidden. This frustrates efforts to
obtain accurate counts. Marowitz (1991a) reviewed nine different approaches to estimating the
UM rate and then (in Marowitz, 1991b) evaluated the two most promising methods. The first
method involved using the ratio of insured vehicles to total vehicles. The second method used
California Highway Patrol (CHP) data on violations for driving without proof on insurance and
court dismissal data. The first method covers all private passenger vehicles while the second
method was believed to be more representative of the active drivers. Concerns about the
representativeness of drivers on CHP patrolled roads, varying levels of enforcement activity, and
inconsistent criteria for court dismissals led to the opinion that the first method is less subject “. . .
to potential biases, and may therefore give a more valid estimate . . .” than the second method.
This first approach is discussed in detail in this paper.
This approach to estimating the UM rate involves comparing the total number of vehicles to the
number of vehicles with insurance. Subtracting the number of vehicles with insurance from the
total number of vehicles gives the number of vehicles without insurance. The UM rate is
calculated by dividing the number of vehicles without insurance by the total number of vehicles.
While this process is theoretically simple, there are many difficulties in obtaining and accurately
processing the data needed to perform these calculations. This paper discusses the different data
that are available, and the consequences of different assumptions and different ways of processing
4
this data. The methodology that is discussed is applicable to other states. All data are from
California.
Khazzoom (1997) also discusses different methods for estimating the UM rate and concluded that
“. . . the available estimates are very much intertwined with the methods used in generating them .
. .”2 The methods he reviews include matching databases (which is the method discussed in detail
in this paper), use of the ratio of UM claim frequency to BI claim frequency, and surveys.
Surveys encounter the problems of reaching a representative sample of uninsured motorists and
obtaining truthful, accurate responses. Because of these problems, surveys of uninsured motorists
tend to produce biased estimates of the UM rate, but are able to provide much richer information
on the characteristics of people who drive without insurance. Surveys of uninsured motorists in
general, as well as the results of a recently completed survey of uninsured motorists are discussed
in a separate paper (see Hunstad, 1999b).
2Khazzoom (1997) states that “Even when the methods are documented and appear to be the same, the results often diverge. In the case of California, for example, DMV and California's Department of Insurance (CDI) report apparently the same method of estimating the percent of uninsured motorists. But the picture the estimates of these two agencies project is quite different. DMV reports a pronounced downward trend in the proportion of uninsured motorists in 1988-1990; CDI reports an upward trend for the same period.” His point is well taken and one of the purposes of this paper is to show how seemingly minor variations in the method or data influence the resulting UV estimate. However, there are a couple of problems with the data cited by Khazzoom. These are:
- The reference incorrectly refers to a 1990 report by Marowitz. The correct reference year is 1991 (referred to as Marowitz 1991b in this paper).
- The cited data from Marowitz's Table 3 is the wrong data to compare with the CDI data. Table 3 shows the estimated UV rate based on the method using the CHP violation data. The correct data to use is the data for “Approach 1" in Table 2. This table only has UV estimates for 1988 and 1989, and the estimated UV rates were 24.4% and 23.9%. The CDI estimates that were cited were 25.6% and 26.2%.
DMV's estimates show a 0.5 point decrease from 1988 to 1989. CDI's estimates show a 0.6 increase for the same time period. Considering the variability that will be illustrated latter in this paper, the DMV and CDI estimates are surprisingly close. It should also be noted that while the DMV and CDI both describe the method used in roughly the same terms, it is likely that there were some minor differences in how each agency parameterized their model. Also, there appears to be some differences in the source of insurance data. Also, the CDI estimates were prepared in 1997 six years after DMV's estimates were prepared. It is likely that there were data revisions during this six year time period.
5

The approach to estimating the UM rate that involves comparing the frequency of UM claims to
the frequency of bodily injury claims is interesting because it uses summary insurance data that is
easier to obtain than most data on uninsured motorists. However, this approach is believed to be
biased and less accurate than the one reviewed in this paper. Hunstad (1999a) describes this
approach in detail and discusses the problems and limitations associated with it.
At the outset it is important to mention the difference between uninsured motorists and uninsured
vehicles. Generally, auto insurance is linked to the vehicle not the driver. An individual who
owns two vehicles, one that is insured and one that is not, is an uninsured motorist when driving
the uninsured vehicle and is an insured motorist when driving the insured vehicle. Hunstad
(1999b) estimated that a large portion (possibly up to half) of the individuals who own one
uninsured vehicle also owns a vehicle that has insurance. This temporal state of an individual's
uninsured motorist status makes measuring the number of uninsured drivers difficult and
somewhat confusing. As a result of the uncertainty about the status of a driver at any point in
time, the measurement of the UM rate as it is used in this paper refers to vehicles not people. To
emphasize the fact that we are dealing with vehicles, not individuals, throughout this paper we
have used the abbreviation UV rather than the more commonly used UM abbreviation. We define
the UV rate as the number of vehicles that should have insurance, but do not, divided by the total
number of vehicles that should have insurance. This approach to measuring the UV rate produces
an estimate of the percent of vehicles that are in violation of the financial responsibility laws. A
more accurate portrayal of the problems created by uninsured vehicles on-the-road would
combine the UV rate with a measurement of the on-the-road exposure of insured versus uninsured
vehicles. This refinement would take into account the number of hours (or miles) a vehicle was
on the road. Uninsured vehicles that are rarely used would not be considered as much of a
problem as uninsured vehicles that are used frequently. Unfortunately, at this point in time such
refined data are not available.
6
At this point it is also important to note that in this paper the estimate of the UV rate is limited to
vehicles used for personal purposes. Vehicles that are used mainly for business purposes are
specifically excluded. The reason for this is due to the way insurance companies divide insurance
into personal and commercial lines. The data for commercially insured vehicles tend to be very
limited and little information besides total premiums is available. As a result of this lack of data it
is extremely difficult to obtain an accurate and reliable estimate of the number of vehicles that are
insured by commercial insurers.
The two major tasks in estimating the UV rate are determining: 1) the total number of vehicles
that should have insurance, and 2) the number of vehicles that actually do have insurance. The
first two sections of this paper discuss these issues. Following this a detailed model for measuring
the UV rate is described and the different data are combined to examine the sensitivity of the
estimated UV rate to the different types of data.
An overview of the estimation method is shown in Figure 1. Inputs to the model are shown as
circles and the calculated quantities are shown as squares. In the first part of the model, the
number of vehicles on-the-road is estimated using an estimate of the number of vehicles registered
as of July 1, plus an estimate for the number of unregistered vehicles. In order to arrive at an
estimate for the number of personal use vehicles that should have insurance, the number of
vehicles used for business is removed from the total number of on-the-road vehicles. Because the
vehicle counts are broken down by auto and commercial registrations, the non trucks that are
commercially registered must be removed before the estimated percent of trucks used for personal
purposes is applied.
To determine the number of personal use vehicles with insurance, an unadjusted count is
corrected for the estimated extent of underreporting. The final calculation of the model, the
estimated UV rate, involves subtracting the number of vehicles with insurance from the total
7

number of vehicles to arrive at the estimated the number of uninsured vehicles and dividing by the
total number of vehicles.
8

Figure 1 Estimated UV Rate Model
Number of registered vehicles
as of July 1st
Estimated % of unregistered
vehicles
plus Number of vehicles on
the reoad
Estimated % of commerical vehicles that are not trucks
minus
Vehicles not included in estimate
plus
Estimated % of vehicles used for
business
Unadjusted count of vehicles with
insurance
plus Number of personal use vehicles that should have
insurance
Number of personal use vehicles with
insurance
Estimated % of underreportingdivide
Estimated UM rate
9

--
TOTAL NUMBER OF VEHICLES
The primary source for data on the total number of vehicles is the Department of Motor Vehicles
(DMV). The DMV maintains a Vehicle Registration (VR) database. The VR database contains
registration information on vehicles that are currently registered in California. It also has
information on vehicles that were once registered but whose registration has expired, and
information on those who are in the process of registering or re-registering. Periodically reports
are produced that contain various types of counts. Three different reports have been identified
that provide information related to the total number of vehicles. These are:
- Report #1: Currently Registered Vehicles by Zip Codes [as of xx-xx-xx]
- Report #2: Fee Paid Vehicles Currently Registered [by County] as of Dec. 31, 199x
- Report #3: Estimated Fee-Paid Vehicle Registrations by County
Documentation on exactly what is and is not included in these reports is not readily available.
However, after numerous discussions with programmers, analysts, forecasters, researchers, and
user liaisons at DMV it has been possible to learn something related to what is actually being
counted. Because the vehicle count is such an important input to determining the UV rate, it is
worthwhile reviewing these reports in some detail.
Report #1: Currently Registered Vehicles by Zip Codes [as of xx-xx-xx (this report is not
run at on the same day each year), it is run periodically at the request of the Department of
Insurance's Statistical Analysis Bureau]:
- Does not perform any data validation checks. The only criterion for being counted is if
the vehicle’s registration is current as of the date the program is run.
- Includes vehicles with not yet expired registrations that have re-registered out-of-state.
- Includes vehicles with not yet expired registrations that have been junked.
- Includes vehicles where a license plate with a different number has been issued and the
original plate is still valid (not expired). Possible examples include plate lost and new plate
issued, and new vanity plate issued. These inclusions would involve double counting.
10

- Excludes a vehicle if its registration has expired, even if it’s current status is “transaction in
process” (e.g., sent in check for registration but forgot to include other required paperwork such
as a smog certificate).
Report #2: Fee Paid Vehicles Currently Registered [by County] as of Dec. 31, 199x:
- Excludes International Registration Program (IRP) vehicles. These are commercial vehicles
based in other states that operate a certain percent of the time in California.
- Includes “prorated” vehicles. These are commercial vehicles based in California, but they are
only licensed for a limited number of months at a time (presumably because of some type of cyclic
or seasonal workloads).
- Excludes a vehicle if its registration has expired, even if it’s current status is “transaction in
process” (e.g., sent in check for registration but forgot to include other required paperwork such
as a smog certificate).
- Excludes vehicles that have paid Planned Non-Operations (PNO) fees. Individuals registering a
vehicle as PNO certify that it will not be operated on public roads.
- Perform validation checks on several variables and if one of these variables is missing or coded
out of the acceptable range, the vehicle is excluded. It is estimated that approximately 60,000
vehicles are excluded based on these validation checks.
Report #3: Estimated Fee-Paid Vehicle Registrations by County:
- This report uses Report #2 to determine the distribution of vehicles in the 58 counties, but the
actual counts in the report are based on data from DMV's Statement of Transactions (SOT)
database. Although this is the “official” DMV report on the number of vehicles, the purpose of
this report is to count registrations not vehicles. As such, it could count a single vehicle multiple
times. A transaction is counted when a fee is paid and some type of sticker or permit is issued.
Some examples of the possible double counting include vehicles being sold (one count for the
original registration by the seller and one count for the new registration by the buyer), when a one
day moving permit is issued multiple times for vehicles not currently registered, and multiple
11

prorated registrations for less than a full year at a time.
- The SOT report used in producing Report #3 provides separate tallies for renewals and new
registrations.
Reports #1 and #2 are counts as of one point in time. Report #3 covers the registrations in a one year
time period. The computer program that produces Report #2 also produces several other reports. One
of these reports identifies the number of vehicles with 90 to 120 days past due fees. A file containing
this information is sent to the Franchise Tax Board (FTB) for collection. Currently, there is no record
of what the FTB does with these referrals or what percentage of the fees they are able to collect.
In general, records are purged from the VR database four years after the last action to the record.
However, if a vehicle has ever been registered out of state, it is never purged. In addition to the other
differences between Reports #1 and #2, the daily variation in the VR database contributes to the
differences in the counts reported by each report.
Differences Between the Reports
As report #3, “Estimated Fee-Paid Vehicle Registrations by County,” does not attempt to count
vehicles (despite its “official” status), it is clearly not suitable as an estimate of the number of vehicles.
The primary difference between Report #1 and Report #2 is that Report #1 is more inclusive. Vehicles
included in Report #1 but excluded from Report #2 include:
- Vehicles with one or more invalid data field (approximately 60,000 vehicles).
- Vehicles whose California registration has not expired but have been re-registered in another
state. In a 8-17-96 run against the VR database a total of 778,767 vehicles were marked as re-
registered in another state. It is not known how many of these are the type marked for permanent
retention in the VR database. The balance of the vehicles would generally have been re-registered
out of state within the last four years. Assuming a uniform distribution across these four years,
about one-quarter of these vehicles would have had the “re-registered” status less than one year
and potentially could have a current California registration. Assuming a uniform distribution of
12
the date moved out of state, about one-half of the less than one year vehicles might be included in
Report #1 because they had a current California registration but not in Report #2. If only 20% of
the total count were being kept due to permanent retention, then we might expect the reports to
differ by about 78,000 ((80% * 778,767) * 1/4 * ½).
- Vehicles that have been junked that still have a current registration. According to the 8-
17-96 run against the VR database almost 4,000,000 vehicles in the database are classified
as junks, nonrevivable junks, or a salvage certificate issued. These vehicles are purged
from the VR database according to the four-year retention rule. Following similar logic as
with the vehicles re-registered out of state, we estimate that approximately 500,000
(4,000,000 * 1/4 * ½) of these vehicles might be counted in Report #1 but not in Report
#2.
- The double counting of vehicles in Report #1 for vehicles with two different license
plate numbers, both of which have valid current registrations. We are not aware of any
data that could be used to estimate this effect. DMV staff seems to believe it is probably a
very small number. For analysis purposes, we assume a maximum of 10,000 vehicles.
Based on the above differences we estimate that the counts from Report #1 should exceed the
counts from Report #2 by about 648,000 (60,000 invalid data item + 78,000 re-registered out of
state + 500,000 junks still registered + 10,000 two current license plates). Table 1 summarizes
the counts for autos and commercial vehicles from the three reports from 1992 to 1997. The
observed differences also include the effect of the reports being run on different dates and range
from 612,000 to 810,000. These differences seem to be consistent with our rough estimate of the
differences between the two reports.
At the extreme, the number of auto and commercial registrations could differ by about 1.5 million
vehicles between different DMV reports. Thus selecting an inappropriate DMV report could have
a substantial effect on the estimated UV rate.
13

Table 1 Vehicle Counts From Different Sources
Report #3 Report #2 Report #1* Report #1** Auto 1991 16,926,944 16,400,861
1992 16,859,365 15,982,178 16,501,484 1993 16,994,947 16,041,490 16,601,831 16,551,520 1994 16,837,449 16,130,460 16,732,297 16,686,783 1995 17,157,152 16,243,073 16,871,492 16,747,739 1996 17,449,209 16,418,676 17,272,948 16,950,179 1997 16,670,867 16,057,930 16,734,899 17,334,849 1998 16,660,128
Commercial 1991 4,760,347 4,462,127 1992 4,692,863 4,300,780 4,480,085 1993 4,704,890 4,308,797 4,497,994 4,489,015 1994 4,672,873 4,317,734 4,510,583 4,513,155 1995 4,700,618 4,329,106 4,528,051 4,509,711 1996 4,807,511 4,346,437 4,607,202 4,539,713 1997 4,522,907 4,217,614 4,385,146 4,620,145 1998 4,355,858
Motorcycle 1991 636,631 563,773 1992 580,660 551,619 547,400 1993 555,141 523,045 531,071 539,258 1994 524,366 501,102 518,151 517,248 1995 514,599 484,750 503,194 518,457 1996 508,176 478,408 500,256 493,490 1997 388,787 376,478 403,320 501,554 1998 391,077
Auto & 1991 21,687,291 20,862,989 Commercial 1992 21,552,228 20,282,958 20,981,569 Subtotal 1993 21,699,837 20,350,287 21,099,825 21,040,535
1994 21,510,322 20,448,194 21,242,880 21,199,938 1995 21,857,770 20,572,179 21,399,544 21,257,450 1996 22,256,720 20,765,113 21,880,150 21,489,892 1997 21,193,774 20,275,544 21,120,045 21,954,994 1998 21,015,986
Total 1991 22,323,922 21,426,762 1992 22,132,888 20,834,577 21,528,969 1993 22,254,978 20,873,332 21,630,896 21,579,793 1994 22,034,688 20,949,296 21,761,031 21,717,186 1995 22,372,369 21,056,929 21,902,738 21,775,907 1996 22,764,896 21,243,521 22,380,406 21,983,382 1997 21,582,561 20,652,022 21,523,365 22,456,548 1998 21,407,063
Run dates for Report #3 and Report #2 are Dec. 31st. Run dates for Report #1 change every year and are: 1993 = unk.,11-5-94, 1-19-95, 8-7-96, 1-28-97, and 2-11-98
*Report 1* is interpolated to estimated the count as of 12-31-9x **Report 1** is the raw counts as of the run date.
Trends in Vehicle Counts:
14

- - --- - - -
- .... -- ......... -__________ .... --
-- -- - - -- ------ -,..-- --"'. -- ------ ' ' .....
' ' ,.
r=-7 C-__J
Figure 2 shows the trend of the auto plus commercial counts over the past seven years. Prior to
1997 there was a steady increase each year. Then there is a relatively sharp drop in 1997.
Figure 2 Number of Autos and Commercially Registered Vehicles
Estimated Auto + Commerical Count
19,000,000
19,500,000
20,000,000
20,500,000
21,000,000
21,500,000
22,000,000
22,500,000
Report #3
Report #2
Report #1*
1991 1992 1993 1994 1995 1996 1997
The large drop in 1997 occurred for both autos and commercially registered vehicles. The 1997
drop is even more of a deviation from previous trends given the continuing strong economy in
1997.
We are not aware of any other factors influencing the 1997 drop in the number of registered
vehicles besides the new proof of insurance requirement for vehicle registration. This new law
15

became effective January 1, 1997. It requires the vehicle owner to submit to DMV proof that the
vehicle is insured before DMV can issue or renew the registration for the vehicle. Proposition
213 that denies pain and suffering damages to individuals without insurance on their vehicle, and
its passage may have caused increased awareness of the insurance requirement for vehicle
registration.
In order to estimate what the 1997 count might have been if the pre-1997 trend had continued, a
linear regression was fitted to the pre-1997 data (from Report 1*). That trend line projected a
1997 count of 21.9 million vehicles. The estimated count of 21.1 million autos and commercially
registered vehicles represent a 3.7% reduction from the projected count.
The number of registered motorcycles has seemingly been affected by different forces than the
auto and commercially registered vehicles. Figure 3 shows the motorcycle counts for the past
seven years.
16

····- ~----,;~ ....... ..... °'., ..... .
.... .... . ...... ~--.-.-.-.-. ----------""\ .... __ -- -- -- --- ...... ______ _
...... _ ...... _ ..... ______ ,
\ \
\.- '·, -
\ \
\ \
\ L_ ___ ~ \\
EJ -.
Figure 3 Number of Registered Motorcycles
Estimated Motorcycle Count
650,000
600,000
550,000
500,000
450,000
400,000
350,000
1991 1992 1993 1994 1995 1996 1997
Report #3
Report #2
Report #1*
While the auto and commercially registered vehicles were on an upward trend prior to 1997, the
number of registered motorcycles were steadily declining. However, in 1997 the number of
motorcycles also experienced a sharp drop from their previous trend. The pre-1997 trend for the
motorcycle count would have projected a 1997 count of approximately 481,000. The estimated
count of 403,320 represents a 19.3 % reduction from the projected count. This suggests that the
new proof of insurance requirement seems to be having a proportionately greater effect on
motorcycles.
17
For estimating the total number of vehicles for use in an analysis to estimate the percent of
vehicles not insured, the ideal measurement for the total number of vehicles in California would be
the number of vehicle-years. This would be comparable to the insurance data that measures the
number of vehicle years of earned premium. Vehicles that are registered the entire year will
appear in both Report #1 and Report #2. Additionally, Report #1 counts some vehicles that are
likely to not have been operated in California for the entire year (most likely due to the vehicle
being junked or being moved out of state). However, only about half of these partial year vehicles
appear to be counted in Report #1. If the event that caused the vehicle to cease being operated in
California was uniformly distributed across the months of the year, counting half of these vehicles
would tend to reflect a vehicle-year type of measurement. Since Report #1 seems the closest to
the ideal type of measurement for estimating the percent of vehicles uninsured, it appears to be the
best source for a vehicle count for an analysis of uninsured vehicles.
Other Factors to Consider:
The above discussion has focused only on determining the total number of registered vehicles at
one point in time. Other factors that need to be addressed in the analysis include:
- What is the most appropriate point in time to use for an estimated count?
- How many vehicles are operated without being registered (if a vehicle is being operated on the
public highways, it is required to have insurance and thus should be included in the analysis)?
- How many of the vehicles are not used for business use and should have purchased private
passenger auto insurance?
As stated previously, the ideal type of measurement for the number of vehicles would reflect the
number of vehicle years that occurred in a given year. Vehicles that only existed for part of the
year would be counted on a prorated basis in such a measurement. Unfortunately, this type of
information is not available. The next best alternative is to estimate what this count might be.
18

If the flow of new vehicles into the state and the flow of old vehicles out of the state are uniform
throughout the year, it is possible to estimate the number of vehicle years. While it is unlikely that
the number of vehicles per day that are added or retired is the same for every day of the year (as
would be the case if perfect uniformity existed), if the number per day is more or less the same,
we can estimate how the count of the total number of vehicles changes throughout the year. If
the flow of new vehicles in equals the flow of old vehicles out, then there is no change in the total
number of vehicles for the year. (See top box of Figure 4.) In this situation (assuming the flows
to be approximately uniform) the vehicle count would be about the same every day and this count
would be the average for the year.
If the flow of new vehicles in did not equal the flow of old vehicles out, then only at the mid point
in the year would the daily count equal the average for the year. (This assumes approximately
uniform flow in and out throughout the year.) In general, if there is a trend to increasing numbers
of vehicles, the flow of new vehicles in will be greater than the flow of old vehicles out. (See
bottom box of Figure 4.) In such a case the daily counts for the first half of the year will always
be less than the daily counts for the last half of the year. The midyear count would be the only
daily count that equaled the yearly average.
Unless there is evidence of a distinct seasonality in the net change to the number of vehicles in the
state, the best date to use for estimating the average number of vehicle years is July 1st. To the
extent that the flows (either in or out) tend to be random in nature as opposed to approximately
uniform throughout the year, a confidence interval would need to be placed around any specific
day count to reflect the random nature of the daily count fluctuations.
19

Figure 4 Variations in Vehicle Counts under Steady or Increasing States
flow in = flow out (no change in total count)
Jan Jul Dec
average
flow in > flow out (increasing total count)
JulJan Dec
average
Unregistered Vehicles Estimates:
CEC Estimates:
The California Energy Commission (CEC) has attempted to estimate the rate of unregistered
vehicles. The models developed by the CEC produce detailed estimates of the composition of the
fleet of vehicles operated in California now and estimates of what the fleet mixture will be in the
future given different scenarios. An important input to these models is the total number of
vehicles currently being operated. In order to estimate the percent of unregistered vehicles, the
CEC periodically obtains a copy of the DMV's VR database and examines the percent of vehicles
20

with expired registrations. One approach to modeling unregistered vehicles assume that vehicles
with registrations that have expired less than 12 months in the past are still being operated, and
any vehicle with an expired registration greater than 12 months is not being operated. It is clear
that on an individual vehicle basis sometimes these assumptions will not be correct. However, it
is not clear on an overall count basis, how accurate these assumptions are. The CEC is currently
involved in an analysis to attempt to trace the vehicles with expired registrations over time and
estimate how many of them have some sort of registration activity that might indicate that they
are being operated. An estimate that CEC has used in their models is based on the percent of
vehicles with expired registrations within the last 12 months. For 1995 the percent of vehicles
with an expired registration less than 12 months old was 9.0%. Applying the 9.0% rate to the
number of autos and commercial registrations would yield an estimated 1.9 million vehicles being
operated without registration.
In the CEC's first trace analysis, all vehicles with expired registrations and without a transaction in
process in August 1996 were identified. (See Table 2).
Table 2 Summary of Tracing Vehicles with Expired Registrations 8/96 to 10/97
(all numbers are in millions of vehicles)
Initial cohort of vehicles with expired registrations as of August 1996 5.19
Results of trace conducted October 1997:
Could not locate Registration expired 0 to 12 months Registration expired 1 to 2 years Registration expired 3 or more years
0.12 0.36
0.52
1.00
Located vehicle Vehicle still unregistered & no registration activity Vehicle currently registered or some reg. activity
3.38 0.80
4.18
The analysis started with a total of 5.19 million vehicles, with 1.65 million (32%) having
21
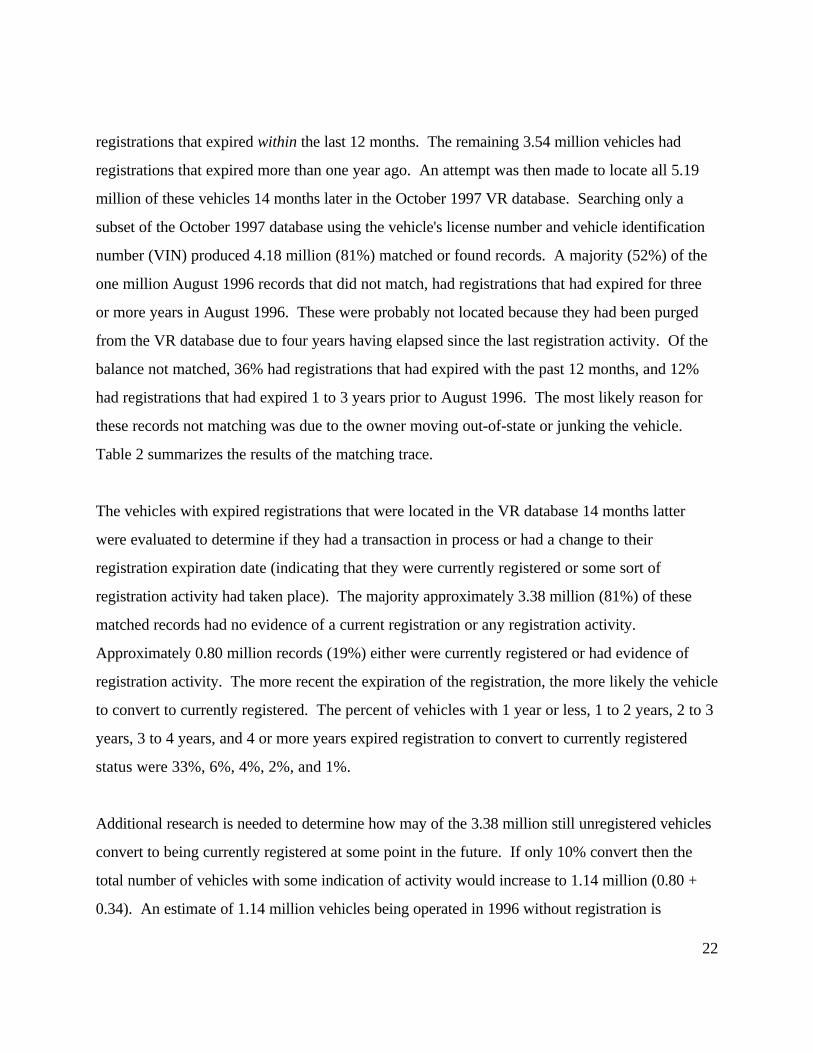
registrations that expired within the last 12 months. The remaining 3.54 million vehicles had
registrations that expired more than one year ago. An attempt was then made to locate all 5.19
million of these vehicles 14 months later in the October 1997 VR database. Searching only a
subset of the October 1997 database using the vehicle's license number and vehicle identification
number (VIN) produced 4.18 million (81%) matched or found records. A majority (52%) of the
one million August 1996 records that did not match, had registrations that had expired for three
or more years in August 1996. These were probably not located because they had been purged
from the VR database due to four years having elapsed since the last registration activity. Of the
balance not matched, 36% had registrations that had expired with the past 12 months, and 12%
had registrations that had expired 1 to 3 years prior to August 1996. The most likely reason for
these records not matching was due to the owner moving out-of-state or junking the vehicle.
Table 2 summarizes the results of the matching trace.
The vehicles with expired registrations that were located in the VR database 14 months latter
were evaluated to determine if they had a transaction in process or had a change to their
registration expiration date (indicating that they were currently registered or some sort of
registration activity had taken place). The majority approximately 3.38 million (81%) of these
matched records had no evidence of a current registration or any registration activity.
Approximately 0.80 million records (19%) either were currently registered or had evidence of
registration activity. The more recent the expiration of the registration, the more likely the vehicle
to convert to currently registered. The percent of vehicles with 1 year or less, 1 to 2 years, 2 to 3
years, 3 to 4 years, and 4 or more years expired registration to convert to currently registered
status were 33%, 6%, 4%, 2%, and 1%.
Additional research is needed to determine how may of the 3.38 million still unregistered vehicles
convert to being currently registered at some point in the future. If only 10% convert then the
total number of vehicles with some indication of activity would increase to 1.14 million (0.80 +
0.34). An estimate of 1.14 million vehicles being operated in 1996 without registration is
22

substantially lower than the 1.65 million estimated using the assumption that vehicles with expired
registration within the last 12 months are still being operated. However, the 1.14 million estimate
should be increased by an amount to reflect those vehicles not in the August 1996 VR database
that were being operated. Currently there is no data available to estimate an appropriate size for
this increase adjustment.
It is important to note that this analysis is distinctly limited due to unique data considerations.
The “in process” records were not included in the August 1996 VR database that were used as
input data for the analysis. Analysis of the October 1997 VR database showed that including the
“in process” records with expired registration increases the total number of unregistered vehicles
by 26%. If this 26% had similar experiences to the other August 1996 vehicles with expired
registrations, the 0.80 million vehicles would increase to slightly more than 1 million vehicles.
Since these 26% had a transaction in process in August 1996 it is likely that they would have an
even higher match rate and a higher rate of conversion to currently registered status. If this were
the case, the estimate of one million vehicles would likely be increased. Also, if registration
activity was suppressed in 1997 due to the new proof of insurance requirement, a 1996 to 1997
match would tend to lead to an understatement of the unregistered but currently operated
vehicles. These circumstances confound drawing a clear conclusion from the first trace analysis.
Subsequent analysis with better data will hopefully shed more light on this, including the
likelihood of conversion from expired registration status to currently registered.
In a second trace analysis the CEC started with those vehicles that had expired registrations in
October 1997 and followed up 6 months later, in April 1998. This cohort totaled 5.36 million
vehicles, with 2.40 million (45%) having registrations that expired within the last 12 months. The
remaining 2.96 million vehicles had registrations that expired more than one year ago. Due to the
short time between creation of the cohort and the follow up trace, virtually all of the records were
located in the file 6 months later. Table 3 summarizes the results of the second matching trace.
23
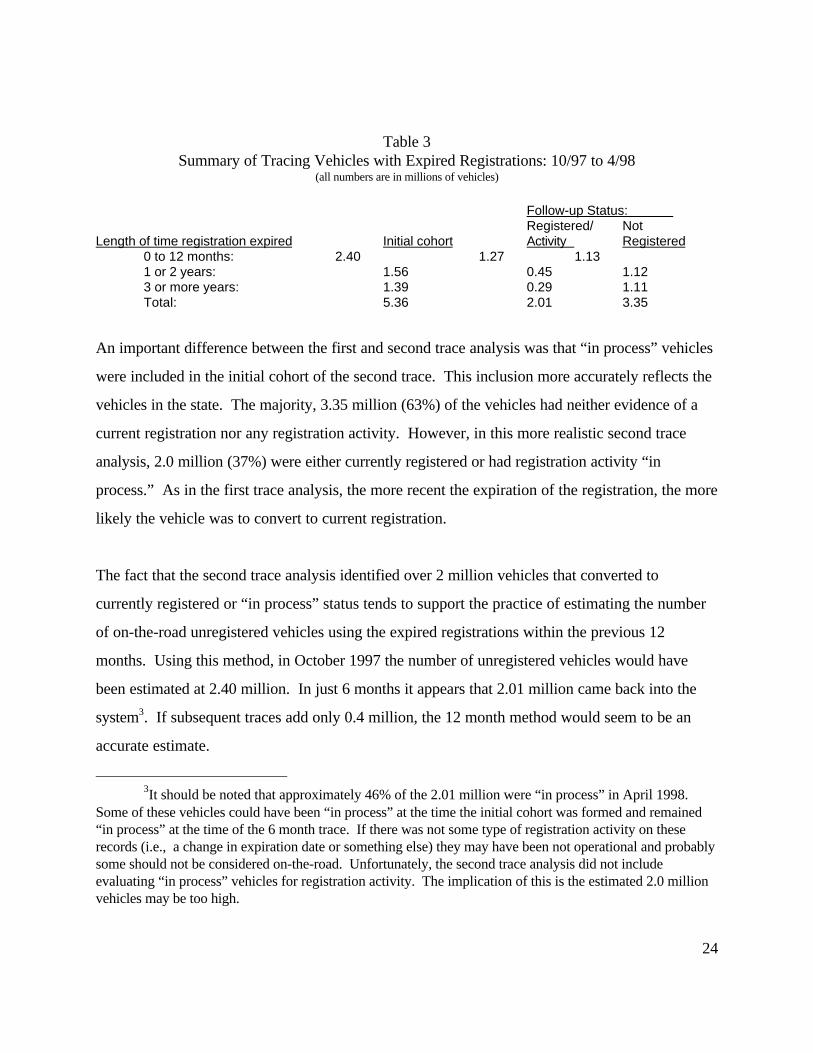
Table 3 Summary of Tracing Vehicles with Expired Registrations: 10/97 to 4/98
(all numbers are in millions of vehicles)
Follow-up Status: Registered/ Not
Length of time registration expired Initial cohort Activity Registered 0 to 12 months: 2.40 1.27 1.13 1 or 2 years: 1.56 0.45 1.12 3 or more years: 1.39 0.29 1.11 Total: 5.36 2.01 3.35
An important difference between the first and second trace analysis was that “in process” vehicles
were included in the initial cohort of the second trace. This inclusion more accurately reflects the
vehicles in the state. The majority, 3.35 million (63%) of the vehicles had neither evidence of a
current registration nor any registration activity. However, in this more realistic second trace
analysis, 2.0 million (37%) were either currently registered or had registration activity “in
process.” As in the first trace analysis, the more recent the expiration of the registration, the more
likely the vehicle was to convert to current registration.
The fact that the second trace analysis identified over 2 million vehicles that converted to
currently registered or “in process” status tends to support the practice of estimating the number
of on-the-road unregistered vehicles using the expired registrations within the previous 12
months. Using this method, in October 1997 the number of unregistered vehicles would have
been estimated at 2.40 million. In just 6 months it appears that 2.01 million came back into the
system3. If subsequent traces add only 0.4 million, the 12 month method would seem to be an
accurate estimate.
3It should be noted that approximately 46% of the 2.01 million were “in process” in April 1998. Some of these vehicles could have been “in process” at the time the initial cohort was formed and remained “in process” at the time of the 6 month trace. If there was not some type of registration activity on these records (i.e., a change in expiration date or something else) they may have been not operational and probably some should not be considered on-the-road. Unfortunately, the second trace analysis did not include evaluating “in process” vehicles for registration activity. The implication of this is the estimated 2.0 million vehicles may be too high.
24

Also, Bernstein (1999) found some support for estimating that vehicles with registrations that had
expired within the last 12 months are still being operated. He compared DMV's records with
insurance company records and found that 17% of the vehicles with expired registrations of less
than 12 months still had active insurance coverage. Only 1% of those vehicles with expired
registrations of more than 12 months had active insurance coverage.4
It should also be noted that there is some limitation to the approach of tracing of vehicles with
expired registrations over varying time periods to see if they convert to a registered status. Even
if this process could be executed perfectly, it would still miss two groups of unregistered vehicles.
The first group is vehicles that were never registered. The second group is those vehicles that
were last registered four or more years ago and have been purged out of the DMV database.
Additional research is needed to estimate the size of these two groups of long term unregistered
vehicles and the extent to which they are still on-the-road.
Estimating of the number of unregistered vehicles currently being operated has been made more
difficult by a recent law change that provides increased incentive to not register a vehicle.
Effective January 1, 1997 in order to renew a vehicle's registration the owner had to submit proof
that the vehicle was insured. For many without insurance, not registering their vehicle becomes a
tempting alternative. The impact of this new law could be behind the observed drop in
registrations for 1997 that was discussed earlier. This change in the registration environment also
limits the applicability of historical estimates of the number of unregistered to post 1997 time
4Bernstein's analysis also uncovered another group of vehicles that traditionally have been excluded from estimates of on-the-road vehicles and may be currently operated. These are vehicles that are registered as PNO (Planned Non-Operative) and as junked. Many of these vehicles carry current liability coverage and may actually be on-the-road. The analysis found that 47% of the PNO/junked vehicles with a current registration had current insurance coverage. This relatively high level of insurance coverage may be due to a number of these vehicles being recently involved in an accident and being considered “totaled.” Of the vehicles with a less than 12 month expired registration, 8% had current insurance coverage. Only 2% of the PNO/junked vehicles with a registration that had expired over 12 months were currently insured.
25
periods. Prior to 1997 the total number of vehicles registered were on an upward trend. In 1997
the total vehicle count dropped by 0.6 to 1.2 million vehicles (depending on the report used).
Vehicles that were unregistered in 1996 were probably much more likely to remain unregistered
than in any previous year.
Early DMV Estimates:
In a 1990 DMV study Marowitz reported that 13.7% of vehicles cited for violations by the CHP
in 1988 were unregistered. Due to some of the vehicles being stopped specifically because they
did not have a current registration, Marowitz reasoned that the 13.7% was not a random sample
of vehicles on-the-road and could not be used as an estimate of the unregistered vehicles. He
apparently made a judgment to reduce the 13.7% by half and used 7% as an estimate of the
percentage of registered vehicles that are operated unregistered. To the best of our knowledge,
this analysis was the first time that a published report estimated the rate of unregistered vehicles.
At the time of Marowitz's report very little information was available on unregistered vehicles.
In a 1991 study, Marowitz reported on the percent of public contacts by the CHP that resulted in
a citation for an unregistered vehicle (i.e., California Vehicle Code 4000a). He reasoned that
public contacts were a better sample of the on road vehicles because in addition to stops for
citations, stops for various types of assistance are also included. This created a broader base that
the number of citations were compared to, and as a consequence the percent that was estimated
was lowered. Marowitz felt that these estimates were an upper bound for the actual percent of
unregistered because CHP officers would have observed a greater number of vehicles than the
number of public contacts they made. It is not clear whether using a broader base like public
contacts improves or diminishes the accuracy of the estimated percent of unregistered vehicles.
The key issue in effectively using violation data is in determining how well it represents the
general on-the-road population. This is discussed in more detail below. The percent of public
contacts that resulted in a citation for operating an unregistered vehicle in 1988, 1989, and 1990
were 6.8%, 5.9%, and 5.2% respectively. Considering these percents as upper bounds, Marowitz
26

revised his previous 7% estimated unregistered rate in 1988 to 5% and used 4% as the estimated
rate in 1989.
Also, it is not clear why the 1990 CHP rate for unregistered as a percent of public contacts should
have declined by nearly one-quarter from the rate in 1988. This much variation in the rate causes
one to suspect that factors other than the number of unregistered vehicles are affecting the rate.
The actual counts are not reported in Marowitz's report, making it not possible to determine if the
CHP used a different strategy for reporting their public contacts in the years reflected by the data
or other changes in the data reporting process occurred. A decision by CHP to target particular
locations or types of vehicles (e.g., older cars) or particular types of enforcement activities could
result in a different ratio when there was no change in the actual percentage of on-road
unregistered vehicles. A new CHP administrative rule about when a “public contact” should be
reported could cause a similar distortion in the rate. In order to more fully explore the violation
data, ten years of the source data were obtained from the CHP. A detailed analysis of this data is
described in the next section.
Estimates Based on CHP Violations:
In order to provide another perspective on estimating the rate of unregistered vehicles, more
recent CHP data were analyzed. Data files containing individual citation records covering the ten
year period from 1988 to 1997 were obtained from the CHP. The data files contained records for
all citations that involved an uninsured (CVC 16020a or 16028a), unregistered (CVC 4000a), or a
hit-and-run (CVC 20001a or 20002a) violation. These data only reflect citations issued by the
CHP. The percentage of all types of citations issued for any reason that involved an unregistered
vehicle are shown in Table 4.
27

Table 4 CHP Citations for Unregistered Vehicle
Year 19885
Percent of Citations Involving Unregistered Vehicle 13.2%
1989 6.3% 1990 10.0% 1991 9.8% 1992 9.1% 1993 8.6% 1994 11.3% 1995 10.5% 1996 11.9% 1997 12.2%
Detailed data tables showing the actual counts are included in Attachment A. The percentage of
CHP citations that involved an unregistered vehicle violation is not the perfect method to use in
estimating the number of unregistered vehicles on-the-road. The violation data provides an
alternate perspective on the phenomena of unregistered vehicles. It is subject to a number of
factors that may bias its use for estimating the number of on-the-road unregistered vehicles.
A most basic question concerning the use of citation data involves the issue of representativeness.
This can be broken down into two sub-issues. The first sub-issue is: does the percent of
individuals receiving a citation for a specific offense represents the percent of individuals in the
population of violators who are committing the offense? This may either be the case or it may
not. If one assumes that:
1) all violations are equally observable by an officer,
2) a patrolling officer observes a representative sample of the area and vehicles being
patrolled, and
3) once a violation is observed, the officer stops the offending individual and issues a
citation,
5The 13.2% of citations for unregistered vehicle for 1988 is 0.5% less than the 13.7% reported for 1988 by Marowitz in 1990. The difference is most likely due to data cleaning and refinements during the succeeding eight years.
28
then the percentage of citations for a specific offense will be an unbiased estimate of the
percentage of the population that are committing a violation of that specific type of offense in
areas covered by the CHP. These three assumptions will be discussed below.
The second sub-issue focuses on the relationship between the percentage of the violating
population that are committing a specific type of violation and the percentage of the total
population that are committing a specific type of violation. If 100% of the total population can be
considered a member of the violating population, then the percentage of the specific type of
violation would match the percentage of these occurrences in the total population. If only 10% of
the total population can be considered a member of the violation population, the percentage
associated with the specific type of violation would need to be reduced (to 10% of its initial
value) to reflect the occurrence rate in the total population.
Evaluating these sub-issues is complicated by the fact that violations generally occur for a distinct
period of time. Most individuals commit some type of violation at some point in time. Some
individuals spend a longer amount of time in a state of violating some law than others. Also,
some individuals appear to be more adept at avoiding detection than others.
If close to 100% of the total population were also a member of the violating population, and each
individual spent roughly the same amount of time exposed to detection in a state of violating some
law, then the percentage of violations for a specific violation would correspond to the percentage
of the total population committing a specific violation. However, this is clearly not the case.
Numerous analyses have shown that younger individuals commit more violations (i.e., spend more
time in a state of violating some law). This is even more true for younger males. However, it is
also true that this segment is a relatively small part of the total population. Other analyses
(Hunstad, 1995) have shown that over 90% of the population can be classified as “good drivers.”
To the extent that these 90% are equally “good” (i.e., spend roughly the same amount of time in
a state of violating some law), they can be considered to have equal exposure to the risk of being
29

cited for a violation. If this is the case then the violation data provides a rough approximation of
the percentage of different violation types for most of the violating population.
This still leaves the issue of what percent of the total population is also a member of the violating
population. Speeding is one of the most common violations and a 1995 survey by the Insurance
Research Council found that a majority (51%) of the respondents agreed that it is acceptable to
speed on the highway (Insurance Research Council, 1995). Drivers license data analyzed in the
next section estimates that about 13% of those with a drivers license receive a conviction each
year. If about one out of eight violators are caught and convicted, this estimate would support
estimating most of the driving population committing a violation at some point in the year. An
alternate way of looking at this issue is to attempt to estimate the percentage of the population
that has not committed any violation in the year being estimated. In order to be counted in this
category, an individual would have to have not made any driving mistakes during the entire year.
While this is clearly not impossible, the percentage of the driving population that meets this high
standard is likely to be small. Hence, the bias due to the violation population being smaller than
the total population is likely to be not large. However, because of this, it is likely that the percent
of violations for unregistered vehicle will be greater that the percent of the vehicles on-the-road
that are unregistered.
Some factors that might influence the ability of the violation data to produce an accurate estimate
of unregistered vehicles on-the-road include:
- While the CHP's jurisdiction is spread throughout the entire state, the specific areas
covered by the CHP may not be representative of the state as a whole. (Currently, there
does not appear to be any data that shows a potential for bias in this area).
- Citations are not the same as convictions. If a citation is found to be not true or the
charge is dismissed prior to conviction, the vehicle should probably not be counted as
unregistered. If citations for unregistered vehicles have a higher or lower conviction rate
than the average of all other types of citations, then a bias could be introduced. (At this
30

time there is no evidence of a differential conviction rate for citation for unregistered
vehicles).
- Due to limitations in CHP's data system, at most four violations can be captured in the
citation record. The data system is structured so that the last two of these four violations
can only be for correctable or “fix-it” types of violations. As uninsured and unregistered
are considered to be correctable offenses, these citations can appear in any of the four
possible violation locations in the data record. (A speeding violation, on the other hand,
could only appear in the first two violation locations in the citation record.) To the extent
that an unregistered citation is excluded due to this limitation in the CHP's data system, it
would tend to under estimate the actual number of unregistered vehicles. An analysis of
over four million citation records for the 1988 to 1997 time period that involved citations
for uninsured, unregistered, or hit-and-run found 1.3 million that did not include a citation
for unregistered vehicle. None of these 1.3 million records had all four citation locations
in the data record filled. This indicates that the negative bias due to the data system
limitations is likely to be extremely small or non-existent.
- Issuing a citation for an unregistered vehicle has a lower enforcement priority that most
other types of violations. Anecdotal reports from CHP officers indicate that if an officer
observes a potential drunk driver or a speeding vehicle at the same time as a potentially
unregistered vehicle he or she will pursue the vehicle committing the more serious offense.
To the extent that unregistered vehicles are observed but not cited, the percentage of
citations for unregistered vehicles will be an under estimate. Anecdotal reports indicate
that the observation of multiple vehicles each committing an offense does occur but not
frequently. Thus this is probably the source of a small bias towards underestimating the
percentage of unregistered vehicles.
- Most violations occur as the result of some behavior or lack of behavior by an individual.
To the extent that this behavior can be observed, there is the chance that a citation will be
issued for the violation. Some violating behaviors are more observable that other. A large
vehicle exceeding the speed limit or running a red light is easy to observe and can be
31

observed at a great distance. Observing whether or not the stickers on a license plate are
current requires the officer to be fairly near the vehicle and have good lighting6.
Anecdotal reports by CHP officers indicate that more citations for unregistered vehicles
are written during the daylight hours when it is easier to observe a vehicle's license plate.
On the other hand, vehicles committing various types of moving violations commit them
only for a specific time period. Vehicles can not be continually running red lights. Even a
person speeding, generally does not speed 100% of the time they are driving. However,
an unregistered vehicle is potentially observable as being unregistered 100% of the time it
is on-the-road. It is not clear whether these delectability and temporal differences give the
unregistered driver a greater or lesser probability of citation than a driver committing
some other type of moving violation.
- A person with an unregistered vehicle may reduce the time he or she uses the vehicle
compared to if the vehicle was registered. This tendency has been confirmed by anecdotal
reports in focus groups. There is also some support for the idea of reduced exposure by
6Some individuals driving unregistered vehicles take deliberate steps to conceal their lack of registration. It is not known how many unregistered vehicles appear to be registered due to their owners use of stolen license plates or registration stickers. Due to limitations in their data systems, DMV is not able to determine how many license plates or registration stickers are reissued each year due to theft. It is possible to determine the number of vehicles that have had substitute plates issued. These reissued plates could have been reissued because the original plates were stolen, the owner was replacing the old regular plates with new custom vanity plates, or for some other reason. Also, there is no count of the number of current year registration stickers that were stolen. As of August 1998, there were a total of 4.54 million vehicles (3.44 personal, 1.02 commercial, and 0.09 motorcycle) in the VR database that have had plates reissued at some time during the vehicle's life. According to a October 3, 1997 DMV press release about 1 million vehicles have current custom vanity plates. If all of these vehicles first had a regular plate before obtaining the custom vanity plate, it would still leave at least 3.54 million vehicles with reissued plates where the reissue was not for a custom vanity plate.
An analysis of the June 1997 VR database found it to contain approximately 30 million motor vehicle records. The average vehicle age of those considered to be on the road was approximately 11 years old. If the 3.54 million vehicles with a reissued (non-vanity) plate were spread over an 11 year period, about 1% of the vehicles would be obtaining a reissued (non-vanity) plate each year. Thus, an estimated upper bound for the number of license plates stolen in a one year time period would seem to be about 1% of the registered vehicles. However, this limit does not include the theft of registration stickers. Theft of a current registration sticker would seem to be a preferred way to disguise an unregistered vehicle, as a stolen license plate would seem much more likely to be reported to the police.
32

unregistered drivers to the extent they also have lower incomes. In an analysis of travel
survey data Bernstein (1994) found that lower income drivers tended to driver fewer miles
than higher income drivers. To the extent that an individual minimizes the unregistered
vehicle's on-the-road exposure compared to their likely behavior if the vehicle was
registered, the chance of that vehicle receiving a citation for being unregistered is reduced,
and the percentage of citations would tend to underestimate the percentage in the total
population.
The percent of violations for unregistered vehicle is clearly not the perfect measurement of the
percent of vehicles on-the-road that are not registered. Some of the factors affecting the percent
of violations for unregistered vehicle tend to bias it downwards, and some factors tend to bias it
upwards. Because the affect of these factors can not be precisely estimated, the accuracy of any
estimate based on the violation data can not be established. However, in a general sense, the
violation data can be seen as providing a rough estimate of the percent of unregistered vehicles
on-the-road.
DMV Drivers License Records:
Another way of generating an estimate of unregistered vehicles involves using DMV drivers
license records. One advantage of this approach is that only convictions appear on an individuals’
record. If an individual received an unjustified citation and it was so ruled by a court, it would not
appear on the individual’s drivers license record.
However, there are some distinct disadvantages to using drivers license records to estimate the
prevalence of unregistered vehicles. The drivers licensing system is focused on individuals not
vehicles making it further removed from the actual vehicles that may lack registration. Because
the records in the drivers license database focus on the individual and what he or she does, there
are layers and procedures in the system that may affect the ability of these records to accurately
estimate the number of unregistered vehicles on the road. Some factors that work to the
33

disadvantage of using drivers license records to estimate unregistered vehicles include
- Among local law enforcement, enforcement of traffic and vehicle laws have a relatively
low priority. Unless some particular traffic issue becomes a major problem, local law
enforcement generally places higher priority on more serious crimes such as theft,
burglaries, alcohol and drug problems, assaults, etc.7
- The conviction information reported by the courts to the DMV may be incomplete or not
represent the primary reason for the citation. For example, if an individual is cited for a
violation and fails to appear or pay the fine, he is charged with a failure to appear by the
court. When the individual is subsequently caught or for some other reason desires to
clear the failure to appear off his record, he may plead guilty to the failure to appear in
exchange for dismissal of the initial violation. The courts have some incentive to
emphasize collection of failure to appear fines over vehicle code violation fines. All funds
collected from failure to appear fines are kept locally, whereas most of the funds collected
for vehicle code violations goes to the state. Also, as of mid 1999, DMV was just
finishing automation of the court reporting process. Previously, a variety of tapes and
paper copies were used to report violations.
-Some licensed drivers do not own any vehicles. Also, many drivers own more than one
vehicle. Ideally, each driver license record should be weighted by the number of vehicles
owned. Unfortunately, this data was not available.
- Perhaps the most serious problem is the ability of an officer to issue an unregistered
citation as a “fix-it” ticket. When (of if) the owner corrects the situation by obtaining the
required registration it does not make it onto his or her drivers license record.
The drivers license data used to estimate the percent of unregistered vehicles was a 1% systematic
7 Just considering the serious traffic offense of driving under the influence (DUI) shows how much local law enforcement tends to emphasize non-traffic enforcement. In 1997, the primary state law enforcement agency (CHP) accounted for only 10% of the full time sworn law enforcement personnel, yet they made 46% of all arrests for DUI (California Department of Justice, 1999a and 1999b). This difference is likely to be even more exaggerated for the low priority vehicle laws.
34

random sample of DMV’s drivers license database. This sample was drawn in May 1998. Each
sampled record consisted of one or more sub-records. The sub-records could be of four types:
the first type was the basic licensing information that contained information on birth date, sex,
county of residence, and dates license issued and expires; the other three types of records were
abstracts of convictions. The conviction abstracts were divided based on the number of points
associated with the most serious offense. The three types were 0, 1, and 2 point citations. Each
citation record contained a listing of the sections violated. The record contained room for up to
eight violations. The citation record also contained information on the data of violation, the date
of conviction, fine, suspension, and jail indicators.
The file was structured so that the basic license record appeared first followed by any citation
records associated with the driver. The initial sample contained 1,046,139 records, representing
376,861 driver licenses. This analysis only included drivers who had a valid license in 1998.
When the expired licenses, ID card only, and special EDP records were removed a total of
209,033 licensed drivers were available for analysis. Because some citation data are only kept for
three years, only the three prior years, 1995 to 1997 were analyzed.
For each year the number of drivers convicted of any violation, an unregistered vehicle violation,
and a uninsured vehicle violation were counted. It should be noted that while this data did not
include any identifying information such as drivers license number, name, or street address, it did
contain citations that are not normally a part of the public record. These included citations that
are considered dismissed as a result of the violator attending traffic school, and a small number of
cases where the judge suppressed the information for other reasons. The basic results are shown
in Table 5.
35

Table 5 Drivers Cited for Unregistered Vehicle
1995 1996 1997
Total drivers 209,033 100% 209,033 100% 209,033 100%
Cited for any reason 27,100 13.0% 26,288 12.6% 26,563 12.7%
Cited for unregistered vehicle 1,156 4.3% 1,025 3.9% 863 3.2%
Cited for uninsured vehicle 147 0.5% 161 0.6% 2,793 10.5%
It appears the percent of drivers being convicted of any violation during the year remained stable
at about 13% from 1995 to 1997. However, the percent of drives with a unregistered vehicle
citation appeared to be on a declining trend. In 1995, 4.3% of the cited drivers included a citation
for an unregistered vehicle. This percent had decreased by more than 25% to 3.2% in 1997. For
comparison purposes, the percent of cited drivers cited for uninsured vehicle was 10.5% in 1997.
Prior to 1997 police did not routinely ask for proof of insurance.
The small percentage of citations for unregistered vehicle in the drivers license citation records is
puzzling, particularly the declining percent in 1997. As has been previously discussed, in 1997 a
new law required proof of insurance before a vehicle registration could be renewed. This seemed
to result in fewer than expected registrations and more citations for unregistered vehicle from the
other sources reviewed in this report. In particular, the CHP citation data shown in Attachment A
shows an increased percent of unregistered vehicle citations (to 12.2%) in 1997 and uninsured
vehicle citations at 13.9% in 1997. It is not clear why there should be such a discrepancy between
the information in the drivers license records and the CHP citations. Perhaps the discrepancy is
due to a combination of the factors cited previously on the problems in using drivers license
records to estimate unregistered vehicles. If there was a dramatic difference between local law
enforcement and CHP’s inclination to issue citations for unregistered vehicles, some of the
observed differences could be explained. The smaller difference on the percent of citations for
uninsured vehicle could have been due to the novelty of a new law going into effect in 1997 and
36

gaining more attention from local law enforcement agencies. Also, the decline in convictions for
unregistered vehicles could have been the result of officers sympathizing with individuals having
to comply with the new 1997 law on proof of insurance, and issuing most of the unregistered
citations as “fix-it” citations.
The low percentages could also be due to some type of DMV data process error. An internal
DMV report titled “DL Conviction Report” indicates the total number of times a vehicle code
section was implicated in a citation. These numbers when compared to the total number of
licensed drivers indicate an increase in unregistered vehicle violations in 1997.8
While the citation data in the drivers license records may under estimate the unregistered vehicles
they do provide selected demographic and geographical information not usually available on the
operators of unregistered vehicles. If there is a bias to the under count of unregistered vehicles
than this additional information is of lessor value. However, we are not aware of any such biases
with the exception of the unregistered vehicle citations being less likely to come from local law
enforcement. Table 6 shows the characteristics of the drivers cited for any violation, unregistered
vehicle, and uninsured vehicle during the time period from 1995 to 1997.
8 The actual numbers off the “DL Conviction Report” are: Licensed Drivers Unregistered Veh. Cites % from Sample
1996 20,278,100 205,933 1.016% 0.490% 1997 20,487,400 214,060 1.045% 0.413% 1998 20,735,500 206,709 0.997% n.a.
37

Table 6
Characteristics of Unregistered Vehicle Drivers, Cited Drivers, and All Drivers
Drivers Cited in Drivers Cited in Drivers Cited in 1995 to 1997 1995 to 1997
All Drivers 1995 to 1997 for unreg. veh. for unins. veh. Age: under 21 5.9% 6.7% 5.2% 8.9% 21 to 25 8.7% 14.0% 16.7% 20.3% 26 to 30 11.1% 15.6% 20.4% 20.1% 31 to 40 24.1% 28.3% 32.0% 29.2% 41 to 50 21.2% 19.9% 18.1% 15.5% 51 to 60 13.2% 9.4% 6.0% 4.4% over 60 15.7% 6.4% 1.7% 1.7%
Sex: male 52.4% 64.0% 69.5% 71.3% female 47.6% 36.3% 30.5% 28.7%
Region: Los Angeles County 26.0% 30.5% 29.0% 34.2% South coast 22.0% 21.6% 18.1% 20.7% South inland 9.2% 9.1% 11.4% 9.3% SF Bay area 20.7% 20.0% 19.9% 15.8% Sacto. & Fresno County 5.7% 5.1% 7.4% 5.7% Central Valley 8.3% 7.7% 8.1% 9.2% Foothills & Sierra Counties 3.1% 2.2% 2.8% 1.4% NW Calif. 4.5% 3.8% 3.0% 3.4% Out of state / unknown 0.4% 0.0% 0.3% 0.2%
Average number of cites from 1995 to 1997 for: any violation 0.48 1.64 2.73 2.50 unregistered vehicle 0.02 0.06 1.25 0.21 uninsured vehicle 0.02 0.06 0.19 1.13
Total number: 209,033 61,556 2,854 3,068
Considering a citation for any violation, males and those aged from 21 to 40 are more likely to be
cited. Females and those over 50 are less likely to receive a citation. Those in Los Angeles
38

County were more likely to be cited, while drivers in the foothills, sierra, and north western 9
counties were less likely to be cited.
Considering just the citations for unregistered vehicle, the findings are similar. Males and those
aged 21 to 40 were most likely to be cited for an unregistered vehicle. Females and those over 40
are less likely to be cited for an unregistered vehicle. Those in Los Angeles, the south inland
counties, and Sacramento and Fresno counties were more likely to receive a citation for an
unregistered vehicle. Drivers in the south coast and north western counties were less likely to be
cited. Also, it appears that those who receive a citation for an unregistered vehicle have a poorer
driving record that other cited drivers. Drivers who were cited for any violation in the 1995 to
1997 period averaged 1.64 citations. Drivers who were cited for an unregistered vehicle violation
in the 1995 to 1997 period averaged 2.73 citations. These drivers were over three times as likely
to be cited for uninsured vehicle as drivers cited for any violation, and over nine time as likely to
be cited for an uninsured vehicle as the general licensed driver.
Drivers cited for an uninsured vehicle shared similar characteristics to the drivers cited for an
unregistered vehicle.
Estimates Based on Survey Research:
In 1999 Hunstad reported on efforts to estimate the rate of uninsured and unregistered vehicles
using random telephone interviews. Assessments of the representativeness and accuracy of the
sample and the respondent's responses indicated that the data are likely to under estimate. For
example, only about 10% of vehicle owners reported owning an uninsured vehicle (Hunstad,
1999b). This is less than half the rate of 22.6% estimated from an analysis (that is believed to be
more accurate) of DMV and insurance company records (Bernstein, 1999).
9 The regions used in this analysis used the same regional definitions used in Hunstad (1994).
39

During this same survey 7.1% of the vehicle owners reported owning an unregistered vehicle. An
additional 8% refused to answer the question, raising the suspicion that they too may be
unregistered. Thus, based on these survey data an estimated 15% may possible be unregistered.
Given the tendency of the survey data to produce an substantially underestimated rate, 15% seems
like a very high estimate. However, two additional factors need to be considered. The first is that
some of the 7.1% who reported owning an unregistered vehicle actually had registered the vehicle
as a planned non-operative (PNO) vehicle. If these vehicles were in fact actually not operated,
then the percent reporting an unregistered vehicle would be reduced from 7.1% to 6.6%.
The second factor to consider is that just under half of those admitting an unregistered vehicle
reported that the reason for the vehicle not being registered was that the vehicle was not used or
did not run. If these respondent were providing truthful answers, the estimated unregistered rate
based on these survey data would drop to the 3.3% to 7.0% range.
If the under estimation bias due to problems with the survey data apply equally to the reporting of
uninsured vehicles and unregistered vehicles, then the unregistered estimates should be adjusted
by a factor of 2.26 (22.6% / 10.0%). Applying this adjustment factor would put the estimate of
the unregistered vehicle rate in the 7.5% to 15.8% range.
Given the problems in obtaining a representative sample of uninsured and unregistered individuals
(i.e., low income, low education, highly mobile) and the problems inherent in obtaining honest,
accurate responses to questions on what are essentially illegal behaviors, it seems advisable to
regard these estimates with a certain amount of caution. Based on the best available information
it seems reasonable to conclude that the survey data supports an estimated unregistered rate in the
7% to 16% range.
Fatal Accident Reporting System:
Another approach towards estimating the percentage of unregistered vehicles concentrates on
40

only the data from fatal accidents. Studying fatal accidents can provide unique insights because a
wealth of data is available about them. Also, involvement in a fatal accident can occur at any time
or at any place. Individuals who cause or are responsible in a fatal accident are probably not a
representative sample of the vehicles on-the-road. However, if one only considered those drivers
who were not responsible for the accident, and involved in the accident only due to being in the
wrong place at the wrong time, then these vehicles could be considered a type of pseudo-random
sample.
Since 1975 the U.S. Department of Transportation, National Highway Traffic Safety
Administration has been operating the Fatal Accident Reporting System (FARS). The FARS
collects detailed data on every fatal motor vehicle accident in the United States. The data on each
accident is contained in a series of hierarchical data records. The highest level record is the
accident record. This record contains data on the date and time of the accident as well as the
physical characteristics of the road and environmental conditions. The second level in the
hierarchy is the vehicle record. One vehicle record is created for each vehicle involved in the
accident. The vehicle record contains data on the type and characteristics of the vehicle, the
number of occupants, and a description of the damage sustained. Of key interest in this analysis is
the data on the vehicle's registration and the registered owner. FARS staff do not simply take the
vehicle registration information off the accident record, but independently verify with the DMV
the registration status of each vehicle involved in the accident.
The third level in the hierarchy is the driver record. One driver record is created for each vehicle
record. The driver record contains data on the driver's license characteristics and status, as well
as information on citations issued in the accident, and previous violations and accidents. The
fourth and final level in the hierarchy is the person record. A person record is created for each
vehicle occupant (including the driver) as well as any non-vehicle occupant involved in the
accident (e.g., a pedestrian or bicyclist). The person record contains data on age, sex, position
and behavior in the vehicle, injury sustained, and drug/alcohol use.
41

The basic methodology used in this analysis of the FARS data was similar to that used in the
analysis reported by De Young (1997) to estimate the percentage of drivers with suspended or
revoked driver's license on-the-road. The major difference is that this analysis focuses on the
registration status of the vehicle. The criteria for selecting vehicles to include in this analysis
were:
1) the accident must have occurred in the state of California,
2) at least two vehicles were involved in the accident,
3) the driver was not cited for a moving violation, and
4) the driver did not die in the accident.
Single vehicle fatal accidents were not included because they were believed to be not
representative of the general driving population. Also, it was believed that if the driver died in the
accident, examining the citation data would not show if the driver was considered to be at fault
for the accident. Consequently, these vehicles were not included in the analysis.
In the vehicle registration data, three possible codes indicated the possibility of a vehicle being
unregistered. One category clearly identified the vehicle as not registered. The other two
categories were “not applicable” and “unknown”. The use of one versus the other of these two
categories has seemed to vary over the last ten years. Frequently it appeared that the not
applicable code was used when another variable (e.g., registered owner) in the record indicated
that the vehicle was unregistered. The registration status of the vehicles in the unknown category
is the most unclear. These are vehicles for which there is no identifying information, perhaps due
to the vehicle leaving the accident scene, or for which no DMV records could be found. The
latter would be likely if the vehicle was never registered with DMV or the registration that the
vehicle once had had expired for four or more years and the DMV records had been purged. To
the extent that these unknowns actually had a current registration, the estimated percent of
unregistered vehicles using the FARS data would be biased upwards. Additional analysis of the
42

vehicles with an unknown registration status indicated that slightly over half (57%) of these
vehicles were involved in hit-and-run accidents. The CHP citation data shown in Attachment A
shows that between 1988 and 1997 an average of 6.8% (range 4.3% to 8.8%) of those cited for a
hit-and-run violation were also cited for an unregistered vehicle. However, it appears that the
CHP may only catch and cite about one in seven of the hit-and-run vehicles (Hunstad, 1999a,
endnote 2). Discussions with sergeants, traffic officers, and the FARS coding supervisor at the
CHP indicate that those who are cited for hit-and-run are probably not representative of all hit-
and-run vehicles. It is likely that factors other than operating an unregistered vehicle, such as
alcohol use or having an outstanding arrest warrant, would provide greater motivation to flee an
accident. However, it seems reasonable that an unregistered vehicle driver would be more
oriented to avoiding detection than a registered vehicle driver, and thus might be more effective in
fleeing the scene of a hit-and-run accident. CHP officers familiar with the investigation of hit-and-
run accidents indicated that with a vehicle license number that is currently registered, they have
approximately a 90% success rate in apprehending the hit-and-run driver. However, without a
current registration for the license number, the success rate in apprehension drops to below 50%.
Thus, it appears that the majority of those who avoid being cited for a hit-and-run accident have
a much higher likelihood of being unregistered.
According to the FARS coding supervisor, the other primary reason for a vehicle being coded as
unknown registration status is the vehicle did not have any license plates. While there is the
possibility of the vehicle's license plates was stolen, it seems reasonable to estimate that the vast
majority of the vehicles without license plates are not currently registered. The other situation
that would likely result in a vehicle's status being coded as unknown involves the DMV search of
the license plate number yielding a vehicle that does not match the description in the accident
report. Because the FARS unit is able to identify and correct data entry errors (made by the
reporting police officer) in the accident report by cross searching on the owners name, it was
estimated that these types of situations only accounted for a few percent of the vehicles coded as
unknown. Using the somewhat subjective impressions of the individuals involved with the FARS
43

data is estimated that approximately two-thirds of the unknown status vehicles were unregistered.
This estimate assumes that the hit-and-run vehicles (57% of the total “unknowns”) are
unregistered about 50% of the time, the vehicles with no license plates (40% of the total
“unknowns”) are unregistered about the 95% of the time, and the remaining vehicles (3% of the
total “unknown”) are unregistered about 10% of the time (67% = 57% * 50% + 40% * 95% +
3% * 10%).
Table 7 shows the number of vehicles included in the analysis and the category counts for the
estimated unregistered vehicles. The “Estimated Total Not Registered” column is calculated by
adding the Not Applicable and Not Registered colmums and then adding 67% of the Unknown
column.
Table 7 Not At Fault Vehicles in Fatal Accidents
Total Number Registration Status: Estimated Total Estimated
Year of Vehicles Not Applicable Not Registered Unknown Not Registered Percent
1988 2343 9 154 138 255 10.9%
1989 2283 4 123 136 218 9.6%
1990 2107 4 110 101 182 8.6%
1991 2103 10 135 108 217 10.3%
1992 1861 40 91 71 179 9.6%
1993 1748 32 98 75 180 10.3%
1994 1908 24 86 74 160 8.4%
1995 1823 32 84 54 152 8.3%
1996 1827 33 72 58 144 7.9%
1997 1660 44 75 43 148 8.9%
44

A key question in assessing the accuracy of the FARS based estimate of unregistered vehicles is:
are the not at-fault vehicles contained in the FARS data a representative sample of all vehicles on-
the-road. De Young (1997) points out that it would be more accurate to say that these vehicles
are a sample of the vehicles on-the-road during the times and in the places where fatal crashes
occur.
We are not aware of any data describing the vehicles and drivers using the roadways where fatal
crashes occur. It seems unlikely that the places where fatal crashes occur could result in a bias. If
a particular spot or stretch of roadway had a well known reputation for producing a high
frequency of fatal crashes, and if there were alternate roadways available to drivers, then a
knowledgeable and risk adverse driver would tend to avoid that spot or stretch of roadway. To
the extent that this knowledgeable, risk adverse driver tended to have a greater likelihood of
driving a registered vehicle, the rate of unregistered vehicles would tend to be overstated. While
there is no definitive data available, the conjunction of all these conditions would seem to effect a
very small percent of the fatal accidents.
Data is available on the time of fatal accidents. This data can be compared to the time of all injury
accidents which is likely to be more representative of all vehicles on-the-road. Figure 5 shows the
distribution of fatal accidents versus injury accidents by the hour of the day.
45

-· ......
. '
~' '
' ... - ... ■ ... -.... ' ,
' '
Figure 5 Time of Accident: Fatal vs. Injury
0%
1%
2%
3%
4%
5%
6%
7%
8%
9%
Per
cent
of A
ccid
ents
Fatal
Injury
injury > fatal
fatal > injury
7 8 9 10 11 12 1 2 3 4 5 6 7 8 9 10 11 12 1 2 3 4 5 6
a.m. p.m. a.m.
While fatal accidents occur during every hour of the day and every day of the week, the time
period from 7 p.m. until 6 a.m. contains a higher percentage of fatal accidents compared to injury
accidents. Other data show that fatal accidents are more likely to occur on the weekend. As
there is no evidence to indicate that unregistered vehicles have a higher or lower tendency to use
the roads at these times, it is difficult to conclude that those vehicles not at fault in fatal accidents
are a biased sample due to the skewing of the likely time of occurrence for fatal accidents.
46

The estimate of unregistered vehicles based on the FARS data can be seen as another perspective
on the on-the-road unregistered vehicles. There does not appear to be any systematic biases in
this estimate, either upwards or downwards. However, simply due to the fact that this data
represents a sample, there is likely to be some variation in the estimate. At the 95% confidence
level, a variability of +/- 1% to 2% would be expected from the data.
Summary of Unregistered Estimates:
Figure 6 summarizes the different estimates of the percent of unregistered over the past 10 years.
As expected most estimates show an increase for 1997. Overall, the estimate based on the CHP
violation data tended to be more variable (and likely less accurate) than the estimate based on the
not at fault vehicles in fatal accidents. The standard deviation of the CHP violation based estimate
was 1.91% compared to 0.96% for the FARS based estimate. However, except for 1989, both of
these estimates are within 2 to 3 percentage points of each other.
47

• - . . •
• ,. ---.. .. -I .. .. .. -I
.. _ •
-""-. I
• r-,,.. ~- /"'--
• -----.. --- )< .. ;;;- - .. ..
' .,. ....
I .. .. I .,.
• ......... I / .... .. .. .. ..
' - -.. ,, -
• ...... ....... ./ • I •
I -I .
• I
·• • I
• I
"
~ -
Figure 6 Estimates of Unregistered Vehicles from Five Methods
16.0%
14.0%
12.0%
10.0%
8.0%
6.0%
4.0%
2.0%
0.0%
CHP violations
unregistered < 1 year
not at fault vehicles in fatal accidents
DL citations
survey
1988 1989 1990 1991 1992 1993 1994 1995 1996 1997 1998
The estimate based on the vehicles with expired registrations of less that one year is in fairly close
agreement with the FARS based estimate. The differences in 1995 and 1997 were 0.7 and 0.8
percentage points. Because of their stability and agreement, these two estimates are believed to
be more accurate than the violation based estimate. However, because of the complexity of the
issue and the difficulty obtaining a direct measurement, the perspective contained in the CHP
violation data are believed to provide some additional information. While the estimates from the
drivers license records were puzzling, it was thought that they should be included and given some
consideration.
48

In order to utilize the contributions of the various different perspectives on the issue of
unregistered vehicles, the different estimates were combined to form a weighted average.
Because of the greater stability of the FARS based estimate, it was given greater credibility than
the violation based estimate. In the weighted average it was assigned twice the weight of the
CHP violation based estimate. For the two years that the estimate based on the vehicles with
expired registration of less than one year were available, they were included in the calculation of a
weighted average with a weight equal to the FARS based estimate. The estimate for the 1995 to
1997 time period based on drivers license records were given half the weight of the CHP data.
Table 8 contains the standard deviations and the weighted average of the estimates.
Table 8 Weighted Average of Estimated Percent Unregistered Vehicles
Source of Estimate FARS CHP DMV DL Weighted
Year not at fault vehicles violations unreg. < 1 yr citations Survey Average 1988 10.9% 13.2% 11.7% 1989 9.6% 6.3% 8.5% 1990 8.6% 10.0% 9.1% 1991 10.3% 9.8% 10.1% 1992 9.6% 9.1% 9.4% 1993 10.3% 8.6% 9.7% 1994 8.4% 11.3% 9.3% 1995 8.3% 10.5% 9.0% 4.3% 8.6% 1996 7.9% 11.9% 3.9% 8.5% 1997 8.9% 12.2% 9.7% 3.2% 9.3% 1998 7% - 16%
standard 0.96% 1.91% 0.91% deviation
The weighted average is considered the best estimate of the percent of unregistered vehicles. It
will be used as the input to the model described later.
Business vs. Personal Use of Vehicles:
The DMV regularly reports on the number of commercially registered vehicles. However, the
numbers reported by DMV reflect commercial registrations not business use. The problem with
49

the DMV's numbers mainly involves light pickup trucks. DMV requires that most of these
vehicles be registered as a commercial vehicle even though they are used entirely for non-business
use.
One estimate of the percent of trucks that are used for personal purposes comes from the Truck
Inventory and Use Survey, a national survey conducted every five years by the Census Bureau for
the U.S. Department of Transportation. In the survey conducted in 1987, 68.1% of the trucks in
California were estimated to be used for personal transportation. In 1992, the survey estimated
that 68.0% of the trucks in California were used for personal transportation. The 1992 survey in
California had a total sample size of 3,950. A 95% confidence interval for the percent of trucks
used for personal transportation is 62.4% to 73.6%. The results of the 1997 survey are not
estimated to be available until early 1999. California appears to not be following the national
trend toward increasing personal use of trucks. Nationally, the percent of personal use of trucks
for 1977, 1982, 1987, and 1992 were 54%, 57%, 66%, and 68%.
It would not be correct to apply the estimated percent of trucks used for personal use to the
DMV's number of commercially registered vehicles. While trucks make up almost all of the
commercially registered vehicles, some other vehicles are also registered as commercial vehicles.
Taxis, ambulances, and private buses are some examples. An analysis of DMV's VR database as
of 6-1-97 found that 94% of the commercially registered vehicles were classified as a truck or in
such a way they would be included in the Truck Inventory and Use Survey.
In order to accurately estimate the number of vehicles that should be purchasing private passenger
auto insurance, it is also necessary to estimate the business use of vehicles that DMV reports as
“autos.” Unfortunately the Census Bureau survey does not estimate the business use of autos and
other non-truck vehicles. Estimating vehicles eligible for private passenger auto coverage is made
more difficult due to the ability of some business use of a vehicle to be covered under a private
passenger auto insurance policy. This situation usually occurs when a person uses their vehicle as
50

part of their job or self-employed business. Generally there is a limit to how much business use an
insurer will allow and still write the coverage under a private passenger auto insurance policy10.
Practically, any use of more than at most a few vehicles predominately for business use would
likely require a commercial auto insurance policy. The prevalence of predominantly business use
of more that a few vehicles classifiable as autos is more difficult to estimate. Virtually all previous
estimates of the UV rate have not made an allowance for the business use of autos. This tends to
overstate the UV rate because an auto with commercial insurance would be counted as uninsured
if only personal lines are considered.
The CEC also prepares estimates of the business use of vehicles for input into their models. As
opposed to using surveys, the CEC conducts an analysis of each vehicle registered or recently
registered in the state. One of the benefits of this approach is that it produces an estimated
business use rate for both autos and trucks.
The CEC process involves two major steps. In the first step the vehicle type is determined. In the
second step the type of use is estimated. There are three different approaches to estimating the
vehicle type: the Guide File, VINA software, and VIN8 software. The Guide File maps vehicles
into a category based on their make, series name, and model. Most post 1971 vehicles can be
classified using the Guide File. If a vehicle cannot be classified using the Guide File an attempt to
classify it using VINA software is made. The VINA software uses the vehicle's VIN to classify it.
The VINA software can process vehicles back to 1966. However if the VIN contains typos or
other data errors, the VINA software can fail to classify it. In such cases the VIN8 software is
10It is also possible that some vehicles used for personal purposes are covered under commercial policies (e.g., a small business or professional may have a single policy that covers both their business vehicles and their personal vehicles). At this time there is no data to indicate how many vehicles classifiable as business use are covered under a private passenger auto policy, or how many vehicles classifiable as personal use are covered under a commercial policy. This cross over between type of use and type of coverage creates less accuracy in the business vs. personal use estimation. This is an area where future research can improve the model for estimating the UV rate.
51

used. The first eight characters of the VIN uniquely identify a vehicle's type. Using these first
eight characters the VIN8 software attempts to classify the vehicle. If all these attempts fail to
classify the vehicle, the DMV data fields for make, model year, and body type are examined and a
vehicle type is assigned if possible.
A vehicle's type of use is estimated by grouping all vehicles with the same owner and address into
“fleets” and then classifying the fleet as personal or commercial. Most fleets contain one or two
vehicles, a few contain thousands. The fleet identification process uses the four name and address
fields in the DMV's VR database. After cleaning and standardizing these fields, a key is generated
for each vehicle. The file is then sorted multiple times using the key, county, and zip code to
group the fleets together. Once the fleets are grouped together, the first step is to examine the
type of registration. Commercial license plates on a vehicle other than a pickup indicate a
business use. Business use is also inferred based on name analysis and fleet size.
If a fleet contains ten or more vehicles it is assigned business use. Also if a fleet contains three or
more trucks, it is assigned business use. The name analysis examines the content of the name
searching for commercial words or word fragments (e.g., INC.), one word names, or names
beginning with initials instead of the last name. The content analysis of the name analyzes various
parts of the name and compares them with a large file of commercial terms. Vehicles with
business owners are assumed to be used for business purposes.
The CEC's process for estimating type of use is extremely time and resource intensive, but it
produces a type of use estimate for each of approximately 25 million vehicles. This is extremely
useful for any analysis that examines smaller geographic units such as counties or zip codes. With
these data the personal/business use proportions can be estimated down to the zip code level,
providing a much more accurate estimate than a single statewide average. The process that the
CEC uses to estimate type of use is continuing to be enhanced. The latest and most accurate data
52

are for 1995. These data indicate that 92.9% of autos and 66.9% of tucks are used for personal 11purposes .
VEHICLES WITH INSURANCE
The primary source for data on the number of vehicles with insurance is the Department of
Insurance's Statistical Analysis Bureau (SAB). Each year SAB collects data from each insurer
licensed to issue auto insurance policies in California. This data covers the amount of premiums
earned and written, the number of months of exposure earned and written, and the number and
amount of any losses incurred. These data are collected separately for the following coverages:
bodily injury (BI), property damage (PD), combined single limits (CSL) (for insurers that combine
BI and PD together), medical payment (MP), uninsured motorist - bodily injury (UM-BI),
uninsured motorist - property damage (UM-PD), collision (CL), and comprehensive (CM).
Further these data are collected for each zip code in which the insurer does business12. The data
collected by the SAB cover both private passenger auto policies, which are the major source of
auto insurance coverage in California, and the California Assigned Risk Program the insurer of
vehicles unable to find coverage in the voluntary market. However, these data do not include
coverage for motorcycles. This limits estimating the UV rate to vehicles used for personal
purposed that are not motorcycles. Motorcycles have been gradually declining as a percent of all
11It is interesting to note that the exact estimated rate of personal use is sensitive to the process used to determine vehicle type. If instead of CEC's process for determining vehicle type, the vehicle type is determined by only using the VINA software, the estimates for personal use become 90.5% for autos and 65.6% for trucks. The issue of properly classifying a vehicle's type has also impacted the U.S. Department of Transportation's National Center for Statistical Analysis's (NCSA) estimation of injury rates for different types of vehicles. Shelton (1995) provides an explanation of the process NCSA used to make their data more reflective of the industry data from R. L. Polk.
12A summary of six years of these data limited to the private passenger auto coverage can be seen in the Private Passenger Auto Frequency and Severity Bands Manual. This manual is available from the DOI and on the internet in the Policy Research Information section which can be found by clicking on “Insurers” at www.insurance.ca.gov.
53

vehicles. In 1991 they represented 2.9% of all vehicles, by 1997 the percent had dropped to
1.8%. Another analysis has found that the UV rate is very high among motorcycles13.
To estimate UV rate, the data we are interested in is earned exposures. Earned exposures are the
number of months in a calendar year the insurance company had a policy in force and assumed
liability for losses caused by the policy holder. Written exposures on the other hand reflect the
issuance of a policy to cover a vehicle for a specific time period in the future. For example, if a
consumer purchases a six month auto policy on 11-1-97, the insurer immediately has six months
of written exposure. However, as of 11-1-97, the insurer has accumulated zero months of earned
exposure for this policy. Theoretically the consumer could cancel the policy on 11-2-97 and
demand a refund of his entire premium less a charge for the one day of coverage. If the policy
remains in force, at the end of 1997, the insurer would have earned two months of the six months
of exposure that was written on 11-1-97.
In an environment where the overall amount of exposure is not increasing or decreasing, and
consumers did not cancel a policy once it was issued, the amount of written exposures would be
equal to the amount of earned exposures. In an environment where the amount of exposure is
increasing, the amount written exposures will tend to be larger than the amount of earned
exposures. This is due to the new vehicles coming into the system. For these new vehicles
insurers are immediately given credit for the entire policy period in the written exposure count,
but only accumulate the earned exposure as time progress. If some of the new consumers coming
into the system have a higher likelihood of canceling the policy before the term has expired, then
the difference between written and earned exposure increases. With the new requirement to
provide proof of insurance at the time of vehicle registration, some have expressed concern that
those who do not want or can not afford the insurance will just purchase the insurance long
13In 1997 it was estimated that about two-thirds (66%) of the motorcycles were uninsured. See California's Uninsured (Preliminary Report), California Department of Insurance, Sacramento, California, 1998.
54

enough to complete the registration process and then promptly cancel the policy. At this point in
time we do not have any convincing data to support the contention that this practice is
widespread.
Ideally we would like to know the number of separate vehicles that were covered by insurance in
a given year. Unfortunately the data only tell us the number of months of exposure the insurance
company earned. Twelve months of earned exposure could have been accumulated by three
vehicles each purchasing four months of insurance, or twelve vehicles with each purchasing only
one month of coverage.
If each vehicle that purchased insurance was insured for the entire year without any lapses in
coverage and there were no new partial year vehicles coming into the system, then we could
divide the number of months of exposure by twelve and determine the number of vehicles insured
during the year. Further, under such an assumption, the number of vehicles insured on any given
day would be the number of vehicle years of exposure earned during the year. If we relaxed these
assumptions allowing new vehicles to enter the system for partial years and old vehicles to exit the
system after completing a partial year of exposure, we can still estimate the number of vehicles
insured. If the rate of new vehicles into the system was approximately equal to the rate of old
vehicles out of the system, then there is no net change to the number of vehicles with insurance.
If the rates of flow in and out were approximately uniform or at least equal during the year, then
the estimated number of vehicles with insurance on any given day would be the number of earned
exposure years for the year. In a situation where the number of vehicles with insurance is
changing each year, but there was still an approximately uniform flow of new vehicles in and old
vehicles out, then the number of vehicle years of earned exposure would be the best estimate of
the number of vehicles insured at mid year.
Due to a lack of data it is not clear if the uniform rate assumption is an accurate description, but
lacking evidence to the contrary, it seems a reasonable assumption. Consequently, until more
55

accurate data are available to evaluate the seasonality of the in and out flows, the best estimate of
the number of vehicles with insurance at mid year is the number of years of earned exposure. This
mid year estimate of the number of insured vehicles would also match the mid year estimate of the
number of vehicles that should have insurance.
Other Issues:
Two other issues impact the estimate of the number of vehicles with insurance. These are
incomplete reporting and selecting the coverage to count earned exposures. There are more than
200 companies that sell private passenger auto insurance in California. Most of these companies
do a very good job of meeting the reporting requirements to report exposure data to the SAB.
However, there are some companies who do not report accurately and a few who do not report at
all. The most common problems are incomplete and erroneous reporting. The net result is that
after the data have been cleaned, the number of vehicles with insurance is understated. In order to
estimate the extent of under reporting the SAB compares the total liability premiums of the data
reported to the CDI with the total liability premiums reported to the National Association of
Insurance Commissioners (NAIC). The reports to the NAIC are part of a different reporting
system that does not require the level of detail that the SAB reports do and have a better
reporting level. Table 9 compares the liability premiums reported to the SAB and the NAIC and
calculates an annual adjustment factor14.
14The total amount of liability premiums reported by NAIC also includes a small amount for the coverage of motorcycles and policy fees. As the SAB figures do not include motorcycles or policy fees, the NAIC premiums have been adjusted downward to make them comparable to the SAB premiums. The 1996 data reported here are preliminary unedited data. Once it has been edited some company's data will likely be removed. After this editing, it is likely that the under reporting level will be more in line with the 1993 to 1995 levels. As the unadjusted count of vehicles reported to have insurance in 1996 (used in Table 9) is also unedited, it is appropriate to use this low under reporting level for 1996.
56

Table 9 Estimated Under Reporting Level
Liability Premiums Reported to: Estimated % Under Reported Year NAIC SAB (NAIC/SAB - 1) 1993 $7,210,575,975 $7,073,962,345 1.9% 1994 $7,218,242,134 $7,142,382,628 1.1% 1995 $7,494,846,972 $7,328,838,986 2.2% 1996 $7,684,493,886 $7,654,775,852 0.4%
As mentioned previously the data collected by the SAB is reported separately for several different
types of coverage. The legally required insurance only covers BI and PD. Theoretically BI and
PD should always be sold together. Some companies do not even sell the coverages separately.
These companies report their sale of BI and PD under the category of CSL. If joint sale always
occurred, the number of months of BI exposure would always equal the number of months of PD
exposure. For an unknown reason, the actual data do not reflect this and BI and PD exposures
differ. This raises the issue of which measurement of exposure should be used in estimating the
number of vehicles with insurance. Options include:
- arbitrarily select one coverage and consistently use it,
- select the coverage with the largest number of exposures,
- select the coverage with the smallest number of exposures, or
- average the two coverages together.
Table 10 shows the amount of BI + CSL, and PD + CSL exposures for 1991 to 1996.
Table 10 Number of Years of Insurance Coverage
Year BI + CSL PD + CSL 1991 13,915,140 13,903,879 1992 13,652,545 13,647,018 1993 13,434,840 13,427,029 1994 13,628,312 13,627,817 1995 13,887,382 13,886,939 1996 14,563,084 14,200,651
57

The data in Table 10 show a fairly close agreement (less than 5,000 difference) for 1994 and
1995. The largest difference is more than 0.36 million for 1996. However, at this time the 1996
counts are preliminary and are under going frequent revisions. In general, exposures for BI
coverage are higher than exposures for PD coverage. It is not clear exactly why this difference
occurs. There has been some evidence that a few companies may have not been able to breakout
the PD portion of CSL when reporting PD exposures. Given the problems experienced with
incomplete and erroneous reporting, it seems reasonable to assume that the lower PD exposure
count is due to some type of reporting problem. If this is the case, the best estimate of the
number of years of insurance coverage would be the BI + CSL count. The model described
below used BI + CSL earned exposure as the measure of insurance coverage.
MODEL SPECIFICATIONS
The basic model to estimate the UV rate can be written algebraically as follows:
UV rate = (TV - IV) / TV [1]
where,
TV = the number of vehicles (excluding motorcycles) that are used for personal purposes
and should have insurance, and
IV = the number of vehicles (excluding motorcycles) that are used for personal purposes
and do have insurance
The TV and IV are calculated according to the following formula:
TV = (A.1 + A.2) {registered vehicles}
+ (B.1 * A.1 + B.2 * A.2) {unreg. vehicles}
- C * A.2 * (1 + B.2) {comm. non-trucks}
- D.1 * A.1 * (1 + B.1) {comm. autos}
- D.2 * [A.2 * (1 + B.2) - C * A.2 * (1 + B.2)] {comm. trucks} [2]
58

IV = E * (1 + F) [3]
where,
A = the total number of registered vehicles as of July 1st
A.1 = the count for autos
A.2 = the count for commercially registered vehicles
B = the estimated percent of unregistered vehicles
B.1 = the percent of unregistered autos
B.2 = the percent of unregistered commercial vehicles
C = the percent of commercial vehicles that are not trucks
D = the estimated percent of vehicles used primarily for business purposes
D.1 = the percent of autos used for business
D.2 = the percent of trucks used for business
E = the unadjusted count of the reported number of vehicle years of private passenger
auto and California Assigned Risk Program insurance purchased
F = the estimated percent of under reporting of insurance purchases
Initial Results:
Using the best estimates that are currently available for the input parameters an initial estimate of
the UV rate was calculated. The registered vehicle count estimates were based on the Currently
Registered Vehicles by Zip Codes (Report #1) prorated to estimate the count as of mid year. The
percent of unregistered vehicles were based on the weighted average shown in Table 8. The CEC
estimates from the 1995 VR database were used to establish the separate percents for autos and
trucks. The percent of commercial vehicles that are not trucks was based on data from the 1997
VR database. The estimated business use of vehicles was based on the CEC estimates from the
1995 VR database. Unadjusted vehicle counts are from the SAB, and the estimated rate of under
reporting insurance purchases were based on data from the SAB and the NAIC.
59

A time series exists for the data on vehicle counts, estimated rate of unregistered vehicles, insured
vehicles, and the estimated rate of under reporting of insurance sales. Unfortunately, the best
available data for the percent of commercial vehicles that are not trucks, and the percent of
business use of vehicles are limited to a single point in time. It may be that these rates are
changing systematically over time, but until more data can be collected, these single point
estimates are the best that are available and were used for all time periods. Examining the
sensitivity of the UV rate to these estimates gives some idea of the effect in the overall model.
Table 11 shows the initial input data the resulting UV rates.
60

Table 11 Initial Model Inputs and UV Rates
INPUTS: 1991 1992 A. Number of registered vehicles as of July 1st 1. autos 16,350,550 16,451,172 2. commercial 4,453,148 4,471,106
B. Estimated percent of unregistered vehicles 1. autos 9.4% 8.7% 2. commercial 14.0% 13.0%
1993 1994 1995 1996 1997
16,551,657 4,489,040
16,667,064 4,504,289
16,801,894 4,519,317
17,072,220 4,567,627
17,003,9244,496,174
9.0% 13.5%
8.6% 12.9%
8.0% 11.9%
7.8% 11.7%
8.6%12.8%
C. Estimated percent of commercial vehicles that are not trucks 5.6%
D. Estimated percent of vehicles used for business purposes 1. autos 7.1% 2. commercial 33.1%
E. Unadjusted count of vehicles reported to have insurance 13,915,140 13,652,545 13,434,840 13,628,312 13,887,382 14,563,084
F. Estimated percent of under reporting of insurance purchases 1.7% 1.7% 1.9% 1.1% 2.2% 0.4%
OUTPUTS: X. Estimated number of vehicles that should have insurance
19,822,315 19,807,148 19,981,033 20,034,120 20,045,974 20,323,829
Y. Estimated number of vehicles with insurance 14,154,017 13,886,914 13,688,759 13,771,409 14,194,293 14,619,880
Estimated UV rate 28.6% 29.9% 31.5% 31.3% 29.2% 28.1%
With the initial input data the UV rate ranges from a low of 29.0% in 1996 to a high of 32.1% in
1993. Since 1993 the estimated UV rate has been gradually declining. Table 12 shows estimated
ranges that the different input parameters might take. We have attempted to estimate the extreme
values that each parameter might take. The probability that each parameter will fall within the
estimated range has not been rigorously determined. These estimates were developed to roughly
correspond to 95% confidence intervals.
61

Table 12 Estimated Confidence Intervals for the Input Parameters
Inputs: + / - Amount Minimum Value (yr) Maximum Value (yr) A. Number of registered vehicles as of July 1st: 1. autos 2. commercial
270,326 71,453
16,080,224 (1991) 4,381,696 (1991)
17,342,546 (1995)4,639,080 (1995)
B. Estimated percent of unregistered vehicles: 1. autos 4.0% 2. commercial 4.0%
4.0% (1995) 13.4% (1991)7.9% (1995) 18.0% (1991)
C. Estimated percent of commercial vehicles that are not trucks: 2.0% 3.6% 7.6%
D. Estimated percent of vehicles used for business purposes: 1. autos 3.5% 2. commercial 5.0%
3.6% 10.6%28.1% 38.1%
E. Unadjusted count of vehicles reported to have insurance: n.a.
F. Estimated percent of under reporting of insurance purchases: 2.0% 0.0% (1996) 4.2% (1995)
The range amount for the number of registered vehicles was estimated by taking the maximum
year to year difference from the years 1991 to 199715. The range for the estimated percent of
unregistered vehicles was selected to include the lowest estimate that has been proposed. The
range for the estimated business use of vehicles was set to approximately match the 95%
confidence interval level for California in the Census Bureau's Truck Inventory and Use Survey.
Table 13 shows the sensitivity of the UV rate to each individual parameter.
15Note that this estimate of the variability of the count of registered vehicles assumes that the report providing the best estimate was selected. If this measure of variability also included the differences among the different DMV reports described earlier, the range of variation would be much larger and the estimated UV rate would have a correspondingly greater sensitivity to this parameter.
62

Table 13 Sensitivity of UV Rate to Individual Parameters
A. Number of registered vehicles as of July 1st 1,991 1,992 1,993 1,994 1,995 1,996 1997
INITIAL VALUE: 1. autos 16,350,550 16,451,172 16,551,657 16,667,064 16,801,894 17,072,220 17,003,924 2. commercial 4,453,148 4,471,106 4,489,040 4,504,289 4,519,317 4,567,627 4,496,174
Estimated UV rate 28.6% 29.9% 31.5% 31.3% 29.2% 28.1%
MINIMIZING VALUES: 1. autos 16,080,224 16,180,847 16,281,332 16,396,738 16,531,569 16,801,894 16,733,598 2. commercial 4,381,696 4,399,653 4,417,587 4,432,836 4,447,865 4,496,174 4,424,721
Estimated UV rate 28.0% 29.2% 30.8% 30.6% 28.5% 27.8%
MAXIMIZING VALUES: 1. autos 16,620,876 16,721,498 16,821,983 16,937,390 17,072,220 17,342,546 17,274,249 2. commercial 4,524,601 4,542,559 4,560,492 4,575,742 4,590,770 4,639,080 4,567,627
Estimated UV rate 30.4% 31.4% 33.1% 32.8% 30.7% 30.0% average:
MIN / MAX DIFF: 2.3% 2.3% 2.2% 2.2% 2.3% 2.2% 2.3%
B. Estimated percent of unregistered vehicles 1,991 1,992 1,993 1,994 1,995 1,996 1997
INITIAL VALUE: 1. autos 9.4% 8.7% 9.0% 8.6% 8.0% 7.8% 8.6% 2. commercial 14.0% 13.0% 13.5% 12.9% 11.9% 11.7% 12.8%
Estimated UM rate 28.6% 29.9% 31.5% 31.3% 29.2% 28.1%
MINIMIZING VALUES: 1. autos 5.4% 4.7% 5.0% 4.6% 4.0% 3.8% 4.6% 2. commercial 10.0% 9.0% 9.5% 8.9% 7.9% 7.7% 8.8%
Estimated UM rate 25.9% 27.2% 28.9% 28.6% 26.5% 25.3%
MAXIMIZING VALUES: 1. autos 13.4% 12.7% 13.0% 12.6% 12.0% 11.8% 12.6% 2. commercial 18.0% 17.0% 17.5% 16.9% 15.9% 15.7% 16.8%
Estimated UM rate 31.1% 32.4% 33.9% 33.7% 31.7% 30.6% average:
63

MIN / MAX DIFF: 5.2% 5.1% 5.0% 5.0% 5.2% 5.3% 5.2%
C. Estimated percent of commercial vehicles that are not trucks
1,991 1,992 1,993 INITIAL VALUE:
1,994 1,995 1,996 1997 5.6%
Estimated UM rate 28.6% 29.9% 31.5% 31.3% 29.2% 28.1%
MINIMIZING VALUES: 7.6%
Estimated UM rate 29.0% 30.1% 31.7% 31.5% 29.4% 28.7%
MAXIMIZING VALUES: 3.6%
Estimated UM rate
MIN / MAX DIFF:
29.4%
0.5%
30.6%
0.5%
32.2%
0.5%
31.9%
0.5%
29.9%
0.5%
29.2% average:
0.5% 0.5%
D. Estimated percent of vehicles used for business purposes 1,991 1,992 1,993
INITIAL VALUE: 1. autos 2. commercial
1,994 1,995
7.1%33.1%
1,996 1997
Estimated UM rate 28.6% 29.9% 31.5% 31.3% 29.2% 28.1%
MINIMIZING VALUES: 1. autos 2. commercial
10.6%38.1%
Estimated UM rate 26.0% 27.2% 28.9% 28.6% 26.4% 25.7%
MAXIMIZING VALUES: 1. autos 2. commercial
3.6%28.1%
Estimated UM rate
MIN / MAX DIFF:
32.2%
6.2%
33.2%
6.1%
34.8%
5.9%
34.5%
5.9%
32.6%
6.1%
31.9% average:
6.2% 6.1%
F. Estimated percent of under reporting of insurance purchases
1,991 1,992 INITIAL VALUE: 1.7% 1.7%
1,993 1.9%
1,994 1.1%
1,995 2.2%
1,996 0.4%
1997
64

Estimated UM rate 28.6% 29.9% 31.5% 31.3% 29.2% 28.1%
MINIMIZING VALUES: 3.7% 3.7% 3.9% 3.1% 4.2% 2.4%
Estimated UM rate 27.8% 29.0% 30.6% 30.3% 28.3% 27.5%
MAXIMIZING VALUES: 0.0% 0.0% 0.0% 0.0% 0.2% 0.0%
Estimated UM rate 30.4% 31.5% 33.2% 32.4% 31.0% 29.2% average:
MIN / MAX DIFF: 2.6% 2.5% 2.6% 2.1% 2.8% 1.7% 2.4%
Of the five different parameters in the model, the estimated percent of vehicles used for business
purposes and the estimated percent of unregistered vehicles had the largest impact on the
estimated UV rate. The estimated percent of commercial vehicles that are not trucks had the least
impact.
In order to estimate the impact of each parameter two different versions of the initial model were
developed. A set of two models was developed for each of the five parameters, for a total of ten
new models. Each set of two models used one end of the estimated range of the parameter
values. One value of the parameter tended to minimize the estimated UV rate, the other tended to
maximize it. These modified models were applied to the yearly data from 1991 to 1996 with all
the remaining parameters unchanged from their value in the initial model. The difference between
the model that maximized the UV rate and the model that minimized the UV rate was calculated
for each of the six years. These six differences were then averaged. The average differences for
each parameter were as follows:
Table 14 Model Parameter Sensitivity Estimates I
Parameter Average Difference Between Min. & Max. Models
Percent of vehicles used for business 6.1% Percent of unregistered vehicles 5.2% Percent of under reported ins. coverage 2.4% Number of vehicles 2.3% Percent commercial vehicles not trucks 0.5%
65
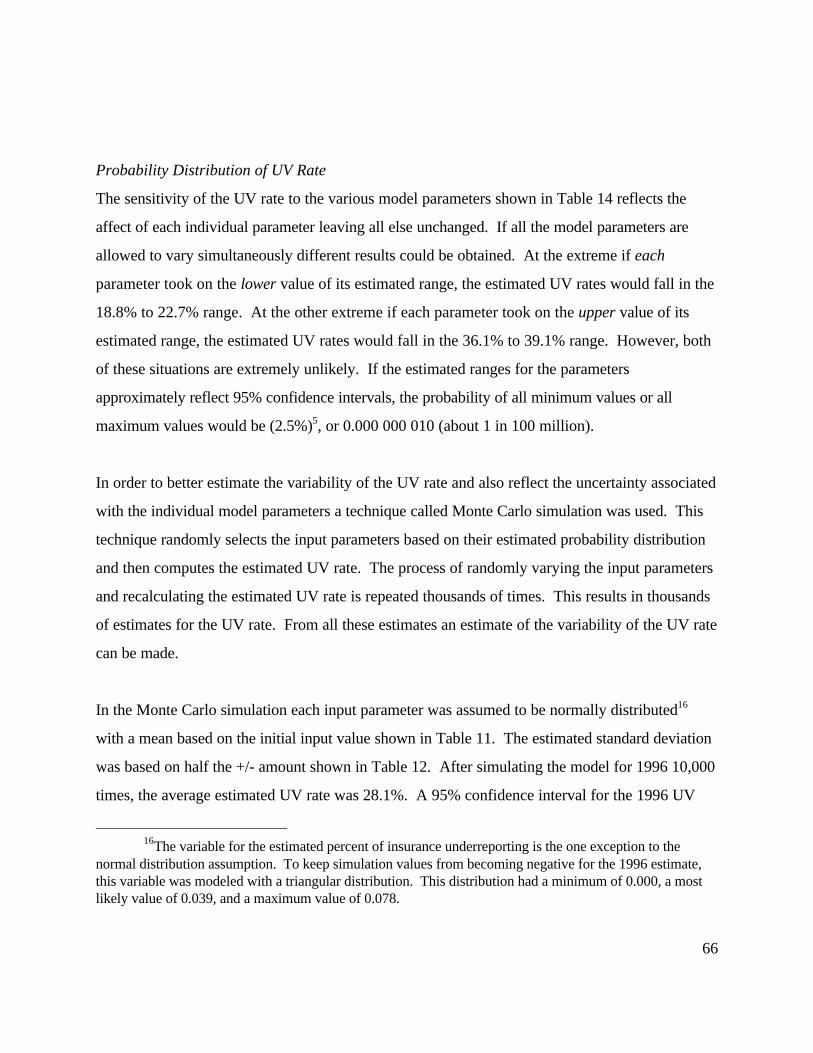
Probability Distribution of UV Rate
The sensitivity of the UV rate to the various model parameters shown in Table 14 reflects the
affect of each individual parameter leaving all else unchanged. If all the model parameters are
allowed to vary simultaneously different results could be obtained. At the extreme if each
parameter took on the lower value of its estimated range, the estimated UV rates would fall in the
18.8% to 22.7% range. At the other extreme if each parameter took on the upper value of its
estimated range, the estimated UV rates would fall in the 36.1% to 39.1% range. However, both
of these situations are extremely unlikely. If the estimated ranges for the parameters
approximately reflect 95% confidence intervals, the probability of all minimum values or all
maximum values would be (2.5%)5, or 0.000 000 010 (about 1 in 100 million).
In order to better estimate the variability of the UV rate and also reflect the uncertainty associated
with the individual model parameters a technique called Monte Carlo simulation was used. This
technique randomly selects the input parameters based on their estimated probability distribution
and then computes the estimated UV rate. The process of randomly varying the input parameters
and recalculating the estimated UV rate is repeated thousands of times. This results in thousands
of estimates for the UV rate. From all these estimates an estimate of the variability of the UV rate
can be made.
In the Monte Carlo simulation each input parameter was assumed to be normally distributed16
with a mean based on the initial input value shown in Table 11. The estimated standard deviation
was based on half the +/- amount shown in Table 12. After simulating the model for 1996 10,000
times, the average estimated UV rate was 28.1%. A 95% confidence interval for the 1996 UV
16The variable for the estimated percent of insurance underreporting is the one exception to the normal distribution assumption. To keep simulation values from becoming negative for the 1996 estimate, this variable was modeled with a triangular distribution. This distribution had a minimum of 0.000, a most likely value of 0.039, and a maximum value of 0.078.
66

rate was 25.5% to 30.9%. The distribution of the UV estimate is shown in Figure 7.
Figure 7 Results of Monte Carlo Simulation Showing Distribution of 1996 UV Rate
21.5
%
22.1
%
22.7
%
23.4
%
24.0
%
24.6
%
25.3
%
25.9
%
26.6
%
27.2
%
27.8
%
28.5
%
29.1
%
29.8
%
30.4
%
31.0
%
31.7
%
32.3
%
33.0
%
33.6
%
34.3
%
Another way of estimating the sensitivity of the UV rate to the model's parameters is to regress
the values of the input parameters against the calculated UV estimates. The data from the 10,000
simulations was used to perform such a regression analysis. In this analysis the parameters were
considered in a slightly different manner. Number of registered vehicles, percent unregistered
vehicles, and percent of vehicles used for business were each subdivided into auto and commercial
parts, creating six parameters from three. The percent of commercial vehicles that were not
trucks and the percent of insurance under reporting were the final two parameters. The
regression coefficients associated with each parameter were as follows:
67

Table 15 Model Parameter Sensitivity Estimates II
Parameter Coefficient
Business use of autos -0.650 Unregistered autos 0.640 Registered autos 0.273 Business use of commercials -0.243 Unregistered commercials 0.117 Non-truck commercials -0.069 Insurance underreporting -0.065 Registered commercials 0.051
As the prior sensitivity analysis that looked at the average difference caused by the lower and
upper range of the parameter, the regression approach found the percent of unregistered vehicles
and the percent used for business to be the most important determents of the estimated UV rate.
Unlike the prior sensitivity analysis, the extent of insurance underreporting received a relatively
low rank. Because the number of autos is so much larger than the number of commercially
registered vehicles, the auto related parameters were measured to be more influential than the
commercial related parameters. All four of the parameters referring to the commercial vehicles
ranked below the parameters referring to autos.
CONCLUSIONS
It is not too surprising to observe in the previous literature on the rate of UV a variety of
divergent estimations even for a specific year. Without an agreed upon standardized method for
developing the estimate the situation could hardly be any different. There is a real difficulty in
obtaining accurate data upon which an estimation of the UV rate can be developed. The varying
UV rates presented by different sources use different data and different methods for producing the
estimated UV rate. Given these differences it is to be expected that the derived UV rates should
differ from each other.
The factors that seem to have the largest influence on the estimated UV rate, the percent of
unregistered vehicle and the percent of vehicles used for business, are also the most poorly
68

measured. As more accurate measurements of these factors are developed, a more precise
measurement of the UV rate will be possible. Using the best data that is currently available it was
estimated that the 1996 UV rate was approximately 28.1%. A 95% confidence interval around
this UV estimate was approximated to range from 25.5% to 30.9%.
Analysts developing estimates of the UV rate need to clearly document the sources of the data
used and the methods used for developing the estimate. Without these detailed information users
of the estimated UV rate cannot adequately assess the accuracy of the estimate. Data evaluated in
this analysis have indicated that variations in a single factor can cause the estimated UV rates to
differ by up to six percentage points.
69

REFERENCES
Aizenberg, Rhonda and Debbie McKenzie, 1997. Teen and Senior Drivers, California Department of Motor Vehicles, Sacramento, California, December.
Bernstein, Robert, 1994. “Modeling Personal Lines Automobile Insurance in California,” Journal of Insurance Regulation, 13: 33-52.
Bernstein, Robert, 1999 California Uninsured Vehicles as of June 1, 1997, California Department of Insurance, Sacramento, February.
California Department of Insurance, 1995. Commissioner’s Report on Undeserved Communities, Los Angeles, California, February.
California Department of Insurance, 1998. California’s Uninsured (Preliminary Report), Sacramento, California, September.
California Department of Justice, 1999. Crime & Delinquency in California, 1997, Sacramento, California.
California Department of Justice, 1999. Report on Arrests for Driving Under the Influence in California, 1997, Sacramento, California.
California Highway Patrol, 1997. 1996 Annual Report of Fatal and Injury Motor Vehicle Traffic Collisions, Sacramento, California.
De Young, David J., Raymond C. Peck, and Clifford J. Helander, 1997. “Estimating the Exposure and Fatal Crash Rates of Suspended/Revoked and Unlicensed Drivers in California,” Accident Analysis and Prevention, 29: 17-23.
Hunstad, Lyn, Robert Bernstein, Jerry Turem, 1994. Impact Analysis of Weighting Auto Rating Factors to Comply with Proposition 103, California Department of Insurance, Sacramento, California, December.
Hunstad, Lyn, 1995 “Measuring and Modifying the Effect of Auto Rating Factors,” Journal of Insurance Regulation, 14: 159-187.
Hunstad, Lyn, 1999. "Estimating the Uninsured Vehicle Rate from the Uninsured Motorist/ Bodily Injury Ratio," NAIC Research Quarterly, 5:1-7, January.
Hunstad, Lyn, 1999. Characteristics of Uninsured Motorists, California Department of Insurance,
70

Sacramento, February.
Independent Insurance Agents of America, 1998. Consumers & Auto Insurance, Alexandria, Virginia, May.
Insurance Research Council (formerly All-Industry Research Advisory Council), 1989. Uninsured Motorist, Insurance Research Council, Wheaton, Illinois, October.
Insurance Research Council, 1992. Public Attitude Monitor 1992, Insurance Research Council, Wheaton, Illinois, December.
Insurance Research Council, 1995. Public Attitude Monitor 1995, Insurance Research Council, Wheaton, Illinois, November.
Insurance Research Council, 1996. Fraud and Buildup in Auto Injury Claim, Insurance Research Council, Wheaton, Illinois, September.
Khazzoom, J. Daniel, 1997. What We Know about Uninsured Motorists and How Well We Know What We Know, Discussion Paper 98-09, Resources for the Future, Washington, DC, December
Marowitz, Len, 1990. Uninsured Motorists (SB850) Study: An Analysis of the Effects of Economic Covariate Factors and the Intervention of SB850 on the Rate of Uninsured Motorists in California from 1978 to 1988, California Department of Motor Vehicles, Sacramento, California, May.
Marowitz, Len, 1991. Uninsured Motorists (SB850) Study: Status Report (updated), California Department of Motor Vehicles, Sacramento, California, September.
Marowitz, Len, 1991. Uninsured Motorists: Their Rate and Cost to Insured Motorists, California Department of Motor Vehicles, Sacramento, California, December.
Miller, Dan, 1998. Auto Choice: Impact on Cities and the Poor, United States Congress: Joint Economic Committee, Washington, DC, March.
Parker, Guila, 1997. Consumer Attitudes on Proposition 213 and Other Uninsured Motorist Sanctions, presented at the No Pay-No Play: Addressing the Uninsured Motorist Issue Conference, San Diego, California, December.
Pritchard, Tim and Larry DeBoer, 1995. “The Effect of Taxes and Insurance Costs on Automobile Registrations in the United States,” Public Finance Quarterly, 23: 283-304, July.
71

Shelton, Terry S. T., 1995. Revised Vehicle Miles of Travel for Passenger Cars and Light Trucks, 1975 to 1993, U.S. Department of Transportation, National Highway Traffic Safety Administration, National Center for Statistics and Analysis, Washington, D.C., September.
D:\UNINSURE\UNINS_RT\DOC\EST_UM_R.DOC: 7 -7-99
72

Attachment A
CHP Citation Data
73


CHP Citation Data
This attachment contains a summary of citation data from the California Highway Patrol (CHP).
The tables and graphs included are primarily based on an analysis of data files of citation records
obtained from the CHP. The data files contained records for all citations that involved an
uninsured (CVC 16020a or 16028a), unregistered (CVC 4000a), or a hit-and-run (CVC 20001a
or 20002a) violation. These data only reflect citations issued by the CHP. Data on the total
number of all types of citations and the total number of accident related citations were obtained
from the CHP's Information Services Unit.
Table A-1 summarizes the raw data counts. Table A-2 expresses much of the same data found in
Table A-1, but in percentages. Table A-3 shows the actual number of person years of patrol
related positions that were “in the field” (i.e., not assigned to headquarters, training, or some
other non-enforcement function). These data were obtained to explore the relationship between
the number of officers in the field and the number of citations issued. Figure A-1 shows the
number of citations and the number of officers. There seems to be a lag of one or more years
between a change in staffing levels and the resulting change in the total number of citations. If
this is an accurate description, there should be a sizable increase in the number of citations issued
in 1998. Figure A-2 shows the percent of citations for unregistered vehicle and the number of
officers in the field. There appears to be little relationship between staffing levels and the percent
of citations for unregistered vehicle.
75

Table A-1 CHP Citation Data
(Counts)
Year
Total All Types Citations
Total Uninsured
Citations
Total Unregistered
Citations
Uninsured no Unregistered
Total Hit & Run Citations
yes Unregistered
1988 1989 1990 1991 1992 1993 1994 1995 1996 1997
2,975,659 3,164,693 3,192,508 3,036,017 2,821,204 2,812,810 2,580,566 2,362,706 2,224,055 2,275,812
644,643 304,329 449,360
303 124 308 280 184 190
316,315
391,380 197,940 319,040 296,289 255,968 242,611 291,442 247,870 264,903 277,239
3,743 2,878 4,396 4,040 4,632 3,896 3,578 3,236 3,070 2,953
Uninsured no Unregistered
Total Total Total Total no All Types Uninsured Unregistered Accident Related Accident Related
Year Citations Citations Citations Citations no yes 0 1
88 2,975,659 644,643 391,380 78,601 614 2,376 89 3,164,693 304,329 197,940 73,002 603 1,757 90 3,192,508 449,360 319,040 67,831 956 2,698 91 3,036,017 303 296,289 30,618 1,445 2,240 92 2,821,204 124 255,968 42,583 1,684 2,538 93 2,812,810 308 242,611 41,802 1,405 2,185 94 2,580,566 280 291,442 39,741 1,319 2,006 95 2,362,706 184 247,870 42,101 1,115 1,959 96 2,224,055 190 264,903 37,665 1,165 1,772 97 2,275,812 316,315 277,239 27,806 1,089 1,434
no yes no yes Hit & Run
no yes Hit & Run
no yes Hit & Run
no yes 1 0 1
502 326 383
7 1 2 3 3 2
295
Hit & Run no 1 1 0
160,396 68,727
103,249 76 12 22 28 16 13
72,346
yes 1 1 1
46 24 46
1
17
0
n.a. n.a. n.a. n.a. n.a. n.a. n.a. n.a. n.a. n.a.
1
2,990 2,360 3,654 3,685 4,222 3,590 3,325 3,074 2,937 2,523
230,129,215,295,255,242,291,247,264,204,
1 0
733 021 432 865 547 285 164 695 759 758
1 1
205 168 313 348 409 303 250 159 131 118
1 0 0
483,699 235,252 345,682
220 111 283 249 165 175
243,657
yes Accident Related
no yes 1 0 1 1
229,983 955 128,499 690 214,813 932 295,494 719 255,189 767 241,792 796 290,605 809 246,998 856 264,225 665 204,523 353
yes Unregistered no Accident Related
no yes 1 0 0 1 0 1
451,977 32,224 217,739 17,839 320,776 25,289
166 61 56 56
153 132 149 103
72 96 93 84
233,143 10,809
yes Accident Related
no yes 1 1 0 1 1 1
156,693 3,749 66,888 1,863
100,345 2,950 65 11 5 7
18 5 22 6 8 8 7 6
71,549 814
76

Table A-2 CHP Citation Data: Percentages
Uninsured Unregistered Uninsured Unregistered given given given given
Year Uninsured Unregistered Hit & Run Unregistered Uninsured Hit & Run Hit & Run
1988 21.7% 13.2% 0.1% 41.0% 24.9% 14.6% 6.7% 1989 9.6% 6.3% 0.1% 34.7% 22.6% 12.2% 6.7% 1990 14.1% 10.0% 0.1% 32.4% 23.0% 9.8% 8.2% 1991 0.0% 9.8% 0.1% 0.0% 25.1% 0.2% 8.6% 1992 0.0% 9.1% 0.2% 0.0% 9.7% 0.0% 8.8% 1993 0.0% 8.6% 0.1% 0.0% 7.5% 0.1% 7.8% 1994 0.0% 11.3% 0.1% 0.0% 10.0% 0.1% 7.0% 1995 0.0% 10.5% 0.1% 0.0% 8.7% 0.1% 4.9% 1996 0.0% 11.9% 0.1% 0.0% 6.8% 0.1% 4.3% 1997 13.9% 12.2% 0.1% 26.1% 22.9% 10.6% 4.6%
Uninsured Unregistered Uninsured Unregistered given given given given
Year Uninsured Unregistered Accident Related Unregistered Uninsured Accident Related Accident Related
1988 21.7% 13.2% 2.6% 41.0% 24.9% 45.8% 6.0% 1989 9.6% 6.3% 2.3% 34.7% 22.6% 27.0% 3.5% 1990 14.1% 10.0% 2.1% 32.4% 23.0% 41.6% 5.7% 1991 0.0% 9.8% 1.0% 0.0% 25.1% 0.2% 2.4% 1992 0.0% 9.1% 1.5% 0.0% 9.7% 0.1% 1.8% 1993 0.0% 8.6% 1.5% 0.0% 7.5% 0.3% 1.9% 1994 0.0% 11.3% 1.5% 0.0% 10.0% 0.3% 2.1% 1995 0.0% 10.5% 1.8% 0.0% 8.7% 0.2% 2.1% 1996 0.0% 11.9% 1.7% 0.0% 6.8% 0.2% 1.8% 1997 13.9% 12.2% 1.2% 26.1% 22.9% 41.8% 4.2%
77

Table A-3 Number of CHP Traffic Officers in the Field by Year
Year Positions Index 1988 4,722 1.00 1989 4,897 1.04 finished up adding "Governor’s 500" 1990 5,101 1.08 1991 5,175 1.10 1992 5,062 1.07 academy shut down 1993 4,877 1.03 1994 4,685 0.99 1995 4,800 1.02 1996 5,076 1.07 1997 5,308 1.12 1998 5,210 1.10
78

...
♦ .
- .■ . . .
• ' '
'■·
♦•
. ♦
Figure A-1
CHP: Number of Citations vs. Number of Officers
2,000,000
2,200,000
2,400,000
2,600,000
2,800,000
3,000,000
3,200,000
4,500
4,600
4,700
4,800
4,900
5,000
5,100
5,200
5,300
5,400
citations
officers
1988 1989 1990 1991 1992 1993 1994 1995 1996 1997 79

Figure A-2
CHP Citations for Unregistered Vehicle as a Percent of Total Citations and Number of Officers in the Field
14.0%
12.0%
10.0%
8.0%
6.0%
4.0%
2.0%
0.0%
% of citations for unregistered
# of officers
5,400
5,300
5,200
5,100
5,000
4,900
4,800
4,700
4,600
4,500
4,400
4,300
1988 1989 1990 1991 1992 1993 1994 1995 1996 1997 80

81