
Estimating the Undiagnosed Fraction: Jeanette Birnbaum 10/7/2014SPRC PHC1 presenting on behalf of...
23
Estimating the Undiagnosed Fraction: Jeanette Birnbaum 10/7/2014 SPRC PHC 1 presenting on behalf of Martina Morris, Ian Fellows and Matt Golden Disseminating the “Testing History” Method
-
Upload
wilfrid-bridges -
Category
Documents
-
view
213 -
download
0
Transcript of Estimating the Undiagnosed Fraction: Jeanette Birnbaum 10/7/2014SPRC PHC1 presenting on behalf of...
SPRC PHC 1
Estimating the Undiagnosed Fraction:
Jeanette Birnbaum
10/7/2014
presenting on behalf ofMartina Morris, Ian Fellows and Matt Golden
Disseminating the “Testing History” Method
SPRC PHC 2
Overview
10/7/2014
• Summary and assumptions• KC & WA state analyses
The Method
• Prototype “Rshiny” web app
Dissemination
• Refining the method• Working with stakeholders
Your Feedback

SPRC PHC 3
The Testing History Method
10/7/2014

SPRC PHC 4
Approach: Backcalculation
• New diagnoses today…• …are based on infections that occurred in the
past
10/7/2014
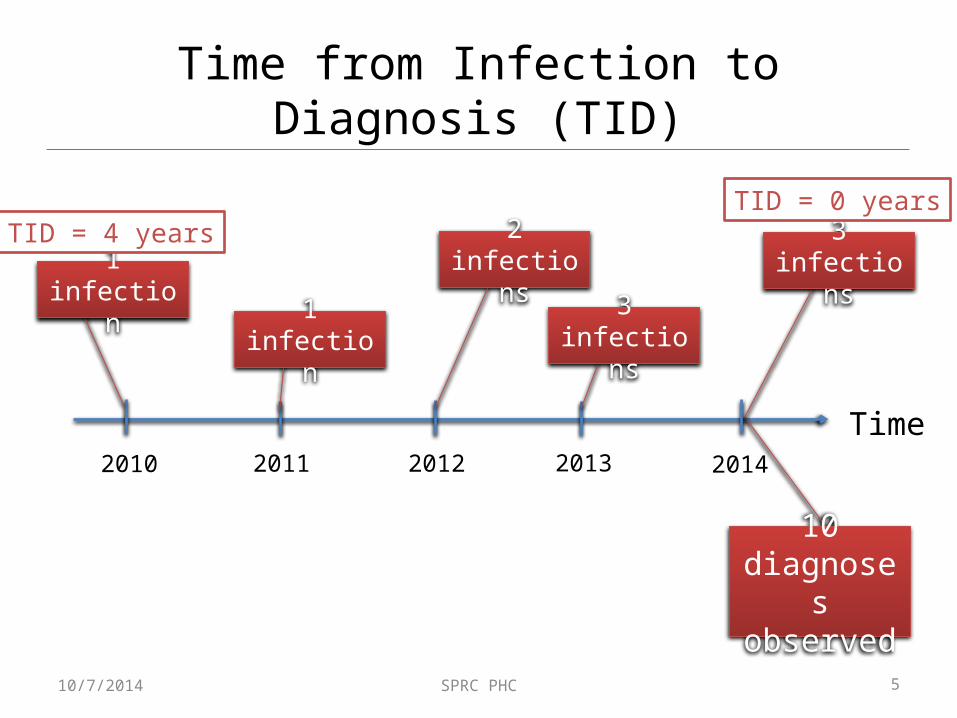
Time
10 diagnoses observed
2010 2011 2012 2013 2014
1 infection
1 infection
2 infections
3 infections
3 infections
SPRC PHC 5
Time
10 diagnoses observed
2010 2011 2012 2013 2014
1 infection
1 infection
2 infections
3 infections
3 infections
Time from Infection to Diagnosis (TID)
10/7/2014
TID = 4 yearsTID = 0 years

SPRC PHC 6
Backcalculation’s 3 Components
10/7/2014
Sum of ( *
)
Cases diagnosed at T
Incidence at X yrs ago
TID probability for X yrs ago
=OBSERVED
NEED AN ESTIMATE
BACKCALCULATE

SPRC PHC 7
TID from Testing History
“Have you ever had a
last negative test?”
Yes Use date provided
No Assign age 16 or age-18 years
Missing 2 data inclusion options
10/7/2014
Infection window = [Date of last negative test -> Date of diagnosis]
1) Get date of last negative test
2) Determine time of infection within the infection window

SPRC PHC 8
Impact of TID Assumptions on TID
10/7/2014
UNIFORM
# infections
Last neg test Diagnosis
AT LAST NEG TEST
# infections
Last neg test Diagnosis
OBSERVED ONLY
Density of last negative tests
18 years0 years
18 years
% undiagnosed“BASE CASE”
18 years
% undiagnosed“WORST CASE (OBS)”

SPRC PHC 910/7/2014
INCLUDING MISSINGDensity of last negative tests
18 years0 years
AT LAST NEG TEST
# infections
Last neg test Diagnosis 18 years
% undiagnosed
“WORST CASE (MISS)”
UNIFORM# infections
Last neg test Diagnosis
AT LAST NEG TEST# infections
Last neg test Diagnosis
OBSERVED ONLY
18 years
% undiagnosed
18 years
% undiagnosed
“BASE CASE”
“WORST CASE (OBS)”
Density of last negative tests
18 years0 years

SPRC PHC 10
Applications to KC and WA State
10/7/2014

Morris/Fellows/Golden SPRC PHC 11
KC MSM: Incidence ~ Constant
11/4/2013
15% missing testing history

SPRC PHC 12
KC MSM: Undiagnosed Varies by Race
10/7/2014
SPRC PHC 13
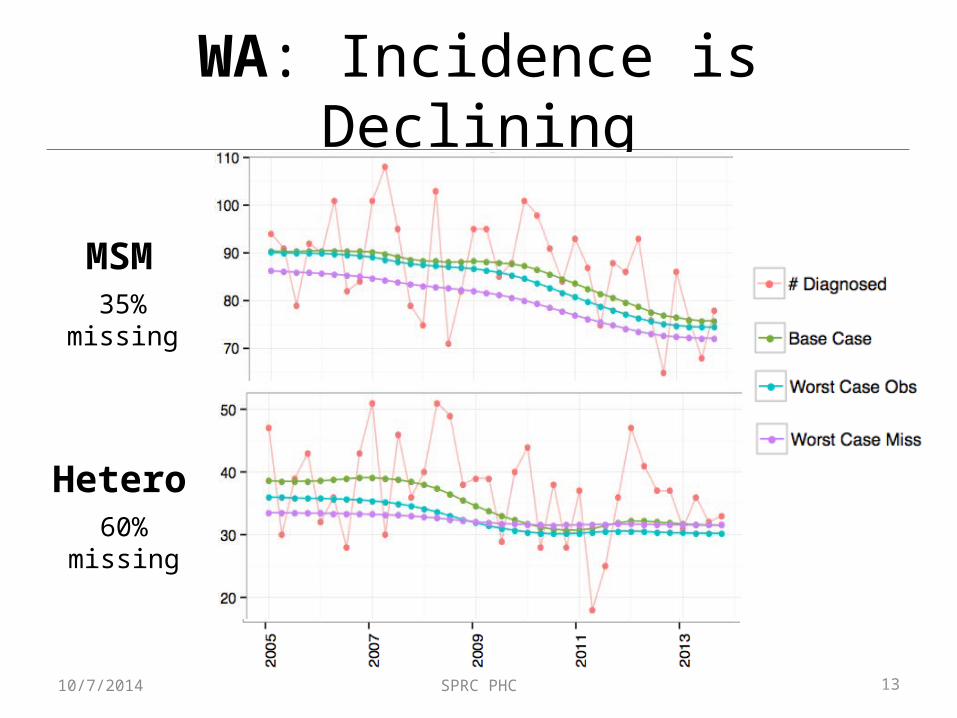
WA: Incidence is Declining
10/7/2014
MSM
Hetero
35% missing
60% missing

SPRC PHC10/7/2014 14
White40%
missing
Black49%
missing
Hispanic48%
missing

SPRC PHC 15
WA: Undiagnosed Counts by Group
10/7/2014
Hetero vs MSM Race
SPRC PHC 16
Dissemination to Public Health Departments
10/7/2014
SPRC PHC 17
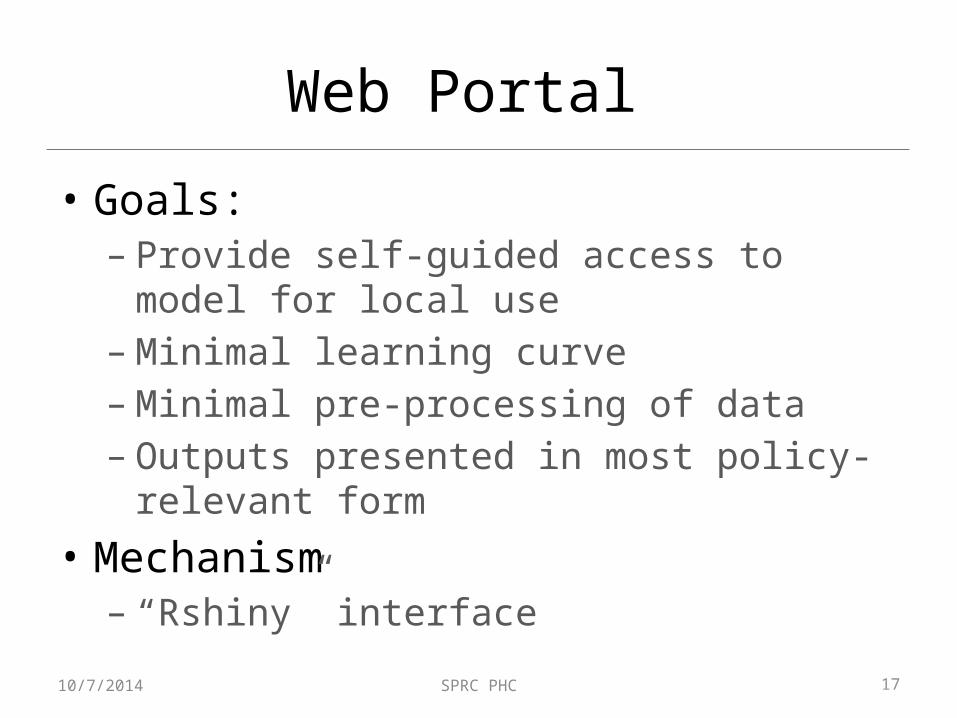
Web Portal
• Goals:– Provide self-guided access to model for local use– Minimal learning curve– Minimal pre-processing of data– Outputs presented in most policy-relevant form
• Mechanism– “Rshiny” interface
10/7/2014
SPRC PHC 18
Protoype Rshiny App
https://hivbackcalc.shinyapps.io/HIVBackCalc_App/
10/7/2014

SPRC PHC 19
Your Feedback
10/7/2014
SPRC PHC 20
Issues
• Data privacy requirements– Local, protected upload, unprotected upload
• Detail in outputs– Race, mode, sex subgroup results?– Impact of missing data (suggestions for better
assumptions?)• Training for users
10/7/2014

SPRC PHC 21
Thank you!
10/7/2014

SPRC PHC 22
Impact of TID Assumptions
10/7/2014
DATA INCLUSION TIME OF INFECTION TID DISTRIBUTION
2310/7/2014 SPRC PHC
DATA INCLUSION TIME OF INFECTION TID DISTRIBUTION


