
Winrock International 2012 Global Projects & Financial Statement
Upload
myles-nortonCategory
view
217download
1
Estimating the potential carbon supply from changes in land use: afforestation of grazing lands in the US as a case study
Sandra BrownWinrock International
Third USDA Symposium onGreenhouse Gases & C Sequestration in
Agriculture and ForestryBaltimore, March 2005

2©Winrock International 2004
A key question …..
What amount of carbon is available and where from changing land use and management practices at what price?• Goes beyond just technical potential—
also includes economic potential

3©Winrock International 2004
AcknowledgementsWinrock Team:
Timothy PearsonDavid ShochBrent SohngenJohn KadyszewskiJonathan Winsten
California Dept. Forestry:Mark RosenbergDoug Wickizer
SupportAmerican Electric PowerOgelthorpeCA Energy Commission/PIERElectric Power Research InstituteUS DOE

4©Winrock International 2004
Overall Methodology
Identify and locate land classes suitable for increasing carbon stocks
Estimate rates of carbon accumulation for each major potential class of project activity for each land class
Assign costs to each contributing cost factor
Estimate carbon supply

5©Winrock International 2004
Regional analyses of carbon supply
•California-WESTCARB partnership•Southern region-SSEB partnership
Details of analyses are in reports atwww.winrock.org/what/ecosystem_pubs.cfm

California-WESTCARB Afforestation of rangelands

7©Winrock International 2004
Identify and locate land suitable for increasing carbon stocks
• Determine which rangelands could support forests—suitability analysis• Land-use suitability
analysis based on • Biophysical factor-
dependent suitability for forest habitats

8©Winrock International 2004
Identify rangelands suitable for conversion to forests
Analyze the relationship between existing forests and several biophysical factors using GEOMOD =“suitability for forest map”
Cross-reference suitability map to areas of current rangelands to select areas with afforestation potential. Product = map of rangeland areas suitable to support forests

9©Winrock International 2004
Inputs toGEOMODConverted to forest probability maps based on existing extent in each class
Prepare factor maps
Mean annual temperature
Slope

10©Winrock International 2004
0
200,000
400,000
600,000
800,000
1,000,000
1,200,000
1,400,000
0 2 4 6 8 10
12
14
16
18
20
22
24
26
28
30
32
34
36
38
40
42
44
46
48
50
52
54
56
58
60
62
64
66
FOREST SUITABILITY SCORE
NU
MB
ER
OF
CE
LL
S (
HE
CT
AR
ES
)
FOREST
RANGELANDS
Overlap of rangeland classes in areas that have the same biophysical characteristics as current forests ~ 9.3 million ha
Area of existing rangelands suitable for forest growth
Montane chaparral

11©Winrock International 2004
Map of populated places, montane chaparral areas, and selected populated places with names that refer to forests or forestry—e.g. Pine Grove, Pine Valley, Pinehurst, Redwoods, Sequoia, Seven Oaks, Sherwood Forest, Stallion Oaks, Sugarpine, Tall
Timber Camp

12©Winrock International 2004
Map of rangeland areas (in yellow) suitable for afforestation •Represent about 9.3 million ha or 23% of State area
Areas where forest crown cover high, suggesting not suitable
13©Winrock International 2004
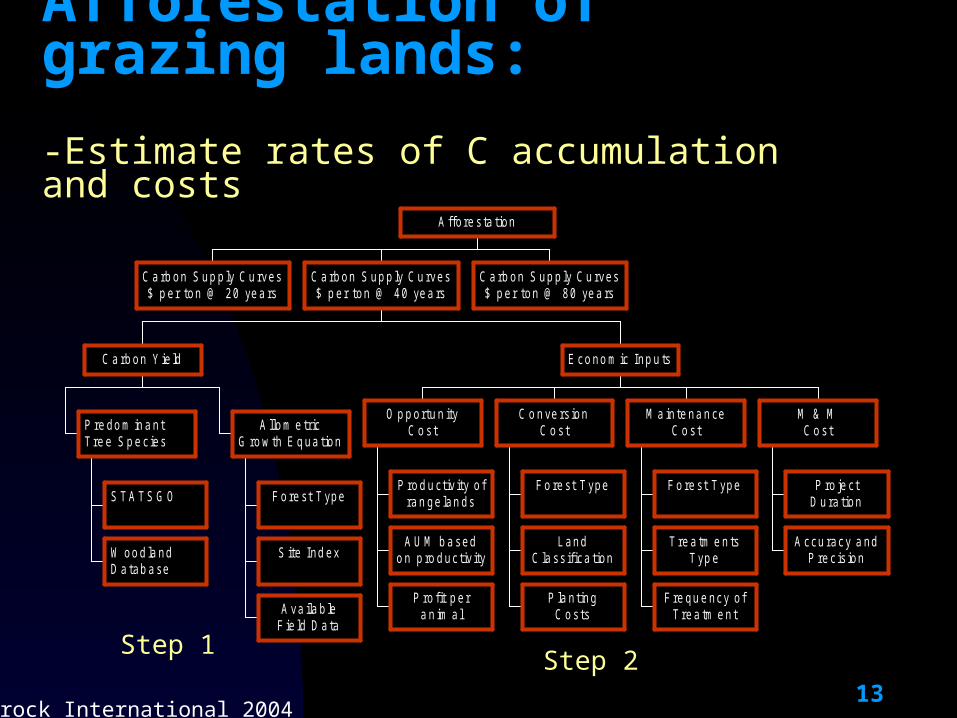
Afforestation of grazing lands:
-Estimate rates of C accumulation and costs
C a rb on S up p ly C u rves$ p er ton @ 20 ye a rs
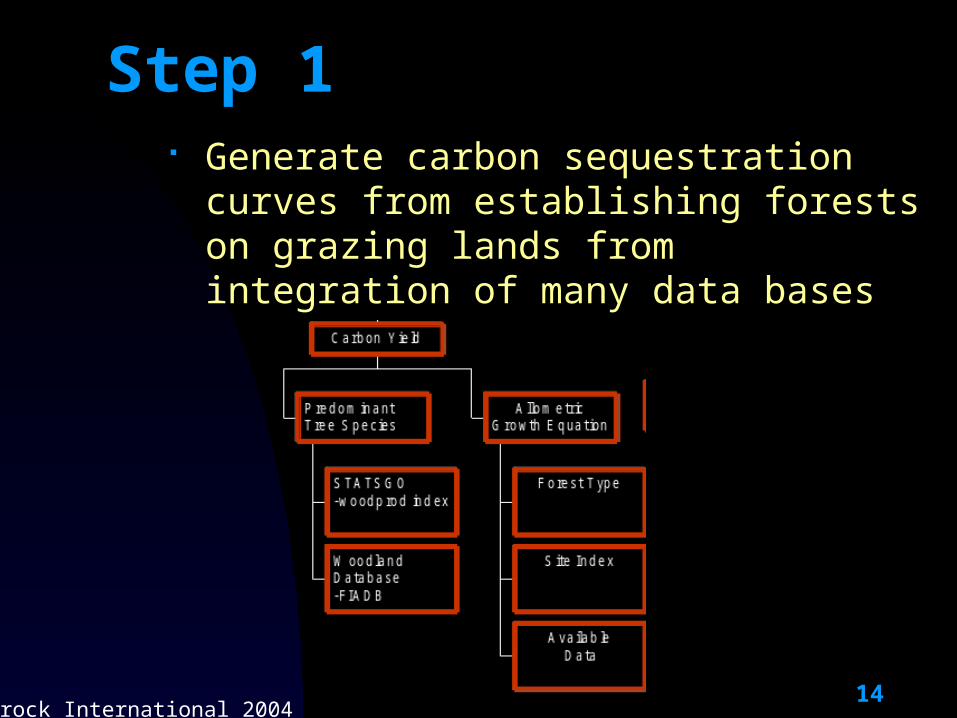
S T A T S G O
W oo d la ndD a tab a se
P re do m in a n tT re e S p e c ies
F o re st T ype
S ite Ind ex
A va ila b leF ie ld D a ta
A llo m e tricG ro w th E q ua tion
C a rb on Y ie ld
P ro d u ctiv ity o fra n ge lan ds
A U M b a sedo n p ro d uc tiv ity
P ro fit p era n im a l
O p p ortu n ityC o s t
F o re st T ype
L andC la ss if ica tion
P la n tingC o s ts
C o n ve rs ionC o s t
F o re st T ype
T re a tm e n tsT yp e
F re qu e ncy o fT re a tm e nt
M a in te na n ceC o s t
P ro je ctD u ra tion
A ccu racy a ndP re c is ion
M & MC o s t
E co no m ic Inp u ts
C a rb on S up p ly C u rves$ p er ton @ 40 ye a rs
C a rb on S up p ly C u rves$ p er ton @ 80 ye a rs
A ffo re s ta tion
Step 1Step 2
14©Winrock International 2004
Step 1 Generate carbon sequestration curves
from establishing forests on grazing lands from integration of many data bases

15©Winrock International 2004
Potential carbon accumulation in conifer and hardwood forests (no harvest)
0
50
100
150
200
250
300
0 20 40 60 80
years since initiation
t C
/ha
redwood
red fir
ponderosa pine
lodgepole pine
pinyon-juniper
0
20
40
60
80
100
120
140
160
180
200
0 20 40 60 80years since initiation
t C
/ha
aspen
m ontane riparian hardwoods
blue oak woodland
valley foothill riparian
Select species for afforestation based on incidence of existing forests with same suitability score/bioregion

16©Winrock International 2004
Net carbon accumulation applied to potential woody-species distributions over three time periods

17©Winrock International 2004
Step 2 Economic analyses

18©Winrock International 2004
Cost of carbon sequestration Opportunity costs:
• Using the same biophysical factors, a multivariate model was used to extrapolate STATSGO forage productivity data samples to a state-wide coverage.Product = map forage production
• Economic analysis of forage value derived from national databases and field interviews
• Mean annual profit/cow ($68/cow)• Number of cows supported based strongly on forage
production (1 animal unit month for CA = 791 lbs)• Net present value analysis of total costs using 4%
discount rateProduct = map total cost

19©Winrock International 2004
Estimated forage productivity across rangeland classes
This map used to estimate number of cows per acre based on AUM and opportunity cost based on profitability per cow
lbs per acre per year

Combine quantities of carbon accumulation with
cost data to generate C supply in $/t C

21©Winrock International 2004
Cost of carbon sequestration through afforestation of California rangelands

22©Winrock International 2004
Carbon supply curves for afforestation activities for 20, 40 and 80 years
94 million tC 823 million tC 1,501 million tC
0
10
20
30
40
50
60
70
80
90
100
110
0 200 400 600 800 1,000 1,200 1,400 1,600 1,800
Millionscumulative tC available
Un
it c
arb
on
co
st (
$ /
tC)
20 years
40 years
80 years
23©Winrock International 2004
Take home messages
Depending on the price, afforestation of grazing lands can provide substantial quantity of carbon offsets in the US• Little to no new technology needed, can be adopted
quickly, and provide other environmental benefits Protocols and registries for implementing
carbon sequestration activities in advanced state (e.g. CCAR) and markets developing
Incentive for adoption likely to be driven by states rather than feds


