Estimating the Deterrent Effect of Incarceration using ... the Deterrent Effect of Incarceration...
44
Estimating the Deterrent Effect of Incarceration using Sentencing Enhancements David S. Abrams * University of Pennsylvania December, 2011 Abstract Increasing criminal sanctions may reduce crime through two primary mechanisms: deterrence and incapacitation. Disentangling their effects is crucial, since each mechanism has different implications for optimal policy setting. I use the introduction of state add-on gun laws, which enhance sentences for defendants possessing a firearm during the commission of a felony, to isolate the deterrent effect of incarceration. Defendants subject to add-ons would be incarcerated in the absence of the law change, so any short-term impact on crime can be attributed solely to deterrence. Using cross-state variation in the timing of law passage dates, I find that the average add-on gun law results in a roughly 5 percent decline in gun robberies within the first three years. This result is robust to a number of specification tests and does not appear to be associated with large spillovers to other types of crime. JEL Classifications: J24, K14, K42 * The author would like to thank Liz Ananat, Jessica Cohen, Claudia Goldin, Michael Greenstone, Justin McCrary, Guy Michaels, Sendhil Mullainathan, Sarah Siegel, Jeffrey Smith, Catherine Thomas, and participants of the MIT Labor Lunch, University of Maryland Criminology and Economics Workshop, University of Chicago Applied Microeconomics Lunch, University of Chicago Crime and Punishment Workshop, and Harvard Law & Economics Seminar for very helpful comments. Trevor Gallen and Jon Gillam provided excellent research assistance. The author’s email is [email protected].
-
Upload
nguyentruc -
Category
Documents
-
view
219 -
download
1
Transcript of Estimating the Deterrent Effect of Incarceration using ... the Deterrent Effect of Incarceration...

Estimating the Deterrent Effect of Incarceration using Sentencing Enhancements
David S. Abrams*
University of Pennsylvania
December, 2011
Abstract
Increasing criminal sanctions may reduce crime through two primary mechanisms: deterrence and incapacitation. Disentangling their effects is crucial, since each mechanism has different implications for optimal policy setting. I use the introduction of state add-on gun laws, which enhance sentences for defendants possessing a firearm during the commission of a felony, to isolate the deterrent effect of incarceration. Defendants subject to add-ons would be incarcerated in the absence of the law change, so any short-term impact on crime can be attributed solely to deterrence. Using cross-state variation in the timing of law passage dates, I find that the average add-on gun law results in a roughly 5 percent decline in gun robberies within the first three years. This result is robust to a number of specification tests and does not appear to be associated with large spillovers to other types of crime. JEL Classifications: J24, K14, K42
*The author would like to thank Liz Ananat, Jessica Cohen, Claudia Goldin, Michael Greenstone, Justin McCrary, Guy Michaels, Sendhil Mullainathan, Sarah Siegel, Jeffrey Smith, Catherine Thomas, and participants of the MIT Labor Lunch, University of Maryland Criminology and Economics Workshop, University of Chicago Applied Microeconomics Lunch, University of Chicago Crime and Punishment Workshop, and Harvard Law & Economics Seminar for very helpful comments. Trevor Gallen and Jon Gillam provided excellent research assistance. The author’s email is [email protected].
1
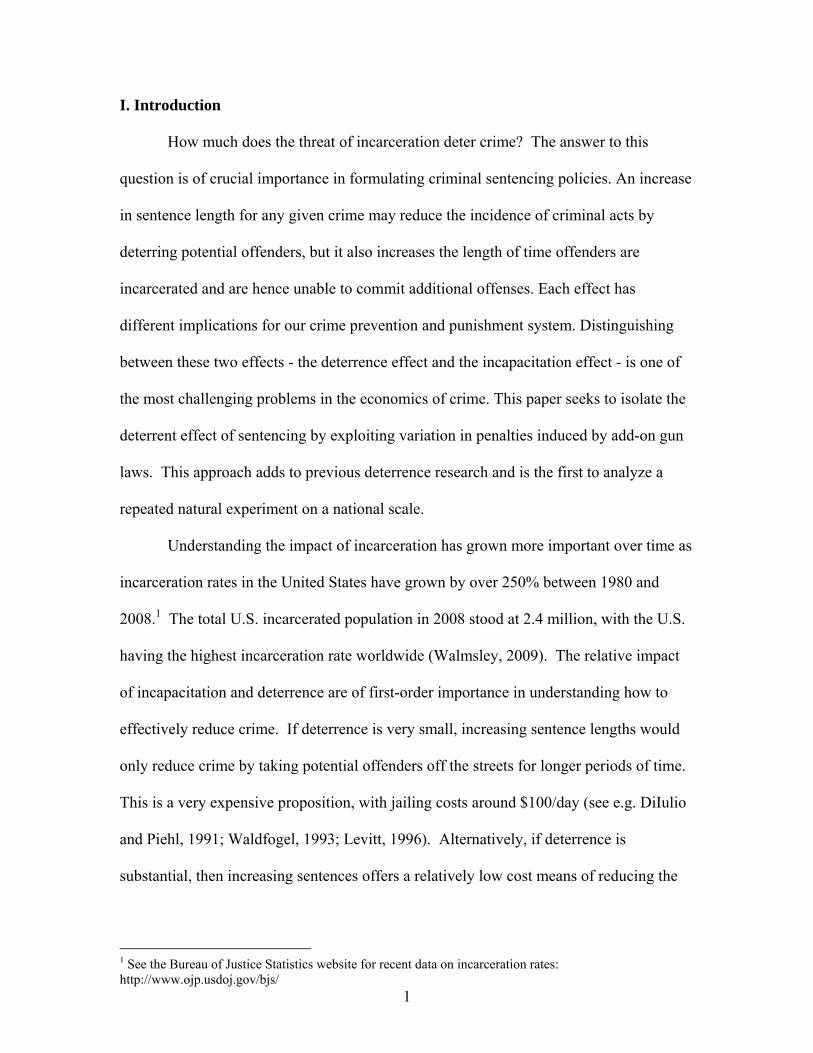
I. Introduction
How much does the threat of incarceration deter crime? The answer to this
question is of crucial importance in formulating criminal sentencing policies. An increase
in sentence length for any given crime may reduce the incidence of criminal acts by
deterring potential offenders, but it also increases the length of time offenders are
incarcerated and are hence unable to commit additional offenses. Each effect has
different implications for our crime prevention and punishment system. Distinguishing
between these two effects - the deterrence effect and the incapacitation effect - is one of
the most challenging problems in the economics of crime. This paper seeks to isolate the
deterrent effect of sentencing by exploiting variation in penalties induced by add-on gun
laws. This approach adds to previous deterrence research and is the first to analyze a
repeated natural experiment on a national scale.
Understanding the impact of incarceration has grown more important over time as
incarceration rates in the United States have grown by over 250% between 1980 and
2008.1 The total U.S. incarcerated population in 2008 stood at 2.4 million, with the U.S.
having the highest incarceration rate worldwide (Walmsley, 2009). The relative impact
of incapacitation and deterrence are of first-order importance in understanding how to
effectively reduce crime. If deterrence is very small, increasing sentence lengths would
only reduce crime by taking potential offenders off the streets for longer periods of time.
This is a very expensive proposition, with jailing costs around $100/day (see e.g. DiIulio
and Piehl, 1991; Waldfogel, 1993; Levitt, 1996). Alternatively, if deterrence is
substantial, then increasing sentences offers a relatively low cost means of reducing the
1 See the Bureau of Justice Statistics website for recent data on incarceration rates: http://www.ojp.usdoj.gov/bjs/

2
incidence of crime. This offers the possibility of reducing crime without bearing the cost
of enforcing the penalties, something particularly appealing in a time of tight budgets.
The aim of this paper is to empirically estimate the magnitude of deterrence more
precisely than has previously been possible by using add-on gun laws. Add-on gun laws
stipulate sentence enhancements for defendants convicted of possessing of a firearm
while committing a crime. This type of law grew popular in the United States in the
1970s and 80s, with 30 states adopting one of these laws by 1996 (Vernick and Hepburn,
2003). Add-on gun laws provide a unique set of natural experiments that can be used to
distinguish the deterrent effect of incarceration from the incapacitative effect. The key to
the approach in this paper is the fact that add-on laws apply only to defendants who would
otherwise receive sentences of incarceration. Thus the short-term impact of an add-on
gun law should be purely deterrent.
The use of the short-term impact of a sentencing enhancement to separate
deterrence from incapacitation was pioneered by Kessler and Levitt (1999). They used
the passage of Proposition 8 in California in 1982 as a natural experiment that enhanced
sentences for certain time of crimes (and offenders) and not others. Using a difference-
in-difference and triple difference approach, they found evidence for a modest, but
significant deterrent effect of 8% within 3 years of the law change. Owens (2009)
examines the effect of a Maryland law change that reduces the adult sentences of some
former juvenile delinquents. Unlike Kessler and Levitt, she uses the law change to
estimate the incapacitation effect, which she finds to be substantially smaller than most
previous estimates. Other recent papers use sentencing enhancements and
disenhancements as well. Helland and Tabarrok (2007) investigate the effects of
California’s three strikes law and find a decrease in arrests of around 20% among felons

3
with two strikes. Drago, Galbiati, and Vertova (2009) use a natural experiment in Italy
that induced individual-level variation in sentencing to estimate a deterrence effect.
Marvell and Moody (1995) estimate the combined effect of deterrence and incapacitation
due to firearm sentencing enhancements, using time series variation.
The strategy in this paper for estimating the impact of increased sentence length
follows similar lines to some of the aforementioned studies, but makes several advances.
Unlike previous studies that focus on an individual state, the fact that add-on gun laws
were passed in a majority of states allows for more easily generalizable results of the
analysis. The sample in this study is extremely representative of the country as a whole,
since most states passed an add-on gun law at some point in the period investigated. It
also uses a time series almost 40 years long, which lends strength to the belief that the
findings are not location and time specific.
The substantial previous literature on deterrence has come to mixed conclusions.2
Part of this may be due to the fact that there are well-known data errors in the most
2There is an extensive literature empirically testing various aspects of economic models of crime going back decades to Ehrlich’s work on the death penalty (Ehrlich 1973, 1975, 1981). A full review of the literature on deterrence has been the subject of a number of review articles, with mixed conclusions. Nagin (1998) finds evidence for an overall deterrent effect in the criminal justice system, but believes more work is needed to better establish that increased sentences deter crime. Doob and Webster (2003) review a large number of papers by criminologists and a handful by economists and conclude that the lack of strong evidence for deterrence is widespread enough to conclude that there is a null effect. These coauthors along with Frank Zimring (Webster, Doob, Zimring 2006) take a skeptical view of Kessler and Levitt’s 1999 paper, and its evidence for deterrence. Robinson and Darley (2004) take a somewhat more nuanced view that there are circumstances where increased sentences may deter, although they believe the magnitude is insufficient to influence policy decisions. Levitt and Miles (2007), in a wide-ranging piece, point to some of the economic studies that suggest there is evidence for deterrence, but conclude that more research on the topic is needed.
Several papers have used the discontinuity in sentencing at the age of majority to identify deterrence effects. Levitt (1998b) uses cross-state differences in the relative harshness of adult sanctions relative to those for juveniles. He finds that those states with larger jumps in punishment tend to have larger decreases in adult crime relative to juvenile. Hjalmarsson (2009) finds that offender perceptions of penalties change far less than actual changes at the age of majority, and finds little evidence of deterrence in self-reported data. Lee and McCrary (2011) use high frequency data from Florida to search for a discontinuity in offending around the 18th birthday. They find a drop in crime of 2% around this discontinuity and suggest that part of the low response might be due to myopic behavior. Two other recent papers of note look not at sentence length, but rather prison conditions and find evidence for deterrence (Katz, Levitt, Shustorovich, 2003; Chen and Shapiro, 2007).

4
commonly used crime data, the Uniform Crime Reports (Maltz and Targonski 2004).
This study makes use of hand-cleaned data to address this problem. In addition, a
number of alternate specifications are reported in the web appendix to attempt to fully
explore the sensitivity of the findings to choices of specification.3
The additional specifications and robustness checks are all consistent with the
main finding of evidence of a deterrent effect of sentence enhancements. The preferred
specification yields a statistically significant point estimate of a 5% reduction in gun
robberies within 3 years of the add-ons. In order to account for potential
contemporaneous law enforcement changes that occur with add-on gun laws, I run a
triple difference specification, which supports the main finding. I also examine the
impact of add-on laws on other crimes besides gun robberies. Gun assaults show a small
and statistically insignificant effect of the add-on laws. This is in keeping with some
findings that assaults tend to be less about pecuniary motives and perhaps less subject to
deterrence (Gould 2002; Silverman 2004).
There are two possible predictions for the impact of an add-on gun law on crimes
associated with gun robberies. Criminals may shift toward a lower penalty substitute
crime when gun penalties increase. However, if potential criminals are generalists and
tend to commit a set of related crimes, they may shift to the legitimate sector, and some
individuals may choose not to become criminals in the first place. Using a data set with
extensive criminal histories, I identify non-gun robberies and larcenies as the two most
likely crimes committed by a gun robber. There is a decrease in these crimes following
add-on gun laws, and a larger decrease in those regions with the greatest share of gun
3Carefully checking that estimations are robust is of particular importance in the crime literature where the data is often noisy, clear experiments are rare, and confounds are plentiful. Also of concern in any study examining one-time rule changes is calculating correct standard errors (Bertrand, Duflo, Mullainathan 2004). I do so by constructing placebo laws and estimate standard errors using a Monte Carlo simulation and report these results in the web appendix as well.

5
robberies. I also find no impact of gun laws on rapes and murders, the two types of
crimes least associated with gun robberies.4 Together this evidence supports the
generalist criminal theory and suggests that some potential criminals likely “go straight”
in response to enhanced penalties for gun crimes.
The rest of the paper proceeds as follows. Section II provides a brief background
on firearm sentencing enhancements and a description of the data. Section III presents
the main specifications along with a discussion of potential interpretations and
confounds. Section IV presents the main empirical results. In Section V I discuss a
number of additional specifications that further test the central findings; Section VI
concludes.
II. The History of Add-on Gun Laws and Data Description
An add-on gun law, as used in this paper, is a state law which mandates enhanced
prison sentences for defendants convicted of a felony who are further found to have used
or been in possession of a firearm in the commission of the felony. These types of laws
became popular in the 1970s with the aim of reducing armed crimes. Over 25 states
currently have add-on gun laws in their statutes, with most states adopting the laws in the
1970s and 80s. Figure 1 shows the geographical distribution of the timing of add-on law
adoption across states.
Add-on gun laws are a prominent example of legislative efforts to reduce the
incidence of crime beginning in the 1960s.5 Legislation leading to increased penalties
was introduced in an attempt to deter potential criminals and incapacitate potential
recidivists. Closely related to add-on gun laws, and also designed to curb crimes 4 Among crimes reported in the UCR. 5 Around the same time, sentencing guidelines were introduced around the country. Their purpose was to standardize sentence lengths but they also led to more severe sentencing in many cases.
6
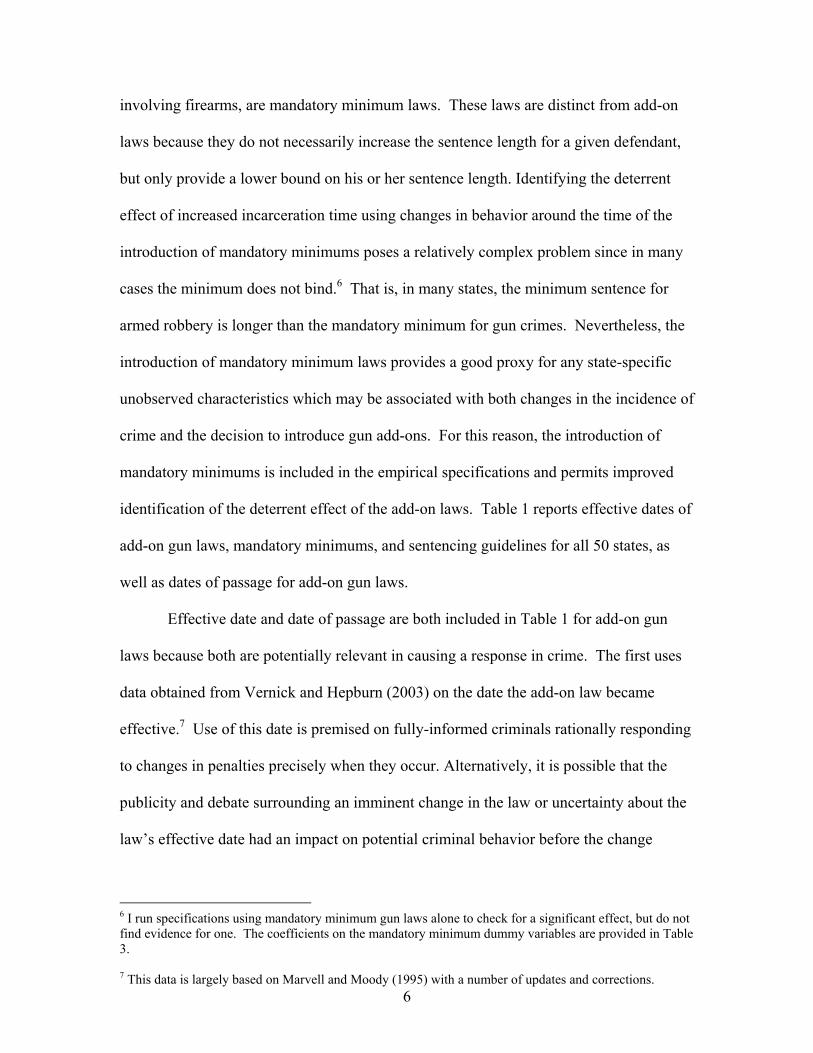
involving firearms, are mandatory minimum laws. These laws are distinct from add-on
laws because they do not necessarily increase the sentence length for a given defendant,
but only provide a lower bound on his or her sentence length. Identifying the deterrent
effect of increased incarceration time using changes in behavior around the time of the
introduction of mandatory minimums poses a relatively complex problem since in many
cases the minimum does not bind.6 That is, in many states, the minimum sentence for
armed robbery is longer than the mandatory minimum for gun crimes. Nevertheless, the
introduction of mandatory minimum laws provides a good proxy for any state-specific
unobserved characteristics which may be associated with both changes in the incidence of
crime and the decision to introduce gun add-ons. For this reason, the introduction of
mandatory minimums is included in the empirical specifications and permits improved
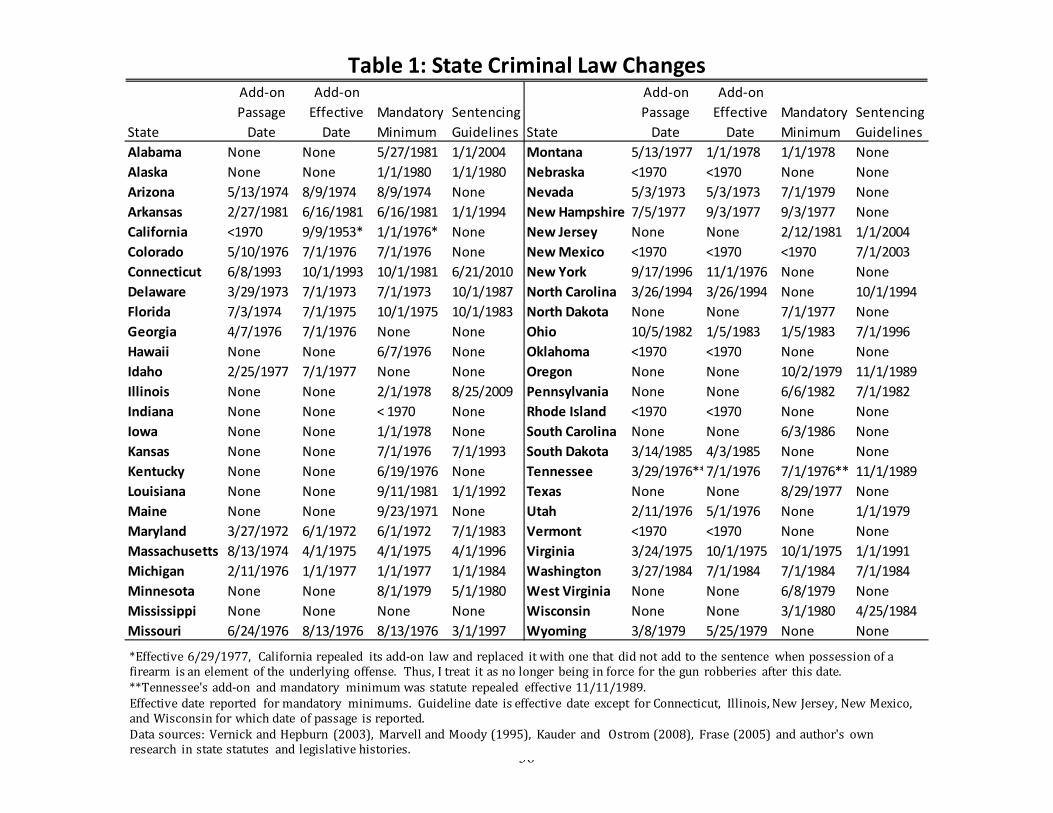
identification of the deterrent effect of the add-on laws. Table 1 reports effective dates of
add-on gun laws, mandatory minimums, and sentencing guidelines for all 50 states, as
well as dates of passage for add-on gun laws.
Effective date and date of passage are both included in Table 1 for add-on gun
laws because both are potentially relevant in causing a response in crime. The first uses
data obtained from Vernick and Hepburn (2003) on the date the add-on law became
effective.7 Use of this date is premised on fully-informed criminals rationally responding
to changes in penalties precisely when they occur. Alternatively, it is possible that the
publicity and debate surrounding an imminent change in the law or uncertainty about the
law’s effective date had an impact on potential criminal behavior before the change
6 I run specifications using mandatory minimum gun laws alone to check for a significant effect, but do not find evidence for one. The coefficients on the mandatory minimum dummy variables are provided in Table 3. 7 This data is largely based on Marvell and Moody (1995) with a number of updates and corrections.

7
actually occurred. The add-on law dates of passage were collected by the author from
state criminal codes and state legislative journals and are reported in column 2 of Table 1.
The Uniform Crime Reports (UCR), compiled by the FBI, contains the longest
and broadest dataset on crime in the United States.8 Important to this study is the fact
that, since 1965, counts of robberies and assaults have been distinguished by type of
weapon involved. The latest reports consist of data collected from nearly 17,000 law
reporting agencies, a number that has increased substantially over time. An agency is a
local law enforcement jurisdiction, often a city.9 The increase in reporting agencies
within each state poses an empirical challenge. Including all agencies reporting in a
given time period will lead to a substantially unbalanced panel: later dates would receive
much more weight. Thus for the main specifications, I construct a set of the 500 most
populous agencies that report data for the full sample range (1965 – 2002). Twenty-one
agencies are added to this data set for a total of 521 to ensure that every state is
represented by at least 3 agencies.10
The uniform crime reports are known to contain substantial numbers of data
errors, particularly at the agency level (Maltz and Targonski, 2004). Part of the data
cleaning process required examination and correction of the data by hand, which
8 Another substantial dataset frequently used to study the impact of criminal legislation is the National Crime Victimization Survey. This data set has some advantages over the UCR in that it may capture crimes that go unreported to the police. However the data does not include geographic identification and thus cannot be used in the current research. “State codes are not available in the National Sample because of confidentiality restrictions” (BJS 1998). City level files are available for 26 major cities for the years 1972-1975. These were not used due to the short time span available. 9 This is used as the basic unit of analysis because it is the smallest unit for which data is collected nationally. 10 There is one exception to this rule. There were only two districts in Vermont that reported for the full time period.

8
necessitated limiting the data to the most populous agencies as described above. The data
set used covers approximately 40% of the contemporary US population.11
There are several different types of data within the UCR including reported
offenses, unfounded offenses, offenses cleared (cases in which arrests are made), and
juvenile offenses cleared. In this study, I use reported offenses rather than arrests as the
primary measure of the incidence of crime. This choice is made to try to address the
concern that policing might be modified to focus on gun crimes in response to or
contemporaneous with the introduction of add-on gun laws. A modification in policing
behavior in response to legislative changes would be reflected in the number of offenses
cleared and complicates the task of isolating the responsiveness of criminal activity to the
new law. There may also be a change in crime reporting behavior in response to a law
change or the ensuing publicity. To address this concern, this paper makes use of
reported crimes rather than arrests. This way, even if there are contemporaneous policing
changes, the impact on reported crimes should presumably be less sensitive to law
changes than policies.
Table 2 reports summary statistics from the UCR data by type of offense.12 The
first 8 columns summarize the data in states that have add-on gun laws and the last two
columns are for states that never have one. For the add-on states, the mean and standard
deviation of each crime is reported before and after date the add-on law became effective.
11 In the web appendix, I also report results from an alternate specification where data is aggregated to the state level. This has the advantage of being somewhat less noisy, but the difficulty that the number of agencies encompassed by a state varies over time. 12 Definitions from the Uniform Crime Reports: Robbery - The taking or attempting to take anything of value from the care, custody, or control of a person or persons by force or threat of force or violence and/or putting the victim in fear. Separate counts are included for Firearm Robbery (i.e., any firearm is used as a weapon or employed as a means of force to threaten the victim or put him in fear). Assault - An unlawful attack by one person upon another. Firearm Assault includes all assaults wherein a firearm of any type (e.g., revolver, automatic pistol, shotgun, zip gun, rifle, etc.) is used or its use is threatened.

9
The first two columns report all years of data, the second two is a balanced panel where
the number of reported crimes is restricted 7 years prior to, and 6 years after the effective
date for an add-on law. This is the maximum range of data that is available for all states
that passed add-on laws and ensures that each agency has the same number of
observations. The third and fourth pairs of columns are similar to the first two, but the
data is restricted to post-1974. This is due to the fact that there is a discontinuity in
several variables in a large number of agencies in 1975 in the UCR data.13
An inspection of the mean number of crimes in Table 2 foreshadows the main
results that are reported in Section IV. Gun robberies drop substantially after add-on gun
laws, although it is possible that some of this is due to overall time trends (as can be seen
in Figure 2). The full event study specifications will control for these, as well as state-
specific time trends. In addition, to a substantial drop in gun robberies, we see a smaller
but substantial drop in non-gun robberies, as well. Rapes and murders decrease and
increase, respectively, after the law change, but not to a great extent. Gun assaults and
larcenies increase in some subsets of the data and decrease in others after the add-on law.
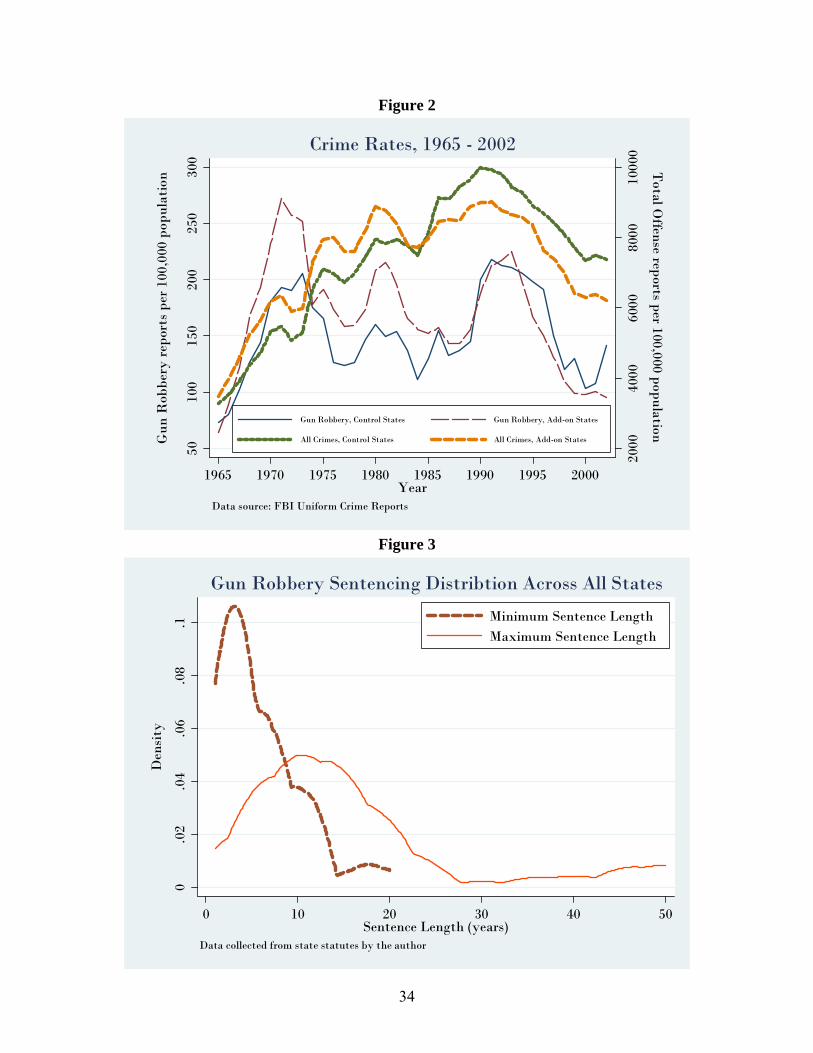
Figure 2 documents the well-known sharp run up in crimes in the 1960’s and
1970’s and later a decline beginning in the 1990’s. The trends for gun robbery are
similar to overall crime trends, and the trends are very similar for add-on and non-add-on
states. One point to note from the figure is that both gun robbery and overall crime rates
are higher for add-on states in the first half of the data, but this reverses in the last decade.
This may be due to the impact of the add-ons or to other cross-state variation. I now
introduced the framework that I will use later in the paper to distinguish between these
possibilities.
13 Staff members at the National Archive of Criminal Justice Data, which houses the publicly available UCR data set, were unable to account for this break in the data.

10
III. Methodology
The empirical challenge is to isolate the effect of add-on gun laws, estimate their
impacts, and try to minimize the possibility that estimates result from something other
than deterrent effects of the laws. With this in mind I adopt an event study methodology
for most specifications, which takes advantage of the variation in timing of the law
change across states.14 I test several different outcomes: gun robbery, gun assault, non-
gun robbery, larceny, murder, and rape. In all specifications, I control for lagged prison
population data, police population share, as well as economic and demographic measures.
The goal here is to identify the deterrent effect of incarceration, separate from
incapacitation. Thus it is necessary to distinguish between changes in crime rates
following the introduction of add-on laws caused by increased spells of incarceration
from crime rate changes due to the fact that some potential offenders may have been
deterred. This is done by restricting attention to crime rates within a short period
immediately following the introduction of the add-on law.
The logic is as follows: Assume the minimum sentence for the underlying crime
prior to the add-on was x years and the add-on increases it by y additional years. Within
the first x years after the law change there will be no effective change to incapacitation:
all offenders sentenced in this period after the law change would have been incapacitated
under the old law as well. Thus any change in crime rates in the first x years cannot be
due to incapacitation, and may be interpreted as a deterrent effect.
14 In the web appendix, I report various specification checks, including testing the date of law adoption versus the effective date, adding further controls, and restricting the data set, as well as a falsification test using using placebo dates for the law change. In addition, I test several models allowing for variation in the immediacy of impact of the law.

11
An important question, therefore, is of the appropriate value of x, the previous
minimum sentence for the underlying crime. An estimate of three years was found as
follows: Data on the minimum and maximum sentence for 1st degree robbery (or its
equivalent) was collected from state statutes for 47 of the 50 states (Figure 3). The mean
minimum sentence length is 5.5 years and the median 5 years. For the maximum the
numbers are 16.5 and 13.5 years, respectively. It is possible that some defendants serve
less than the minimum time, receiving time off for good behavior (although truth-in-
sentencing laws have reduced the likelihood of this happening over time). Ideally, one
would prefer an empirical distribution of time served by state, but no such data set exists
for the required years. The best empirical data on actual time served comes from the
National Corrections Reporting Program, which is consistent with the three year figure.
A three-year time span was hence chosen as a conservative estimate of the time during
which those prisoners prevented from reoffending by incarceration would have been
removed from the set of potential offenders independent of the introduction of an add-on
gun law.15
The key identifying assumption in this paper is that add-on gun law adoptions are
exogenous. Although most add-on gun laws were enacted in the 1970s, due to the
previously-discussed national trends, the particular timing in a state is to a large degree
random due to the vagaries of the political process within each state. This assumption
plays a critical role in allowing the empirical tests to distinguish between general trends
in crime rates in a given state and changes in behavior that are attributable to the
introduction of the add-on law.
15 To be even more conservative, most of the analysis is also performed for one and two year time spans.

12
In order to further investigate the plausibility of this assumption, I collected
additional data from newspapers. While it is difficult to establish complete randomness
in the timing of law changes, there is some evidence to this point. Often legislative
activity on crime-related issues is spurred by idiosyncratic events, like a particularly
notorious crime. Newspaper data was collected in order to investigate whether this was a
frequent impetus for add-on gun laws. There is scant digitally searchable newspaper data
available before the 1990’s, yielding only 8 newspapers from 6 states with articles within
a year of the law change. Although the small sample size makes it difficult to draw
strong conclusions, it is informative to note that articles in 2 of the 6 states point to
specific, notorious crimes as spurring the introduction of legislation.
Beyond newspaper evidence about the randomness in timing of the law change,
one may still have concerns about the timing or about concomitant changes in
enforcement. There are at least three factors that should reduce this concern: First, while
these law changes are made at the state level, policing decisions (and the analysis in this
paper) are almost always made at the local level. Crime rates within a state will certainly
be correlated, but not likely to such a degree that all jurisdictions will change
enforcement identically and simultaneously. Second (as noted above), I use reported
crimes rather than arrests because this measure of crime should be less sensitive to
changes in policing policy. Third, I include state-specific time trends in some
specifications to allow for concerns about legislative response to these trends, and find
substantially similar results as in the base specification.16 I also report results from a
16 One may also be concerned that due to prosecutorial discretion (see e.g. Bjerk 2005) the law changes may be undone by lack of enforcement. While this is an important consideration for a number of law changes, add-on gun laws were of such large magnitude, so pervasive and popular that it would have been practically difficult for them to be completely nullified by prosecutors. Nonetheless, the estimates presented here should thus be interpreted as a lower bound of the full effect of a sentencing change.

13
triple difference analysis in Section XX that should isolate the deterrence effect even if
concerns remain about other changes contemporaneous with the add-on law introduction.
A. Central Specification
The initial test for the impact of add-on gun laws is a simple difference in
difference,
atstmm
stx
tsstAddon
aty (1)
Here yat is the outcome of interest, namely a log per capita crime rate. The
variable Addonst is a dummy that is one in states with an add-on gun law in force, within
n years of the add-on date (where n varies across different specifications), and zero
otherwise.17 λs allows for permanent differences across states in crime rates (state fixed
effects). Any national trends in crime will be absorbed into the year dummies (γt).
Potentially important time varying state characteristics are controlled for with the vector
xst. Controls include poverty rate, unemployment rate, racial composition, age
composition, lagged police population share, and lagged imprisoned population.18 The
controls also include a dummy for whether the state has a mandatory minimum law in
force (mmst). This can be seen as controlling for the direct effect of mandatory minimum
laws and also to proxy for other characteristics of states that passed both laws. The
coefficient β signifies the impact of the add-on gun law. Errors (εat) are allowed to be
17 Since there are only two examples of repeals of add-on gun laws (California in 1977 and Tennessee in 1989) there will be tremendous autocorrelation in this variable. This makes standard errors prone to potential underestimation, as discussed in Bertrand, et al (2004). Both clustering standard errors by state and estimating standard errors using placebo laws (reported in the web appendix) are used to correct this problem. 18 Data for control variables were kindly made available by John Donohue.

14
heteroskedastic and correlated within states. Thus robust standard errors are clustered at
the state level and population-weighted.19
One potential shortcoming of the specification in (1) is that it doesn’t allow for
state-specific trends in crime that could impact a state’s likelihood of adoption of an add-
on gun law. Adding these trends reduces the burden of exogeneity of the add-on laws:
now the timing must simply be exogenous once state-specific crime trends are accounted
for. The following specification adds the state-time trends (ωst):
atstmm
stxt
stsstAddon
aty (2)
This specification is also estimated using robust, population-weighted errors.
B. Event Study
To obtain a more precise understanding of the impact the add-on gun laws have
year-by-year after their effective dates, it is useful to group agencies together according
to the time period relative to the add-on date in their state. This results in an event study
methodology similar to that employed by Jacobson, Lalonde, and Sullivan (1993) in
order to identify earnings losses of displaced workers:
atstxt
stsD
aty i
stni
i
(3)
The outcome as before is a measure of the crime rate at the agency level, and λs, γt, ωst,
xst, and εat are as described above. The major distinction is that now there are multiple
variables of interest, the βi which indicate the impact of the add-on gun law at various
different times relative to the law’s effective date. The Dsti are dummy variables that are
1 in state s if period t is exactly i periods after the effective date in that state, and zero
19 Regression estimates are population-weighted because the true impact should be at the level of an individual. Thus, larger agencies have more impact on the overall point estimates than smaller ones. The web appendix includes unweighted estimates.

15
otherwise. For example, in Arkansas the add-on year is 1981, so the i=3 dummy will be
1 in 1984. The relative time index, i, may take on negative values to allow for any
potential effects prior to the add-on date. This methodology is powerful in that it conveys
a lot of information about the dynamics of the response to the add-on gun laws. The
results from these regressions are reported in Figures 4 and 5. 20
IV. Empirical Findings
A. Main Results
The first empirical results are from a regression of reported log gun robberies per
capita on post add-on dummies, using the specification in Equation (1). Table 3 presents
the results, with each column representing a separate regression. “Balanced panel” has
the same meaning as in the summary statistics: data points were included only if they
were within 7 years prior to, or 6 years after the effective date for an add-on law. Panels
A, B, and C differ in the number of years included in coding the post add-on dummy.
For example, in panel B, the add-on law dummy is one for the first two years following
the add-on law effective date and zero otherwise. All errors reported allow for intra-state
correlation and are weighted by state population. All specifications included state and
year effects, and the controls discussed in section III.
Log per capita crime rate is the preferred dependant variable in this paper and this
preference may be illustrated by the following example. Assume Miami has a pre-gun
law level of 200 gun robberies per 100,000 residents and Phoenix has a pre-gun law level
of 100 gun robberies per 100,000 residents. We might believe that the severity of the 20 Several other specifications are described and their results reported in the web appendix. These include ones that allow for lagged dependent variables, changes in slope, and triple-difference using the magnitude of the add-on gun law penalty in a state as the third dimension.

16
impact of a marginal crime decreases with level of crime, so a reduction from 100 to 50
gun robberies per 100,000 residents is more meaningful than one from 200 to 150 per
100,000 residents. If this belief about social preferences is accurate, it is appropriate to
focus on the logarithm of the per capita rate of gun robberies as the outcome of interest.21
Across specifications there appears to be a consistent finding that gun robbery
rates decline after add-on gun laws go into effect. The impact is insignificant in the first
year, but is significant at the 1% level after two or three years. The coefficients in Table
3 yield an estimate of the magnitude of the impact of the impact. Although the
coefficients vary somewhat across specifications, there is a decline of 6-14% within the
first two years and 5-18% within the first three years of introduction of the law. The
preferred specification is the most conservative, with a balanced-panel restricted to post-
1974 data and including state-specific time trends.22 For this specification there is an
impact which seems to level off to 6% within two years, and 5% within three years.
In order to gain more information on the timing of the impact of the law change, I
estimate equation (3) using log per-capita gun robberies as the dependant variable. The
results, reported in Figure 4, support the findings discussed above.23 Gun robbery rates
(both with and without controlling for state trends) are fairly stable in the years preceding
implementation of an add-on gun law, then decline for approximately three years and
then level out.24 One surprising feature of Figure 4 is that it appears that the downward
21 I also run regressions using per capita crime data as the dependent variable. These results are reported in the web appendix. 22 Note that the post-1974 specification is identified off of 20 state law changes that were made after that year. I ran several regressions using each of the control variables used in the main specifications (poverty rate, unemployment rate, racial composition, age composition, lagged police population share, and lagged imprisoned population) to test whether they differed systematically from other states and found no significant difference. 23 The absolute values on the y-axis of this and other figures are not meaningful in themselves (since they come from regressions that include a number of regressors with non-zero means) but the changes are. 24 In additional specifications (available from the author), I examine the impact of the law change lasting up to 6 years, which would presumably include incapacitation effects as well. I find the overall decline in

17
trend may begin slightly before the effective date. I discuss the timing of the impact of
the law in part A of Section V.
The evidence from UCR data on gun robberies supports the notion that criminals
are deterred by the implementation of add-on gun laws. There are a number of important
confounds that could belie this interpretation, and they are addressed at length in Section
V. But it is important to take note of the strength of the evidence presented here. By
using panel data with state and time fixed effects, I have attempted to rule out that
spurious results could be obtained due to an overall national time trend in crime, or cross-
sectional endogeneity in passage of add-on gun laws. Adding state trends increases the
strength of the exogeneity assumption by ruling out endogenous response in law passage
not just to levels, but also to state trends in crime.25 Making use of timing dummies
relative to the law effective date allows for the detection of the dynamic response of
crime relative to implementation of the law.
B. Gun Assaults
If the economic model of crime is correct, one should observe a deterrent effect of
add-on gun laws on all types of gun crimes. The other category of crime for which
weapon type is reported in the UCR is assault. Assaults are often considered to be
“crimes of passion” and thus may not be as well described by the economic model of
crime grows to about 10% in the most conservative specification, indicating that the importance of the incapacitation effect is of the same order as deterrence. 25 Most of the coefficients are relatively stable when state-year trends are added. Remaining concern about contemporaneous policy changes affecting the results may be addressed by the triple difference specification, addressed below.

18
crime.26 Nevertheless, one might expect that some fraction of assaults do have an
indirect economic motive, or at least respond to changes in penalties.
Using UCR data on reported gun assaults, I test for a deterrent effect of add-on
gun laws on gun assaults, and find no significant effect. Table 4 reports results from
specifications described by equations (1) and (2) for two and three years after the add-on
law. The estimates are all negative, but statistically indistinguishable from zero. The
coefficients are all substantially smaller than those for gun robberies. Taken together,
this suggests the possibility of a weak deterrent effect for gun assaults of about 1 to 3
percent. But the current study lacks the power to confirm the statistical significance of
this effect.
C. Other Crimes
While economic theory clearly predicts a negative relationship between the
presence of add-on gun laws and gun crimes, the prediction is less clear for non-gun
crimes. Add-on gun laws will increase non-gun crimes if guns and other weapons are
good substitutes and criminals shift towards other weapons or types of crime as the cost
of using a gun increases. Alternatively, add-on gun laws may reduce non-gun crimes if
individuals choose whether or not to be a generalist career criminal based on the total
expected returns of criminal and alternative careers. If there is some up-front investment
necessary to enter the criminal sector (e.g. gang initiation) or to improve general skills
one would observe a correlation across some types of crime rates. Decreased expected
returns due to add-on gun laws could lead some potential criminals to stay in the
26 See e.g. Gould (2002) and Silverman (2004) both of which note that assaults and some other types of violent crimes often have primarily non-pecuniary motives. Of course, this doesn’t imply that harsher sanctions will have no effect even on these crime rates, but suggests that the effect may be smaller.
19
legitimate sector or some current criminals to shift into the legitimate sector and thus
reduce levels of all types of crime.
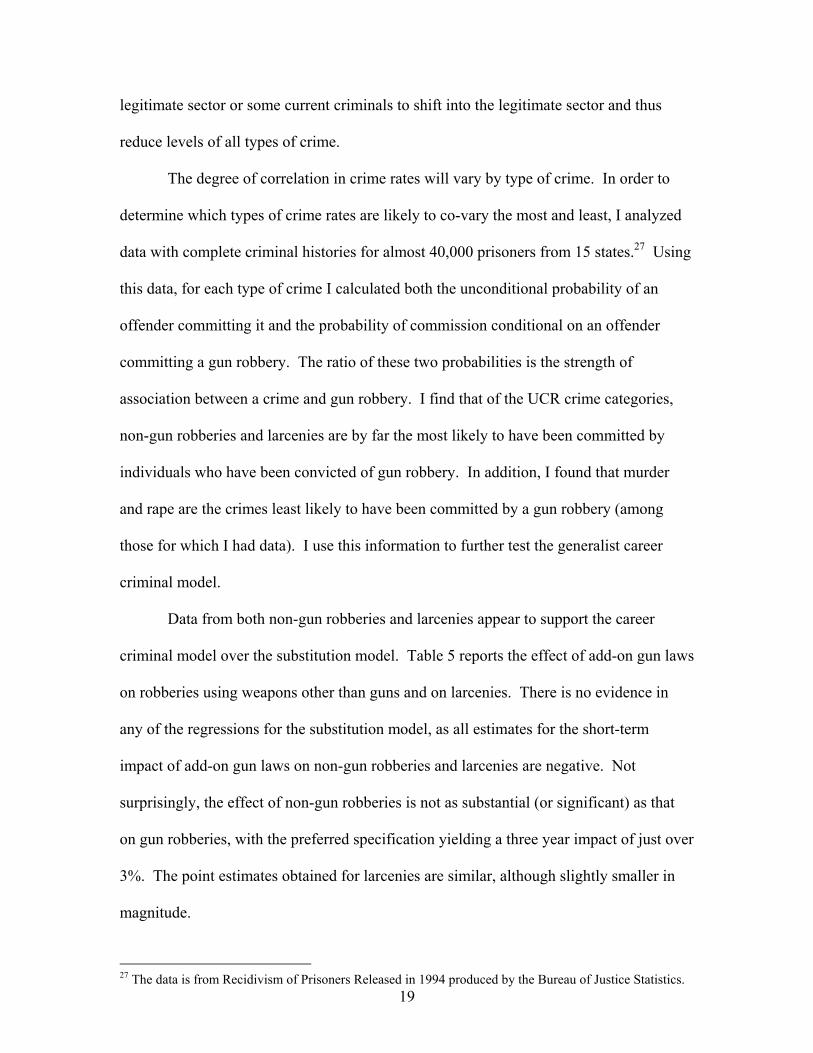
The degree of correlation in crime rates will vary by type of crime. In order to
determine which types of crime rates are likely to co-vary the most and least, I analyzed
data with complete criminal histories for almost 40,000 prisoners from 15 states.27 Using
this data, for each type of crime I calculated both the unconditional probability of an
offender committing it and the probability of commission conditional on an offender
committing a gun robbery. The ratio of these two probabilities is the strength of
association between a crime and gun robbery. I find that of the UCR crime categories,
non-gun robberies and larcenies are by far the most likely to have been committed by
individuals who have been convicted of gun robbery. In addition, I found that murder
and rape are the crimes least likely to have been committed by a gun robbery (among
those for which I had data). I use this information to further test the generalist career
criminal model.
Data from both non-gun robberies and larcenies appear to support the career
criminal model over the substitution model. Table 5 reports the effect of add-on gun laws
on robberies using weapons other than guns and on larcenies. There is no evidence in
any of the regressions for the substitution model, as all estimates for the short-term
impact of add-on gun laws on non-gun robberies and larcenies are negative. Not
surprisingly, the effect of non-gun robberies is not as substantial (or significant) as that
on gun robberies, with the preferred specification yielding a three year impact of just over
3%. The point estimates obtained for larcenies are similar, although slightly smaller in
magnitude.
27 The data is from Recidivism of Prisoners Released in 1994 produced by the Bureau of Justice Statistics.

20
While I find an effect of add-on gun laws for non-gun robberies and larcenies, the
generalist criminal theory would not predict an impact on rapes or murders, because they
are not very associated with gun robberies (or gun assaults). Table 6 reports results from
regressions where these are the dependent variables. As expected, neither of the crimes
show a statistically significant impact of the add-on gun laws within two or three years of
the law change. All of the point estimates for rape are less than 1%. While the point
estimates for murder are larger, none are statistically significant.
It appears that not only gun crimes, but other crimes that tend to be committed by
gun robbers are impacted by the implementation of add-on gun laws. At the same time,
uncorrelated crimes do not appear to be affected by the law change. As discussed above,
these results support the career criminal hypothesis. The findings do not imply that there
is no substitution away from guns to other weapons; simply that these effects are
outweighed by the overall decline in robberies. There are also other potential
explanations for the similar time pattern of crime reduction. For example,
misclassification of some fraction of gun robberies as non-gun robberies could lead to
these results. Other possibilities could include a contemporaneous law enforcement
change (like a broad crackdown on crime) or a mean-reverting crime process with
endogenous legislative implementation of add-on gun laws. These potential confounds
and a number of specification checks are discussed in Section V and in the web appendix.
V. Addressing Potential Concerns
A. Crime trends and Contemporaneous Policy Changes
To this point, I have attempted to isolate the deterrent effect of add-on gun
laws by using a long crime panel and a repeated natural experiment, which allows for the
21
inclusion of state and time controls as well as state-specific trends. One still may be
concerned that some or all of the effect that has been estimated is from contemporaneous
policy changes or that the timing of the laws is not exogenous. Although the regression
results indicate a significant decrease in crime after the effective date of the law change,
there may be concern that states pass laws in response to a run-up in crime, and the
decline is simply reflecting mean reversion in crime rates. The fact that a decline in
crime subsequent to the effective date of the law persists even when state trends are
included casts some doubt on this explanation. This still leaves open the possibility that
laws are passed in response to changes in the crime trend or that other law changes are
responsible for the detected effect.
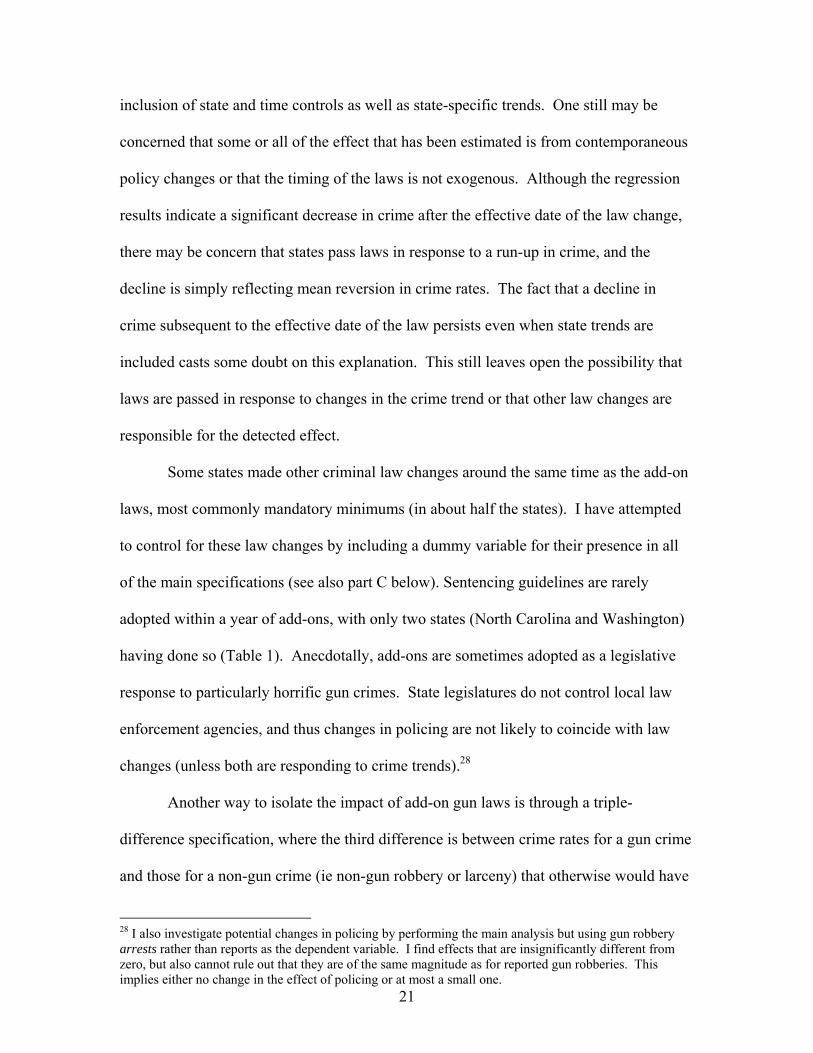
Some states made other criminal law changes around the same time as the add-on
laws, most commonly mandatory minimums (in about half the states). I have attempted
to control for these law changes by including a dummy variable for their presence in all
of the main specifications (see also part C below). Sentencing guidelines are rarely
adopted within a year of add-ons, with only two states (North Carolina and Washington)
having done so (Table 1). Anecdotally, add-ons are sometimes adopted as a legislative
response to particularly horrific gun crimes. State legislatures do not control local law
enforcement agencies, and thus changes in policing are not likely to coincide with law
changes (unless both are responding to crime trends).28
Another way to isolate the impact of add-on gun laws is through a triple-
difference specification, where the third difference is between crime rates for a gun crime
and those for a non-gun crime (ie non-gun robbery or larceny) that otherwise would have
28 I also investigate potential changes in policing by performing the main analysis but using gun robbery arrests rather than reports as the dependent variable. I find effects that are insignificantly different from zero, but also cannot rule out that they are of the same magnitude as for reported gun robberies. This implies either no change in the effect of policing or at most a small one.

22
similar time trends to the gun crime. The results from these regressions are reported in
Table 7 using non-gun robberies and larcenies as the unaffected crime. The identifying
assumption in these regressions is that gun robberies would have experienced the same
time evolution as the control crimes if not for the add-on gun law.29 Across all
specifications, the triple difference shows a decline in gun robberies due to the law
change, although one that is statistically insignificant for some of the specifications. This
provides further evidence that the add-on law had a deterrent effect.
B. Timing of the Decline in Crime
Thus far I have presented evidence for a deterrent effect of add-on gun laws,
leading to a decrease in gun robberies per capita of about 5% within the first 3 years of
passage. One potential concern regards the timing of the decrease in crime: there is a
slight (statistically insignificant) decline in gun robberies prior to the effective date of the
add-on law, even when controlling for state-specific time trends (Figure 4).
One possible interpretation of the slight decrease in crime pre-law change is that
potential offenders learn about the law through ongoing public debate and discussion and
modify their behavior in anticipation of the law change. 30 The process by which
potential offenders learn about criminal sanctions is not well-studied. There is some
29 This assumption necessitates using control crimes that are similar to gun robberies, which is why non-gun robberies and larcenies were chosen. As discussed, however, there may be a direct effect of the law on these crimes as well, in which case the triple difference will understate the magnitude of the effect of the law change. 30 In order to gain a better understanding of when potential offenders are likely to have learned of add-on gun laws, I collected data from local newspapers about gun legislation. This turns out to be a difficult task. For each of the 30 states that ever passed add-on gun laws, I searched for newspaper article availability for the largest newspaper in the state capital and in the largest city. Although most newspapers have digitized archives going back to the 1990’s, because many of the add-on laws were passed earlier, data was only available from 8 newspapers, representing six states, around the time of the add-ons. For these newspapers, searches were run with various permutations of the terms firearm, gun, add-on, mandatory minimum, law, legislation, in order to determine which period had the greatest news coverage of the law change. There was weak evidence of more publicity around the date of passage, but insufficient power to find statistical significance.

23
evidence (Pogarsky, et al. 2004; Tunnell 1996) that potential criminals often have very
noisy information about penalties they may face. Other work (Cook 1980) suggests that
potential criminals may learn of law changes through the media and will change behavior
even with imperfect knowledge of new sanctions. Discussions of the author’s with
criminal defendants and public defenders indicate that at least some defendants are aware
of sanctions.31
Imperfect knowledge of law changes may lead to a weakened overall deterrent
effect, and also to a modification of the timing in the response to penalty changes. All
specifications presented thus far have used the law’s effective date as the key
independent variable. But this date is often months or even years after the law has been
debated in the legislature. New laws are likely to receive the most publicity and have the
greatest effect on behavior around the date of legislative introduction or passage (see
footnote 27XX). To test this hypothesis, I collected the dates of legislative bill
introduction or passage (the former are difficult to obtain for a number of states, but the
latter may be found in state codes or legislative histories) and report these in Table 1.
I replicate the regressions above using the date of bill passage instead of
implementation and find a somewhat shifted time structure of the crime response, relative
to the previous specifications (Figure 5). The greatest declines in gun robbery rates occur
in the first two years following the date of passage of the law. The point estimates using
date of passage are very similar to those reported above using the effective date of the
law change. This supports the hypothesis above regarding the timing of criminal
response corresponding more closely to the date of passage.
31 An example of a media source that provides information on gun laws is Don Diva, a hip-hop magazine that has run articles entitled “What are Mandatory Minimums?” and “What Every Gangster Needs to Know.”

24
Although the law change is not yet effective, there are two mechanisms that could
account for an immediate reduction in crime. First, a forward-looking fully rational
individual considering a career in crime should respond to the knowledge of the penalty
change, even though it is not yet effective, by not making investments related to a
criminal career. Second, the information a potential criminal receives about the law
change may be imperfect. For example, the potential offender may hear about a law
change when it is publicized through the media, and may assume that it is effective
immediately. I do not attempt to distinguish these explanations here, and continue to use
the timing of the base specification for all other regressions.
C. Impact of Mandatory Minimum Laws
One of the most significant potential confounds of the deterrence interpretation is
the possibility of other policy changes contemporaneous with add-on gun laws. The most
likely candidate for such a contemporaneous change is a mandatory minimum law. Many
of the states that adopted add-on gun laws also adopted another type of law aimed at
reducing gun violence, mandatory minimums. These laws provide for a lower bound on
sentences for crimes involving the use of a firearm. As discussed previously, since
mandatory minimums are often not binding, it makes a deterrence interpretation
problematic.
I test for an impact of mandatory minimum laws using the same methodology as
used for add-on gun laws. Table 3 presents coefficients on mandatory minimum law
dummies in regressions including add-on law dummies as well. Although a few of the
coefficients on the mandatory minimum dummies are large, none are statistically
significant. The same results were found when running specifications including only
25
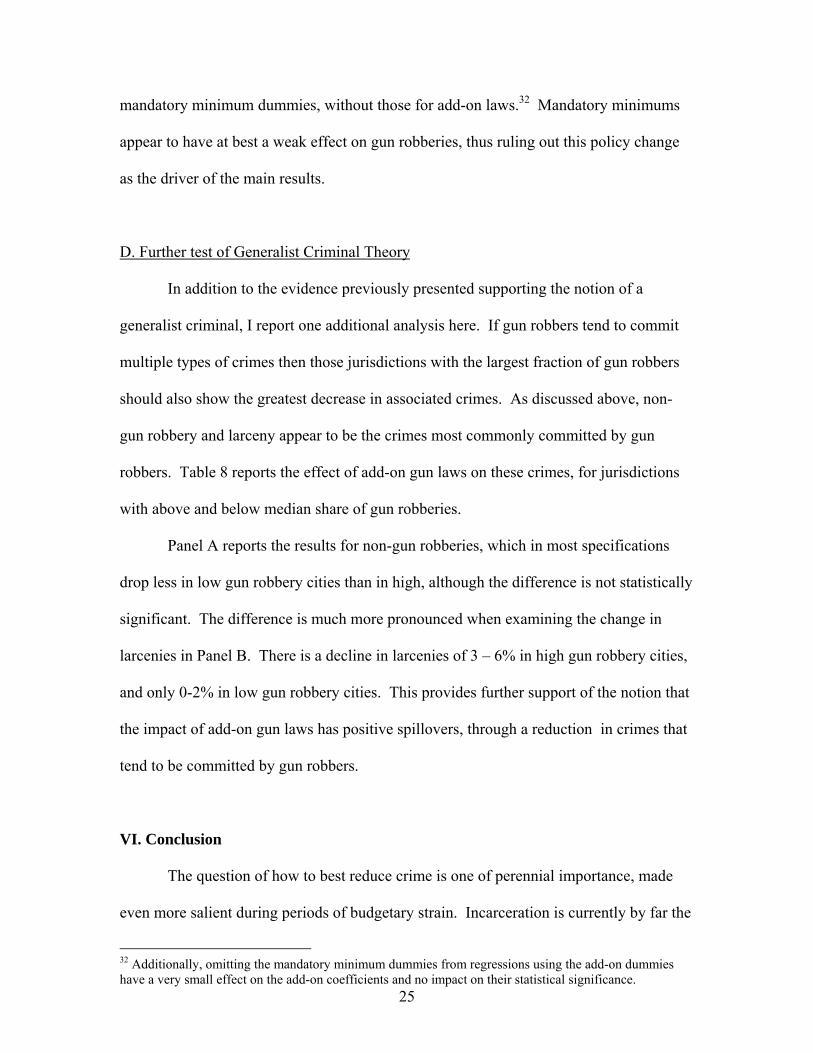
mandatory minimum dummies, without those for add-on laws.32 Mandatory minimums
appear to have at best a weak effect on gun robberies, thus ruling out this policy change
as the driver of the main results.
D. Further test of Generalist Criminal Theory
In addition to the evidence previously presented supporting the notion of a
generalist criminal, I report one additional analysis here. If gun robbers tend to commit
multiple types of crimes then those jurisdictions with the largest fraction of gun robbers
should also show the greatest decrease in associated crimes. As discussed above, non-
gun robbery and larceny appear to be the crimes most commonly committed by gun
robbers. Table 8 reports the effect of add-on gun laws on these crimes, for jurisdictions
with above and below median share of gun robberies.
Panel A reports the results for non-gun robberies, which in most specifications
drop less in low gun robbery cities than in high, although the difference is not statistically
significant. The difference is much more pronounced when examining the change in
larcenies in Panel B. There is a decline in larcenies of 3 – 6% in high gun robbery cities,
and only 0-2% in low gun robbery cities. This provides further support of the notion that
the impact of add-on gun laws has positive spillovers, through a reduction in crimes that
tend to be committed by gun robbers.
VI. Conclusion
The question of how to best reduce crime is one of perennial importance, made
even more salient during periods of budgetary strain. Incarceration is currently by far the
32 Additionally, omitting the mandatory minimum dummies from regressions using the add-on dummies have a very small effect on the add-on coefficients and no impact on their statistical significance.

26
most favored method to reduce crime in the United States, and it acts primarily through
two channels, incapacitation and deterrence. Disentangling the relative contributions of
the two channels is of primary significance in establishing sensible sentencing policies.
In this paper, I use the introduction of add-on gun laws to isolate the deterrent
effect of incarceration. Since defendants sentenced under add-on gun laws receive
sentences of several years for their underlying crime, any impact on crime within the first
several years of an add-on gun law may be interpreted as due solely to its deterrent effect.
I find that this effect on gun robberies is significant, with a per-capita reduction of
5% within three years of the law’s effective date. This reduction in gun robberies does
not seem to come at substantial expense from criminals substituting to other types of
crime. Non-gun robberies and larcenies display a weaker response to add-on laws, but in
the same direction, supporting the notion that add-on gun laws may have positive, not
negative spillovers.
While it is difficult completely rule out that passage of add-on gun laws is
endogenous, or that contemporaneous policy changes may be responsible for some of the
findings, I present substantial evidence addressing these concerns. Numerous alternate
specifications are explored to attempt to verify the robustness of the central findings.
Contemporary newspaper data suggests that legislative action is often spurred by
idiosyncratic crimes. Triple differences and an analysis of related and unrelated crimes
reinforce the central finding of deterrence and point toward generalist career criminals.
Previous research into deterrence has often been limited to single jurisdictions or
has been unable to make use of natural experiments to establish a causal relationship.
This paper should help solidify our evidence for deterrence from incarceration. While the
jurisdictions vary, it is useful to compare the magnitude of the estimates found in this

27
paper with others. The 5% three year decline in this paper is close in magnitude to the
8% drop found by Kessler and Levitt (1999). Since the magnitude of sentence
enhancements in that paper are similar to gun add-ons, this is an encouraging result.
Other papers use sentencing changes that are substantially different from those in
this paper, and so a comparison of elasticities is more illuminating. A quick back of the
envelope calculation yields an elasticity of approximately -.10 in the current paper. This
magnitude is consistent with that found by Lee and McCrary (2011). They bound
allowable elasticities consistent with their data and model to have a magnitude no greater
than -.13, although their preferred parameter values yield elasticities close to 0. The
largest recent empirical elasticity estimates come from Drago, et al. (2009) using Italian
data, where they find a magnitude of -.74 for 7 months. This may be an indication that
the substantially lower incarceration rate in Italy makes it difficult to extrapolate to the
United States. A back of the envelope calculation using Helland and Tabarrok’s (2007)
results from examining three strikes induced change yields an elasticity around -.07.
The main finding in this paper is of a robust deterrent effect of incarceration. As
the preceding discussion illustrates, the magnitude of the effect found here is consistent
with some prior results from individual jurisdictions, although there is a wide range of
estimates. In looking toward future research and implications for policy, one must
recognize that the magnitude of deterrence, and not just its existence, is paramount.
28
References
Arellano, M. and S. Bond. “Some tests of specification for panel data: Monte Carlo evidence and an application to employment equations.” The Review of Economic Studies, 1991, 58, pp. 277-97. Ayres, I. and J.J. Donohue. “Shooting Down the ‘More Guns, Less Crime’ Hypothesis.”
Stanford Law Review, 2003, 51(4), pp. 1193-1312. Baltagi, Badi H. Econometric Analysis of Panel Data. John Wiley & Sons, New York,
NY, 2001. Bertrand, Marianne, Esther Duflo and Sendhil Mullainathan. “How Much Should We
Trust Differences-in-Differences Estimates?” The Quarterly Journal of Economics, 2004, 119(1), pp. 249-275.
Beck, Allen J. and Paige Harrison. “Number of sentenced inmates incarcerated under
State and Federal jurisdiction per 100,000, 1980-2004.” United States Bureau of Justice Statistics, 2005. Available at: http://www.ojp.usdoj.gov/bjs/glance/incrt.htm.
Bjerk, David. “Making the Crime Fit the Penalty: The Role of Prosecutorial Discretion
under Mandatory Minimum Sentencing.” Journal of Law & Economics, 2005, 48(2), pp. 591-625.
Becker, Gary S. “Crime and Punishment: An Economic Approach.” The Journal of
Political Economy, March 1968, 76(2), pp. 169-217. Blundell, R. and S. Bond. “Initial conditions and moment restrictions in dynamic panel data models.” Journal of Econometrics, 1998, 87, pp. 115-43. Britt, Chester L., David J. Bordua, and Gary Kleck. “A Reassessment of the D.C. Gun
Law: Some Cautionary Notes on the Use of Interrupted Time Series Design for Policy Impact Assessment.” Law and Society Review, 1996, 30(2), pp. 361-380.
Caselli, Francesco, Gerardo Esquivel, and Fernando Lefort. “Reopening the Convergence
Debate: A New Look at Cross-Country Growth Empirics.” Journal of Economic Growth, 1996, Vol, 1.
Chen, M. Keith, and Jessie Shapiro. “Do Harsher Prison Conditions Reduce Recidivism?
A Discontinuity-Based Approach.” American Law and Economic Review,2007, 9(1), pp. 1-30.
Cook, Philip J. “Research in Criminal Deterrence: Laying the Groundwork for the
Second Decade.” Crime and Justice, Vol. 2, 1980, pp. 211-268. DiIulio, John and Anne Piehl. “Does Prison Pay? The Stormy National Debate over the
Cost-Effectiveness of Imprisonment.” The Brookings Review, Fall 1991, pp. 28-35.

29
Donohue, John J. “Guns, Crime, And The Impact Of State Right-to-carry Laws.”
Fordham Law Review, November 2004, 73(2). Doob, Anthony M. and Cheryl Webster. “Sentence Severity and Crime: Accepting the
Null Hypothesis.” Crime and Justice, 2003, Vol. 30, pp. 143-195. Drago, Francesco, Roberto Galbiati, and Pietro Vertova. “The Deterrent Effects of
Prison: Evidence from a Natural Experiment.” Journal of Political Economy, 2009, 117 (2), pp. 257–280.
Duggan, Mark. “More Guns, More Crime.” Journal of Political Economy, 2001, 109:
1086 – 1114. Ehrlich, Isaac. “Participation in Illegitimate Activities: A Theoretical and Empirical
Investigation,” Journal of Political Economy, May/June 1973, 81 (3), 521–565. ———. “The Deterrent Effect of Capital Punishment: A Question of Life and Death,” American Economic Review, LXV (1975), 397-417. ———. “On the Usefulness of Controlling Individuals: An Economic Analysis of
Rehabilitation, Incapacitation and Deterrence.” The American Economic Review, June 1981, Vol. 71, No. 3, pp. 307-322.
Friedberg, Leora. “Did Unilateral Divorce Raise Divorce Rates? Evidence from Panel
Data.” American Economics Review, 1998, 88(3). Gould, Eric D. “Crimes Rates and Local Labor Market Opportunities in the United
States: 1979-1997.” Review of Economics and Statistics, 2002, 84(1), pp. 45–61. Helland, Eric and Alexander Tabarrok. “Using Placebo Laws to Test “More Guns, Less
Crime.” Advances in Economic Analysis and Policy, 2004, 4(1), article 1, pp. 1-7. ———. “Does Three Strikes Deter: A Non-Parametric Investigation,” Journal of Human
Resources, Spring 2007, 42 (2), 309–330. Hjalmarsson, Randi. “Crime and Expected Punishment: Changes in Perceptions at the
Age of Criminal Majority.” American Law and Economics Review, 2009, Vol. 11, Issue 1, pp. 209-248.
Jacobson, Louis S., Rober J. LaLonde, and Daniel G. Sullivan. “Earnings Losses of
Displaced Workers.” The American Economic Review, September 1993, 83(4), pp. 685-709.
Katz, Lawrence, Steven D. Levitt, and Ellen Shustorovich. “Prison Conditions, Capital
Punishment, and Deterrence.” American Law and Economics Review, 2003, 5(2), pp. 318-343.
30
Kessler, Daniel P. and Anne Morrison Piehl. “The Role of Discretion in the Criminal Justice System.” Journal of Law, Economics and Organizations, 1998, 14(2), pp. 256-276.
——— and Steven D. Levitt. “Using Sentence Enhancements to Distinguish between
Deterrence and Incapacitation.” Journal of Law and Economics, April 1999, 42(1), pp. 343-363.
Lee, David S. and Justin McCrary. “The Deterrence Effect of Prison: Dynamic Theory
and Evidence.” Working Paper, 2011. Levitt, Steven D. “The Effect of Prison Population Size on Crime Rates: Evidence from
Prison Overcrowding Litigation.” The Quarterly Journal of Economics, May 1996, 111(2), pp. 319-351.
———. “Using Electoral Cycles in Police Hiring to Estimate the Effect of Police on
Crime.” The American Economic Review. June 1997, 87(3), pp. 270-290. ———. “Why Do Increased Arrest Rates Appear to Reduce Crime: Deterrence,
Incapacitation, or Measurement Error?” Economic Inquiry, 1998a, 36(3), pp. 353-372.
———. “Juvenile Crime and Punishment”, Journal of Political Economy, 1998b, 106:1156-
1185. ——— and Thomas J. Miles. “Empirical Study of Criminal Punishment.” In Handbook
of Law and Economics, vol. 1, edited by A. Mitchell Polinsky and Steven Shavell. 2007. Amsterdam: North-Holland.
Loftin, Colin and David McDowall. “The Deterrent Effects of the Florida Felony Firearm
Law.” The Journal of Criminal Law and Criminology, Spring 1984, 75(1), pp. 250-259.
Maltz, Michael D. and Joseph Targonski. “Making UCR Data Useful and Accessible.”
U.S. Department of Justice. Document 205171. April 2004. Marvell, Thomas B. and Carlisle E. Moody. “The Impact of Enhanced Prison Terms for
Felonies Committed with Guns. Criminology, 1995, 33(2), pp. 247-281. ———. “The Lethal Effects of Three-Strikes Laws.” Journal of Legal Studies, January
2001, 30(1), pp. 89-106. Miles, Thomas and Jens Ludwig. The Silence of the Lambdas: Deterring Incapacitation
Research.” Journal of Quantitative Criminology, 2007, 23:287–301. Nagin, Daniel. “Criminal Deterrence Research at the Outset of the Twenty-First
Century,” Crime and Justice, 1998, Vol. 23, pp. 1–42.

31
Owens, E. G. (2009). More Time, Less Crime? Estimating the Incapacitative Effect of Sentence Enhancements. The Journal of Law and Economics, 52(3), 551-579.
Pogarsky, Greg, Alex Piquero, and Ray Paternoster. “Modeling Change in Perceptions about Sanction Threats: The Neglected Linkage in Deterrence Theory.” Journal of Quantitative Criminology, December 2004, 20(4), pp. 343-369.
Polinsky, A. Mitchell and Steven Shavell. “On the Disutility and Discounting of Imprisonment and the Theory of Deterrence.” Journal of Legal Studies, January 1999, 28(1), pp. 1-16.
Robinson, P. H., & Darley, J. M. “Does Criminal Law Deter? A Behavioural Science
Investigation.” Oxford Journal of Legal Studies, 2004, 24(2), 173-205. Silverman, Dan. “Street Crime and Street Culture.” International Economic Review,
2004, 45(3), pp. 761-786. Tonry, Michael. “Mandatory Penalties.” Crime and Justice, 1992, 16, pp. 243-273. Tunnell, Kenneth D. 1996. “Choosing Crime: Close Your Eyes and Take Your Chances.”
In Criminal Justice in America: Theory, Practice, and Policy, edited by Barry W. Hancock and Paul M. Sharp. Upper Saddle River, NJ.: Prentice-Hall.
Vernick, Jon S. and Lisa M. Hepburn. “State and Federal Gun Laws: Trends for 1970-
99,” in Jens Ludwig, ed., Evaluating Gun Policy: Effects on Crime and Violence, Washington, DC: Brookings Institution Press, 2003.
Waldfogel, Joel. “Criminal Sentences as Endogenous Taxes: Are They ‘Just’ or
‘Efficient’?” Journal of Law and Economics, 1993, Vol. 36, pp. 139-151. Walmsley, Roy. “World Prison Population List.” International Centre for Prison
Studies, 2009. Available at http://www.kcl.ac.uk/depsta/law/research/icps/downloads/wppl-8th_41.pdf.
Webster, Cheryl Marie, Anthony N. Doob, and Franklin E. Zimring. “Proposition 8 and
Crime Rates in California: The Case of the Disappearing Deterrent.” Criminology and Public Policy, 2006, 5(3), pp. 417 – 448.
Wolfers, Justin. “Did Unilateral Divorce Laws Raise Divorce Rates? A Reconciliation
and New Results.” American Economic Review, 2006, 96(5), pp. 1802 – 1820. U.S. Bureau of Justics Statistics. Correctional Populations in the United States. Annual,
Washington, DC: U.S. Bureau of Justice Statistics. ———. Sourcebook of Criminal Justice Statistics. Annual, Washington, DC: U.S.
Bureau of Justice Statistics. ———. Weapons Offenses and Offenders. November 1995, Washington, DC: U.S.
Bureau of Justice Statistics.
32
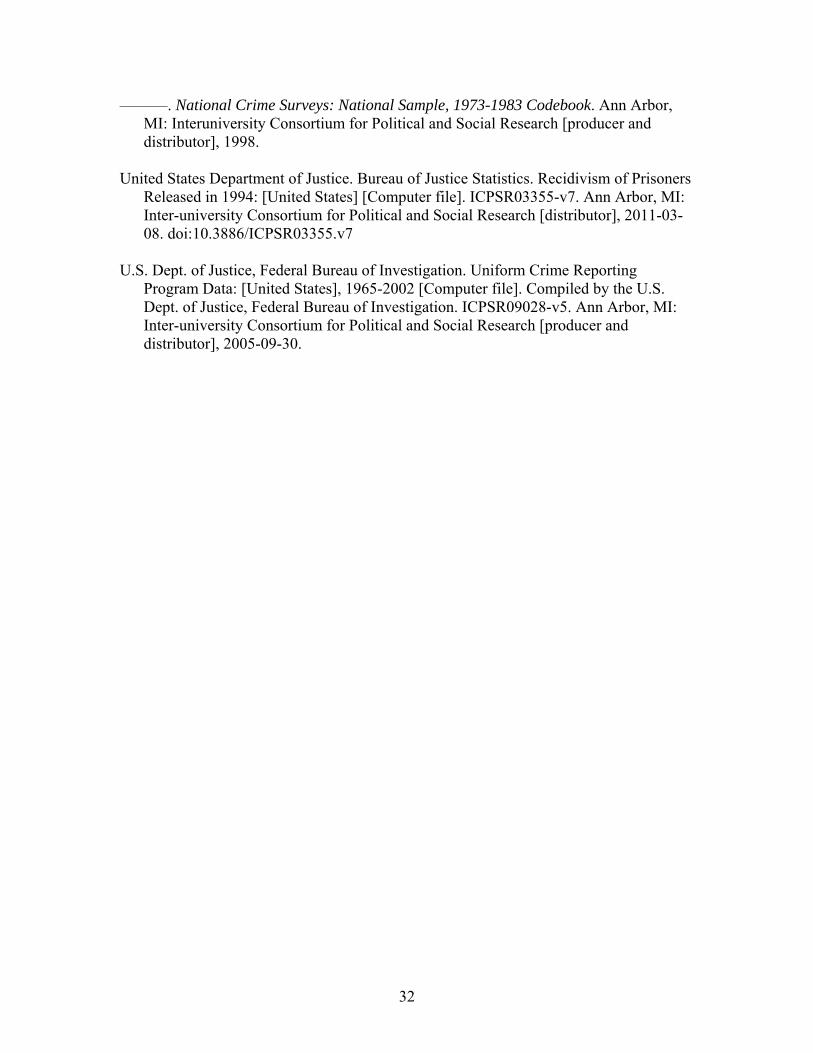
———. National Crime Surveys: National Sample, 1973-1983 Codebook. Ann Arbor, MI: Interuniversity Consortium for Political and Social Research [producer and distributor], 1998.
United States Department of Justice. Bureau of Justice Statistics. Recidivism of Prisoners
Released in 1994: [United States] [Computer file]. ICPSR03355-v7. Ann Arbor, MI: Inter-university Consortium for Political and Social Research [distributor], 2011-03-08. doi:10.3886/ICPSR03355.v7
U.S. Dept. of Justice, Federal Bureau of Investigation. Uniform Crime Reporting
Program Data: [United States], 1965-2002 [Computer file]. Compiled by the U.S. Dept. of Justice, Federal Bureau of Investigation. ICPSR09028-v5. Ann Arbor, MI: Inter-university Consortium for Political and Social Research [producer and distributor], 2005-09-30.

33
Figure 1
Add-on Gun Laws by Date of Enactment
Add-on Law
Repealed (2)Before 1970 (5)1970 or Later (23)Never (20)
34
Figure 2
2000
4000
6000
8000
1000
0
Total O
ffense reports per 100,000 population
5010
015
020
025
030
0
Gun
Rob
bery
rep
orts
per
100
,000
pop
ulat
ion
1965 1970 1975 1980 1985 1990 1995 2000Year
Gun Robbery, Control States Gun Robbery, Add-on States
All Crimes, Control States All Crimes, Add-on States
Data source: FBI Uniform Crime Reports
Crime Rates, 1965 - 2002
Figure 3
0.0
2.0
4.0
6.0
8.1
Den
sity
0 10 20 30 40 50Sentence Length (years)
Minimum Sentence LengthMaximum Sentence Length
Data collected from state statutes by the author
Gun Robbery Sentencing Distribtion Across All States

35
Figure 4
-.4-.2
0.2
.4R
elat
ive
Log
Gun
Rob
bery
Rat
e
-6 -5 -4 -3 -2 -1 0 1 2 3 4 5 6Years since (until) implementation of Add-on Gun Law
No State Trends State trends
All regressions control for state and year fixed effects. For details, see tables.
Gun Robbery Rate Relative to Add-on Gun Law Effective Date
Figure 5
-.4-.2
0.2
.4
Rel
ativ
e L
og G
un R
obbe
ry R
ate
-6 -5 -4 -3 -2 -1 0 1 2 3 4 5 6Years since (until) passage of Add-on Gun Law
No State Trends State trends
All regressions control for state and year fixed effects. For details, see tables.
Gun Robbery Rate Relative to Add-on Gun Law Passage Date
36
State
Add‐on Passage Date
Add‐on Effective Date
Mandatory Minimum
Sentencing Guidelines State
Add‐on Passage Date
Add‐on Effective Date
Mandatory Minimum
Sentencing Guidelines
Alabama None None 5/27/1981 1/1/2004 Montana 5/13/1977 1/1/1978 1/1/1978 NoneAlaska None None 1/1/1980 1/1/1980 Nebraska <1970 <1970 None NoneArizona 5/13/1974 8/9/1974 8/9/1974 None Nevada 5/3/1973 5/3/1973 7/1/1979 NoneArkansas 2/27/1981 6/16/1981 6/16/1981 1/1/1994 New Hampshire 7/5/1977 9/3/1977 9/3/1977 NoneCalifornia <1970 9/9/1953* 1/1/1976* None New Jersey None None 2/12/1981 1/1/2004Colorado 5/10/1976 7/1/1976 7/1/1976 None New Mexico <1970 <1970 <1970 7/1/2003Connecticut 6/8/1993 10/1/1993 10/1/1981 6/21/2010 New York 9/17/1996 11/1/1976 None NoneDelaware 3/29/1973 7/1/1973 7/1/1973 10/1/1987 North Carolina 3/26/1994 3/26/1994 None 10/1/1994Florida 7/3/1974 7/1/1975 10/1/1975 10/1/1983 North Dakota None None 7/1/1977 NoneGeorgia 4/7/1976 7/1/1976 None None Ohio 10/5/1982 1/5/1983 1/5/1983 7/1/1996Hawaii None None 6/7/1976 None Oklahoma <1970 <1970 None NoneIdaho 2/25/1977 7/1/1977 None None Oregon None None 10/2/1979 11/1/1989Illinois None None 2/1/1978 8/25/2009 Pennsylvania None None 6/6/1982 7/1/1982Indiana None None < 1970 None Rhode Island <1970 <1970 None NoneIowa None None 1/1/1978 None South Carolina None None 6/3/1986 NoneKansas None None 7/1/1976 7/1/1993 South Dakota 3/14/1985 4/3/1985 None NoneKentucky None None 6/19/1976 None Tennessee 3/29/1976**7/1/1976 7/1/1976** 11/1/1989Louisiana None None 9/11/1981 1/1/1992 Texas None None 8/29/1977 NoneMaine None None 9/23/1971 None Utah 2/11/1976 5/1/1976 None 1/1/1979Maryland 3/27/1972 6/1/1972 6/1/1972 7/1/1983 Vermont <1970 <1970 None NoneMassachusetts 8/13/1974 4/1/1975 4/1/1975 4/1/1996 Virginia 3/24/1975 10/1/1975 10/1/1975 1/1/1991Michigan 2/11/1976 1/1/1977 1/1/1977 1/1/1984 Washington 3/27/1984 7/1/1984 7/1/1984 7/1/1984Minnesota None None 8/1/1979 5/1/1980 West Virginia None None 6/8/1979 NoneMississippi None None None None Wisconsin None None 3/1/1980 4/25/1984Missouri 6/24/1976 8/13/1976 8/13/1976 3/1/1997 Wyoming 3/8/1979 5/25/1979 None None
Table 1: State Criminal Law Changes
*Effective6/29/1977, Californiarepealed itsadd‐on lawandreplaced itwithonethat didnotaddtothesentence whenpossessionofafirearm isanelement ofthe underlying offense. Thus,Itreat itasnolonger beinginforceforthegun robberies after thisdate. **Tennessee'sadd‐on andmandatory minimumwasstatute repealed effective11/11/1989.Effectivedate reported formandatory minimums.Guidelinedate iseffective date except forConnecticut, Illinois,NewJersey,NewMexico,andWisconsinforwhichdate ofpassage isreported.Datasources: VernickandHepburn (2003), MarvellandMoody(1995), Kauder and Ostrom(2008), Frase(2005) andauthor's ownresearch instatestatutes andlegislativehistories.

37
All years Post‐1974Crime Category Before After Before After Before After Before After
189.0 139.70 218.6 130.7 181.6 141.0 226.2 128.3 151.6 153.0(188.4) (148.5) (204.8) (133) (163.9) (153.1) (200.6) (130.2) (151.2) (153.5)257.8 196.7 273.6 239.7 315.8 215.8 362.8 237.8 198.1 228.9(259.7) (200.3) (275) (204.3) (278.4) (207.2) (300.2) (202.7) (201.8) (214.3)13.37 11.94 15.77 13.21 13.87 12.61 15.71 13.08 14.09 14.64(9.99) (11.6) (11.7) (11.9) (10.02) (12.2) (11.4) (11.8) (10.98) (11.6)39.99 54.87 42.82 51.13 45.38 58.37 46.41 51.18 46.26 53.14(28.4) (56.62) (26.2) (34.6) (29.96) (60.2) (27.4) (34.8) (47.3) (52.3)98.32 122.5 108.5 98.13 113.9 134.5 120.4 97.85 104.8 120.7(91.5) (133.2) (89.2) (90.6) (99.6) (139.9) (99.8) (90.8) (107.5) (116.8)2,957 3,789 3,332 3,550 3,203 3,928 3,540 3,555 3,502 3,876(1327) (1627) (1379) (1724) (1342) (1676) (1447) (1729) (1604) (1583)
Observations 6453 6884 1864 1412 4134 5711 917 1399 6271 4691
Table 2: Reported Crime RatesAdd‐on States Non‐Add‐on States
All years Balanced Panel Post‐1974Post‐1974
Balanced Panel
Larceny
Gun Robbery
Non‐gun Robbery
Murder
Rape
Gun Assault
Note‐ Valuesinthe tablesarereported crimesper100,000 residents. DataisfromtheFBI'sUniformCrime Reports.

38
(1) (2) (3) (4) (5) (6) (7) (8)
‐0.0447 ‐0.0610 ‐0.0477 ‐0.0223 ‐0.0613 ‐0.0661 ‐0.0435 ‐0.0125(0.0591) (0.0386) (0.0310) (0.0193) (0.0654) (0.0460) (0.0267) (0.0217)
‐0.0350 0.00293 ‐0.119 ‐0.128 0.00896 ‐0.0697 ‐0.0704 ‐0.0994
(0.0680) (0.0765) (0.0991) (0.0919) (0.0621) (0.0695) (0.158) (0.103)
‐0.116 ‐0.141** ‐0.110** ‐0.0782** ‐0.136 ‐0.148** ‐0.0958** ‐0.0578*
(0.0656) (0.0413) (0.0336) (0.0191) (0.0733) (0.0485) (0.0247) (0.0221)
‐0.0262 0.0221 ‐0.0981 ‐0.105 0.0226 ‐0.0512 ‐0.0489 ‐0.0930
(0.0673) (0.0730) (0.0963) (0.0910) (0.0606) (0.0650) (0.152) (0.104)
‐0.142 ‐0.173** ‐0.127** ‐0.0903** ‐0.168 ‐0.179** ‐0.108** ‐0.0541*
(0.0776) (0.0524) (0.0406) (0.0245) (0.0859) (0.0612) (0.0300) (0.0244)
‐0.0191 0.0392 ‐0.0956 ‐0.103 0.0350 ‐0.0358 ‐0.0435 ‐0.0964
(0.0661) (0.0676) (0.0958) (0.0907) (0.0582) (0.0585) (0.148) (0.105)
State‐specific time trends n y n y n y n y
Balanced Panel n n y y n n y yRestrict to Post‐1974 n n n n y y y yObservations 15,516 15,516 2,975 2,975 12,979 12,979 2,234 2,234R‐squared 0.168 0.179 0.182 0.190 0.165 0.175 0.182 0.187
Table 3: Impact of Add‐on Gun Laws on Gun Robbery RatesDependant Variable: Log Reported Gun Robberies per 100,000 residents
After add‐on law effective date
After MM law effective date
Two Years
Three Years
One Year
After MM law effective date
After add‐on law effective date
After add‐on law effective date
After MM law effective date
Post‐law change window
Note‐ Thistablereports theimpactofadd‐on gun lawsongunrobbery rateswithinone.twoorthree yearsofthe lawchange. Thedata consistsofagency‐year levelobservations. Standard errors reported inparentheses areclustered atthe stateleveltoallowforintra‐state correlation inerror structure. All specifications include state and year fixed effects. Controlsincludepovertyrate,unemployment rate,racialcomposition,age composition,lagged policepopulation share,andlagged imprisoned population share.*indicatessignificanceatp<0.05**indicatessignificanceatp<0.01

39
Dependant Variable: Log Reported Gun Assaults per 100,000 residentsPost‐law change window
(1) (2) (3) (4) (5) (6) (7) (8)
Post law change ‐0.0360 ‐0.0139 ‐0.0316 ‐0.00181 ‐0.0367 ‐0.0104 ‐0.0355 ‐0.00819(0.0225) (0.0159) (0.0201) (0.0133) (0.0285) (0.0213) (0.0248) (0.0213)
State‐specific time trends n y n y n y n yRestrict to Post‐1974 n n y y n n y yObservations 2,964 2,964 2,223 2,223 2,964 2,964 2,223 2,223R‐squared 0.368 0.372 0.395 0.398 0.368 0.372 0.395 0.398
Two Years Three Years
Table 4: Impact of Add‐on Gun Laws on Gun Assault Rates
Note‐ Thistablereports theimpactofadd‐on gun lawsongunassaultrates withintwoorthree yearsofthelawchange. Thedata consistsofagency‐year levelobservations. Standard errors reported inparentheses areclustered atthe stateleveltoallowforintra‐state correlation inerror structure. Allspecificationsincludestateand yearfixedeffects. Eachspecificationcontains7yearsofdataprior tothelawchange. Controlsincludepovertyrate, unemployment rate,racialcomposition,agecomposition,lagged policepopulation share,andlagged imprisoned population share.*indicatessignificanceatp<0.05**indicatessignificanceatp<0.01

40
Type of Crime(1) (2) (3) (4) (5) (6) (7) (8)
Post law change ‐0.0323 ‐0.0416* ‐0.0559** ‐0.0338 ‐0.0287 ‐0.0229 ‐0.0291* ‐0.0246(0.0301) (0.0196) (0.0150) (0.0188) (0.0171) (0.0127) (0.0111) (0.0147)
State‐specific time trends n y n y n y n yRestrict to Post‐1974 n n y y n n y yObservations 2,911 2,911 2,209 2,209 2,971 2,971 2,230 2,230R‐squared 0.252 0.258 0.232 0.232 0.259 0.268 0.256 0.260
Table 5: Impact of Add‐on Gun Laws on Non‐Gun Robbery and Larceny Rates
Non‐Gun Robberies Larceny
Note‐ Thistablereports theimpactofadd‐on gun lawsonnon‐gun robbery andlarcenyrateswithinthree yearsofthelawchange. Dependant variable isthelogreported crimerate per100,000 residents. Thedata consistsofagency‐year levelobservations. Standard errors reported inparentheses areclustered atthestate leveltoallowforintra‐state correlation inerror structure. Allspecificationsincludestateand yearfixedeffects. Eachspecificationcontains7yearsofdata prior tothelawchange. Controlsincludepovertyrate, unemployment rate,racialcomposition,age composition,lagged policepopulation share,andlagged imprisonedpopulation share.*indicatessignificanceatp<0.05**indicatessignificanceatp<0.01

41
Type of Crime(1) (2) (3) (4) (5) (6) (7) (8)
Post law change ‐0.00672 ‐0.00598 ‐0.00861 ‐0.000418 ‐0.0311 ‐0.0256 ‐0.0312 ‐0.0174(0.0215) (0.0212) (0.0192) (0.0209) (0.0248) (0.0249) (0.0237) (0.0306)
State‐specific time trends n y n y n y n yRestrict to Post‐1974 n n y y n n y yObservations 2,935 2,935 2,216 2,216 2,967 2,967 2,234 2,234R‐squared 0.199 0.205 0.207 0.209 0.168 0.170 0.161 0.163
Table 6: Impact of Add‐on Gun Laws on Rape and Murder Rates
Rape Murder
Note‐ Thistablereports theimpactofadd‐on gun lawsonrape andmurder rateswithinthree yearsofthelawchange. Dependant variable isthelogreported crimerate per100,000 residents. Thedata consistsofagency‐year levelobservations. Standard errors reported inparentheses areclustered atthestate leveltoallowforintra‐state correlation inerror structure.Allspecificationsincludestate andyearfixedeffects. Eachspecificationcontains 7yearsofdata priortothelawchange. Controlsincludepoverty rate,unemployment rate, racialcomposition,agecomposition, lagged policepopulation share,andlagged imprisoned population share.*indicatessignificanceatp<0.05**indicatessignificanceatp<0.01

42
Control Crime(1) (2) (3) (4) (5) (6) (7) (8)
‐0.0802* ‐0.0405 ‐0.0565 ‐0.0238 ‐0.0914* ‐0.0629* ‐0.0719* ‐0.0263(0.0346) (0.0214) (0.0278) (0.0267) (0.0334) (0.0231) (0.0296) (0.0247)
State‐specific time trends n y n y n y n yRestrict to Post‐1974 n n y y n n y y
Observations 2,911 2,911 2,209 2,209 2,971 2,971 2,230 2,230R‐squared 0.523 0.553 0.392 0.409 0.302 0.310 0.287 0.292
Table 7: Triple Difference Impact of Add‐on LawNon‐Gun Robbery Larceny
After add‐on law effective date*gun robbery
Note‐ Thistablereports theimpactofadd‐on gun lawsonthedifference between rates ofgunrobbery andthe controlcrimewithinthree yearsofthelawchange. Dependant variableisthelogreported crimerate per 100,000 residents.Thedata consistsofagency‐year levelobservations. Standard errors reported inparentheses areclustered atthestateleveltoallowforintra‐state correlation inerror structure. Allspecificationsincludestate andyearfixedeffects. Eachspecificationcontains7yearsofdataprior tothelawchange. Controlsincludepovertyrate, unemployment rate,racialcomposition,age composition,lagged policepopulation share,andlagged imprisoned population share.*indicatessignificanceatp<0.05**indicatessignificanceatp<0.01

43
Gun Robbery RatioDependant Variable (1) (2) (3) (4) (5) (6) (7) (8)
‐0.07 ‐0.04 ‐0.08** ‐0.05 ‐0.05 ‐0.07* ‐0.06* ‐0.02Panel A: (0.045) (0.032) (0.025) (0.029) (0.026) (0.029) (0.026) (0.020)
Non‐gun Robberies Observations 1,442 1,442 1,066 1,066 1,469 1,469 1,143 1,143R‐squared 0.383 0.396 0.368 0.370 0.473 0.477 0.420 0.422
‐0.0628** ‐0.0299 ‐0.0513** ‐0.0557** ‐0.00700 ‐0.0237 ‐0.0209 ‐0.00175(0.0181) (0.0180) (0.0147) (0.0169) (0.0189) (0.0160) (0.0145) (0.0159)
Panel B: Observations 1,490 1,490 1,084 1,084 1,481 1,481 1,146 1,146Larcenies R‐squared 0.382 0.389 0.374 0.378 0.470 0.489 0.477 0.483
trends n y n y n y n yRestrict to Post‐1974 n n y y n n y y
Table 8: Test of Generalist Criminal ModelHigh Low
After add‐on law effective date
After add‐on law effective date
Note‐ Thistablereports theimpactofadd‐on gun lawsonthenon‐gun robbery andlarcenyrates withinthree yearsofthe lawchange. Dependant variable isthelogreported crimerate per100,000 residents. Thedata consistsofagency‐year levelobservations andisreported bytheshare ofgunrobberies inanagency relativetothemedian agency. Standard errorsreportedinparentheses areclustered atthestate leveltoallowforintra‐state correlation inerror structure. Allspecificationsincludestateandyearfixedeffects. Each specificationcontains7yearsofdata priortothelawchange. Controls includepovertyrate,unemployment rate,racialcomposition,age composition,lagged policepopulation share,andlagged imprisoned populationshare.*indicatessignificanceatp<0.05**indicatessignificanceatp<0.01