
ESTIMATING THE AMOUNT OF SHIP RECYCLING ...hase/cv/papers4/186Watagawa.pdfESTIMATING THE AMOUNT OF...
5
ESTIMATING THE AMOUNT OF SHIP RECYCLING ACTIVITY USING REMOTE SENSING APPLICATION M. Watagawa a , T. Shinoda b , K. Hasegawa c, a PASCO Corporation, 1-1-2 Higashiyama, Meguro-ku, Tokyo 153-0043, Japan - (maawsa2507)@pasco.co.jp b Graduate School of Engineering, Kyushu University, 744 Motooka, Nishi-ku, Fukuoka-city, 819-0395, Japan c Graduate School of Engineering, Osaka University, 1-2 Yamadaoka, Suita, Osaka 565-0871, Japan Commission VIII, WG VIII/9 KEY WORDS: ALOS, ALOS-2, SAR, Ship Recycling, Remote Sensing ABSTRACT: The Advanced Land Observing Satellite (ALOS) was launched for earth observation and there are more than 6 million scenes of archives including coastal areas during period of five years. The wealth of satellite imagery is noticeable for investigating monitoring methods such as ship detection in wide ocean area. Especially, it is useful way to estimate past behaviour from satellite imagery compared to reference data. We collected satellite imagery and analysis breaking process in ship breaking yards between year 2009 and 2011. Comparing the number of recycling ships by satellite imagery to the total number from world statistics is well understanding capacity of each country. In this study, Remote Sensing Application has been discussed in order to assess the potential to be used for economic activities such as ship recycling. It was used to evaluate the performance of ship recycling monitoring in wide coastal area by Satellite imagery. Additionally, an approach for recognizing ships by SAR imagery regardless of weather conditions is presented. 1. INTRODUCTION Ship recycling is the activity of complete or partially dismantling of a ship at ship breaking yard in order to recover components and materials for reprocessing and re-use. Ship breaking industry has been playing a great role in the economy via providing raw materials to steel industry, shipbuilding industry and some other industries. Ship-breaking industries also generate a number of employment opportunities for developing countries. Some existing problem like safety of worker, health and working environment issues drawing negative picture of this industry for the country (Jobaid, 2014). Moreover, the ship scrapping activities contaminate the coastal soil and sea water environment mainly through the discharge of ammonia, burned oil spill, floatable grease balls and lubricants, metal iron and various other disposable refuse materials together with high turbidity of sea water (Islam, 1986). The Advanced Land Observing Satellite (ALOS) was launched for earth observation and there are more than 6 million scenes of archives including coastal areas during period of five years. The wealth of satellite imagery is noticeable for investigating monitoring methods such as ship detection (Watagawa, 2012). Especially, it is useful way to estimate past behaviour from satellite imagery compared to reference data. In this study, Remote Sensing Application has been discussed in order to assess the potential to be used for economic activities such as ship recycling. 2. SHIP RECYCLING MARKET According to Report (UNCTAD, 2014), total demolitions in 2013 were 20 % lower than in the record year 2012. China and South Asia continue dominating the market for ship recycling, together accounting for 92 % of tonnage demolished in 2013. Bulk carriers accounted for 44 % of the tonnage demolished in 2013, followed by oil tankers (20 %) and container ships (18 %). Bangladesh had its highest market share in dry-bulk carriers (33 %), China in gas carriers (65 %), India in container ships (61 %), and Pakistan in oil tankers (46 %) and offshore vessels (66 %). Figure.1 shows that ship recycling volume by major countries and others from statistics between year 2000 and 2014. It can be seen ship recycling market dominated by major five countries: India, Bangladesh, China, Pakistan and Turky. The authors have focused attention on Satellite imagery to examine estimating ship recycling activity of major ship breaking yards (India and Bangladesh) in the international market. Figure 1. Ship recycling volume of major countries in the international market between year 2000 and 2014, (source of World Casualty Statistics © IHS Global Limited)
-
Upload
vuongkhuong -
Category
Documents
-
view
215 -
download
0
Transcript of ESTIMATING THE AMOUNT OF SHIP RECYCLING ...hase/cv/papers4/186Watagawa.pdfESTIMATING THE AMOUNT OF...
ESTIMATING THE AMOUNT OF SHIP RECYCLING ACTIVITY USING REMOTE SENSING APPLICATION
M. Watagawa a, T. Shinoda b, K. Hasegawa c,
a PASCO Corporation, 1-1-2 Higashiyama, Meguro-ku, Tokyo 153-0043, Japan - (maawsa2507)@pasco.co.jp b Graduate School of Engineering, Kyushu University, 744 Motooka, Nishi-ku, Fukuoka-city, 819-0395, Japan
c Graduate School of Engineering, Osaka University, 1-2 Yamadaoka, Suita, Osaka 565-0871, Japan
Commission VIII, WG VIII/9
KEY WORDS: ALOS, ALOS-2, SAR, Ship Recycling, Remote Sensing ABSTRACT: The Advanced Land Observing Satellite (ALOS) was launched for earth observation and there are more than 6 million scenes of archives including coastal areas during period of five years. The wealth of satellite imagery is noticeable for investigating monitoring methods such as ship detection in wide ocean area. Especially, it is useful way to estimate past behaviour from satellite imagery compared to reference data. We collected satellite imagery and analysis breaking process in ship breaking yards between year 2009 and 2011. Comparing the number of recycling ships by satellite imagery to the total number from world statistics is well understanding capacity of each country. In this study, Remote Sensing Application has been discussed in order to assess the potential to be used for economic activities such as ship recycling. It was used to evaluate the performance of ship recycling monitoring in wide coastal area by Satellite imagery. Additionally, an approach for recognizing ships by SAR imagery regardless of weather conditions is presented.
1. INTRODUCTION
Ship recycling is the activity of complete or partially dismantling of a ship at ship breaking yard in order to recover components and materials for reprocessing and re-use. Ship breaking industry has been playing a great role in the economy via providing raw materials to steel industry, shipbuilding industry and some other industries. Ship-breaking industries also generate a number of employment opportunities for developing countries. Some existing problem like safety of worker, health and working environment issues drawing negative picture of this industry for the country (Jobaid, 2014). Moreover, the ship scrapping activities contaminate the coastal soil and sea water environment mainly through the discharge of ammonia, burned oil spill, floatable grease balls and lubricants, metal iron and various other disposable refuse materials together with high turbidity of sea water (Islam, 1986). The Advanced Land Observing Satellite (ALOS) was launched for earth observation and there are more than 6 million scenes of archives including coastal areas during period of five years. The wealth of satellite imagery is noticeable for investigating monitoring methods such as ship detection (Watagawa, 2012). Especially, it is useful way to estimate past behaviour from satellite imagery compared to reference data. In this study, Remote Sensing Application has been discussed in order to assess the potential to be used for economic activities such as ship recycling.
2. SHIP RECYCLING MARKET
According to Report (UNCTAD, 2014), total demolitions in 2013 were 20 % lower than in the record year 2012. China and South Asia continue dominating the market for ship recycling, together accounting for 92 % of tonnage demolished in 2013. Bulk carriers accounted for 44 % of the tonnage demolished in 2013, followed by oil tankers (20 %) and container ships (18 %).
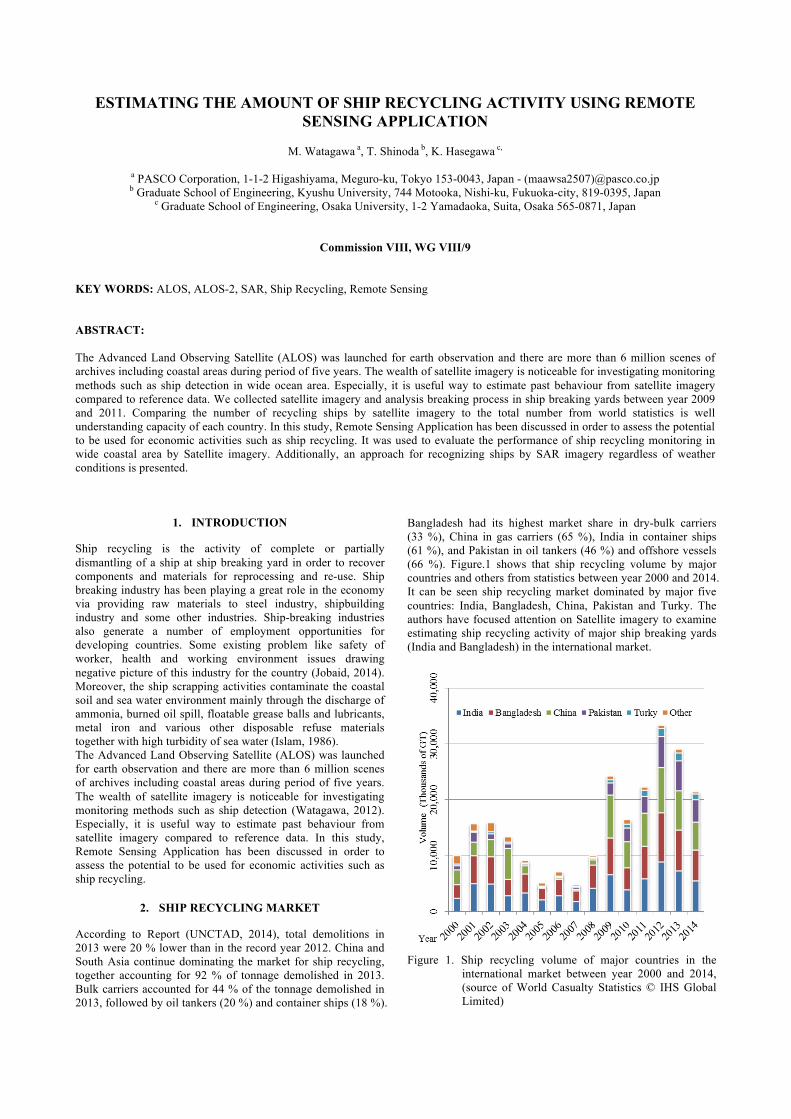
Bangladesh had its highest market share in dry-bulk carriers (33 %), China in gas carriers (65 %), India in container ships (61 %), and Pakistan in oil tankers (46 %) and offshore vessels (66 %). Figure.1 shows that ship recycling volume by major countries and others from statistics between year 2000 and 2014. It can be seen ship recycling market dominated by major five countries: India, Bangladesh, China, Pakistan and Turky. The authors have focused attention on Satellite imagery to examine estimating ship recycling activity of major ship breaking yards (India and Bangladesh) in the international market.
Figure 1. Ship recycling volume of major countries in the
international market between year 2000 and 2014, (source of World Casualty Statistics © IHS Global Limited)
3. METHODOLOGY
This study proposes a methodology of recycling ships identification in breaking yards by analysis ALOS imagery. We collected time-series ALOS imagery over ship breaking area of major country, India and Bangladesh. In this chapter, our study area, and ALOS imagery are introduced. 3.1 Major Ship Breaking Yards
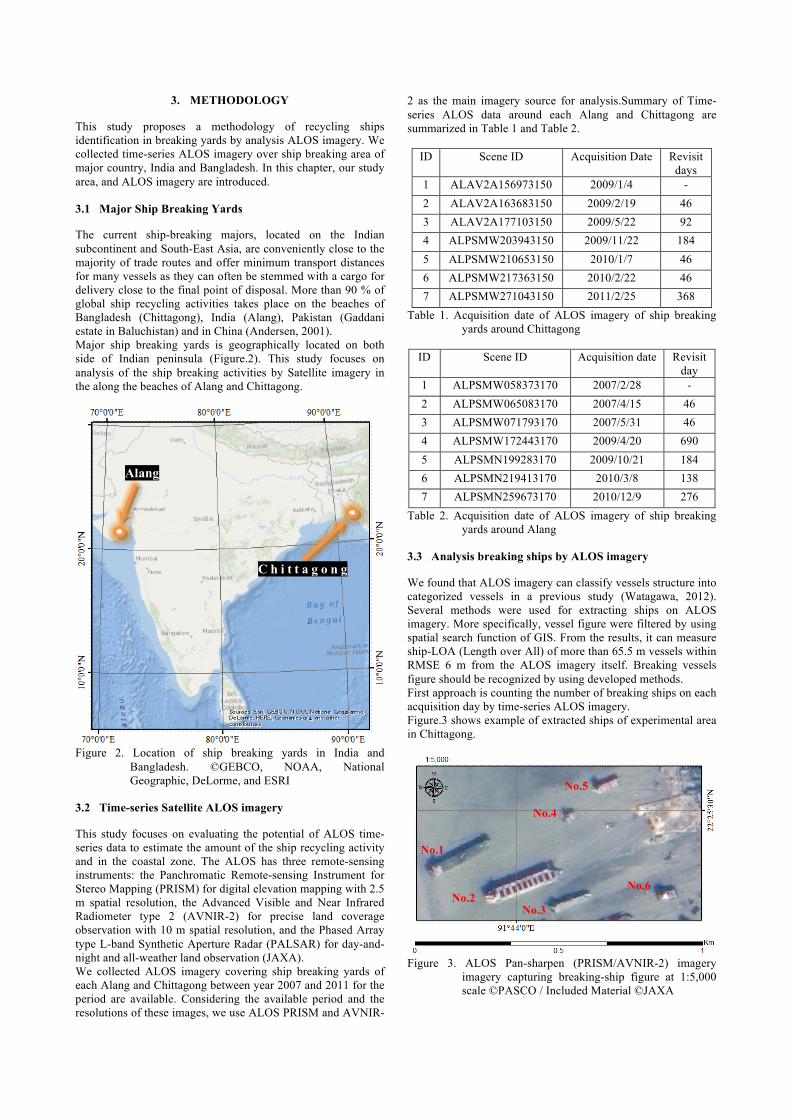
The current ship-breaking majors, located on the Indian subcontinent and South-East Asia, are conveniently close to the majority of trade routes and offer minimum transport distances for many vessels as they can often be stemmed with a cargo for delivery close to the final point of disposal. More than 90 % of global ship recycling activities takes place on the beaches of Bangladesh (Chittagong), India (Alang), Pakistan (Gaddani estate in Baluchistan) and in China (Andersen, 2001). Major ship breaking yards is geographically located on both side of Indian peninsula (Figure.2). This study focuses on analysis of the ship breaking activities by Satellite imagery in the along the beaches of Alang and Chittagong.
Figure 2. Location of ship breaking yards in India and
Bangladesh. ©GEBCO, NOAA, National Geographic, DeLorme, and ESRI
3.2 Time-series Satellite ALOS imagery
This study focuses on evaluating the potential of ALOS time-series data to estimate the amount of the ship recycling activity and in the coastal zone. The ALOS has three remote-sensing instruments: the Panchromatic Remote-sensing Instrument for Stereo Mapping (PRISM) for digital elevation mapping with 2.5 m spatial resolution, the Advanced Visible and Near Infrared Radiometer type 2 (AVNIR-2) for precise land coverage observation with 10 m spatial resolution, and the Phased Array type L-band Synthetic Aperture Radar (PALSAR) for day-and-night and all-weather land observation (JAXA). We collected ALOS imagery covering ship breaking yards of each Alang and Chittagong between year 2007 and 2011 for the period are available. Considering the available period and the resolutions of these images, we use ALOS PRISM and AVNIR-
2 as the main imagery source for analysis.Summary of Time-series ALOS data around each Alang and Chittagong are summarized in Table 1 and Table 2.
ID Scene ID Acquisition Date Revisit days
1 ALAV2A156973150 2009/1/4 - 2 ALAV2A163683150 2009/2/19 46 3 ALAV2A177103150 2009/5/22 92 4 ALPSMW203943150 2009/11/22 184 5 ALPSMW210653150 2010/1/7 46 6 ALPSMW217363150 2010/2/22 46 7 ALPSMW271043150 2011/2/25 368
Table 1. Acquisition date of ALOS imagery of ship breaking yards around Chittagong
ID Scene ID Acquisition date Revisit
day 1 ALPSMW058373170 2007/2/28 - 2 ALPSMW065083170 2007/4/15 46 3 ALPSMW071793170 2007/5/31 46 4 ALPSMW172443170 2009/4/20 690 5 ALPSMN199283170 2009/10/21 184 6 ALPSMN219413170 2010/3/8 138 7 ALPSMN259673170 2010/12/9 276
Table 2. Acquisition date of ALOS imagery of ship breaking yards around Alang
3.3 Analysis breaking ships by ALOS imagery
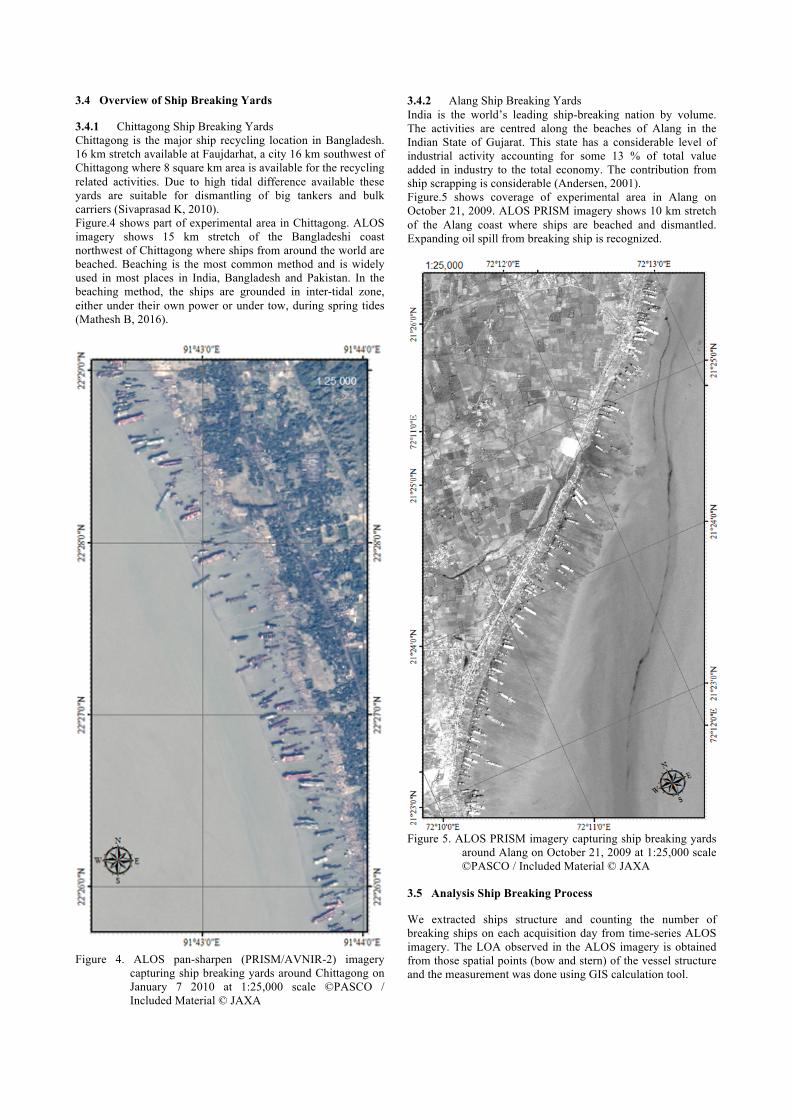
We found that ALOS imagery can classify vessels structure into categorized vessels in a previous study (Watagawa, 2012). Several methods were used for extracting ships on ALOS imagery. More specifically, vessel figure were filtered by using spatial search function of GIS. From the results, it can measure ship-LOA (Length over All) of more than 65.5 m vessels within RMSE 6 m from the ALOS imagery itself. Breaking vessels figure should be recognized by using developed methods. First approach is counting the number of breaking ships on each acquisition day by time-series ALOS imagery. Figure.3 shows example of extracted ships of experimental area in Chittagong.
Figure 3. ALOS Pan-sharpen (PRISM/AVNIR-2) imagery
imagery capturing breaking-ship figure at 1:5,000 scale ©PASCO / Included Material ©JAXA
C h i t t a g o n g
Alang
No.1
No.2 No.3
No.4
No.5
No.6
3.4 Overview of Ship Breaking Yards
3.4.1 Chittagong Ship Breaking Yards Chittagong is the major ship recycling location in Bangladesh. 16 km stretch available at Faujdarhat, a city 16 km southwest of Chittagong where 8 square km area is available for the recycling related activities. Due to high tidal difference available these yards are suitable for dismantling of big tankers and bulk carriers (Sivaprasad K, 2010). Figure.4 shows part of experimental area in Chittagong. ALOS imagery shows 15 km stretch of the Bangladeshi coast northwest of Chittagong where ships from around the world are beached. Beaching is the most common method and is widely used in most places in India, Bangladesh and Pakistan. In the beaching method, the ships are grounded in inter-tidal zone, either under their own power or under tow, during spring tides (Mathesh B, 2016).
Figure 4. ALOS pan-sharpen (PRISM/AVNIR-2) imagery
capturing ship breaking yards around Chittagong on January 7 2010 at 1:25,000 scale ©PASCO / Included Material © JAXA
3.4.2 Alang Ship Breaking Yards India is the world’s leading ship-breaking nation by volume. The activities are centred along the beaches of Alang in the Indian State of Gujarat. This state has a considerable level of industrial activity accounting for some 13 % of total value added in industry to the total economy. The contribution from ship scrapping is considerable (Andersen, 2001). Figure.5 shows coverage of experimental area in Alang on October 21, 2009. ALOS PRISM imagery shows 10 km stretch of the Alang coast where ships are beached and dismantled. Expanding oil spill from breaking ship is recognized.
Figure 5. ALOS PRISM imagery capturing ship breaking yards
around Alang on October 21, 2009 at 1:25,000 scale ©PASCO / Included Material © JAXA
3.5 Analysis Ship Breaking Process
We extracted ships structure and counting the number of breaking ships on each acquisition day from time-series ALOS imagery. The LOA observed in the ALOS imagery is obtained from those spatial points (bow and stern) of the vessel structure and the measurement was done using GIS calculation tool.
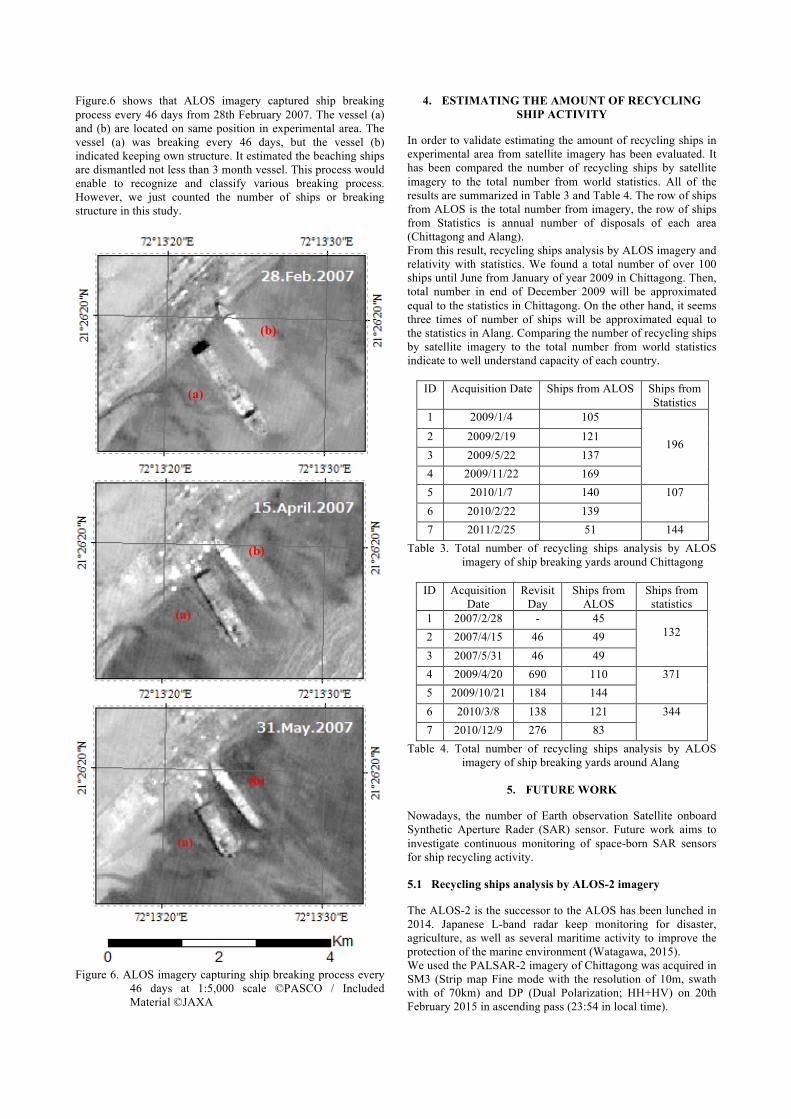
Figure.6 shows that ALOS imagery captured ship breaking process every 46 days from 28th February 2007. The vessel (a) and (b) are located on same position in experimental area. The vessel (a) was breaking every 46 days, but the vessel (b) indicated keeping own structure. It estimated the beaching ships are dismantled not less than 3 month vessel. This process would enable to recognize and classify various breaking process. However, we just counted the number of ships or breaking structure in this study.
Figure 6. ALOS imagery capturing ship breaking process every
46 days at 1:5,000 scale ©PASCO / Included Material ©JAXA
4. ESTIMATING THE AMOUNT OF RECYCLING SHIP ACTIVITY
In order to validate estimating the amount of recycling ships in experimental area from satellite imagery has been evaluated. It has been compared the number of recycling ships by satellite imagery to the total number from world statistics. All of the results are summarized in Table 3 and Table 4. The row of ships from ALOS is the total number from imagery, the row of ships from Statistics is annual number of disposals of each area (Chittagong and Alang). From this result, recycling ships analysis by ALOS imagery and relativity with statistics. We found a total number of over 100 ships until June from January of year 2009 in Chittagong. Then, total number in end of December 2009 will be approximated equal to the statistics in Chittagong. On the other hand, it seems three times of number of ships will be approximated equal to the statistics in Alang. Comparing the number of recycling ships by satellite imagery to the total number from world statistics indicate to well understand capacity of each country.
ID Acquisition Date Ships from ALOS Ships from Statistics
1 2009/1/4 105
196 2 2009/2/19 121 3 2009/5/22 137 4 2009/11/22 169 5 2010/1/7 140 107 6 2010/2/22 139 7 2011/2/25 51 144
Table 3. Total number of recycling ships analysis by ALOS imagery of ship breaking yards around Chittagong
ID Acquisition
Date Revisit
Day Ships from
ALOS Ships from statistics
1 2007/2/28 - 45 132 2 2007/4/15 46 49
3 2007/5/31 46 49 4 2009/4/20 690 110 371 5 2009/10/21 184 144 6 2010/3/8 138 121 344 7 2010/12/9 276 83
Table 4. Total number of recycling ships analysis by ALOS imagery of ship breaking yards around Alang
5. FUTURE WORK
Nowadays, the number of Earth observation Satellite onboard Synthetic Aperture Rader (SAR) sensor. Future work aims to investigate continuous monitoring of space-born SAR sensors for ship recycling activity. 5.1 Recycling ships analysis by ALOS-2 imagery
The ALOS-2 is the successor to the ALOS has been lunched in 2014. Japanese L-band radar keep monitoring for disaster, agriculture, as well as several maritime activity to improve the protection of the marine environment (Watagawa, 2015). We used the PALSAR-2 imagery of Chittagong was acquired in SM3 (Strip map Fine mode with the resolution of 10m, swath with of 70km) and DP (Dual Polarization; HH+HV) on 20th February 2015 in ascending pass (23:54 in local time).
(a)
(b)
(a)
(b)
(a)
(b)
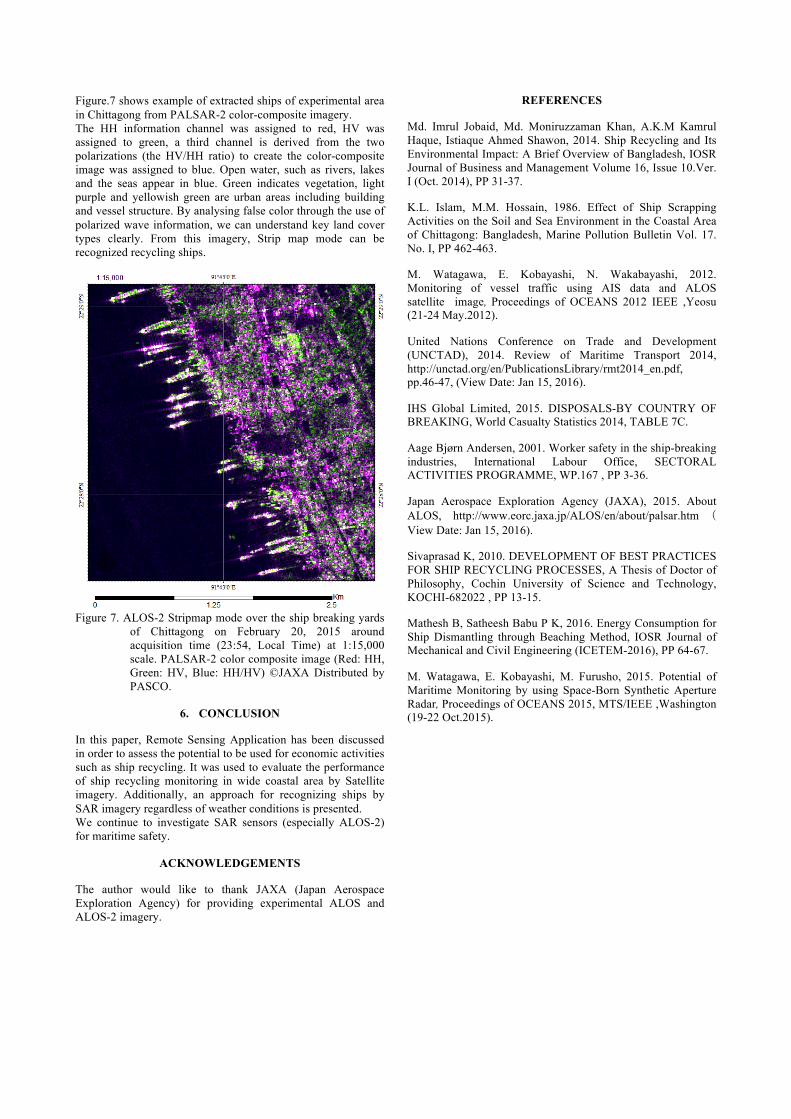
Figure.7 shows example of extracted ships of experimental area in Chittagong from PALSAR-2 color-composite imagery. The HH information channel was assigned to red, HV was assigned to green, a third channel is derived from the two polarizations (the HV/HH ratio) to create the color-composite image was assigned to blue. Open water, such as rivers, lakes and the seas appear in blue. Green indicates vegetation, light purple and yellowish green are urban areas including building and vessel structure. By analysing false color through the use of polarized wave information, we can understand key land cover types clearly. From this imagery, Strip map mode can be recognized recycling ships.
Figure 7. ALOS-2 Stripmap mode over the ship breaking yards
of Chittagong on February 20, 2015 around acquisition time (23:54, Local Time) at 1:15,000 scale. PALSAR-2 color composite image (Red: HH, Green: HV, Blue: HH/HV) ©JAXA Distributed by PASCO.
6. CONCLUSION
In this paper, Remote Sensing Application has been discussed in order to assess the potential to be used for economic activities such as ship recycling. It was used to evaluate the performance of ship recycling monitoring in wide coastal area by Satellite imagery. Additionally, an approach for recognizing ships by SAR imagery regardless of weather conditions is presented. We continue to investigate SAR sensors (especially ALOS-2) for maritime safety.
ACKNOWLEDGEMENTS
The author would like to thank JAXA (Japan Aerospace Exploration Agency) for providing experimental ALOS and ALOS-2 imagery.
REFERENCES
Md. Imrul Jobaid, Md. Moniruzzaman Khan, A.K.M Kamrul Haque, Istiaque Ahmed Shawon, 2014. Ship Recycling and Its Environmental Impact: A Brief Overview of Bangladesh, IOSR Journal of Business and Management Volume 16, Issue 10.Ver. I (Oct. 2014), PP 31-37.
K.L. Islam, M.M. Hossain, 1986. Effect of Ship Scrapping Activities on the Soil and Sea Environment in the Coastal Area of Chittagong: Bangladesh, Marine Pollution Bulletin Vol. 17. No. I, PP 462-463.
M. Watagawa, E. Kobayashi, N. Wakabayashi, 2012. Monitoring of vessel traffic using AIS data and ALOS satellite image, Proceedings of OCEANS 2012 IEEE ,Yeosu (21-24 May.2012).
United Nations Conference on Trade and Development (UNCTAD), 2014. Review of Maritime Transport 2014, http://unctad.org/en/PublicationsLibrary/rmt2014_en.pdf, pp.46-47, (View Date: Jan 15, 2016).
IHS Global Limited, 2015. DISPOSALS-BY COUNTRY OF BREAKING, World Casualty Statistics 2014, TABLE 7C.
Aage Bjørn Andersen, 2001. Worker safety in the ship-breaking industries, International Labour Office, SECTORAL ACTIVITIES PROGRAMME, WP.167 , PP 3-36.
Japan Aerospace Exploration Agency (JAXA), 2015. About ALOS, http://www.eorc.jaxa.jp/ALOS/en/about/palsar.htm (View Date: Jan 15, 2016).
Sivaprasad K, 2010. DEVELOPMENT OF BEST PRACTICES FOR SHIP RECYCLING PROCESSES, A Thesis of Doctor of Philosophy, Cochin University of Science and Technology, KOCHI-682022 , PP 13-15.
Mathesh B, Satheesh Babu P K, 2016. Energy Consumption for Ship Dismantling through Beaching Method, IOSR Journal of Mechanical and Civil Engineering (ICETEM-2016), PP 64-67.
M. Watagawa, E. Kobayashi, M. Furusho, 2015. Potential of Maritime Monitoring by using Space-Born Synthetic Aperture Radar, Proceedings of OCEANS 2015, MTS/IEEE ,Washington (19-22 Oct.2015).


