Estimating Secondary Subsidence in an Organic Soil
32
ESTIMATING PRIMARY AND SECONDARY SUBSIDENCE IN AN ORGANIC SOIL 15, 20, AND 30 YEARS AFTER DRAINAGE Abstract: Wetland hydrology is being restored to Juniper Bay, a drained Carolina bay wetland in Robeson County, North Carolina that was drained for agriculture 30 years ago. It was hypothesized that the surface of the original water table could be estimated from the elevation of the organic soils before subsidence. No elevation data existed prior to drainage so a method of estimating the amounts of primary and secondary subsidence in organic soil was developed. The method to estimate primary subsidence was based on changes in bulk density as water is removed and the soil settles. Secondary subsidence was estimated from accumulation of a stable soil constituent (sand percentage) in the surface horizon and changes in bulk density as the soil oxidizes. Total subsidence was the sum of secondary and primary subsidence. Bulk density, particle size data, and organic carbon data were gathered from locations in Juniper bay and three undrained Carolina bays. Juniper Bay was drained with a network of ditches in three stages, 15, 20, and 30 years ago. The average total subsidence was 75, 77, and 86 cm after 15, 20, and 30 years of drainage. The proportions of primary and secondary subsidence were approximately equal. It was expected that primary subsidence would have been a higher proportions of the total subsidence however; the occurrence of fire would have increased the amount estimated for secondary subsidence. The average primary subsidence was estimated to be 34, 43, and 41 cm after 15, 20, and 30 years of drainage, with a secondary subsidence of 41, 33, and 46 cm. The average rate of primary subsidence was 3.9 cm yr -1 , and an average rate of secondary subsidence of 2.0 cm yr -1 . Subsidence values were variable across Juniper bay and the amount of subsidence was not 56
Transcript of Estimating Secondary Subsidence in an Organic Soil

ESTIMATING PRIMARY AND SECONDARY SUBSIDENCE IN AN ORGANIC
SOIL 15, 20, AND 30 YEARS AFTER DRAINAGE
Abstract: Wetland hydrology is being restored to Juniper Bay, a drained Carolina bay
wetland in Robeson County, North Carolina that was drained for agriculture 30 years ago. It
was hypothesized that the surface of the original water table could be estimated from the
elevation of the organic soils before subsidence. No elevation data existed prior to drainage
so a method of estimating the amounts of primary and secondary subsidence in organic soil
was developed. The method to estimate primary subsidence was based on changes in bulk
density as water is removed and the soil settles. Secondary subsidence was estimated from
accumulation of a stable soil constituent (sand percentage) in the surface horizon and
changes in bulk density as the soil oxidizes. Total subsidence was the sum of secondary and
primary subsidence. Bulk density, particle size data, and organic carbon data were gathered
from locations in Juniper bay and three undrained Carolina bays. Juniper Bay was drained
with a network of ditches in three stages, 15, 20, and 30 years ago. The average total
subsidence was 75, 77, and 86 cm after 15, 20, and 30 years of drainage. The proportions of
primary and secondary subsidence were approximately equal. It was expected that primary
subsidence would have been a higher proportions of the total subsidence however; the
occurrence of fire would have increased the amount estimated for secondary subsidence. The
average primary subsidence was estimated to be 34, 43, and 41 cm after 15, 20, and 30 years
of drainage, with a secondary subsidence of 41, 33, and 46 cm. The average rate of primary
subsidence was 3.9 cm yr-1, and an average rate of secondary subsidence of 2.0 cm yr-1.
Subsidence values were variable across Juniper bay and the amount of subsidence was not
56

related to location at the crest of a field or near a ditch. Restoration of the hydrology in
Juniper Bay to pre-drainage water table elevations could result in a water table that is above
the soil surface, which does not meet the criteria for a successful restoration.
57

INTRODUCTION
Organic soils form by the accumulation of plant debris under anaerobic conditions.
Most organic soils occur in areas that are saturated for much of the year, because the
saturation maintains an anaerobic condition that retards decomposition (Everett, 1983). Glaz
(1995) suggested that annual durations of saturation required for organic soil accumulation
range from 15 to 94%. Once drained for agriculture, the surface of an organic soil decreases
in elevation over time. Processes responsible for decrease include both primary subsidence
and secondary subsidence (Everett, 1983). As shown in Fig. 3.1, primary subsidence is a
relatively rapid process that results from a loss of buoyant force that causes the soil to sink
under its own weight. Secondary subsidence is slower and is caused by decomposition of the
organic debris as well as shrinkage.
Studies of organic soil subsidence have shown that the rates of primary and secondary
subsidence are related to the original thickness of the soil, depth to water table (Stephens,
1956), mineral content (Slusher et al., 1974), temperature, precipitation, and management
practices (Shih et al., 1998). Subsidence has been determined using benchmarks and
surveying techniques before and after drainage has occurred (Stephens, 1954; Shih et al.,
1998; Millette, 1976). Mathur et al. (1982) conducted an in-depth analysis of organic
deposits from drained and undrained areas to establish a time sequence through the soil
pedon with pollen at each location. Unique pollen types or elevated levels of pollen seen in
all locations were used as chronological markers. The differences in the depths of the
chronological markers were then used to estimate subsidence. They found that the rate of
subsidence to be 6 cm yr-1 after 5 years and 3.67 cm yr-1 after 15 years. This method
includes the effect of clearing in addition to settling and oxidation, and there is no way to
58
separate primary and secondary subsidence. In addition a thorough knowledge of pollen
analysis would be required. Dolman and Buol (1967) estimated subsidence in an area in
North Carolina that was drained for 50 years but not farmed to be 57.5 cm or 1.2 cm yr-1
using the “one third thickness loss upon drying rule,” i.e. subsidence is estimated to be one
third of the original thickness. They extrapolated this over nearby agricultural areas and
found that estimated subsidence rates ranged from 1.8 to 3.54 cm yr-1, based on depth to
mineral layer, with the shallower organic having the higher rate. This method is crude and
cannot account for fire.
Several methods have been developed to control subsidence through water and land
management. Levesque and Mathur (1984) have shown that additions of copper reduce the
rate of subsidence by inhibiting soil enzymes that control the rate of oxidation of organic
matter. Covering the surface with mineral material to slow diffusion of oxygen has also been
tried with some success (Slusher et al., 1974). Keeping the amount of water in the peat to
less than 50% or greater than 80% can slow decomposition (Stephens, 1956). Maintaining a
high water table also reduces subsidence (Shih et al., 1998). Brooks and Lowe (1984)
predicted that saturation for 60% of the year would slow subsidence of the soils of the Upper
St. Johns River in Florida.
Wetland restoration projects frequently plug the ditches of drained agricultural fields
and plant trees to recreate original conditions. In areas where organic soils have subsided, it
is possible that ditch plugging will raise the level of groundwater above the soil surface.
Fennema et al. (1994) predicted that the Everglades Agricultural Area (EAA) would be
flooded for up to 360 days a year if man-made structures were removed, because the present
surface elevation is 1.5 m below the original elevation. In extreme cases this may kill the
59

newly planted vegetation before it has become established. We hypothesized that if the
amount of subsidence could be estimated before ditches were plugged, then the potential
problem of too great a water table rise following plugging might be avoided.
Estimating the amount of subsidence that has occurred will vary from site to site
because it depends on average water table depth, soil temperature, and also on historical land
treatments that were used to prepare the land for agriculture. Such treatments include, in
addition to drainage, tree removal, crowning of fields, and stockpiling and burning debris
(Lilly, 1981). The objective of this work was to estimate the level of primary and secondary
subsidence that occurred in an organic soil following drainage and agricultural use at selected
points across the organic soil.
MATERIALS AND METHODS
Theory and Assumptions
A hypothetical organic soil profile that has undergone both primary and secondary
subsidence has two distinctly different organic soil horizons (Fig. 3.2). An Oap horizon has
been plowed for agriculture and its strong granular soil structure results from shrinkage,
oxidation, and tillage. Drying and shrinkage creates soil structure in the form of well-defined
aggregates separated by large cracks (Pons and Zonneveld, 1965 and Lee and Manoch,
1974). This layer is black in color, which apparently results from oxidation of organic
materials. The underlying Oa horizon is below the tillage zone. It has a massive soil
structure and shows no evidence of shrinkage and drying. It may have a redder color than
that of the Oap horizon, and is massive in structure because no shrinkage occurred to create
cracks. The Cg horizon is mineral soil material and is not of interest in this study.
60

We assumed that the Oa horizon in Juniper Bay experienced primary subsidence but
minimal secondary subsidence as evident by it’s near massive structure. The Oap horizon
was affected by both primary and secondary subsidence as evident by its strong granular
structure. It was clearly within the depth of plowing and could be easily distinguished from
the underlying organic material.
Method for Estimating Primary Subsidence
Primary subsidence occurs following drainage when the organic material settles under
its own weight and compresses (Fig. 3.3). Volume is reduced by a reduction of pore space.
There is no loss of organic material. The thickness of the organic soil layer decreases as it
subsides causing bulk density to increase. This change in bulk density before and after
drainage can be used to calculate the change in thickness of the organic soil material as a
result of primary subsidence.
Loss through primary subsidence was estimated for a volume of organic soil that had
a unit cross-sectional area and a height that included the entire thickness of the organic soil
material. The volume of the original organic soil (Vo) was computed as:
Vo = To ( 1cm2) (1)
where To is the thickness of the original organic soil material. The volume of the existing
soil (Vps) after primary subsidence was computed as:
Vps = Tps (1cm2) (2)
The mass of the organic soil material before primary subsidence (Mo) was equal to the mass
of the soil after primary subsidence (Mps). The reduction in volume following primary
subsidence occurred only by a decrease in the thickness of the original soil volume (To). The
cross-sectional area of the soil does not changed during primary subsidence.
61

The bulk density of the original soil (Do) is computed as:
Do = Mo / Vo = Mo /( To (1cm x 1cm)) (3)
The bulk density for the soil after primary subsidence is computed as:
Dps = Mps / Vps = Mps / (Tps (1cm x 1cm)) (4)
The ratio of Dps and Do is related to the ratio of the thickness of the soil layers:
Dps / Do = [Mps / Tps (1cm x 1cm)] / [Mo / To (1cm x 1cm)] = To / Tps (5)
because we assumed that Mps = Mo. The thickness of the original organic soil material (To)
can be estimated as:
To = Tps [Dps / Do] (6)
This gives us the original thickness of the organic soil. The amount of primary
subsidence (Sps) that has occurred is the difference between the thickness.
Sps = To – Tps (7)
We evaluate similar organic types of soils, e.g., sapric, between the original
soil and the soil after primary subsidence because of the inherent difference in bulk
density between fibric, histic, and sapric material. In making these calculations, we
assume that the sapric material in the profile subsides to a uniform bulk density. To
make this calculation we measured Dps and Tps in the organic soil that has subsided.
A value for Do was obtained by sampling undrained organic soil that contains natural
vegetation.
Method for Estimating Secondary Subsidence
While organic soils form by the accumulation of organic materials, they usually
contain small amounts of sand and silt deposited by wind and water. The sand and silt
62

consist primarily of quartz, which is a mineral that does not weather or alter over short time
periods of less than 1000 years or so (Buol et al., 2003). Sand particles found in the organic
material will be used in estimating secondary subsidence, while changes in bulk density will
be used in calculating primary subsidence. Changes in subsidence of an organic soil
following drainage will be discussed using a volume of undrained soil that has a cross
sectional area of 1 cm2. It is assumed that this area remains constant during subsidence, and
the volume decrease occurs only through a decrease in thickness.
We used a method described by Brewer (1976) to estimate the amount of secondary
subsidence. Brewer (1976) estimated the soil volume lost when primary minerals weather.
While he applied the technique for the weathering of mineral materials, we adapted it for the
decomposition of organic material. Two soil volumes must be compared, the parent material
or unoxidized organic soil (Vpm), and a volume of oxidized soil (Vs). As the parent material
weathers it loses both volume and mass. Some crystalline minerals dissolve, some turn to
clay, but some resist weathering and remain unchanged. As weathering proceeds, the
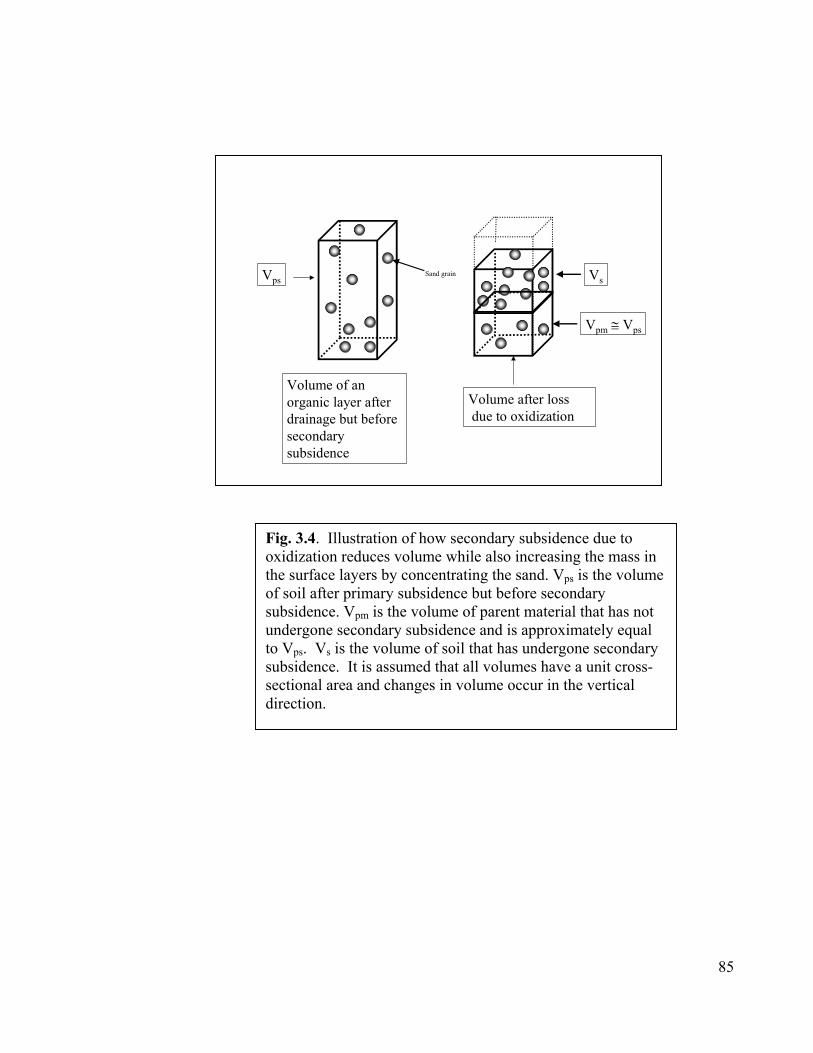
resistant minerals increase in concentration relative to the concentration in the original
material (Fig. 3.4). This relationship is described as:
VsDsRs = VpmDpmRpm (8)
where Vs = volume of present day soil
Ds = bulk density of present day soil horizon,
Rs= percentage by weight of the stable constituent in present day soil horizon,
Vpm= volume of parent material from which soil was derived,
Dpm = bulk density of parent material, and
Rpm= percentage by weight of the stable constituent in the parent material.
63

Changes in the thickness of a horizon can be calculated by assuming that the change in
volume through weathering occurs only in the vertical dimension and the cross-sectional area
of the soil remains constant. When a soil mass shrinks, it appears that the shrinkage occurs
in all dimensions, however, in the horizontal dimension the shrinkage creates voids, and
these voids are part of the soil volume (Fig. 3.5). As a result, the soil’s cross-sectional area is
remains constant throughout the weathering process because solid material is replaced by
voids. The voids can be filled by the rearrangement of soil aggregates or particles. The
change in volume that occurs through secondary subsidence occurs through a decrease in the
thickness of the soil horizon (Ts):
Vs = Ts (1cm2) (9)
and the same can be said for Vpm and thickness of the original parent material (Tpm).
Equation 8 can then be arranged to calculate Tpm.
Tpm = Ts x (DsRs / DpmRpm) (10)
Secondary subsidence (Ss) would be equal to the difference in the thickness of the parent
horizon and the present soil horizon.
Ss = Tpm – Ts (11)
We used the underlying sapric material, which has undergone primary subsidence
only, as the parent material and used the percent sand in the organic soil as the stable
constituent. We assumed that the current surface horizons formed from material similar to
that of the underlying sapric material. We also assumed that the water table has been
maintained at a level to prevent a significant loss of the parent material due to oxidization.
We realize that there are many environmental, vegetative, and meteorological situations that
factor into the deposition of sand into the organic material. However, we assume that over
64

time, sand that is deposited through erosion or wind would be relatively constant and would
result in a relatively constant distribution through the profile. Sand deposition that is
deposited episodically would be homogenized through the profile over time by tree throw
and bioturbation. We feel that such an assumption is valid after examining sand percentages
through organic profiles in natural Carolina bays. Sand percentages varied by less than 5%
through the sapric part of the organic profiles.
Sample Calculations for Primary Subsidence
Data from one location in the drained Carolina bay (Table 3.1) will be used to
illustrate the calculations. Do from samples from the organic sapric soils in the natural bays
and found it to be 0.25 g cm-3. The Dps from the subsided soils was determined to be 0.45
g cm-3 in the Oa4 horizon. We also chose the lowest bulk density since we assume any
difference in bulk density greater than the lowest is due to secondary subsidence. Tps is equal
to the depth, from the surface, of the horizon with the lowest bulk density. Horizon Oa4
extends to a depth of 66cm. Therefore, using equation 4:
To = 66 cm [0.45 g cm-3 / 0.25 g cm-3 ] = 119 cm
Sp = 119 cm – 66 cm = 53 cm
This gives us an original thickness of 119 cm and a primary subsidence of 53 cm. The length
of time for primary subsidence to occur varies, and since we have no data to suggest how
long it took for primary subsidence to occur, we chose 10 years. This would give us a
primary subsidence rate of 5.3 cm yr-1 during the first 10 years.
Sample Calculations for Secondary Subsidence
Using the data in Table 3.1 for calculating secondary subsidence, the organic horizon
that had the lowest sand percentage was determined to be the “parent” horizon from which
65
the horizons above were formed. For the example, the Oa4 horizon is the parent material,
and Oa3 is the soil material. The change in thickness has to be calculated for each horizon
above the parent horizon and then summed to determine total subsidence. Using equation 10
for the Oa3 horizon:
Tpm = Ts x (DsRs) / (DpmRpm)
Tpm = 20 cm x ( 0.45 g cm-3 x 9.96) / (0.45 g cm-3 x 5.84)
Ss = 34.1 cm – 20 cm = 14.1 cm
This gives us 14.1 cm of secondary subsidence in the Oa3 horizon. This was repeated for the
Oa2 and Oa1 horizons, using the same parent material. The change in depth for Oa1 is 44 cm
and 30 cm for Oa2 for a total amount of secondary subsidence of 74 cm. To obtain the rate
of secondary subsidence, the amount of secondary subsidence was divided by the amount of
time since drainage started. This sampling area has been drained for 30 years for an average
secondary subsidence rate of 2.9 cm year-1.
This method did not work for locations in which the lowest amount of sand was in the
surface horizon. This resulted in negative values of subsidence, which meant that there was
an accumulation of material. Also, if sand content in soil horizons (Rs) was more than three
times the sand contents in the parent horizons (Rpm), it was assumed that the soil horizon was
fill material and therefore that soil horizon was not used in the calculations. In addition to
using total sand for the secondary subsidence calculations, the coarse and fine fractions of
sand were evaluated, and we found that using total sand gave an estimate that was in between
the two sand fractions.
66

Sampling Locations and Laboratory Analysis
Juniper bay is a 256 ha Carolina bay southeast of Lumberton, North Carolina that was
drained and placed into agricultural production (34o30’30”N 79o01’30”E). The Robeson
County soil survey (McCachren, 1978) showed that approximately 60% of the Juniper Bay
consisted of organic soils that were classified as members of the Ponzer series (Loamy,
mixed, dysic, thermic Terric Haplosaprists). Organic soil layers in these soils range from 40
to 130 cm. Undrained organic horizons have a massive soil structure, but develop subangular
blocky or granular structure following drainage (official series description). Plant
communities believed to have been present in Juniper Bay included a Nonriverine swamp
forest, High pocosin, and Peatland Atlantic White Cedar forest communities as described by
Schafale and Weakly (1990).
Aerial photographs and interviews with previous landowners were used to establish
the drainage history of Juniper Bay. Approximately one third was drained in 1971, another
third drained in 1981, and the last third drained in 1986. Drainage ditches were dug to depths
of 1m in most of the Bay, but these fed into larger ditches that extended to depths of
approximately 4 m. Field “cuts” were the land areas surrounded by ditches on all sides,
which were used for agriculture. At selected field cuts, paired sampling points, one at the
crest and one near a ditch, were placed at locations determined by an equilateral triangle grid
randomly placed across the site. Pits were dug to a depth of approximately 1 m using a
backhoe. In each pit, the soil profile was described to determine depth, color, and structure
of major soil horizons. Uhland cores were taken from each horizon to determine bulk
density. Bulk samples were taken from each horizon described in the profile. Total organic
carbon was determined through dry combustion with a Perkin-Elmer PE2400 CHN
67
Elemental Analyzer (Culmo, 1988). Particle size was determined at the University of
Georgia, Soil Analysis Lab in Athens, GA., with the pipette method on a 10 g sample, and
sand size by sieving. Samples were prepared for particle size analysis by first oxidizing the
organic matter with concentrated (30%) hydrogen peroxide. The amount of mineral material
in the initial 10 g sample was determined with an additional 10 g sample that was placed in a
muffle furnace at 400oC for 24 hours to remove organic matter, leaving the mineral material.
Percent sand from the total sample was calculated by multiplying the percent sand from the
particle size analysis by the mass of the mineral material and then dividing by the mass of the
original sample.
Three natural undrained Carolina bays in Bladen County, North Carolina, Tatum
Millpond Bay (34o43’00”N 78o33’00”E), Charlie Long Millpond Bay (34o46’00”N
78o33’30”E), and Causeway Bay (34o39’45”N 78o25’45”E), were selected for comparison.
These natural bays had 60-100% of organic soils that are classified as a Pamlico series
(Sandy or sandy-skeletal, siliceous, dysic, thermic Terric Medisaprists) (Leab, 1990). These
soils have organic material 40 to 130 cm thick and are underlain by sand. Plant communities
found in these bays were Pond Pine Woodland, Non-riverine Swamp Forest, Bay Forest, and
High Pocosin, as described by Schafale and Weakly (1990).
Trails were cut through dense vegetation into the natural bays to reach sampling
locations. Soil profiles at four locations in the organic soils of each bay were described using
a McCauley peat sampler. Bulk samples were taken from each horizon for carbon and
particle size analysis. Bulk density was determined by taking a 10 cm undisturbed sample
with the McCauley peat sampler.
68

RESULTS AND DISCUSSION
Figure 3.6 shows the locations of all sampling locations, and those that are organic, in
Juniper Bay. The organic soils from Juniper Bay and the natural bays are classified as Terric
Haplosaprist with <40 cm organic material. Typical profile descriptions are shown in Table
3.2, and selected physical and chemical properties are shown in Table 3.3. The undrained
organic soils had a surface Oi and Oe horizon that was 50 cm thick, while these horizons
were absent in the drained Carolina bay. The Oa horizons in the undrained bay had massive
structure, while the drained Carolina bay had strong granular structure in the surface Oap
horizon as a result of tillage and dessication. In some sites, very coarse prismatic to
subangular blocky structure had developed. The Oa horizons in the drained bay were very
dark brown (10YR 2/2) sapric muck compared to the black (10YR 2/1) sapric muck of the
undrained bays. The organic horizons were thicker, 170 cm, in the undrained bay, compared
to 52 cm in the drained bay. Bulk density and sand content were two to three times higher in
the organic horizons of the drained bay. The difference in bulk density and changes in
structure between the drained and undrained bays demonstrated primary subsidence. The
amount of sand in the organic soils of the drained bay was higher at the surface and
decreased with depth, while the amount of sand in the Oa horizons of the undrained bay
relatively constant. This trend in sand is what we expected to see in areas where secondary
subsidence occurred. Not all organic soil locations were used, specifically if the lowest sand
percentage was in the surface horizon or if there was no Oa horizon that could be used as
parent material. The locations that were chosen are in Table 3.4. Since the initial study on
Juniper Bay was not designed for determining subsidence of organic soils, we were unable to
69

develop a statistical analysis. Therefore, data consists of actual calculated estimates and
averages.
Total subsidence varied among locations (Table 3.4) and with time since drainage.
Averages of the total subsidence values across the three time periods show that the organic
soils subsided approximately 80 cm. Subsidence in the fields drained for 15 years is slightly
less, 75.0 cm, than for fields drained for 20 or 30 years, 76.6 cm and 86.4 cm, respectively.
This trend of total subsidence indicates that the longer a site is drained, the greater the
amount of subsidence.
Estimated rates of primary and secondary subsidence vary across locations (Table
3.4). The average rate of primary subsidence is 3.9 cm yr-1. Primary subsidence rates were
lowest in the areas drained for 15 years, 3.4 cm yr-1, and were highest in the areas drained for
20 years 4.3 cm yr-1. This is probably because the water table in the area drained 15 years
ago is closer to the surface than in the other areas, maintaining buoyancy over more of the
profile. Shih et al. (1998), showed that the rate of subsidence in the Everglades Agricultural
Area has decreased from 2.5 to 3.0 cm yr-1 during the years 1913 to 1978, to 1.45 cm yr-1
during the years 1978 to 1997 as a result of better water management which raised the water
table to slow decomposition. The average rate of secondary subsidence was approximately
2.0 cm yr-1 (Table 3.4). Secondary subsidence rates were highest after 15 years of drainage,
2.8 cm yr-1, and similar after 20 and 30 years of drainage, 1.7 and 1.5 cm yr-1 respectively.
These estimates of subsidence and subsidence rate are relatively consistent with other
reported subsidence rates. Stephens (1956) reported a subsidence rate of 4.3 cm yr-1 over a
50-year period in Florida, Ireyresr (1963) reported a rate of 1.5 cm yr-1 over a 100-year
period in England, and Jongedyk et al., (1950) reported a rate of 1.5 cm over 6 years in
70

Indiana. These calculated values are also similar to those found by Tant (1979) in North
Carolina. A yearly loss of 1.2 cm was found on a Belhaven muck and 0.38 cm on a Pungo
muck. Average annual subsidence in Quebec was 2.1 ± 0.4 cm yr-1 over 38 years (Millette,
1976), and subsidence in New Orleans ranges from 1 to 5 cm yr-1 (Slusher et al., 1974).
The proportion that primary subsidence comprised of the total subsidence varied
widely (Table 3.4), but overall the average proportion of primary and secondary were
approximately equal. The largest variations occurred in the area drained for 30 years where
primary subsidence accounted for between 13 and 85% of total subsidence. This result was
unexpected because it was thought that secondary subsidence was a slower process. Previous
landowners indicated, however, that fire was used in the clearing process to remove tree
debris during the clearing operation, and charcoal was found in soil profiles at Juniper Bay
(Table 3.2). Fires also occurred naturally through lightning strikes. If a site burned shortly
after drainage ditches were installed, it is possible that loss through secondary subsidence
would exceed that of primary subsidence. Loss of the organic material through burning
would concentrate sand, and also lessen the weight of the material compressing the parent
material. This would keep the bulk density of the parent material low. Several studies have
shown that subsidence tends to decrease with increasing distance from a ditch (Burke, 1963;
Brandof, 1992), however, our estimates neither verified or contradicted their findings when
comparisons were made between ditch and crest locations.
The results did not show greater subsidence near ditches as had been expected. There
is a wide range of estimates for primary and secondary subsidence. This could be due to the
ditches being shallow in most of the site. The land clearing process is also complex and
involves the use of fire, ditch construction and maintenance, and crowning of fields.
71

Considering the variety of operations that are used to prepare and maintain the land in
agriculture it is not surprising that we are unable to see a clear effect of the ditches on
subsidence rates.
SUMMARY AND IMPLICATIONS
We realize that these values are estimates and that some assumptions may not hold
for other sites. Some sample locations near ditches could have had the organic materials
contaminated by ditch maintenance operations which brought subsurface material to the
surface leading to increased sand at the surface which would result in increased estimates of
secondary subsidence. Our assumption of constant sand deposition could be incorrect.
Estimates for subsidence rates might be off because fires that have been known to occur may
have resulted in most of the subsidence occurring during one event. However, we feel that
for estimating secondary subsidence when there is no initial measurement of elevation, the
assumptions are valid, and the data useful.
For the Carolina bay restoration project in question, if the drainage ditches were filled
in the water table will rise to near the original surface of these organic soils. Our estimate is
that the water would rise approximately 80 cm above the existing surface. The mineral soils
around the edge of the Carolina bay are higher than the organic soils by approximately this
amount. If all the ditches were plugged at the same time, the Carolina bay would probably
develop a pond over the existing organic soils. This would probably prevent the re-
establishment of the original vegetation.
Future studies that evaluate subsidence by these methods should include: a
comprehensive sampling scheme for statistical analysis; detailed sampling of the soil profile
at 15 cm depth intervals; and an improved method for measuring bulk density from
72

undrained sites. A thorough evaluation of the assumptions regarding uniform sand
distribution and the bulk density changes during subsidence needs to be done prior to
computing subsidence. It is beneficial to use reference sites that show little disturbance,
other than that associated with drainage and clearing, so that errors associated with additions
of mineral material to the surface could be minimized or avoided. Future work might also
include computing subsidence by estimating secondary subsidence first and then using that
data to estimate primary subsidence.
73

REFERENCES
Brandof, K.L. 1992. Impact of ditching and road construction on Red Lake Peatland.
p. 163-172. In H.E. Wright, Jr., B.A. Coffin, and N.E. Aaseng (ed.) The Patterned
Peatlands of Minnesota. Univ. of Minnesota Press, Minneapolis.
Brewer, R. 1976. Fabric and Mineral Analysis of Soils. p. 63-87. Robert E. Krieger
Publishing Company; Huntington NY.
Brooks, J.E., and E.F. Lowe. 1984. U.S. EPA clean lakes program, phase I. Diagnostic
feasibility study of the Upper St. Johns River Chain of Lakes. Vol. II-feasibility
study. Technical Publications SJ 84-15, St. Johns River Water Management District,
Palatka, Florida.
Buol, S.W., R.J. Southard, R.C. Graham, P.A. McDaniel. 2003. Soil Genesis and
Classification 5th ed. Iowa State Press. Ames, Iowa.
Burke, W. 1963. Drainage of blanket peat at Glenamory. p. 809-817. In Proceedings of the
Second International Peat Congress, Leningrad, USSR.
Culmo, R.F. 1988. Principle of Operation – The Perkin-Elmer PE 2400 CHN Elemental
Analyzer. Perkin Elmer Corp. Norwalk, CT.
Dolman, J.D., and S.W. Buol. 1967. A Study of Organic Soils (Histosols) In the Tidewater
Region of North Carolina. North Carolina Ag. Ex. St. Tech. Bull. No. 181.
Everett, K.R. 1983. Histosols. p. 1-53. In L.P. Wilding, N.E. Smeck and G.F. Hall (eds.)
Pedogensis and Soil Taxonomy II. The Soil Orders. Elsevier, Amsterdam.
74

Fennema, R.J., C.J. Neidrauer, R.A. Johnson, W.A. Perkins, and T.K. MacVicar. 1994. A
computer model to simulate natural Everglades hydrology. In Davis, S.M., and J.C.
Ogden (eds.), Everglades: The Ecosystem and its Restoration. St. Lucie Press, Delray
Beach, Florida.
Glaz, B. 1995. Research seeking agricultural and ecological benefits in the Everglades. J.
Soil Water Conserv. 50:609-613.
Ireyresr, 1963. Vegetation and Soils, A World Picture. p. 324. Aldine, Chicago.
Jongedyk, H.A., Hickok, R.B., Mayer, I.D. and N.K. Ellis, 1950. Subsidence of muck soils
in northern Indiana. Purdue Univ. Agric., Exp. Sta., Spec. Circ., 366:1-10.
Leab, R.J. 1990. Soil Survey of Bladen County North Carolina. USDA-SCS. Washington
D.C.
Lee, G.B. and B. Manoch. 1974. Macromorphology and Micromorphology of a Wisconsin
Saprist. p.47-62 In M. Stelly and R.C. Dinauer (eds.) Histosols Their Characteristics,
Classification and Use. SSSA pub 6. Soil Sci. Soc. Am. Madison, Wisconsin.
Levesque, M. P. and S.P. Mathur. 1984. The effect of using copper for mitigation Histosol
subsidence on : 3. The yield and nutrition of minicarrots, carrots, and onions grown in
Histosols, mineral sublayers, and their mixtures. Soil Sci. 138:127-137.
Lilly, J.P., 1981. The Blackland Soils of North Carolina: Their Characteristics and
Management for Agriculture. p.27-33. North Carolina Ag. Res. Tech Bul. No. 270.
Mathur, S.P., M.P. Levesque, and P.J.H. Richard. 1982. The establishment of synchrony
between subsurface layers and estimation of overall subsidence of cultivated organic
soils by a palynological method. Can. J. Soil Sci. 62:427-431.
75

McCachren, C.M. 1978. Soil Survey of Robeson County North Carolina. USDA-SCS.
Washington D.C.
Millette, J.A. 1976. Subsidence of an organic soil in southwestern Québec. Can. J. Soil. Sci.
56:499-500.
Pons, L.J. and I.S. Zonneveld. 1965. Soil Ripening and Soil Classification Initial Soil
Formation in Alluvial Deposits and a Classification of the Resulting Soils.
International Institute for Land Reclamation and Improvement pub 13. H.Veenman
& Zonen N.V. Wageningen, Netherlands.
Schafale, M.P. and A.S. Weakley. 1990. Classification of the Natural Communities of
North Carolina: Third Approximation. p. 205-217. North Carolina Natural Heritage
Program, Division of Parks and Recreation, Department of Environment, Health and
Natural Resources. Raleigh, NC.
Shih, S.F., B. Glaz, and R.E. Barnes, Jr. 1998. Subsidence of organic soils in the Everglades
Agricultural Area during the past 19 years. Soil and Crop Sci. Soc. Florida.
57:20-29.
Slusher, D.F., W.L. Cockerham, and S.D. Matthews. 1974. Mapping and interpretation of
Histosols and Hydraquents for urban development. p. 95-109. In A.R. Aandalh, S.W.
Buol, D.E. Hill, and H.H. Bailey (eds.) Histosols; Their Characteristics,
Classification, and Use. SSSA Special Pub 6. Soil Sci. Soc. Am. Inc., Madison, WI.
Stephens, J.C. 1956. Subsidence of organic soils in the Florida Everglades. Soil Sci. Soc.
Am. Proc. 20:77-80.
Tant, P. 1979. Subsidence of organic soils. Soil Sci. Soc. N.C. Proc. 22:75-80.
76

Table 3.1. Values for sample subsidence calculations. Bulk density from Oa4 is used for
estimating primary subsidence because it is the lowest. Horizon Oa4 is used as the parent
material in estimating secondary subsidence because of the lowest % sand. All other
horizons have a concentration of sand that could be attributed to secondary subsidence.
Horizon
Horizon Thickness
Bulk Density
Sand
Change in horizon thickness
(cm) (g cm-1) (%total sample) (cm)
Oa1 10 0.75 18.7 43.6 Oa2 10 0.75 13.9 12.7 Oa3 20 0.45 10.0 14.1 Oa4 26 0.45 5.8 0 (parent material)
77

Table 3.2. Typical profile from an organic soil at an undrained natural Carolina bay and
from a drained Carolina bay.
Horizon Depth Description cm
Undrained
Oi 0-20 Black (10YR 2/1) fibric to hemic material; massive structure; gradual boundary; root and debris mat.
Oe 20-50 Very dark brown (7.5 YR 2.5/2) hemic material; massive structure; gradual boundary; organic bodies 0.5-1 cm; many roots and debris.
Oa1 50-82 Very dark brown (10YR 2/2) sapric material; massive structure; clear boundary; common large pieces of wood debris.
Oa2 82-107 Black (10YR 2/1) sapric material; massive structure; gradual boundary; few large pieces of wood debris.
Oa3 107-145 Black (10YR 2/1) sapric material; massive structure; gradual boundary.
OC 145-170 Black (10YR 2/1) sapric muck with <2% sand grains; massive structure; abrupt boundary.
C 170-190 Very dark brown (10 YR 2/2) sand; single grain structure.
Drained
Oap 0-11 Black (N 2.5/0) sapric material; strong medium (2mm) granular structure; abrupt boundary.
Oa1 11-31 Very dark brown (10YR 2/2) sapric material with 10% wood fragments and 10% charcoal; massive structure; diffuse boundary.
Oa2 31-52 Very dark brown (10YR 2/2) sapric material with 10% wood fragments and 10% charcoal; massive structure; abrupt boundary.
Bw 52-61 Dark reddish brown (5YR 3/3) sandy loam; moderate coarse (5cm) prismatic structure; abrupt boundary.
BC 61-78 Yellowish brown (10YR 5/4) loamy sand with 40% white (2.5Y 8/1) sand in areas 1mm in diameter; there was 10% wood fragments; massive structure; clear boundary.
78

Table 3.2 continued
C1 78-100 Light yellowish brown (10YR 6/4) loamy sand with 5% wood Fragments; massive structure; clear boundary.
C2 100+ Dark gray (10YR 4/1) loamy sand; single grain structure. reaction to alpha, alpha; dense.
79

Table 3.3. Particle size, organic carbon, and bulk density of typical profiles from Juniper
bay and undrained natural bays.
Horizon Depth OC BD Sand Silt Clay
(cm) (%) g cm-3 ----------(%)----------
Drained
Oap 0-11 26.25 0.76 34.2 14.3 10.3
Oa1 12-31 52.52 0.47 16.7 22.9 7.3
Oa2 32-52 27.91 0.47 41.1 18.1 7.8
Bw 53-61 5.46 0.93 74.0 8.5 9.6
BC 62-78 0.48 1.55 93.1 1.8 4.3
C1 79-100 0.26 1.55 91.3 2.5 5.9
C2 101-110 0.32 --- 91.9 1.7 5.9
Undrained
Oi 0-20 41.25 --- --- --- ---
Oe 21-50 37.37 --- --- --- ---
Oa1 51-82 42.28 0.18 6.8 11.5 9.0
Oa2 83-107 34.74 0.21 14.0 17.3 10.0
Oa3 108-145 34.56 0.19 14.2 29.9 10.3
OC 146-170 16.35 0.49 46.1 20.4 6.8
C 190 --- 0.87 78.7 12.1 1.7
80

Table 3.4. Estimated secondary subsidence from selected locations. The C or D in the
sample location indicates if the sampling pit was at the crest (C) or near the ditch (D). Rate
for secondary subsidence was calculated by dividing the amount of subsidence by the years
of drainage. Primary subsidence rate was estimated by dividing the amount of subsidence by
10 years.
Primary subsidence
Secondary subsidence
Total subsidence Plot Location
Amount Rate Amount Rate Absolute Primary Secondary
(cm) (cm/yr) (cm) (cm/yr) (cm) ------ (%) -----
15 Years After Drainage
66D* 13.9 1.4 42.3 2.8 56.2 25 75 68D 26.8 2.7 55.0 3.7 81.8 33 67 8D 60.2 6.0 26.8 1.8 87.0 69 31 Av. 33.6 3.4 41.4 2.8 75.0 42 58
20 Years After Drainage
10C* 24.4 2.4 50.0 2.5 74.4 32 68 16C 45.8 4.5 25.3 1.3 71.1 65 35 16D 54.3 5.4 45.2 2.3 99.5 54 46 6C* 72.0 7.2 23.6 1.2 95.6 75 25 11C 20.4 2.0 21.8 1.1 42.2 48 52 Av. 43.4 4.3 33.2 1.7 76.6 57 43
30 Years After Drainage
2D 33.6 3.3 6.2 0.2 39.8 84 16 4D 61.4 6.1 8.3 0.3 69.7 87 13 5C 52.8 5.2 85.9 2.8 138.7 43 57 5D 14.4 1.4 82.9 2.8 97.3 15 85 Av. 40.6 4.0 45.8 1.5 86.4 47 53
* Did not include surface horizons that had greater that three times Rpm in the calculation of
secondary subsidence.
81

Time
Surf
ace
Ele
vatio
n Drainage Begins
Primary subsidence: lossof buoyant force
Secondary subsidence: lossby oxidation and shrinkage
Original soil surface elevation
Fig. 3.1. Illustration of the hypothetical effects of subsidence on the decrease in elevation of an organic soil following drainage. Primary subsidence occurs quickly due to loss of water through drainage. Secondary subsidence is a slower process.
82

Fig. 3.2. Example of a soil profile consisting of organic soil material over mineral material. The Oap horizon is tilled and undergoes the most oxidation. The Oa horizon showed little influence of oxidation and was used as the parent material for the Oap horizon. The mineral material was not considered in the calculations.
Oap
Oa
Cg
Horizon has stronggranular structure andhigh sand concentration
Horizon has massive structure,and low sand concentration.Oap formed from this material.
Mineral soil material notrelated to overlying horizons

Fig. 3.3. Illustration of how primary subsidence reduces volume while the mass remains the same in an organic soil horizon following loss of buoyant forces. Vo is the volume of soil having a unit cross-section before primary subsidence occurs. Vps is the volume of soil after primary subsidence, which also has a unit cross-sectional area. It is assumed that subsidence has only altered soil volume in the vertical direction.
Sand grain
Volume of an organic layer before drainage
Volume after lossof buoyant forces
Vps
Vo
Sand grain
Volume of an organic layer after drainage but before secondary subsidence
Volume after lossdue to oxidization
Vpm ≅ Vps
Vps Vs
Fig. 3.4. Illustration of how secondary subsidence due to oxidization reduces volume while also increasing the mass in the surface layers by concentrating the sand. Vps is the volume of soil after primary subsidence but before secondary subsidence. Vpm is the volume of parent material that has not undergone secondary subsidence and is approximately equal to Vps. Vs is the volume of soil that has undergone secondary subsidence. It is assumed that all volumes have a unit cross-sectional area and changes in volume occur in the vertical direction.
85

Width (Wpm)
Thickness(Tpm)
Width (Ws)
Thickness(Ts)
Cracks formed byshrinkage
Wpm=WsTpm>Ts
Undrained Organic Soil(Parent Material)
Drained Organic Soil
Fig 3.5. When a soil mass shrinks it appears that the shrinkage occurs in all dimensions. However in the horizontal dimension the shrinkage creates voids, and these are part of the soils volume. As a result, the soil’s cross-sectional area is assumed to remain constant throughout the weathering process, with changes occurring in the vertical dimension.
86

# Soilpits.shp# Justinjuly83m.shp
Ditches.shp
200 0 200 400 600 800 1000 Meters
N
##
##
##
##
##
##
##
##
#
##
##
##
##
##
#####
##
##
#
##
##
##
##
##
68*65*
67*64
62
61*
66*
4*
2*63
3
1
16*
17
12 13
7
6*
11*
14
9*
5*
10*
#
8*
##
15*
Fig. 3.6. Pit locations at Juniper Bay. *Designates organic soils, all other pits are mineral soils.
87


![Study of land subsidence around the city of Shirazscientiairanica.sharif.edu/article_2167_b3bb54f3fcf13e2c...tectonic subsidence, and etc. [2]. Land subsidence, as a serious crisis,](https://static.fdocuments.net/doc/165x107/5f81603bf7f7323e190f6f7c/study-of-land-subsidence-around-the-city-of-s-tectonic-subsidence-and-etc.jpg)